DOI:10.32604/csse.2021.017536
| Computer Systems Science & Engineering DOI:10.32604/csse.2021.017536 | |
| Article |
Hybrid Sooty Tern Optimization and Differential Evolution for Feature Selection
1College of Information Engineering, Sanming University, Sanming, 365004, China
2College of Mechanical and Electrical Engineering, Northeast Forestry University, Harbin, 150040, China
3School of Engineering, Manukau Institute of Technology, Auckland, 2241, New Zealand
*Corresponding Author: Heming Jia. Email: jiaheminglucky99@126.com
Received: 02 February 2021; Accepted: 20 March 2021
Abstract: In this paper, a hybrid model based on sooty tern optimization algorithm (STOA) is proposed to optimize the parameters of the support vector machine (SVM) and identify the best feature sets simultaneously. Feature selection is an essential process of data preprocessing, and it aims to find the most relevant subset of features. In recent years, it has been applied in many practical domains of intelligent systems. The application of SVM in many fields has proved its effectiveness in classification tasks of various types. Its performance is mainly determined by the kernel type and its parameters. One of the most challenging process in machine learning is feature selection, intending to select effective and representative features. The main disadvantages of feature selection processes included in classical optimization algorithm are local optimal stagnation and slow convergence. Therefore, the hybrid model proposed in this paper merges the STOA and differential evolution (DE) to improve the search efficiency and convergence rate. A series of experiments are conducted on 12 datasets from the UCI repository to comprehensively and objectively evaluate the performance of the proposed method. The superiority of the proposed method is illustrated from different aspects, such as the classification accuracy, convergence performance, reduced feature dimensionality, standard deviation (STD), and computation time.
Keywords: sooty tern optimization algorithm; hybrid optimization; feature selection; support vector machine
Many data-driven solutions from the fields of data mining and machine learning have been proposed to tackle the vast and complex data. In the field of data science, the classification is an important yet challenging task since the data to be processed is becoming increasingly complex [1]. In 2019, K. Kaur et al. proposed a decision tree-based method to predict the failure, lead time and health degree of hard disk drives [2]. In 2020, Zhu et al. applied the improved naive Bayes algorithm to perform software defect prediction for within-/cross-project scenarios. Experimental results showed that the proposed method had the better predictive ability [3]. In the same year, Zhang et al. applied feature-weighted gradient decent k-nearest neighbor for selecting promising projects accurately [4]. Furthermore, a support vector machine was used to detect the number of wide-band signals by Zhen which leads to improved performance [5]. However, due to the variety and complexity of the data, the data classification tasks in various fields are still facing challenges. With the aim of efficient and accurate data processing, researchers have proposed various methods to incorporate feature selection to facilitate the classification tasks.
To better solve the problem of the combination of feature selection and classification methods, researchers introduced the optimization algorithms to optimize the kernel parameters of SVM. Chapelle et al. proposed the gradient descent method for parameter selection [6]. Yu et al. introduced a classification method based on two-side cross-domain collaborative filtering, which can better build a classification model in the target domain by inferring intrinsic users and features efficiently [7]. Meanwhile, in recent years, scholars have also begun to combine feature selection with optimization algorithms to improve classification accuracy and efficiency. Zhang et al. are the first to put forward the feature selection method using multi-objective particle swarm optimization, which shows high competitiveness compared with the traditional single objective feature selection [8]. Jia et al. combined the feature selection and spotted hyena optimization in 2019, which can improve the accuracy and reduce redundant data [9]. Baliarsingh et al. also applied the emperor penguin optimization (EPO) to the classification method in the same year to deal with the medical data, which considerably settled the complicated and challenging data problems in the same year [10]. Therefore, these studies inspire us to apply the practical optimization algorithms to feature selection for feature selection to further improve the classification accuracy.
On the other hand, the sooty tern optimization algorithm (STOA) mimics the behavior of sooty tern in nature. Since it was presented by Gaurav Dhiman et al. in 2019 [11], this method has been widely used in many fields, such as financial stress prediction, feature selection, signal processing, etc. The STOA algorithm still needs to be further improved to better deal with practical problems. Thus, the local search ability of the STOA algorithm should be focused on. Another excellent optimization method is differential evolution (DE) [12]. It can improve the search efficiency and maintain the population diversity while DE was introduced into other algorithms. Xiong et al. proposed a hybrid method named DE/WOA to extract the proper parameters of photovoltaic models [13]. Moreover, Jia et al. presented the model that combined GOA and DE for multilevel satellite image segmentation, which improved the speed and accuracy of image segmentation [14]. Therefore, it can be known that the DE algorithm was suitable for solving the problem of insufficient local search and local optimum entrapment in the traditional STOA algorithm.
The main contributions of this paper are as follows: Firstly, according to the concept of average fitness value, this paper proposes the STOA-DE algorithm, which provides stronger convergence ability and faster convergence speed compared with the traditional STOA algorithm; Secondly, the STOA-DE algorithm can be applied to SVM with the feature selection process to optimize the parameters of SVM and binary features simultaneously; Finally, the proposed model is verified on the classic UCI data sets in this paper. Furthermore, the empirical confirms that the proposed method can effectively identify the useful features, thus contributing to better classification accuracy. In other words, the STOA-DE algorithm has an advantage in completing the data classification and has a wide range of engineering applications.
A hybrid STOA algorithm with DE is described in detail in this section. Firstly, the STOA and DE algorithm are introduced. Then, the hybrid model is explained profoundly. Last, the proposed algorithm called STOA-DE is applied in the correlative domain.
2.1 Sooty Tern Optimization Algorithm
The STOA algorithm is inspired by the behavior of sooty tern in nature. It was firstly proposed by Gaurav Dhiman for industrial engineering problems [11]. Sooty terns are omnivorous and eat earthworms, insects, fish, and so on. Compared with other bionic optimization algorithms, the highlight of STOA is its exploration and exploitation.
2.1.1 Migration Behavior (Exploration)
Migrating behavior, the exploration part, is defined as the following three aspects:
• Collision avoidance:
Where
Where,
Where
• Converge towards the direction of the best neighbor:
The search agents move towards the best neighbor after collision avoidance.
where
Where
• Update towards the best search agent:
Finally, the search agents update their position toward the direction of the best sooty terns.
Where
2.1.2 Attacking Behavior (Exploitation)
During migration, sooty terns can adjust their speed and angle of attack. They increase their altitude by their wings. In the case of attacking the prey, their spiral behaviors are defined as follows [15]:
Where
As a simple but effective method, DE has attracted wide attention over the past few decades since it was proposed by Storn and Price in 1997 [12]. There are three steps in DE: mutation, crossover and selection. Scaling factor
The mutation operation is mathematically defined as follows:
where
After the mutation operation, the trial individual
Where
In the selection operation, the trial individual
Where
2.3 Hybrid Algorithm of STOA and DE (STOA-DE)
STOA is a meta-heuristic algorithm proposed in 2019, which has applied in many industrial fields. However, it still has some disadvantages, such as non-equalizing exploration-exploitation, slow convergence rate, and low population diversity. DE is a simple but powerful algorithm, which introduced into the STOA algorithm that can enhance the local search ability. Because the balance between exploration and exploitation is essential for any meta-heuristic algorithm, this paper combines the STOA and DE to improve the local search capability and search efficiency, and maintain population diversity in the later iteration. The hybrid model in this paper evaluates the average fitness value firstly, and the average fitness value represents the overall quality of the current objective solution. For the minimization problem if the fitness function value of the individual is less than the average fitness value, then the adjacent search area around the particle is promising. In other words, the hybrid model needs to strengthen the local search strategy. On the contrary, if the individual fitness function value is better than the average fitness value, the regional search strategy is not adopted [16].
The global optimization of STOA is used in the STOA-DE algorithm, which can improve obviously the search ability in an extensive range. At the same time, the advantages of the DE algorithm are combined in local convergence, which can reduce the possibility of optimal local trap and deepen the local search ability. After the combination, the balance between exploration and exploitation is improved. Then the accuracy of the algorithm and the convergence speed are improved, the convergence ability is enhanced, and the population diversity can be maintained in the later iteration.
Support vector machine (SVM) is a non-linear binary classifier developed by Vapnik [17]. Furthermore, it constructs a linear separation hyper-plane in a high-dimensional vector space. The model is defined as the largest interval classifier in the feature space, and then it is transformed into the solution of convex quadratic programming problems. Compared with other machine learning methods, SVM is widely used in supervised learning and classification because of its high computational efficiency and excellent application ability. And in the linearly separable data sets, SVM creates the optimal separation hyper-plane to classify the samples. It is supposed that the data set

Figure 1: SVM optimal hyper-plane diagram
Although the linear separation hyper-plane can achieve the optimal classification, in most cases, the data points belonging to different categories cannot be separated clearly, and the linear type will lead to a large number of wrong classifications. Therefore, it is necessary to map the original feature space to a higher dimensional space to find a hyper-plane that can correctly separate the data points. The kernel functions have several forms as follows [18]:
Where
3.2 Feature Selection and Binary Processing
Feature selection is a method to transform the high-dimensional data to low-dimensional data by finding the optimal feature subset from the initial feature space according to a specific criterion [19]. The evaluation criteria are mainly determined by the classification accuracy and the number of selected features. Furthermore, feature space generally includes three elements: relevant feature, irrelevant feature and redundant feature. According to the feature framework proposed by Dash in 1997 [20], feature selection mainly consists of generating feature subset, evaluating feature subset, stopping criterion and result verification. When the stop criterion is reached, the generation of the new feature subset will be stopped, and the optimal feature subset will be output at this time. Otherwise, the new feature subset will be generated until the stop criterion is reached. In this paper, the random search strategy is selected as the search strategy and the iterations are chosen as the stop criterion. In other words, the algorithm will stop when the iterations set in the experiment are reached.
The essence of feature selection is a binary optimization, so binary scheme should be set when we use the optimization algorithm to deal with the feature selection problem. Because the solution of feature selection is limited to
Where,
3.3 STOA-DE for Optimizing SVM and Feature Selection
The two parameters
In the traditional model, SVM firstly optimizes two parameters according to the exclusive features and then selects the features, which leads to that the key elements are not selected in the actual feature selection process. Thus, the data classification is not ideal. On the contrary, if the feature selection is carried out at first and then the parameters are optimized, the second optimization will be needed in each training process, which consumed too much time cost and is difficult to be applied to practical problems. Therefore, this paper proposed a method that combined parameters optimization and feature selection of SVM. The search dimensions are as follows: the cost

Figure 2: Schematic of search dimensions for each individual
As shown in Fig. 2, the two dimensions are used to search the cost
The proposed model in this paper optimized the two parameters of SVM and carried out the feature selection process simultaneously. It can ensure the accuracy of the selected features, avoid missing key components and reduce redundant features, thus improving the classification accuracy. Compared with the method of firstly selecting features, the way in this paper reduced the running time of the algorithm to a certain extent. Therefore, simultaneous feature selection and parameter optimization are more desirable. Meanwhile, the flow chart of the simultaneous optimization and feature selection based on the STOA-DE algorithm is as follows:

Figure 3: The flow chart of the proposed model
The 12 classic UCI data sets (including four high-dimensional data sets) are used to prove the effectiveness of the STOA-DE algorithm from the average classification accuracy, the average selection size, average fitness, standard deviation and average running time in this paper [21]. Meanwhile, in order to ensure the objectivity and comprehensiveness of the experiments, the other algorithms which have been applied in the feature selection field are selected for comparison in this paper. The detailed information about each data set is shown in Tab. 1.

In the experiments, the other six algorithms are selected as the comparison algorithm. The population size is set to 30. The number of runs is 30. The maximum of iterations is 100. All the experimental series are carried out on MATLAB R2014b, and the computer is configured as Intel(R) Core (TM) i5-5200U CPU @2.20GHz, using Microsoft Windows 8 system. Also, the parameter settings of other algorithms are shown in Tab. 2.

The following criteria are used to evaluate the performance of each optimization algorithm when it is run.
Average classification accuracy: Refers to the average classification accuracy of the data sets in the experiment. The higher the average classification accuracy, the better the classification effect. And the mathematical expression is as follows:
Where
Average selection size: Represents the average value of the selected features during the experiment. The fewer the selected features, the more pronounced the effect of removing the irrelevant and redundant features is. Thus, the formula is mathematically indicated as follows:
Where
Fitness function: The two main objectives of feature selection are classification accuracy and the selected features. The ideal result is that the selected features are less, and the classification accuracy is higher. Therefore, this paper evaluates the performance of the proposed algorithm on feature selection according to these two criteria. Meanwhile, the fitness function is represented as follows:
Where
Average fitness: Represents the average value obtained by repeated calculation of the algorithm in the experiment. The smaller the average fitness is, the better the ability of feature selection in balancing to enhance classification accuracy and reduce the selected features is. It can be expressed as:
Where
Statistical standard deviation (std): Means the stability of the optimization algorithm in the experiments. The smaller the standard deviation is, the better the stability is. Furthermore, it is shown as follows:
Average running time: Represents the average time spent in the whole experiment. As is known to all, the time cost is also significant in engineering practice, so the average running time is introduced to the evaluation criteria to evaluate the superiority of the proposed method better. And the calculation formula is as follows:
Where
4.3 Classical UCI Data Set Experiments
It can be seen from the experimental results of classification accuracy in Tab. 3, except for LSVT Voice, the STOA-DE algorithm has the best performance in classification accuracy and divides the data set accurately. Meanwhile, the figure shows that the whole classification accuracy of LSVT Voice is not good. In other words, this experiment is an accidental event and not representative. Furthermore, it can be noted that the proposed method in this paper achieves 100% classification accuracy in both the Tic-Tac-Toe and Divorce predictors, and obtains 99.73% in Detect Malacious. Therefore, it can be proved that the proposed method has competition in simultaneous feature selection and support vector machines.
Tab. 4 shows the average feature selection size during the experiment. According to the figure, it can be verified that the feature selection size is relatively small by using the proposed STOA-DE algorithm in most cases. Although the proposed algorithm did not obtain the optimal result in the Wine, Forest types and Dermatology, the STOA-DE algorithm was the most outstanding among the test of data sets larger than 100 dimensions. Therefore, compared with other algorithms, it can be found that the proposed model in this paper is superior in processing the data dimension reduction problem.


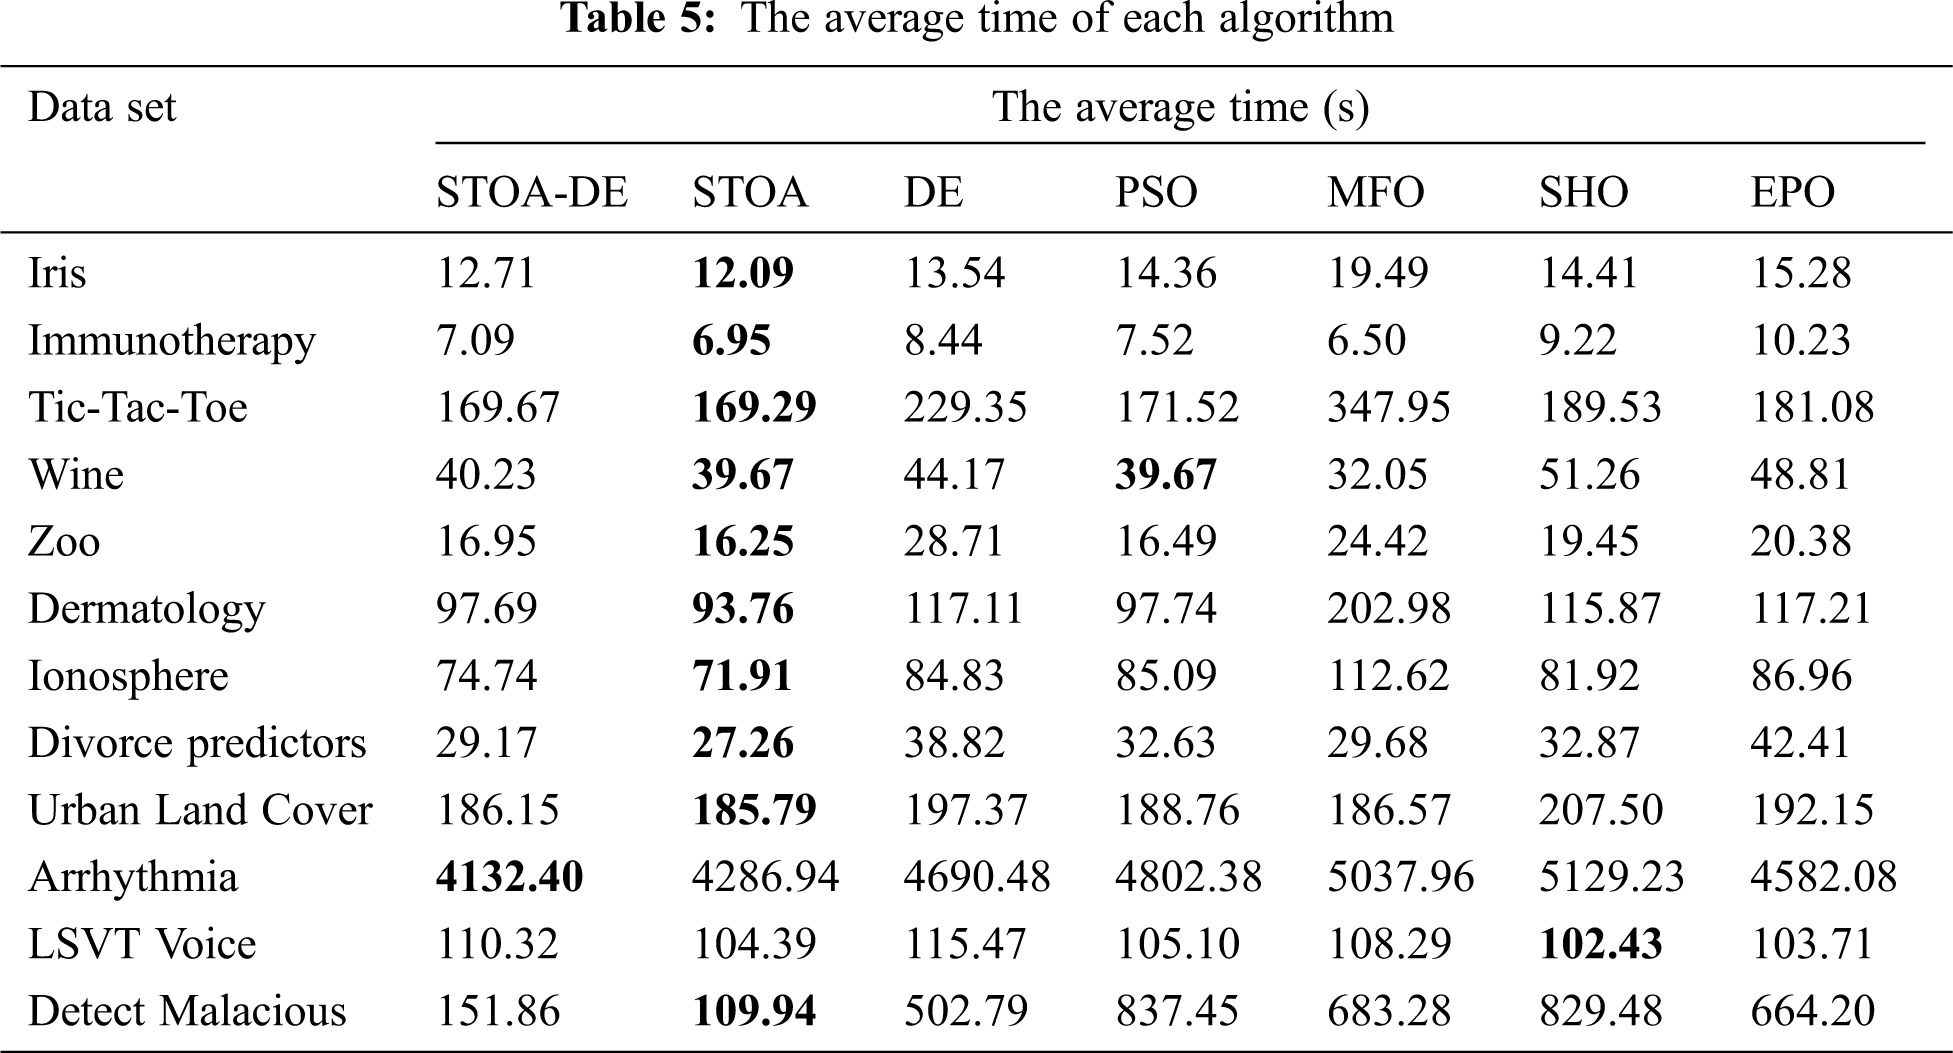
It can be found from Tab. 5 that the time advantage of the proposed algorithm is not very obvious because the proposed method is the hybrid of STOA and DE, so its time is slightly less than the traditional STOA algorithm. However, it can be seen that the proposed algorithm is still hopeful even though it is not the fastest. Because the STOA algorithm converges quickly and is easy to mature early, the running time of the hybrid model has improved compared with the traditional DE. At the same time, it can be noted that owing to the superiority of the STOA algorithm, the proposed STOA-DE algorithm still has time superiority compared with other algorithms in most cases. Therefore, the proposed model in this paper has potential.
Combined with the above mentioned average classification accuracy and the average selection size, the value of fitness function is evaluated in Fig. 4 and 5. It can be seen from the figures that the proposed algorithm has advantages in mean fitness value and standard deviation in different dimensions. Therefore, it can be proved that simultaneous feature selection and support vector machine parameters optimization based on the STOA-DE algorithm has excellent accuracy and excellent stability. Fig. 6 shows the convergence curve drawn from the fitness value of the last experiment in 30 runs, which completely expresses the convergence process of each data set. From these results, it can be found that no matter how the dimensions of data features are, the STOA-DE algorithm still shows faster convergence speed, higher convergence precision and more vital convergence ability. Therefore, the feasibility of the proposed method can be proved more clearly and accurately through experiments.

Figure 4: The average fitness of each algorithm

Figure 5: The standard deviation of fitness of each algorithm

Figure 6: The convergence curve of fitness of each algorithm
Aiming at the imbalanced exploration and exploitation and the low population diversity in the traditional STOA algorithm, the STOA-DE algorithm is proposed in this paper to improve the local search ability to obtain better solutions. Moreover, the combination of optimization algorithm with SVM and feature selection can optimize the two parameters of SVM and select feature simultaneously. The proposed method enhances the ability of data analysis and learning. Through the experiments of classic UCI data sets, it can be known that the optimal search ability of the proposed method has more advantages and can effectively complete the data classification work. For future research, we can further study the hybrid model of optimization algorithm to be better applied to the field of data preprocessing.
Acknowledgement: This research is based upon works supported by Grant 19YG02, Sanming University.
Funding Statement:Sanming University introduces high-level talents to start scientific research funding support project (20YG14, 20YG01), Guiding science and technology projects in Sanming City (2020-G-61, 2020-S-39), Educational research projects of young and middle-aged teachers in Fujian Province (JAT200618, JAT200638), Scientific research and development fund of Sanming University(B202009, B202029).
Conflicts of Interest:The authors declare that they have no conflicts of interest to report regarding the present study.
1. W. D. Jiang, T. A. Yang, G. Sun, Y. C. Li, Y. X. Tang et al., “The analysis of china’s integrity situation based on big data,” Journal on Big Data, vol. 1, no. 3, pp. 117–134, 2019. [Google Scholar]
2. K. Kaur and K. Kaur, “Failure prediction, lead time estimation and health degree assessment for hard disk drives using voting based decision trees,” Computers, Materials & Continua, vol. 60, no. 3, pp. 913–946, 2019. [Google Scholar]
3. K. Zhu, N. Zhang, S. Ying and X. Wang, “Within-project and cross-project software defect prediction based on improved transfer naive Bayes algorithm,” Computers, Materials & Continua, vol. 63, no. 2, pp. 891–910, 2020. [Google Scholar]
4. C. Zhang, J. Yao, G. Hu and T. Schøtt, “Applying feature-weighted gradient decent k-nearest neighbor to select promising projects for scientific funding,” Computers, Materials & Continua, vol. 64, no. 3, pp. 1741–1753, 2020. [Google Scholar]
5. J. Zhen, “Detection of number of wideband signals based on support vector machine,” Computers, Materials & Continua, vol. 62, no. 3, pp. 445–455, 2020. [Google Scholar]
6. O. Chapelle, V. Vapnik, O. Bousquet and S. Mukherjee, “Choosing multiple parameters for support vector machines,” Machine Learning, vol. 46, no. 1–3, pp. 131–159, 2002. [Google Scholar]
7. X. Yu, Y. Chu, F. Jiang, Y. Guo and D. W.Gong, “SVMs classification based two-side Cross domain collaborative filtering by inferring intrinsic user and item features,” Knowledge-Based Systems, vol. 141, no. 1, pp. 80–91, 2018. [Google Scholar]
8. Y. Zhang, D. W. Gong and J. Cheng, “Multi-objective particle swarm optimization approach for cost-based feature selection in classification,” IEEE/ACM Trans. on Computational Biology and Bioinformatics, vol. 14, no. 1, pp. 64–75, 2017. [Google Scholar]
9. H. M. Jia, J. D. Li, W. L. Song, X. X. Peng, C. B. Lang et al., “Spotted hyena optimization algorithm with simulated annealing for feature selection,” IEEE ACCESS, vol. 7, pp. 71943–71962, 2019. [Google Scholar]
10. S. K. Baliarsingh, W. Ding, S. Vipsita and S. Bakshi, “A memetic algorithm using emperor penguin and social engineering optimization for medical data classification,” Applied Soft Computing, vol. 85, no. 1, pp. 105773, 2019. [Google Scholar]
11. G. Dhiman and A. Kaur, “STOA: A bio-inspired based optimization algorithm for industrial engineering problems,” Engineering Applications of Artificial Intelligence, vol. 82, pp. 148–174, 2019. [Google Scholar]
12. R. Storn and K. Price, “Differential evolution—A simple and efficient heuristic for global optimization over continuous spaces,” Journal of Global Optimization, vol. 11, no. 4, pp. 341–359, 1997. [Google Scholar]
13. G. Xiong, J. Zhang, X. Yuan, D. Shi, Y. He et al., “He etal, Parameter extraction of solar photovoltaic models by means of a hybrid differential evolution with whale optimization algorithm,” Solar Energy, vol. 176, no. 4, pp. 742–761, 2018. [Google Scholar]
14. H. M. Jia, C. B. Lang, D. Oliva, W. L. Song and X. X. Peng, “Hybrid grasshopper optimization algorithm and differential evolution for multilevel satellite image segmentation,” Remote Sensing, vol. 11, no. 9, pp. 1134, 2019. [Google Scholar]
15. K. Tamura and K. Yasuda, “The spiral optimization algorithm: convergence conditions and settings,” IEEE Transactions on Systems, Man, and Cybernetics: Systems, vol. 50, no. 1, pp. 360–375, 2020. [Google Scholar]
16. H. M. Jia, Y. Li, C. B. Lang, X. X. Peng, K. J. Sun et al., “Hybrid grasshopper optimization algorithm and differential evolution for global optimization,” Journal of Intelligent & Fuzzy Systems, vol. 37, no. 5, pp. 1–12, 2019. [Google Scholar]
17. C. Cortes and V. Vapnik, “Support-vector networks,” Machine Learning, vol. 20, no. 3, pp. 273–297, 1995. [Google Scholar]
18. A. Ibrahim, M. A. Ala’, F. Hossam, A. H. Mohammad, M. Seyedali et al., “Simultaneous feature selection and support vector machine optimization using the grasshopper optimization algorithm,” Cognitive Computation, vol. 10, no. 3, pp. 478–495, 2018. [Google Scholar]
19. Z. L. Cai and W. Zhu, “Feature selection for multi-label classification using neighborhood preservation,” IEEE/CAA Journal of Automatica Sinica, vol. 5, no. 1, pp. 320–330, 2018. [Google Scholar]
20. M. Dash and H. Liu, “Feature selection for classificarion,” 1997. [Google Scholar]
21. C. Blake, “UCI repository of machine learning databases,” 2021. [Online]. Available: http://www.ics.uci.edu/?mlearn/MLRepository.html. [Google Scholar]
22. J. Liu, Z. Liu and Y. Xiong, “Method of Parameters Optimization in SVM based on PSO,” Trans. on Computer Science & Technology, vol. 2, no. 1, pp. 9–16, 2013. [Google Scholar]
23. S. Mirjalili, “Moth-flame optimization algorithm: A novel nature-inspired heuristic paradigm,” Knowledge-Based Systems, vol. 89, pp. 228–249, 2015. [Google Scholar]
24. E. Emary, H. M. Zawbaa and A. E. Hassanien, “Binary ant lion approaches for feature selection,” Neurocomputing, vol. 213, no. 6, pp. 54–65, 2016. [Google Scholar]
 | This work is licensed under a Creative Commons Attribution 4.0 International License, which permits unrestricted use, distribution, and reproduction in any medium, provided the original work is properly cited. |