DOI:10.32604/csse.2022.016730
| Computer Systems Science & Engineering DOI:10.32604/csse.2022.016730 | |
| Article |
Optimizing Traffic Signals in Smart Cities Based on Genetic Algorithm
Al-Zaytoonah University of Jordan, Faculty of Science and Information Technology, Amman, 11733, Jordan
*Corresponding Author: Nagham A. Al-Madi. Email: Nagham.a@zuj.edu.jo
Received: 10 January 2021; Accepted: 24 March 2021
Abstract: Current traffic signals in Jordan suffer from severe congestion due to many factors, such as the considerable increase in the number of vehicles and the use of fixed timers, which still control existing traffic signals. This condition affects travel demand on the streets of Jordan. This study aims to improve an intelligent road traffic management system (IRTMS) derived from the human community-based genetic algorithm (HCBGA) to mitigate traffic signal congestion in Amman, Jordan’s capital city. The parameters considered for IRTMS are total time and waiting time, and fixed timers are still used for control. By contrast, the enhanced system, called enhanced-IRTMS (E-IRTMS), considers additional important parameters, namely, the speed performance index (SPI), speed reduction index (SRI), road congestion index (Ri), and congestion period, to enhance IRTMS decision. A significant reduction in congestion period was measured using E-IRTMS, improving by 13% compared with that measured using IRTMS. Meanwhile, the IRTMS result surpasses that of the current traffic signal system by approximately 83%. This finding demonstrates that the E-IRTMS based on HCBGA and with unfixed timers achieves shorter congestion period in terms of SPI, SRI, and Ri compared with IRTMS.
Keywords: Genetic algorithm; traffic signal congestion; smart cities
The concept of a smart city started in the early 1990s with the introduction of emerging technologies [1], such as mobile phones, wireless networks, the Global Positioning System (GPS), and the Internet of things [2]. These technologies are also examples of the core principles of an intelligent city. They were introduced to companies and government agencies to improve quality of life and ensure the effective mobility of people and goods.
At present, the intention of researchers and scientists has progressed to finding the best localization methods for optimizing wireless sensor networks (WSNs) due to the rapid worldwide expansion of Internet applications to nearly all aspects of life, particularly in science and technology. In general, WSNs consist of a small group of low-cost sensor nodes that communicate with one another with certain memory, energy, and processing power constraints imposed in wireless form [3].
WSNs are similar to wireless ad hoc networks, which are characterized by networking and an automatic network structure that transmits sensor data in wireless form [4]. In real life, WSNs are distributors of self-sufficient sensors that are capable of tracking or monitoring physical or external conditions [5]. Data can be transferred to a significant location through an array of natural phenomena, such as temperature, sound, and pressure [6]. An example of a good layout for WSNs is presented in Fig. 1.
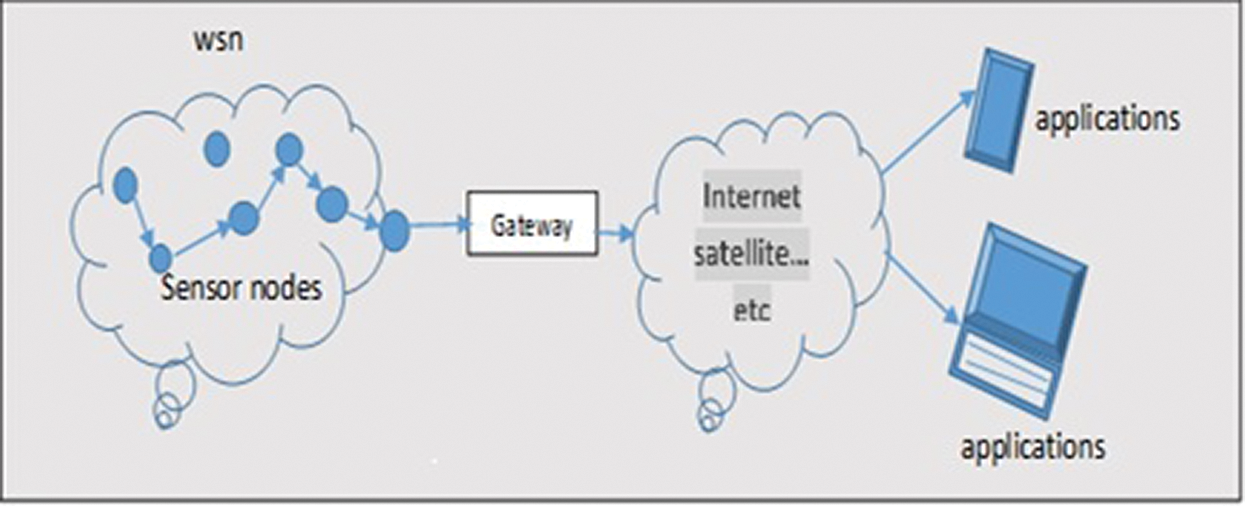
Figure 1: Example of a good layout for WSNs
Traffic signal congestion, which is a recent a global phenomenon, is a widespread problem that arises from high population density [7]. The number of vehicles has grown tremendously in recent years [8]. For example, the Bureau of Transportation Statistics registered more than 254 million passenger vehicles in the USA in 2017 [9]. The Hashemite Kingdom of Jordan suffers from the same problem, with the latest statistics showing that the number of registered vehicles reached more than 1.5 million in December 2017 [10].
Despite the availability of various applications for tracking traffic signals to minimize congestion and delays in road networks [11], none of these applications can respond to the challenges posed by traffic signaling in smart cities [12]. Thus, improving the condition of traffic signals requires additional effort to reduce travel time and traffic signal congestion [13]. These issues should be discussed comprehensively to resolve traffic signal congestion, particularly during peak times [14]. The current study improves an intelligent road traffic management system (IRTMS) [15] to reduce the congestion periods of traffic signals in Amman, the capital of Jordan.
The congestion of traffic signals is a major concern in transport networks [16]. Traffic congestion is a serious issue that affects the lives of thousands of people worldwide [17]. Many methods use real-time traffic information measured or obtained using video cameras to optimize break periods between traffic signals [18].
Several solutions have been proposed and applied to address the issue of traffic signal congestion [19]. Many of these solutions are based on complex control signals at a single intersection [20].
The congestion of smart cities is dependent on various factors [21], such as additional demands, signals, incidents, work sites, and weather events [22]. Two types of congestion typically exist. The first type is the recurrent congestion of traffic signals. This type may include traffic and capacity enclosure, insufficient transport services, traffic variances, and inadequate traffic control. The second type is nonrecurring traffic loads, including accidents, work sites, weather events, and other extraordinary occurrences [23].
Numerous congestion initiatives that consider various performance traffic parameters have been developed to calculate congestion degree [23]. Some of these traffic parameters are speed, delay, level of service, congestion indices, and federal congestion measures. These traffic parameters can vary from one country to another [24].
Many serious traffic accidents, fatalities, and injuries have been reported in Jordan as a result of the increase in the number of vehicles [24]. Jordan is one of the leading countries in the world in terms of traffic incidents [24]. Fixed timers are still used in existing traffic signal networks in Jordan. In particular, traffic problems and congestions are worsening on the streets of its capital, Amman. Drivers can get stuck in traffic for a long period [25]. As this problem worsens, serious measures must be implemented to address the underlying issues. The following parameters are considered in the current study.
The speed reduction index (SRI), which refers to the relative speed ratio, varies between congested and free-flow conditions. It is given by Eq. (1) [14].
SRI denotes the proportion of speed decreases from free flow conditions. In general, free-flow speed refers to the average speed during the off-peak period.
The SRI ratio is multiplied by 10 to keep the SRI value within the range of 0 to 10. Congestion occurs when the index value exceeds 4 to 5. Values less than 4 indicate a non-congested condition. This measure represents the ratio of decline in speed from free-flow conditions. It provides an approach for comparing congestion amount in different transportation facilities. This process is achieved using a continuous scale to differentiate among different congestion levels. Under peak conditions, an index can be applied to entire roads, entire metropolitan areas, or individual highway segments.
The speed performance index (SPI) assesses a smart city route and measures traffic conditions in intelligent cities. It is the ratio of vehicle speed to the maximum allowable speed as indicated in Eq. (2) [26].
where SPI indicates speed, vavg specifies the average speed of a journey, and vmax indicates the maximum allowable speed of a lane.
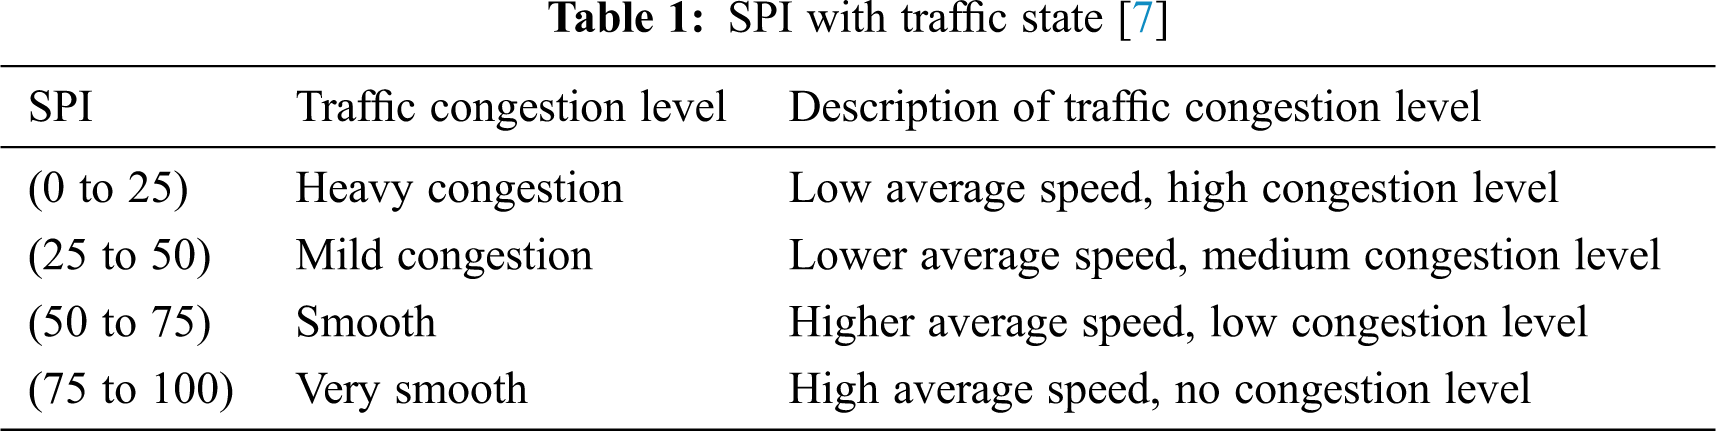
To quantify the degree of traffic congestion on the basis of this indicator, the level of traffic congestion can be defined as SPI values ranging from 0 to 100 [14] with three threshold values (25, 50, and 75). The criteria for urban traffic congestion classification are listed in Tab. 1.
Congestion indices have two categories: the road congestion index and the congestion index of a highway segment (Ri). Hnaif et al. [16] considered the congestion index for a road segment (Ri).
Traffic wherein SPI is above 50 is classified under non-congestion state. The value of Ri ranges from 0 to 1. The smaller the value of Ri, the more congested a road segment [26].
Congested hours reflect the average amount of time in designated road sections [27]. Speeds below 90% of the weekday free-flow rate are considered congested for a weekday (06:00 to 22:00). For example, when free-flow speed is 60 mph and most vehicles drive at an average of 54 mph, then the state is considered congested [24].
This section introduces recent studies on solving the traffic signal congestion problem.
The key objective of a traffic monitoring signal is the transition from competing sources of traffic with an acceptable output [14]. Various experiments have presented different results in reducing traffic signal congestion.
In Rao et al. [28], the authors compared the performance metrics with the main case and selected a simulation approach to test congestion mitigation policies and improvements. Five mitigation scenarios, namely, base cases, traffic control, high road building, bus transportation, and dedicated bus lanes, were developed. To measure these scenarios, traffic levels, average speed, network efficiency of individual connections, delayed travel, congestion index changes, and travel time were included in the selected performance metrics. The results suggested that traffic management option works better than other solutions.
In Gao et al. [29], the authors proposed a substantial reinforcement algorithm. This algorithm extracts all necessary characteristics from raw real-time traffic data (machine-created features) and identifies the ideal policy for adjustable signal control. The authors retrieved knowledge and targeted network stability mechanisms. The simulation result indicated that the longest queue algorithm and the fixed time control algorithm were reduced by up to 47% and 86%, respectively, compared with two common algorithms.
A survey on congestion initiatives in the field of road transport was conducted on a sustainable and resilient transport system [7]. Historical data sets for the daily and weekly traffic of current indicators were compared by implementing them on daily and weekly bases. The findings of this previous study indicated major improvements in congestion conditions and a related trend in congestion. The authors offered a positive insight into creating a sustainable and resilient traffic management system. In addition, they proposed an effective model for deepening the learning of traffic signal control. The approach was evaluated on large-scale real traffic data from sensors.
Hnaif et al. [15] introduced a smart road traffic management framework, called IRTMS, which was derived from the human community-based genetic algorithm (HCBGA). Total time and waiting time were shorter in IRTMS compared with those in the existing traffic system in Jordan.
A smart traffic light management system (TLBH) and a decision support system based on the Hamiltonian routing technique were developed in Hnaif et al. [16]. This previous research developed a system that minimizes waiting time for vehicle traffic signals, which, in turn, can reduce vehicle congestion.
Several scenarios were established. Three of these scenarios were implemented on MATLAB programming language and applied to the framework on the basis of particular rules. The simulation results showed substantive changes in TLBH relative to the existing traffic system on the basis of sufficient testing scenarios. Compared with the current traffic structure, the proposed methodology achieves minimum total time and waiting time in all the scenarios [25].
In Hanbali et al. [27], examples of current practices were presented to provide a consistent system of traffic signal installations in Jordan. Traffic signals and their indications should obtain the obedience of most, if not all of the drivers, as one of the results of implementing this uniform system. That is, drivers’ compliance with traffic signal controls is achieved; moreover, the uniform system will provide a solid basis for the sound and effective enforcement of traffic signal monitoring.
A simple system was proposed for Jordan to count the number of vehicles on each traffic signal intersection by using an infrared sensor and to consider the length of vehicles. The proposed system aims to provide statistics and obtain the number of vehicles and their directions on a traffic signal [30].
Current traffic signals in Jordan are insufficient for dealing with the issue of congestion at intersections because fixed timers are still used. Moreover, a road is divided into three lanes. This condition is inflexible, and it triggers traffic problems when it is combined with the use of fixed timers. Therefore, enhanced-IRTMS (E-IRTMS), is proposed in the current study to deal with the congestion of traffic signals in Amman, Jordan.
Various parameters have been used to calculate congestion level in accordance with the result requirements. E-IRTMS is improved by considering three major parameters: SRI, SPI, and Ri. The steps of E-IRTMS are described as follows.
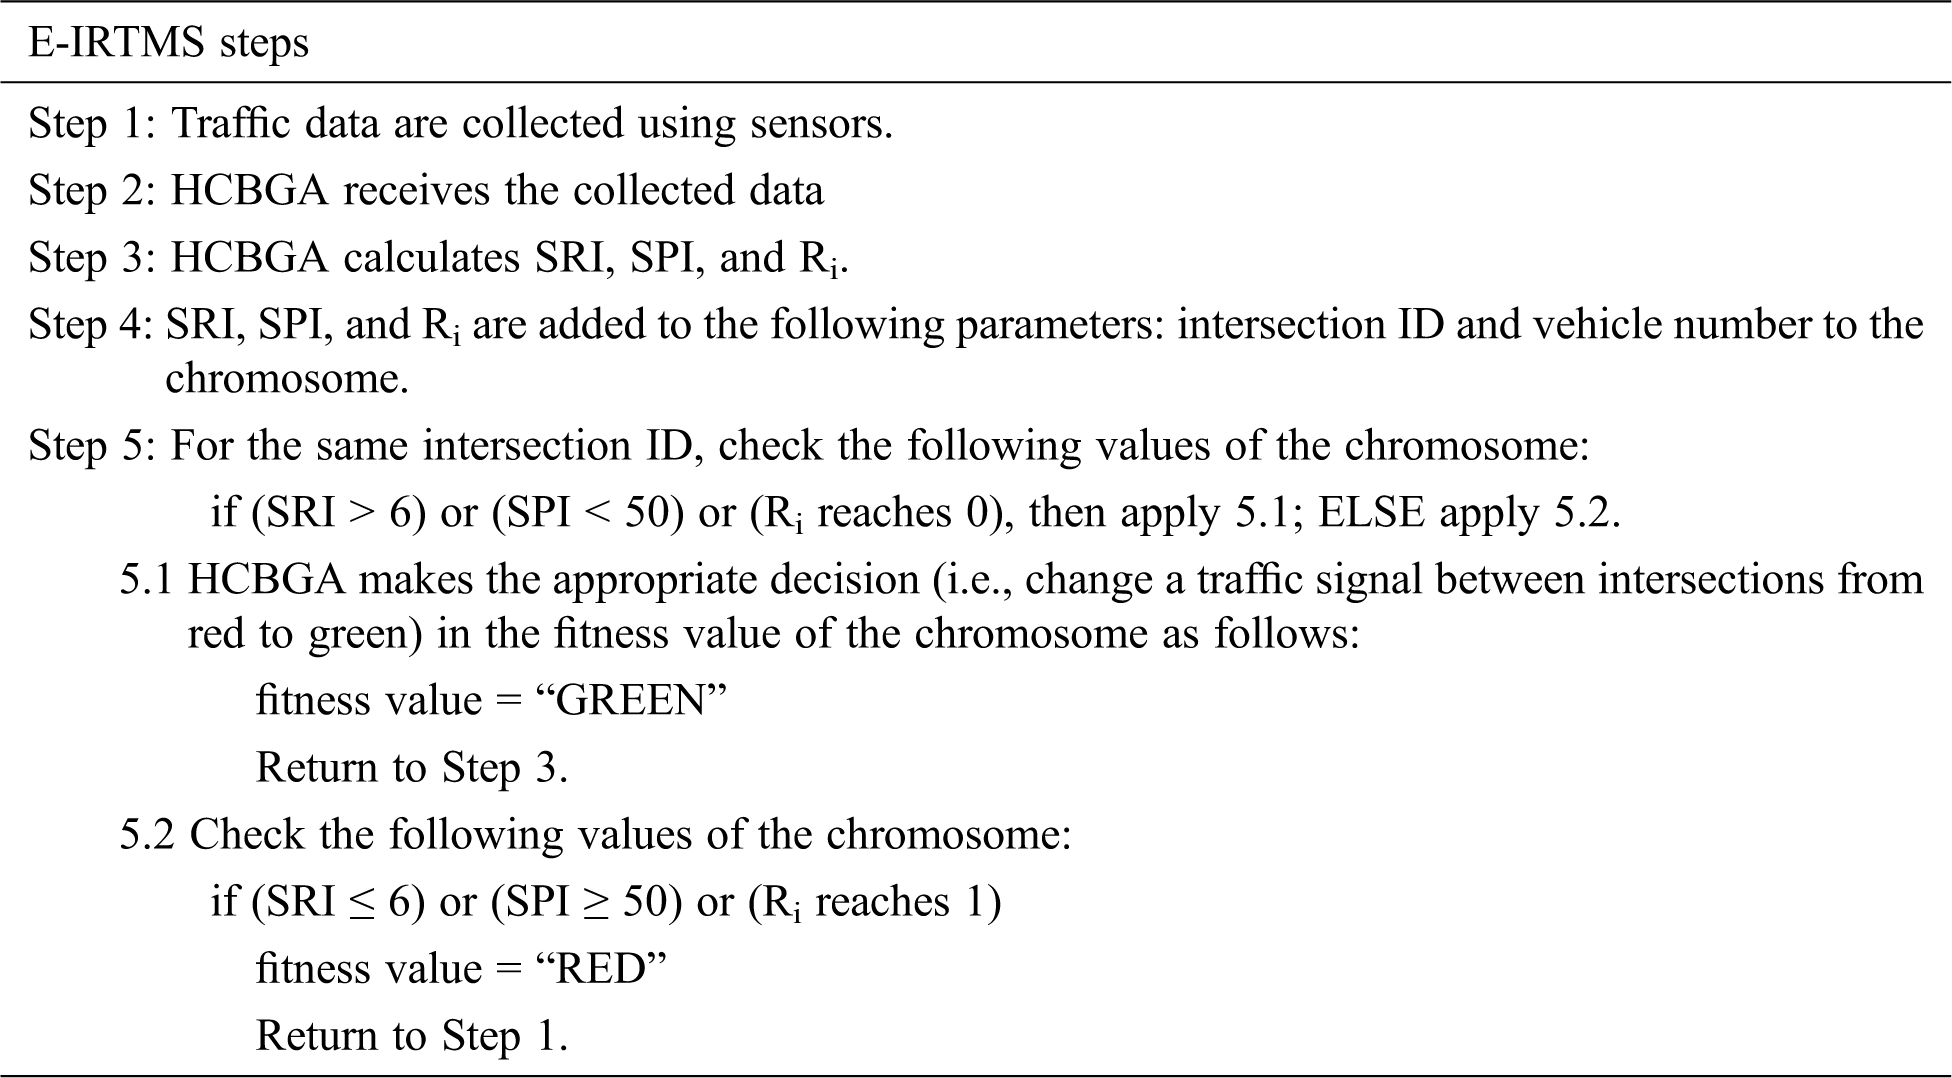
A sensor collects the following parameters at each intersection: intersection ID, number of vehicles, congestion time, average speed, and the time of each vehicle observed. The collected data for a traffic signal are forwarded to HCBGA, which accepts the input and measures SRI, SPI, and Ri.
Subsequently, the population’s chromosome initialization will begin. Each chromosome comprises an intersection ID, a vehicle number, SRI, SPI, Ri, and a measured individual fitness value.
Then, HCBGA changes a traffic signal between intersections from red to green on the basis of the previous criteria. If SRI > 6, SPI < 50, or Ri > 0, then a traffic signal intersection remains congested. Therefore, the decision is to keep this crossroad green until one of the previous constraints varies.
As previously stated, measures were evaluated using real-time traffic data sets to determine the robustness and accuracy of each measure in a traffic situation.
A congestion assessment that included SRI, SPI, and Ri was conducted. The current study observed and documented vehicles at the Al-Assaf traffic signal intersection/Khalda from December 1, 2020 to December 31, 2020.
To assess the efficiency of E-IRTMS, various tests were conducted in comparison with IRTMS to measure the processing time required to change the traffic light to green for vehicles.
The subsequent section presents the setting of the experiment of the proposed E-IRTMS and its implementation. All the experiments were performed on an HP laptop with Intel® Core™ i5 (2.40 GHz).
4 Experimental Results and Analysis
The genetic algorithm chooses the fittest (best) chromosome from a randomly generated population [31,32]. The most suitable option for moving between intersections from red to green is the best priority in accordance with traffic signal congestion. That is, HCBGA [33] determines the green period during which traffic signals are provided.
The representation of chromosomes includes intersection ID, SRI, SPI, traffic density, Ri, congestion time, and fitness value [34]. During off-peak hours, a driver generally takes only 2 min to cross the road [35]. In peak hours, however, a driver is estimated to require 4–5 min to travel the same road section depending on the congestion level [36–38]. Various comparisons were made to demonstrate the effect of the improved E-IRTMS on the reduction of road signals.
The SRI results for IRTMS and E-IRTMS are presented in Fig. 2. The SRI of E-IRTMS is better than that of IRTMS. The former is less than that of the latter, and thus, traffic congestion is less in E-IRTMS than in IRTMS.
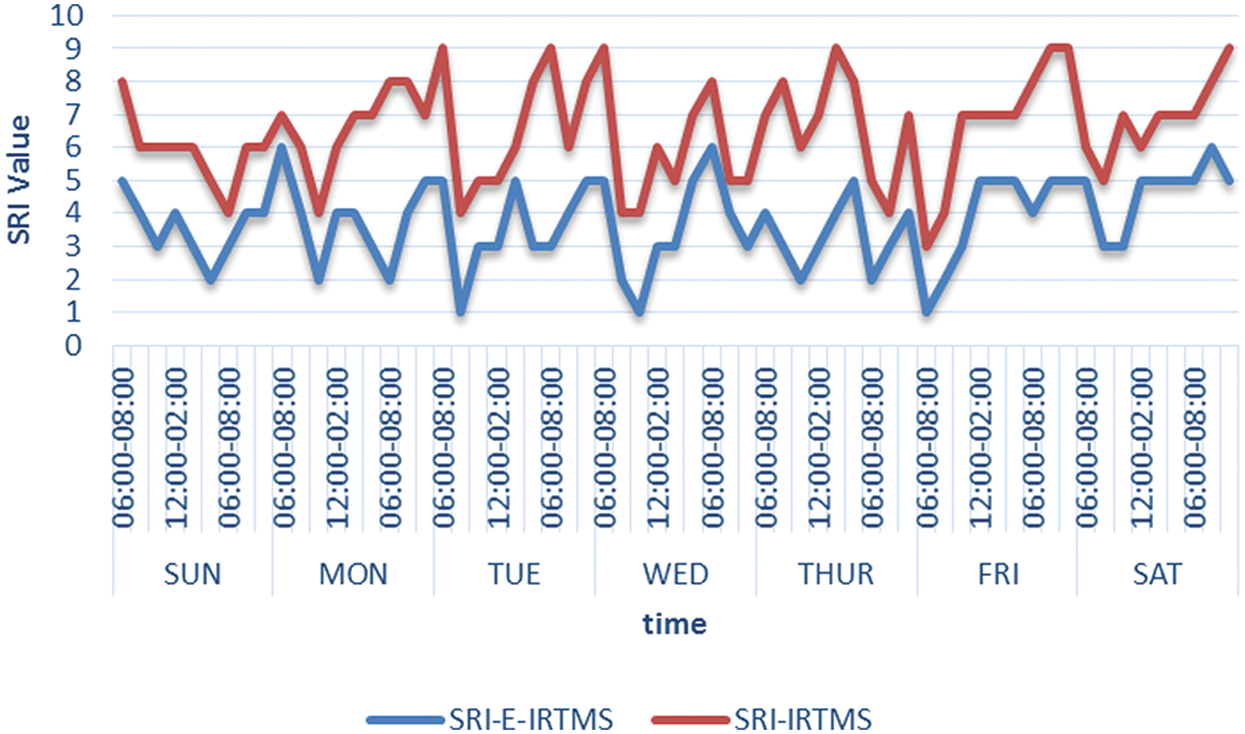
Figure 2: SRI results of E-IRTMS and IRTMS
As shown in Fig. 3, the SPI of E-IRTMS decreases more than that of IRTMS. The results obtained indicate that E-IRTMS is more competitive than IRTMS. Peak time congestion in E-IRTMS occurs during weekdays from 06:00 to 08:00 and from 18:00 to 20:00.
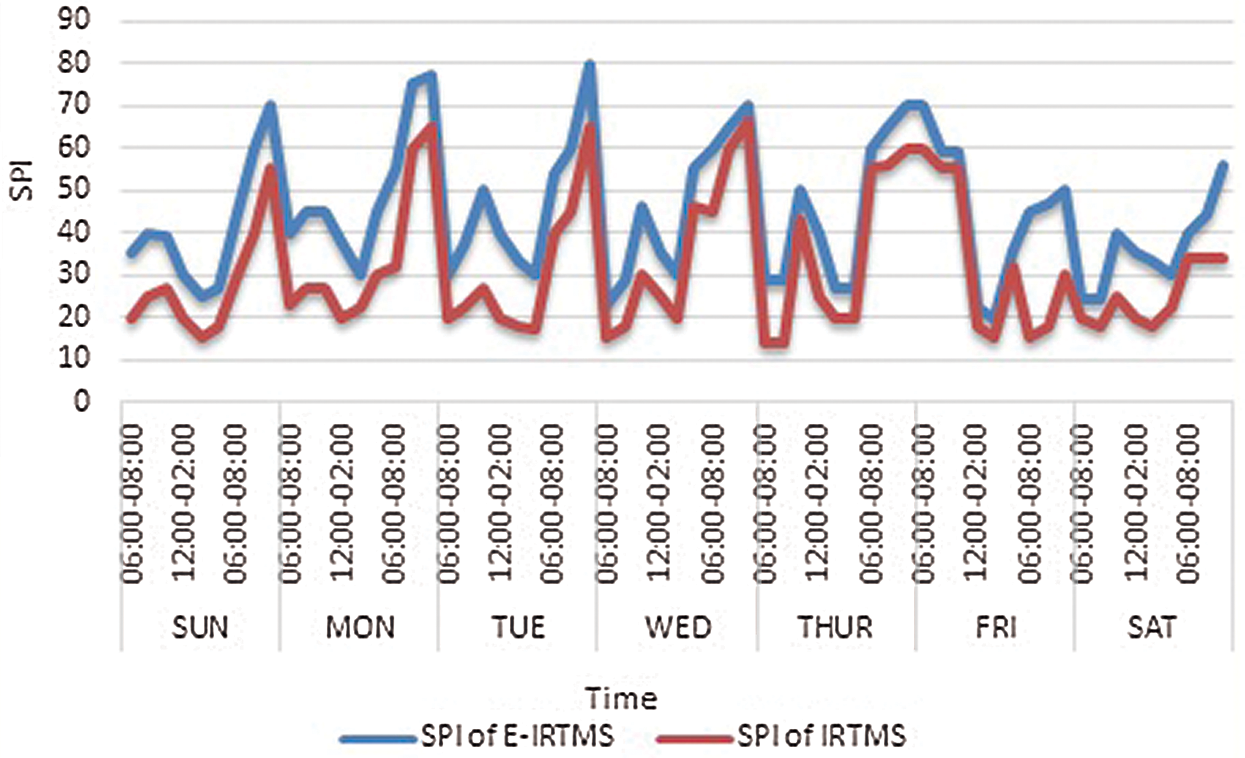
Figure 3: SPI results of E-IRTMS and IRTMS
Peak time in IRTMS exceeds peak time in E-IRTMS over the same time span, indicating that E-IRTMS outperforms IRTMS.
As mentioned in Afrin et al. [7], SPI is calculated on the basis of three threshold values (25, 50, and 75). The lower the threshold value, the higher the level of traffic signal congestion [37].
As shown in Fig. 4, the Ri of E-IRTMS is higher than that of IRTMS, leading to lower congestion in E-IRTMS than that in IRTMS. Furthermore, the Ri of E-IRTMS reaches approximately 1 in this case, indicating less traffic signal congestion than that of IRTMS, whose Ri reaches approximately 0 (Fig. 4). As suggested in Afrin et al. [7], traffic congestion increases when Ri reaches approximately 0 [38].
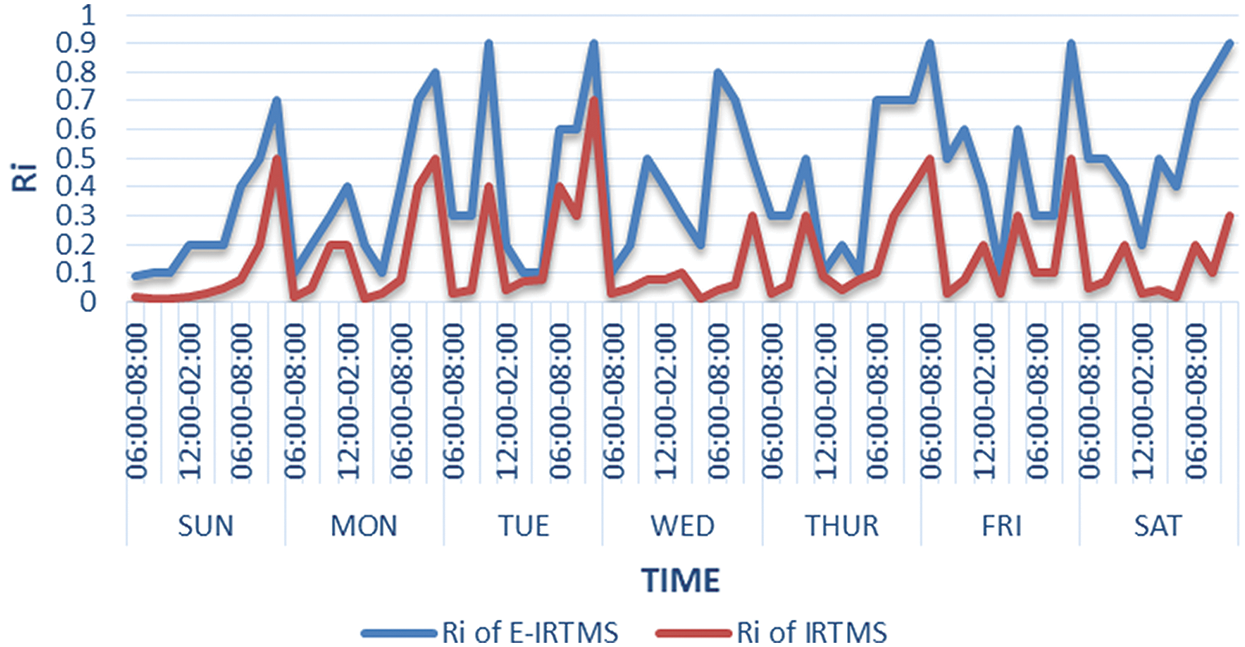
Figure 4: Ri results of E-IRTMS and IRTMS
Accordingly, a conclusion can be drawn that E-IRTMS is better than IRTMS. Ri has higher values, resulting in less E-IRTMS traffic congestion. By contrast, the Ri of IRTMS reaches the minimum value. During weekends from 12:00 to 14:00, peak time congestion reaches a high value in E-IRTMS. This finding can be attributed to people coming out of mosques after attending Friday prayers.
In addition to the Ri of IRTMS, the peak value of working time is between 16:00 and 18:00. Other congestion rates reach the highest value over the period of 12:00–14:00 because various businesses end their working hours.
The relation of congestion time between E-IRTMS and IRTMS is illustrated in Fig. 5. The peak times of E-IRTMS and IRTMS are nearly the same. This finding is attributed to people going to school, university, and work at 16:00–18:00. Meanwhile, the time when people leave school, university, and work is known as rush hour.
Figure 5: Performance in terms of congestion period of E-IRTMS and IRTMS
During weekends, peak times differ from 12:00 to 14:00 due to the time when Friday prayers end in mosques. Another peak time is from 14:00 to 20:00 because most people go on holidays, visit relatives and friends, go shopping, or hang out at coffee shops or restaurants. In addition, the period of 22:00–00:00 is another peak time because people are coming back home.
Despite the peak times being nearly the same in E-IRTMS and IRTMS, the E-IRTMS period is less congested than the IRTMS period. This finding indicates that the performance of E-IRTMS is better than that of IRTMS in mitigating traffic congestion by approximately 23%.
The contribution of the E-IRTMS based on HCBGA is the use of traffic signals with unfixed timers. E-IRTMS also substantially reduces congested traffic signals compared with IRTMS. Data are passed on to a genetic algorithm, which transmits the parameters to a chromosome. HCBGA determines the priority for changing to green light between intersections in accordance with the chromosome’s fittest value. The results obtained via E-IRTMS are more effective than those obtained via IRTMS by approximately 23%.
This study also determines that in addition to Ri being approximately 1, E-IRTMS exhibits the highest SPI, with an SRI of less than 4. Furthermore, E-IRTMS is essential for an actual traffic system. E-IRMS is more successful than IRTMS. On the basis of the aforementioned findings, E-IRTMS can help drivers mitigate traffic signal congestion.
Acknowledgement: The authors would like to thank AL-Zaytoonah University of Jordan for its support to this research.
Funding Statement: The author(s) received no specific funding for this study.
Conflicts of Interest: The authors declare that they have no conflict of interests to report regarding the present study.
1. A. D. Salman, O. I. Khalaf and G. M. Abdulsahib, “An adaptive intelligent alarm system for wireless sensor network,” Indonesian Journal of Electrical Engineering and Computer Science, vol. 15, no. 1, pp. 142–147, 2019. [Google Scholar]
2. O. I. Khalaf and G. M. Abdulsahib, “Energy efficient routing and reliable data transmission protocol in WSN,” International Journal of Advances in Soft Computing and its Application, vol. 12, no. 3, pp. 45–53, 2020. [Google Scholar]
3. O. I. Khalaf and B. M. Sabbar, “An overview on wireless sensor networks and finding optimal location of nodes,” Periodicals of Engineering and Natural Sciences, vol. 7, no. 3, pp. 1096–1101, 2019. [Google Scholar]
4. O. I. Khalaf, G. M. Abdulsahib and M. Sadik, “A modified algorithm for improving lifetime WSN,” Journal of Engineering and Applied Sciences, vol. 13, no. 21, pp. 9277–9282, 2018. [Google Scholar]
5. G. M. Abdulsahib and O. I. Khalaf, “An improved algorithm to fire detection in forest by using wireless sensor networks,” International Journal of Civil Engineering and Technology, vol. 9, no. 10, pp. 369–377, 2018. [Google Scholar]
6. A. F. Subahi, Y. Alotaibi, O. I. Khalaf and F. Ajesh, “Packet drop battling mechanism for energy aware detection in wireless networks,” Computers Materials and Continua, vol. 66, no. 2, pp. 2077–2086, 2020. [Google Scholar]
7. T. Afrin and N. Yodo, “A survey of road traffic congestion measure towards a sustainable and resilient transportation system,” Sustainability, vol. 12, no. 11, pp. 4660, 2020. [Google Scholar]
8. INRIX. 2014. [Online]. Available: http://inrix.com/press/annual-cost-of-gridlock-in-europe-and-the-us-will-increase-50-percent-on-average-to-293-billion-by-2030. [Google Scholar]
9. Bureau of Transportation Statistics (BTS) and US Department of Transportation, “Highlights of the 2001 National Household Travel Survey,” in Bureau of Transportation Statistics (BTS), Washington, DC, USA, 2017. [Google Scholar]
10. Ministry of Jordan Transport. 2017. [Online]. Available: https://jordan.gov.jo. [Google Scholar]
11. S. K. Prasad, J. Rachna, O. I. Khalaf and D. N. Le, “Map matching algorithm: Real time location tracking for smart security application,” Telecommunications and Radio Engineering (English translation of Elektrosvyaz and Radiotekhnika), vol. 79, no. 13, pp. 1189–1203, 2020. [Google Scholar]
12. Y. Liu, X. Yan, Y. Wang, Z. Yang and J. Wu, “Grid mapping for spatial pattern analyses of recurrent urban traffic recurrent urban traffic congestion based on taxi GPS sensing data,” Sustainability, vol. 9, no. 4, pp. 533, 2017. [Google Scholar]
13. B. Dan, The globalization of traffic congestion: IBM Commuter Pain Survey. Armonk, NY: IBM, 2010. [Google Scholar]
14. F. He, X. Yan, Y. Li and L. Ma, “A traffic congestion assessment method for urban road networks based on speed performance index,” Procedia Engineering, vol. 137, no. 6, pp. 425–433, 2016. [Google Scholar]
15. A. A. Hnaif, N. Al-madi, M. Abduljawad and A. Ahmad, “An intelligent road traffic management system based on a human community genetic algorithm,” in 2019 IEEE Jordan Int. Joint Conf. on Electrical Engineering and Information Technology (JEEITAmman, Jordan, pp. 554–559, 2019. [Google Scholar]
16. A. A. Hnaif, A. El-obaid and N. Al-ramahi, “Traffic light management system based on Hamiltonian routing technique,” Journal of Theoretical and Applied Information Technology, vol. 95, no. 12, pp. 2792–2802, 2017. [Google Scholar]
17. Z. J. Li. and J. Huang, “How to mitigate traffic congestion based on improved ant colony algorithm: A case study of a congested old area of a metropolis,” Sustainability, vol. 11, no. 4, pp. 1140, 2019. [Google Scholar]
18. F. Khaghani and F. Jazizadeh, “mD-Resilience: A multi-dimensional approach for resilience-based performance assessment in urban transportation,” Sustainability, vol. 12, no. 12, pp. 4879, 2020. [Google Scholar]
19. A. Nugmanova, W. H. Arndt, M. A. Hossain and J. R. Kim, “Effectiveness of ring roads in reducing traffic congestion in cities for long run: Big Almaty ring road case study,” Sustainability, vol. 11, no. 18, pp. 4973, 2019. [Google Scholar]
20. J. C. Falcocchio and H. S. Levinson, “Road traffic congestion: A concise guide,” in Springer Tracts on Transportation and Traffic, 1st ed., vol. 7. Berlin, Heidelberg: Springer International Publishing, pp. XXIV, 401, 2015. [Google Scholar]
21. O. I. Khalaf and G. M. Abdulsahib, “Frequency estimation by the method of minimum mean squared error and P-value distributed in the wireless sensor network,” Journal of Information Science and Engineering, vol. 35, no. 5, pp. 1099–1112, 2019. [Google Scholar]
22. N. Sulaiman, G. M. Abdulsahib, O. I. Khalaf and M. N. Mohammed, “Effect of using different propagations on performance of OLSR and DSDV routing protocols,” in 2014 5th Int. Conf. on Intelligent Systems, Modelling and Simulation, Langkawi, Malaysia, 540–545, 2014. [Google Scholar]
23. A. Abdul Hai, “Traffic flow problem simulation in Jordan,” in Proc. (ECME’11Puerto De La Cruz, Tenerife, Spain, pp. 121–125, 2011. [Google Scholar]
24. C. Wan, Z. Yang, D. Zhang, X. Yan and S. Fan, “Resilience in transportation systems: A systematic review and future directions,” Transport Reviews, vol. 38, no. 4, pp. 479–498, 2018. [Google Scholar]
25. J. Tang and H. R. Heinimann, “A resilience-oriented approach for quantitatively assessing recurrent spatial-temporal congestion on urban roads,” PLoS ONE, vol. 13, pp. e0190616, 2018. [Google Scholar]
26. Documentation and Definitions, “Urban congestion reports—Operations performance measurement—FHWA operations,” (accessed on 15 December 2019). [Online]. Available: https://ops.fhwa.dot.gov/perf_measurement/ucr/documentation.htm. [Google Scholar]
27. R. M. Hanbali and F. Al-khzouz, “Practices of placing traffic signal indications at intersections in Jordan,” in Seventh Traffic Safety Conf., Amman, Jordan, pp. 12–13, 2015. [Google Scholar]
28. A. M. Rao and K. R. Rao, “Microscopic simulation to evaluate the traffic congestion mitigation strategies on urban arterials,” European Transport, vol. 58, no. 1, pp. 1–20, 2015. [Google Scholar]
29. J. Gao, Y. Shen, J. Liu, M. Ito and N. Shiratori, “Adaptive traffic signal control: Deep reinforcement learning algorithm with experience replay and target network,” arXiv, vol. abs/1705.02755, pp. 1–10, 2017. [Google Scholar]
30. A. A. A. Alkhatib, A. Hnaif and T. Kanan, “Proposed simple system for road traffic counting,” International Journal of Sensors, Wireless Communications and Control, vol. 8, pp. 269–277, 2018. [Google Scholar]
31. M. Shehab, H. Alshawabkah, L. Abualigah and N. Al-madi, “Enhanced a hybrid moth-flame optimization algorithm using new selection schemes,” Engineering with Computers, vol. 36, no. 1, pp. 746, 2020. [Google Scholar]
32. O. I. Khalaf, G. M. Abdulsahib and B. M. Sabbar, “Optimization of wireless sensor network coverage using the bee algorithm,” Journal of Information Science and Engineering, vol. 36, no. 2, pp. 377–386, 2020. [Google Scholar]
33. N. A. Al-madi, K. A. Abu Maria, E. A. Abu Maria and M. A. Al-madi, “A structured-population human community based genetic algorithm (HCBGA) in a comparison with both the standard genetic algorithm (SGA) and the cellular genetic algorithm (CGA),” ICIC Express Letters An International Journal of Research and Surveys, vol. 12, no. 12, pp. 1183–1303, 2018. [Google Scholar]
34. H. Wei, G. Zheng, H. Yao and Z. Li, “Intellilight: A reinforcement learning approach for intelligent traffic light control,” in Proceedings of the 24th ACM SIGKDD Int. Conf. on Knowledge Discovery & Data Mining, New York, NY, USA, pp. 2496–2505, 2018. [Google Scholar]
35. A. M. Rao and K. R. Rao, “Measuring urban traffic congestion—A review,” International Journal for Traffic and Transport Engineering (IJTTE), vol. 2, no. 4, pp. 286–305, 2012. [Google Scholar]
36. J. Liu, X. Kang, C. Dong and F. Zhang, “Simulation of real-time path planning for large-scale transportation network using parallel computation,” Intelligent Automation & Soft Computing, vol. 25, no. 1, pp. 65–77, 2019. [Google Scholar]
37. T. D. Huurne and J. Andersen, “A quantitative measure of congestion in Stellenbosch using probe data,” in Proc. of the First Int. Conf. on the use of Mobile Informations and Communication Technology (ICT) in Africa UMICTA, STIAS Conf. Centre, Stellenbosch: Stellenbosch University, Department of Electrical & Electronic Engineering, South Africa, pp. 62–67, 2014. [Google Scholar]
38. J. Wang, L. Chi, X. Hu and H. Zhou, “Urban traffic congestion pricing model with the consideration of carbon emissions cost,” Sustainability, vol. 6, no. 2, pp. 676–691, 2014. [Google Scholar]
 | This work is licensed under a Creative Commons Attribution 4.0 International License, which permits unrestricted use, distribution, and reproduction in any medium, provided the original work is properly cited. |