DOI:10.32604/csse.2022.016754
| Computer Systems Science & Engineering DOI:10.32604/csse.2022.016754 | |
| Article |
Deep Learning Based Process Analytics Model for Predicting Type 2 Diabetes Mellitus
Department of Computer Science, Alagappa University, Karaikudi, 630003, India
*Corresponding Author: Sundar Santhoshkumar. Email: santhoshkumars@alagappauniversity.ac.in
Received: 11 January 2021; Accepted: 27 April 2021
Abstract: Process analytics is one of the popular research domains that advanced in the recent years. Process analytics encompasses identification, monitoring, and improvement of the processes through knowledge extraction from historical data. The evolution of Artificial Intelligence (AI)-enabled Electronic Health Records (EHRs) revolutionized the medical practice. Type 2 Diabetes Mellitus (T2DM) is a syndrome characterized by the lack of insulin secretion. If not diagnosed and managed at early stages, it may produce severe outcomes and at times, death too. Chronic Kidney Disease (CKD) and Coronary Heart Disease (CHD) are the most common, long-term and life-threatening diseases caused by T2DM. Therefore, it becomes inevitable to predict the risks of CKD and CHD in T2DM patients. The current research article presents automated Deep Learning (DL)-based Deep Neural Network (DNN) with Adagrad Optimization Algorithm i.e., DNN-AGOA model to predict CKD and CHD risks in T2DM patients. The paper proposes a risk prediction model for T2DM patients who may develop CKD or CHD. This model helps in alarming both T2DM patients and clinicians in advance. At first, the proposed DNN-AGOA model performs data preprocessing to improve the quality of data and make it compatible for further processing. Besides, a Deep Neural Network (DNN) is employed for feature extraction, after which sigmoid function is used for classification. Further, Adagrad optimizer is applied to improve the performance of DNN model. For experimental validation, benchmark medical datasets were used and the results were validated under several dimensions. The proposed model achieved a maximum precision of 93.99%, recall of 94.63%, specificity of 73.34%, accuracy of 92.58%, and F-score of 94.22%. The results attained through experimentation established that the proposed DNN-AGOA model has good prediction capability over other methods.
Keywords: Process analytics; deep learning; disease diagnosis; Adagrad; T2DM; chronic illness
Process analytics is commonly employed in identification, monitoring, and improvement of the processes through knowledge extraction from historical data. It can be employed in disease diagnosis process in healthcare domain too. It can analyze a dataset effectively and diagnose different kinds of diseases. Diabetes Mellitus (DM) is one of the incurable diseases characterized by the lack of insulin secretion, a result of irregular functioning of pancreatic beta-cells [1]. The prevalence and the magnitude of diabetic population since 1980 are increasing in an alarming manner. Recently, it has been identified as the top most disease with high mortality rate. International Diabetes Federation (IDF) reported that the number of diabetic patients is increasing on a daily basis across the globe. Diabetes is categorized into Type 1 (T1DM) Diabetes and Type 2 (T2DM) Diabetes with completely different therapy regimen. China leads the first position with most number of T2DM patients, due to its increasing population. T2DM leads to major complications such as macrovascular infection, for instance, Cardiovascular Disease (CVD), microvascular infection, etc. [2]. Further, T2DM results in dementia and cognitive impairment during when the sensitivity of diabetes gets reduced. The presence of CVD like Heart Failure (HF) and cardiac dysfunction in patients with T2DM is higher compared to people without T2DM.
Coronary Heart Disease (CHD) is a common and serious complication of diabetes and a lot of diabetic patients suffer from CHD too. CHD is characterized by insufficient supply of blood to heart muscles due to hyperlipidaemia, myocardial infarction, and angina pectoris. Most of the diabetic adults in US suffer from CHD that ends their life. It is apparent that the demographic factors like age, gender, and the health status of patients in terms of BP, smoking habit and diabetes decide the prognosis of CHD [3]. Hence, it becomes inevitable to predict CHD at very early stages in spite of the challenges associated with it. The techniques used in the prediction of CHD so far, followed mathematical approaches like COX regression and Machine Learning (ML) methodologies like Neural Network (NN). These approaches are developed for common people, while there is no model available to examine the risks of CHD in T2DM patients. Thus, the risks for a normal aged person to have diseases like HD and CHD are less, in comparison with diabetic patients. T2DM patients should be examined periodically to predict the risks of CHD.
Chronic Kidney Disease (CKD) is a major health issue with drastic increase in impact and prevalence in the recent years. Patients suffering from diabetes are diagnosed with CKD through negative deployment. It is essential to stratify CKD and evaluate its development, since diabetes is a major cause of end-stage renal diseases. CKD is a progressive infection that limits the functioning of kidneys for which dialysis and transplantation are better remedies to extend the life span of the patient [4]. Each country has a unique price slab for dialysis and transplantation depending on their clinical features [5]. With slow development of CKD, the consequences of End-Stage Renal Disease (ESRD) could be arrested. Regardless, the prediction of CKD is essential for both detection of ESRD and cost-cutting for healthcare system [6]. Stage 3 CKD is further classified into two stages namely, A and B. In literature, a variation in poor ratios represents stage 4 development like mortality and hospitalization [7]. The levels allocated are determined based on radioactivity. The above-discussed prediction strategies are costlier and time-consuming. So, there is a need to develop novel methodologies that are cost-effective and time-savvy.
The application of temporal Electronic Health Record (EHR) data in prediction models remains a challenging task. This healthcare data consists of different sampling rates over various groups of patients with different data types. During inpatient encounters, possible symptoms are pointed out on an hourly basis, while the lab tests and vaccinations are recorded based on clinicians’ request. Further, the demographic data is considered to be highly responsive in this regard. So, maximum efforts are taken to balance the temporal data in different medical domains. Initially, time series is represented through medical features with a heuristic value (considering the advanced value [8] to weighted sum of measures with weights computed by timestamps [9]). Alternatively, basic sequential order is conserved by mapping time series with temporal patterns [10]. Furthermore, Deep Learning (DL) models like Recurrent Neural Network (RNN) especially Long Short Term Memory (LSTM) and Gated Recurrent Units (GRU) have been involved in modeling temporal functions. The issues discussed above have been addressed by different research works which inferred different conclusions like maximum data sparsity or data loss and lack of training information.
When it comes to detection of kidney-based functions, single-value abstraction is an established method which is known for its simplicity. However, the cost of limited temporal granularity is high [11]. A multivariate Cox proportional survival framework was deployed in the literature [12] to predict ESRD-relied mean- and variation-abstraction. These sophisticated applications make use of temporal EHRs and target severe or acute kidney-based events [13], while independent Markov operation is developed by frequent latent states to detect the transition from stage 3 to stage 4 in CKD.
Multitask linear method-based knowledge transfer that occurs from one time window to the other, is able to predict the short-term renal function loss [14]. A tree-based discrete survival-like Gradient Boosting Machine (GBM) was deployed with few features in the study conducted earlier to detect acute kidney disease among inpatients. The results were associated with time variance which implied a tremendous function [15]. Thus, the previously-presented models demand low-to-high manual effort for pre-selection and recovery of the features. This demand limits the reliability of prediction approaches. However, the moderate data in patient’s records are reduced [16]. Several studies pointed out the importance of predicting CKD and CHD risks in T2DM patients. Though several models are available in the literature, there is a need still exists to improve the detection performance. In addition, the parameter tuning of DL models is yet to be explored in CKD diagnosis.
This paper presents an automated Deep Learning (DL)-based Deep Neural Network (DNN) with Adagrad Optimization Algorithm i.e., DNN-AGOA model to predict the risks of CKD and CHD in T2DM patients. The goal of this study is to design a risk prediction model for T2DM patients that can predict the occurrence of CKD or CHD in future. This model helps in alarming both T2DM patients and clinicians. At first, the DNN-AGOA model performs data preprocessing to increase the quality of data and make it compatible for further processing. After this, Deep Neural Network (DNN) is employed for feature extraction, whereas sigmoid function is used for classification. In order to optimize the results of DNN model, hyperparameter tuning is performed in DNN using Adagrad optimizer. The novelty of current research work is the application of Adagrad to fine tune the hyperparameters of DNN. For experimental validation, benchmark medical datasets were used and the results were validated under diverse dimensions.
The overall operations involved in the presented DNN-AGOA model is shown in Fig. 1. The input dataset is first verified to confirm the presence of T2DM. Subsequently, those T2DM positive data instances are considered to predict the significant risks of CKD and CHD. Sigmoid layer is responsible for the allocation of proper class labels to the applied test input data.
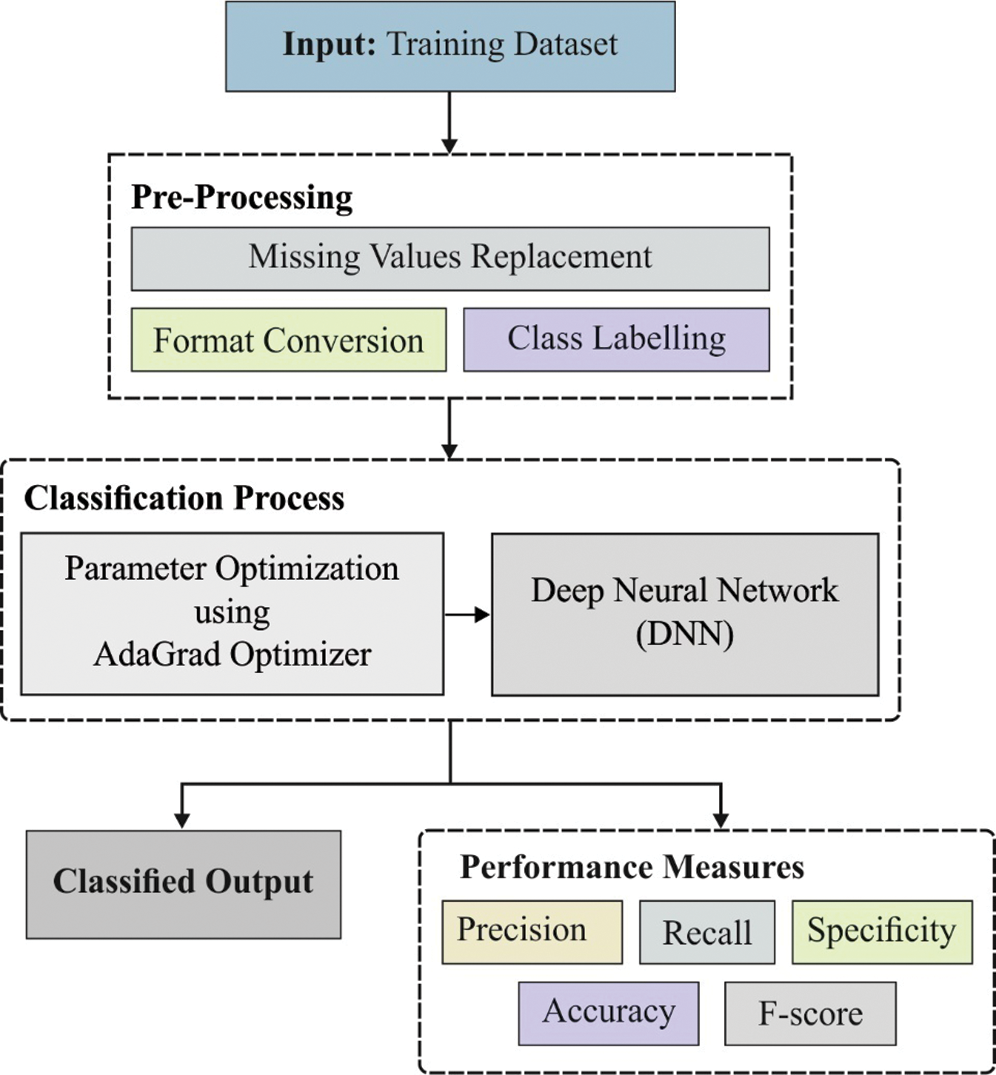
Figure 1: Functional diagram of DNN-AGOA model
At first, input medical data is preprocessed through two stages namely, format conversion and missing value replacement. During format conversion, raw medical dataset is converted into a compatible .arff format. Then, the missing values that exist in the dataset are filled by following median method.
Artificial Neural Network (ANN) model is a biology-based computational approach as it is influenced by biological neural network feature to implant the intelligence in projected technology. Feed Forward Neural Network (FFN), a class of ANN, is represented by a directed graph to pass the system data with edges from one node to another without any cycle formation. Here, Multilayer Perceptron (MLP) framework is applied as a class of FFN with maximum number of input, hidden and output layers. Here, a layer contains massive number of neurons. The number of hidden layers is selected by applying hyperparameter selection module. Then, the data is transferred in a layer-by-layer fashion in forward direction along with fully-connected neurons. MLP is represented numerically;
where
where
The three-layered MLP, along with Softmax function in the resultant layer, is similar to Multi-class Logistic Regression (LR) method. MLP is generally expressed for massive number of hidden layers and is given below.
The piling hidden layers are generally referred to as DNNs. Fig. 2 shows the structure of DNN with a hidden layer. It considers the following values as input,
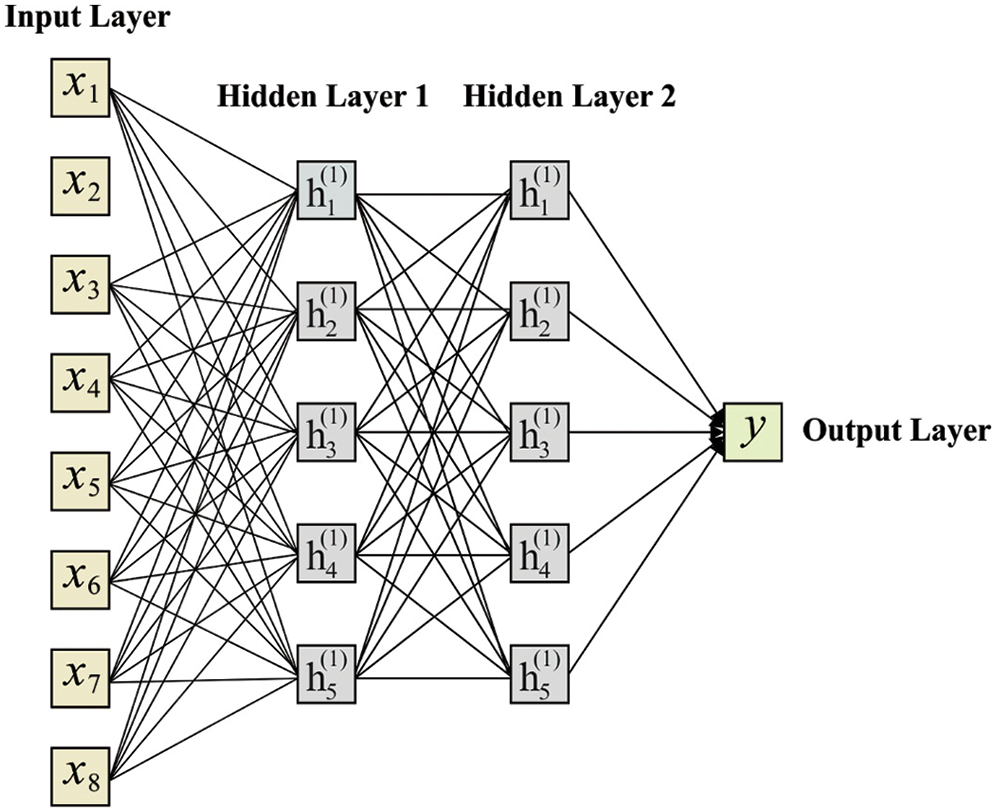
Figure 2: Structure of DNN model
In MLP development, it is important to identify the best parameter to achieve the best function. This procedure includes loss function identification too as a basic procedure. A loss function is applied in the estimation of difference between the predicted and defined values as illustrated in the mathematical model.
where
Thus, a corrected input-output set is received by
The loss function should be reduced to gain the best results from NN. A loss function is demonstrated as follows.
where
Loss function minimization
Different types of optimization models have been developed so far in Gradient Descent (GD) as it is frequently applied in the computation of sequential parameters.
where α defines the learning rate which is elected on the basis of hyperparameter selection method. In order to identify a derivative of
where
ReLU layer is highly effective and applied in the simulation of training speed.
where
2.2.3 Fully Connected (FC) Layer
FC layer has a link to all the units in subsequent layers. Normally, FC layer performs the mapping of data to a higher dimension. The output layer is highly precise for high dimension data. It makes use of ReLU, a non-linear activation function. In addition, a dropout of 0.01 and batch normalization are applied in FC layers to avoid overfitting and to increase the training speed of DNN model. The dropout removes the neurons with links in a random manner. DNN may go overfitting into training data with no regularization, even if it is trained under large number of sample instances.
FC layer is the final layer that utilizes a sigmoid activation function for classification. A predictive loss function for sigmoid is represented by binary cross-entropy and the predictive loss is represented by categorical cross-entropy as given below. The prediction loss can be defined as follows.
Here, ‘pd’ is a vector of predicted probability for every sample in testing dataset and ‘ed’ is a vector of predictable classes, 0 or 1.
ADO (Adagrad Optimizer) is employed to fine tune the parameters of DNN model. The existing adaptive gradient models offer element-wise scaling term on learning rate, which ensures no manual intervention to tune the learning rate. It utilizes the past data to estimate the curvature of loss function and implements diverse learning rates for all parameters. Therefore, learning rate is a vector and every element in a parameter is diverse from conventional learning rate methodologies. In this study, ADO is employed which adopts a small learning rate parameter equivalent to recurrent features and a large learning rate parameter equivalent to rare features. Consequently, ADO is highly appropriate to train the sparse data as it enhances the robust nature of SGD model. ADO can be updated using the Eqs. (15) and (16).
where
In this section, the researchers validated the performance of NN-AGOA model on the applied dataset [19]. DNN-AGOA model was simulated in a PC loaded with Python 3.6.5 and its specifications were as follows; Processor—i5-8600k, MSI Z370 A-Pro, GeForce 1050Ti 4 GB, 16 GB RAM, 250 GB SSD, and 1TB HDD. To train the DNN model, 10-fold cross-validation was performed and the dataset was split into training and testing datasets. The additional packages used for simulation were TensorFlow-gpu == 1.14.0, pyqt5 == 5.14, pandas, scikit-learn, matplotlib, prettytable, seaborn, tqdm, numpy == 1.16.0, and h5py == 2.7.0. Tab. 1 shows the details of the dataset used in the study. Different processes, involved in the simulation of the proposed model, are shown in Appendix. As shown in the table, the test dataset includes a set of 400 instances with 24 attributes. In addition, the dataset includes a set of two classes. A total of 137 instances is grouped under DM presence whereas 263 instances are placed under DM absence. Besides, a total of 34 samples belongs to the presence of Coronary Artery Disease and 366 instances with the presence of artery class. Moreover, a total of 250 and 150 samples come under the presence and absence of CKD respectively.

Fig. 3 shows the sets of confusion matrices generated by DNN-AGOA model on the applied dataset. Fig. 3a is the confusion matrix produced by DNN-AGOA model during DM classification. The figure portrays that the DNN-AGOA model classified 227 instances as DM absent and 121 instances as DM present. Similarly, Fig. 3b portrays the confusion matrix produced by DNN-AGOA model in the classification of Coronary Artery Disease. The figure infers that the DNN-AGOA model classified a total of 362 instances as Coronary Artery Disease absent and 12 instances as Coronary Artery Disease present. Likewise, Fig. 3c reveals the confusion matrix generated by DNN-AGOA model on the classification of Coronary Artery Disease. The figure represents that the DNN-AGOA model classified a total of 148 instances as CKD absent and 241 instances as CKD present.
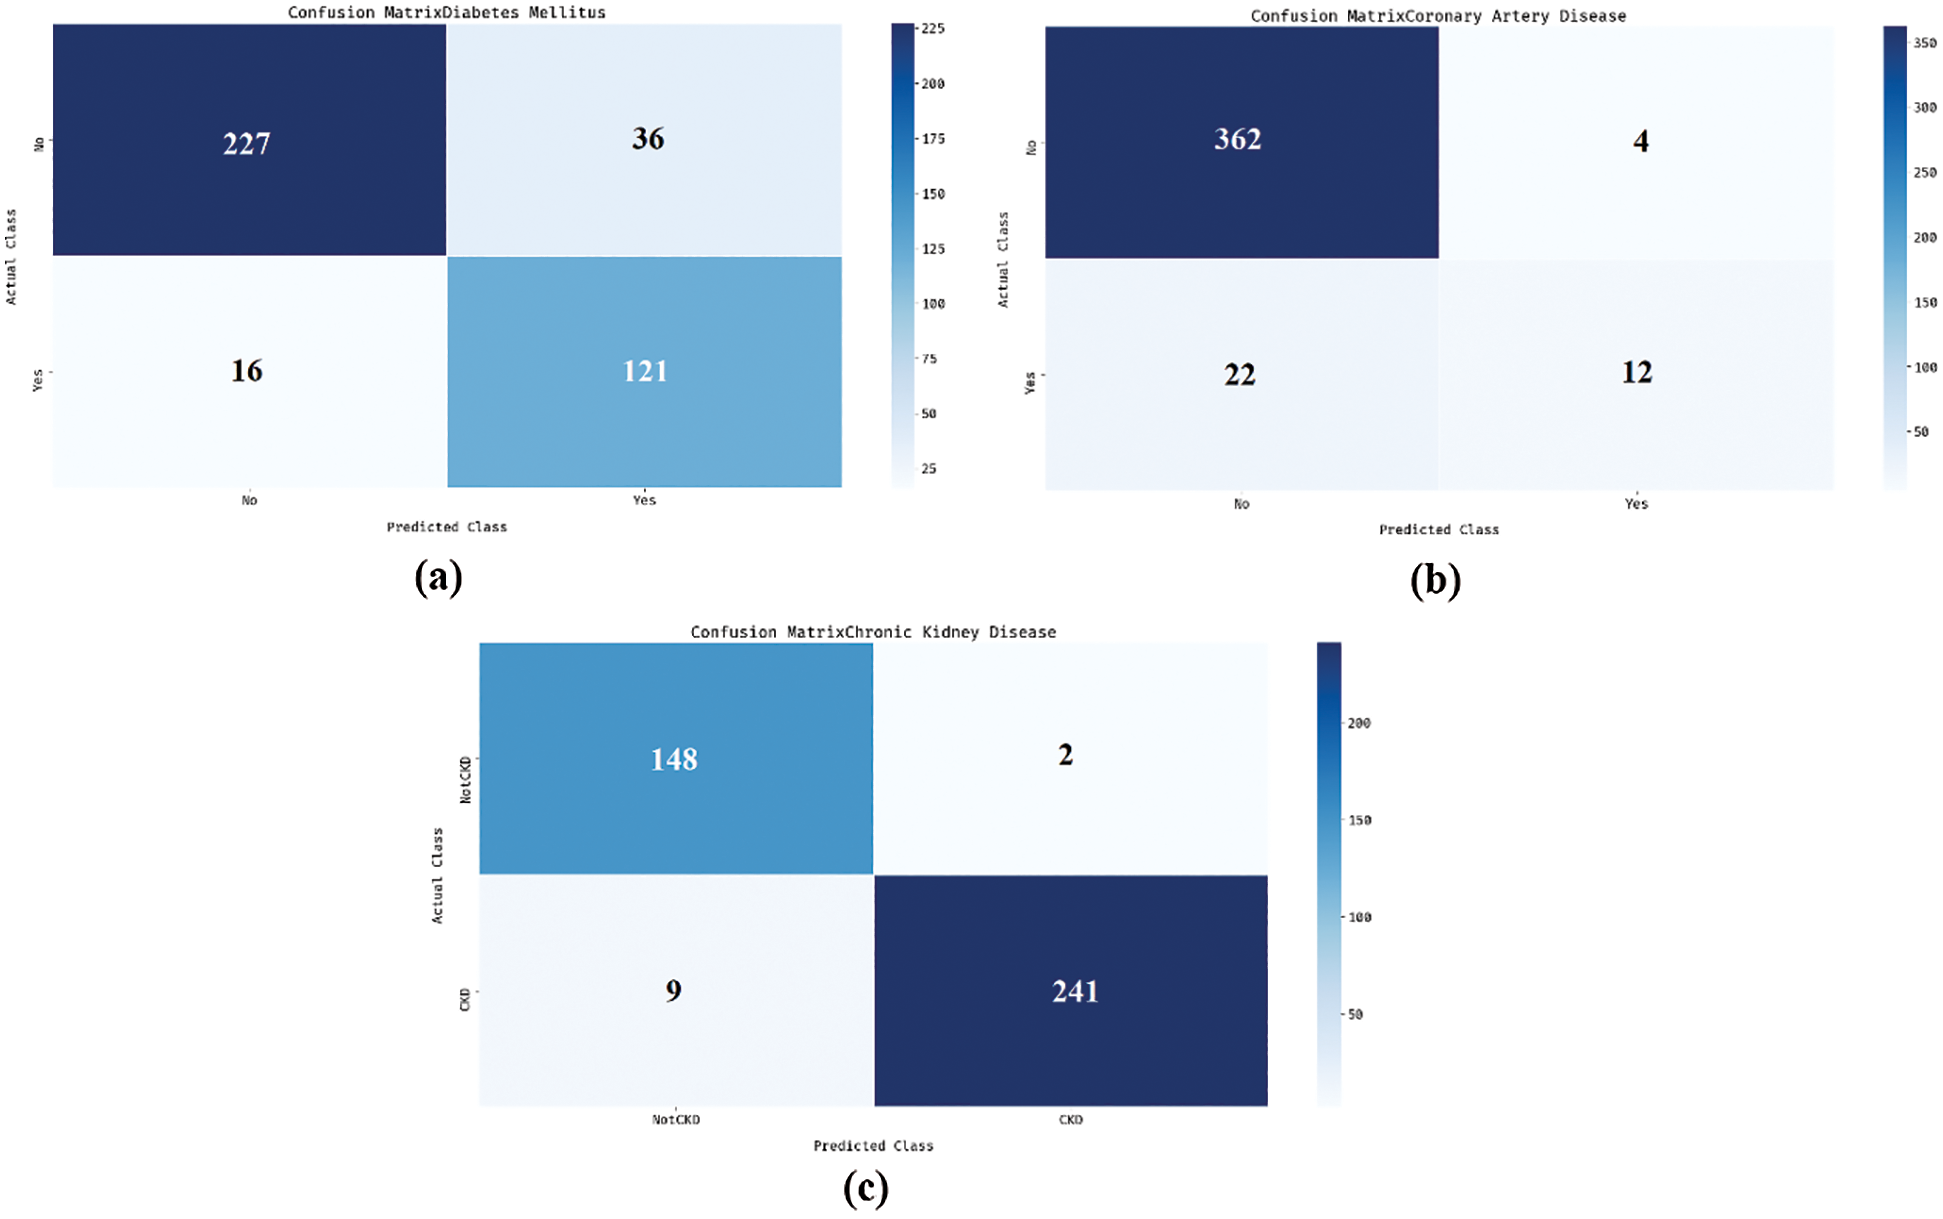
Figure 3: Confusion matrix (a) DM (b) Coronary artery disease (c) CKD
Tab. 2 and Figs. 4 and 5 demonstrate the classification results attained by DNN-AGOA model in different diseases. The results infer that the DNN-AGOA model attained a proficient diagnostic outcome on the classification of different diseases. For instance, the DNN-AGOA model categorized DM disease at a high precision of 93.42%, recall of 86.31%, specificity of 88.32%, accuracy of 87%, and F-score of 89.72%. Concurrently, the DNN-AGOA model categorized Coronary Artery Disease with a superior precision of 94.27%, recall of 98.91%, specificity of 35.29%, accuracy of 93.50%, and F-score of 96.53%. Likewise, the DNN-AGOA model categorized CKD disease with a maximum precision of 94.27%, recall of 98.67%, specificity of 96.40%, accuracy of 97.25%, and F-score of 96.42%.

Figure 4: Result of DNN-AGOA model with different measures

Figure 5: Results of DNN-AGOA model in terms of accuracy and F-score

Fig. 6 shows the results attained by DNN-AGOA model for the classification of diverse diseases. The figure reveals that the DNN-AGOA model achieved a maximum precision of 93.99%, recall of 94.63%, specificity of 73.34%, accuracy of 92.58%, and F-score of 94.22%.

Figure 6: Average analysis of DNN-AGOA model with different measures
Tab. 3 and Figs. 7 and 8 show a comparison of classification results achieved by DNN-AGOA model, when analyzing the applied dataset [20–23]. The resultant values demonstrate that the DNN-AGOA model achieved effective results in diagnosing different diseases. When comparing the results of DNN-AGOA model in terms of precision, the figure reveals that both AI-CHD and DT models failed in achieving an effective outcome, since it yielded minimal precision values such as 80% and 81.40% respectively. Besides, the LogitBoost model attempted to show slightly better precision of 84.60%. Along with that, ACO, PSO, LR, and SVM models yielded moderately close precision values such as 87.34%, 86.24%, 88%, and 86.86% correspondingly. In line with these, MRODC and Voted Perceptron models reached near-optimal precision values of 91.80% and 92.40% respectively. But the presented DNN-AGOA model outperformed all the models compared and exhibited the maximum precision of 93.99%.

Figure 7: Comparative analysis of DNN-AGOA model in terms of precision and recall

Figure 8: Comparative analysis of DNN-AGOA model in terms of accuracy and F-score

When comparing the results achieved by DNN-AGOA model in terms of recall, the figure portrays that both AI-CHD and Voted Perceptron methods failed in gaining efficient results since it achieved the least recall values of 20.41% and 68.04% respectively. Followed by, the LogitBoost approach attempted to exhibit a moderate recall of 77.61%. Similarly, the DT, LR, PSO, and ACO schemes implied considerable recall values such as 79.02%, 79.27%, 88%, and 88.88% correspondingly. In line with these, both SVM and MRODC models attained near-optimal recall values of 87.1% and 90.89% respectively. However, the projected DNN-AGOA model surpassed all the compared models and exhibited a higher recall of 94.63%. Besides, when comparing the results of DNN-AGOA model with respect to accuracy, the figure depicts that both Voted Perceptron and DT models failed in achieving effective outcomes since it achieved the least accuracy values such as 66.79% and 73.82% respectively. Besides, the LogitBoost model tried to achieve a reasonably better accuracy of 74.08%.
Likewise, the LR, AI-CHD, PSO, and SVM models accomplished moderately closer accuracy values such as 77.21%, 80.88%, 85%, and 86.87% respectively. In line with these, both ACO and MRODC models reached closer optimal accuracy values such as 87.5% and 88.67% respectively. But the presented DNN-AGOA scheme performed well compared to other methods and showcased a high accuracy of 92.58%. Followed by, when comparing the results of DNN-AGOA model in terms of F-score, the figure demonstrates that both AI-CHD and Voted Perceptron models failed in gaining better outcomes since it attained the minimum F-scores of 56.18% and 78.37% respectively. Besides, the DT model managed to display a reasonable F-score of 80.19% Along with that, the LogitBoost, LR, PSO, and SVM models accomplished acceptable closer F-score values such as 80.95%, 83.41%, 88%, and 88.22% correspondingly. In line with these, both ACO and MRODC models reached near-optimal F-score values such as 90.56% and 91.34% correspondingly. But the presented DNN-AGOA model outperformed all other traditional models and attained a supreme F-score of 94.22%.
From the above-mentioned tables and figures, it is apparent that the DNN-AGOA model is an effective model for disease diagnosis. During experimentation, the DNN-AGOA model attained a maximum precision of 93.99%, recall of 94.63%, specificity of 73.34%, accuracy of 92.58%, and F-score of 94.22%. This is attributed to the inclusion of AGO in the process which fine-tuned the parameters in DNN model.
The current research work presented an automated DNN with Adagrad optimizer i.e., DNN-AGOA model for CKD and CHD risk prediction in T2DM patients. The aim of this study is to design a risk prediction model for T2DM patients who may develop CKD or CHD. This model can provide early warning to both T2DM patients and their clinicians. In this study, the input dataset was initially verified for the presence of T2DM. Subsequently, data instances with T2DM presence were processed significantly to predict the risks of CKD and CHD. Here, the sigmoid layer was held responsible for the allocation of proper class labels in applied test input. To enhance the efficiency of DNN model, the hyperparameters were tuned using Adagrad optimizer. In order to validate the effectiveness of DNN-AGOA model, benchmark medical datasets were used and the results were determined under several aspects. DNN-AGOA model achieved better performance with a maximum precision of 93.99%, recall of 94.63%, specificity of 73.34%, accuracy of 92.58%, and F-score of 94.22%. The results established the supremacy of the proposed model compared to existing models. In future, the performance can further be enhanced using advanced DL models.
Acknowledgement: This article has been published under RUSA Phase 2.0 grant sanctioned vide letter No. F. 24-51/2014-U, Policy (TN Multi-Gen), Dept. of Edn. Govt. of India, Date: 09.10.2018.
Funding Statement: The authors received no specific funding for this study.
Conflicts of Interest: The authors declare that they have no conflicts of interest to report regarding the present study.
1. G. Sebastiani, L. Nigi, G. E. Grieco, F. Mancarella, C. Ventriglia et al., “Circulating microRNAs and diabetes mellitus: A novel tool for disease prediction, diagnosis, and staging?,” Journal of Endocrinological Investigation, vol. 40, pp. 591–610, 2017. [Google Scholar]
2. Y. Zheng, S. H. Ley and F. B. Hu, “Global aetiology and epidemiology of type 2 diabetes mellitus and its complications,” Nature Reviews Endocrinology, vol. 14, pp. 88–98, 2018. [Google Scholar]
3. P. W. F. Wilson, R. B. D’Agostino, D. Levy, A. M. Belanger, H. Silbershatz et al., “Prediction of coronary heart disease using risk factor categories,” Circulation, vol. 97, no. 18, pp. 1837–1847, 1998. [Google Scholar]
4. M. Haller, G. Gutjahr, R. Kramar, F. Harnoncourt and R. Oberbauer, “Cost-effectiveness analysis of renal replacement therapy in Austria,” Nephrology Dialysis Transplantation, vol. 26, no. 9, pp. 2988–2995, 2011. [Google Scholar]
5. P. O. Blotière, P. Tuppin, A. Weill, P. Ricordeau and H. Allemand, “The cost of dialysis and kidney transplantation in France in 2007, impact of an increase of peritoneal dialysis and transplantation,” Néphrologie & Thérapeutique, vol. 6, no. 4, pp. 240–247, 2010. [Google Scholar]
6. A. S. Levey, J. Coresh, K. Bolton, B. Culleton and K. S. Harvey, “K/DOQI clinical practice guidelines for chronic kidney disease: Evaluation, classification, and stratification,” American Journal of Kidney Diseases, vol. 39, no. 2, pp. S1–S266, 2002. [Google Scholar]
7. A. S. Go, G. M. Chertow, D. Fan, C. E. McCulloch and C. Hsu, “Chronic kidney disease and the risks of death, cardiovascular events, and hospitalization,” New England Journal of Medicine, vol. 351, no. 13, pp. 1296–1305, 2004. [Google Scholar]
8. K. Orphanou, A. Stassopoulou and E. Keravnou, “Temporal abstraction and temporal Bayesian networks in clinical domains: A survey,” Artificial Intelligence in Medicine, vol. 60, no. 3, pp. 133–149, 2014. [Google Scholar]
9. J. Zhao and A. Henriksson, “Learning temporal weights of clinical events using variable importance,” BMC Medical Informatics and Decision Making, vol. 16, pp. 111–121, 2016. [Google Scholar]
10. J. Lin, E. Keogh, L. Wei and S. Lonardi, “Experiencing SAX: A novel symbolic representation of time series,” Data Mining and Knowledge Discovery, vol. 15, pp. 107–144, 2007. [Google Scholar]
11. M. J. Jardine, J. Hata, M. Woodward, V. Perkovic, T. Ninomiya et al., “Prediction of kidney-related outcomes in patients with type 2 diabetes,” American Journal of Kidney Diseases, vol. 60, no. 5, pp. 770–778, 2012. [Google Scholar]
12. C. Lin, C. Li, C. Liu, W. Lin, C. Lin et al., “Development and validation of a risk prediction model for end-stage renal disease in patients with type 2 diabetes,” Scientific Reports, vol. 7, pp. 1–13, 2017. [Google Scholar]
13. Y. Hagar, D. Albers, R. Pivovarov, H. Chase, V. Dukic et al., “Survival analysis with electronic health record data: Experiments with chronic kidney disease,” Statistical Analysis and Data Mining, vol. 7, no. 5, pp. 385–403, 2014. [Google Scholar]
14. A. Singh, G. Nadkarni, O. Gottesman, S. B. Ellis, E. P. Bottinger et al., “Incorporating temporal EHR data in predictive models for risk stratification of renal function deterioration,” Journal of Biomedical Informatics, vol. 53, pp. 220–228, 2015. [Google Scholar]
15. L. J. Koyner, A. K. Carey, P. D. Edelson and M. M. Churpek, “The development of a machine learning inpatient acute kidney injury prediction model,” Critical Care Medicine, vol. 46, no. 7, pp. 1070–1077, 2018. [Google Scholar]
16. A. Rajkomar, E. Oren, K. Chen, A. M. Dai, N. Hajaj et al., “Scalable and accurate deep learning with electronic health records,” NPJ Digital Medicine, vol. 1, pp. 18, 2018. [Google Scholar]
17. R. Vinayakumar, M. Alazab, K. P. Soman, P. Poornachandran, A. Al-Nemrat et al., “Deep learning approach for intelligent intrusion detection system,” IEEE Access, vol. 7, pp. 41525–41550, 2019. [Google Scholar]
18. M. Tang, Z. Huang, Y. Yuan, C. Wang and Y. Peng, “A bounded scheduling method for adaptive gradient methods,” Applied Sciences, vol. 9, no. 17, pp. 1–16, 2019. [Google Scholar]
19. Dataset. 2020. [Online] Available: https://archive.ics.uci.edu/ml/datasets/Chronic_Kidney_Disease. Accessed on October 16, 2020. [Google Scholar]
20. R. Fan, N. Zhang, L. Yang, J. Ke, D. Zhao et al., “AI-based prediction for the risk of coronary heart disease among patients with type 2 diabetes mellitus,” Scientific Reports, vol. 10, pp. 14457, 2020. [Google Scholar]
21. M. Elhoseny, K. Shankar and J. Uthayakumar, “Intelligent diagnostic prediction and classification system for chronic kidney disease,” Scientific Reports, vol. 9, no. 1, pp. 1–14, 2019. [Google Scholar]
22. R. T. Selvi and I. Muthulakshmi, “Modelling the map reduce based optimal gradient boosted tree classification algorithm for diabetes mellitus diagnosis system,” Journal of Ambient Intelligence and Humanized Computing, vol. 12, no. 2, pp. 1717–1730. [Google Scholar]
23. M. S. Amin, Y. K. Chiam and K. D. Varathan, “Identification of significant features and data mining techniques in predicting heart disease,” Telematics and Informatics, vol. 36, no. 1, pp. 82–93, 2019. [Google Scholar]
Training Results of Diabetes Mellitus

Training Results of Coronary Artery Disease Chronic Kidney Disease

Training Results of Chronic Kidney Disease

Testing of Medical Record

 | This work is licensed under a Creative Commons Attribution 4.0 International License, which permits unrestricted use, distribution, and reproduction in any medium, provided the original work is properly cited. |