DOI:10.32604/csse.2022.018759
| Computer Systems Science & Engineering DOI:10.32604/csse.2022.018759 | |
| Article |
Empirically Modeling Enterprise Architecture Using ArchiMate
1Graduate School of Engineering, Tokyo Institute of Technology, Tokyo, CO 1528550, Japan
2Graduate School of Informatics, Nagoya University, Nagoya, Aichi, CO 4648601, Japan
3Institute of Innovation for Future Society, Nagoya University, Nagoya University, Nagoya, Aichi, CO 4648601, Japan
*Corresponding Author: Qiang Zhi. Email: zhiqiang0728@gmail.com
Received: 20 March 2021; Accepted: 02 May 2021
Abstract: Enterprise Architecture (EA) has evolved based on the practice of information systems architecture design and implementation. EA is a rigorous description of a structure, and the objectives of EA modeling not only include clarifying corporate strategies, visualizing business processes, and modeling information systems to manage resources but also include improving organizational structures, adjusting information strategies, and creating new business value. Therefore, EA models cover a wide scope that includes both IT and business architectures. Typically, EA modeling is the initial and most important analysis step for researchers, architects, and developers. ArchiMate is the dominant modeling language for EA and it has been shown to improve visualization of EA models. However, few studies have systematically introduced general modeling methods using ArchiMate to meet a broad range of needs and few studies have empirically evaluated the modeling method using ArchiMate. This paper introduces an EA visualization approach to fill that gap and conducts a case study on a wilderness weather station system. Strict controlled experiments are conducted to verify the effectiveness and feasibility of this modeling method, and the experimental results show that this modeling procedure is not only feasible, but also can effectively transform the system metamodel and restore the EA scene.
Keywords: Enterprise architecture; system modeling; visualization methodology
Enterprise Architecture (EA) is a generic solution to a systemic and universal problem in enterprise business information management systems. More precisely, EA is a business-oriented architecture to understand, analyze, design, build, integrate, extend, operate, and manage information systems. The key to the integration of complex systems is architecture or system based integration rather than component-based integration. Effective EA is critical for the survival and success of an enterprise, and is an indispensable means for the enterprise to gain competitive advantages through IT.
The earliest incarnations of enterprise architecture came from the field of enterprise modeling. Until the mid-1980s, enterprise reengineering or enterprise modeling was primarily an academic pursuit; however, the theories and models used were usually limited to the design and development of a particular information system. In the United States, the Clinger-Cohen Act of 1996, enacted as the Information Technology Management Reform Act, led to the creation of the term “IT Architecture (ITA).” The purpose of EA is to visualize business processes and model ITA to manage resources, improve organizational structures, adjust information strategies, and create new business value. EA can be generally divided into business architecture and ITA. Most EA methods are developed from ITA, which can be further divided into requirement engineering, governance, operation, technology infrastructure, and security analysis.
Essentially, business architecture is a channel to translate an enterprise’s business strategy into daily operations. The business strategy determines the business architecture, which includes various elements, such as the business operation model, process system, organizational structure, and geographical distribution. IT architecture guides IT investment and design decisions. It is a comprehensive blueprint for establishing enterprise information systems, including data, application, and technical architectures.
Visual EA models are developed to facilitate analysis, design, development, and implementation of EAs. EA visualization raises the level of abstraction in information system design, enables verification in the early stages of system development, and gives information system designers a bird’s eye view of the business and organization. When developing large-scale projects for large enterprises, EA visualization facilitates the management of resources, policies, risks, and business processes. In both academic research and practical engineering, EA modeling methods are indispensable for EA visualization. In our previous work [1], 112 research papers on EA methods are selected for a systematic literature review to examine the current status, technical features, and unsolved challenges of EA visualization research. Although many EA modeling methods have been proposed, the application of the underlying theories is fragmented, and these methods are rarely used systematically in empirical studies. As an extension of that work, this paper introduces a detailed generic EA modeling procedure using ArchiMate [2] and presents a detailed case study to show the modeling procedure. Also, controlled experiments are conducted to verify its effectiveness.
The remainder of this paper is structured as follows. Section 2 briefly reviews previous studies related to EA modeling. Section 3 introduces the proposed EA visualization procedure and presents a detailed case study. The empirical evaluation and the discussions are described in Sections 4 and 5. Conclusions, including a summary of the contributions of this study, are provided in Section 6.
In general, EA models focus on ITA, business modeling, technology infrastructure, and security analysis. This part briefly summarizes recent EA modeling research in each area.
Modeling EA for requirements engineering (RE) is important to analyze requirements. RE is the process of defining, documenting, and maintaining requirements in the engineering design process. Quartel et al. [3] proposed an approach to integrate goal-oriented RE language with EA modeling, and described an architecture-based approach for IT valuation [4]. Mylopoulos et al. [5] proposed the TROPS framework for requirements-driven software development, and Teka et al. [6,7] compared the expressive ability of TROPS and nonfunctional requirements (NFR). Several studies have proposed EA modeling approaches to represent operation models [8–10]. In addition, many studies have focused on how to apply EA modeling to governance, such as governance enterprise architecture) (GEA) [11,12], enterprise architecture management (EAM) [13–15], and business governance [16–20]. Another research area that requires EA modeling is security analysis, and representative studies include multi-level dependencies [21], security assessment frameworks [22–26], and security assurance and analysis [27–31]. Moreover, EA modeling can be applied for specific validation or evaluation. For example, EA properties evaluation [32–37] and business application evaluation [38,39].
The alignment between business architecture and ITA is a natural alignment of two related disciplines. Business architecture represents a business in the absence of any ITA while EA provides an overarching framework for business and ITA. In application, business architecture provides a bridge between the business model and corporate strategy as well as the business functions of the enterprise. It often enables a methodology from strategy to execution. Many EA studies are related to business architectures, such as service-oriented architecture (SOA) [40–43], and IT business architecture projects [44–47].
Although there have been many research papers on EA to date, they are only applicable to specific conditions and purposes. This paper attempts to summarize a generic EA visualization method to meet the requirements for different purposes based on those fragmented modeling methods, and conducts empirical evaluations to verify its effectiveness.
3 A Generic EA Modeling Approach
Most EA studies mention their limitations, such as the scope of application, lack of empirical evaluations, lack of completeness, unclear semantics, complexity, cost, etc. Those fragmented methods were analyzed and summarized in our previous work [1]. Now, based on that work, this paper introduces a generic method using ArchiMate to model EAs based on EA scenarios.
This EA modeling procedure consists of five phases including (1) metamodel creation, (2) classification, (3) mapping, (4) reconstruction, and (5) assessment.
[Phase 1] Metamodel creation
Create a visual diagram of EA objects based on the system scenario. This scenario may be a system specification or a descriptive text.
(Step1-1) Analyze the EA scenario: An EA system scenario is used to describe how the system works with minimal technical details. Scenarios are written in plain language. For example, the scope of a scenario could be a single system, a piece of equipment, an equipped team or department, or an entire organization. The EA scenario analysis generally includes coverage analysis, dependency analysis, Interface analysis, complexity analysis, and cost analysis.
(Step1-2) Extract core artifacts from the EA scenario: In general, the core artifacts can be presented as following types [48]: strategy specification, organization/process specification, application specification, software specification, technical infrastructure specification, specification of dependencies between layers.
(Step1-3) Create object elements and the corresponding relationships based on the extracted core artifacts.
(Step1-4) Create EA metamodel: This step can generally be defined and visualized by a specific generic model of the object elements and their relationships. Creating a systemigram to represent an EA metamodel is a common method because the syntax and semantics are usually free. Notably, there should be text notes to clearly represent the relationship between elements.
[Phase 2] Classification
Classify the objects and relations from the metamodel diagram. In general, the object elements in an EA scene can be classified as actor, role, interface, collaboration, process, function, event, service, product, data object, and system software. An EA scenario can also include elements related to requirements analysis, such as goals, assessment, principle, constraints, and requirements. Typically, the relationships include composition, realization, assignment, serving, access, influence, triggering, flow, specialization, association, and junction.
(Step2-1) Classify the extracted core artifacts.
[Phase 3] Mapping
The classified elements and relationships need to be replaced by entities in ArchiMate via the mapping rules. ArchiMate has corresponding definitions for the object and relationship types mentioned in Phase 2. The mapping relationship definition should be consistent with the EA scenario.
(Step3-1) Define mapping rules to translate the metamodel objects and relations based on entities of ArchiMate.
(Step3-2) Replace the object elements and relationships with the entities of ArchiMate.
[Phase 4] Reconstruction
To improve visualization, the new EA model can be restructured following specific criteria.
Aggregation: Few EA modeling studies have mentioned the concept of aggregation; however, aggregation can effectively improve readability. In the model developed in the previous step, different types of elements were mixed; thus, the EA model is disorganized and poorly visualized. Different types of elements, such as requirements, functions, risks, applications, can be categorized and then integrated. A tree structure or an inclusion structure can be created with an aggregation. When there are multiple metamodels, they should be integrated if the intersections are not empty.
Decomposition: Similar to technical models of components and devices, information models can be decomposed from high-level concepts to details. The elements and relationships in metamodels are often abstract. Increasing the amount of EA information is an important part of the visualization process that can be achieved by decomposing and subdividing these elements. Typically, structure trees are used to decompose aggregation or composition relationships into multiple levels. A tree structure is a convincing representation of the scope that can be reviewed by stakeholders and serves as a guide for the entire program. Gaps or out of range characteristics should be identified as early as possible, and the tree can be modified to reflect these characteristics. Out of range features can be retained as part of the tree; however, they should be annotated in some way to indicate that they are out of range, such as by using specific mapping definitions or different colors. Element and relationship decomposition requires the definition of new elements and relationships.
Multiple layers: To improve readability and maintainability, the new EA model can be reorganized into different layers. Classic EA includes business, data, application, and technology layers [49]. There are also some derived layering methods such as GEA, EAM, as well as specific layering methods for specific purposes. However, ArchiMate retains the business, application, and technology layers and introduces a motivation layer into EA models to facilitate application to most EA scenarios. Most of the element objects from the other layers, such as data, manage, environment layers, can be assigned to the introduced four-layers EA model: (1) Motivation layer: mainly includes strategy, goals, functional and nonfunctional requirements, and risks. (2) Business layer: mainly includes business logic, business actors, business service, and business processes. It represents a business to the customer and is also relevant to internal-facing organizations. (3) Application layer: it is generally between the business and technology layers. The application layer is essential in a complete EA model, i.e., both business and IT architectures. (4) Technology layer: it describes system software applications and infrastructure. Although it may be not necessary to define the technology layer in detail in a business model, it is indispensable in ITA.
The reconstruction phase can be summarized as follows.
(Step4-1) Integrate EA entities with same properties and retain different entities.
(Step4-2) Decompose EA entities to reflect detailed characteristics (if necessary).
(Step4-3) Improve visualization through layering.
(Step4-4) Integrate EA diagram with the extended analysis diagrams (if necessary).
[Phase 5] Assessment
In an EA scenario, a clear set of vision, tasks, and processes is often required. The effectiveness of an EA model can be measured by how EA artifacts reflect EA scenarios. This phase evaluates whether the developed EA model can clearly and effectively represent the EA scenario.
(Step5-1) Check object elements and relationships.
(Step5-2) Check object elements’ mappings and relationships’ mappings.
(Step5-3) Restore the EA scenario based on the new model.
[Extended EA Analysis]
Sometimes some additional analysis is necessary for various purposes, e.g., assurance cases [50], security analyses, and NFR quantitative evaluations. In general, assurance cases and system architecture diagrams are developed separately. When assurance case objects are the elements of the system architecture diagram, two types of diagrams need to be developed simultaneously, and gaps may occur when the two diagrams are manipulated. Therefore, integrating the system architecture diagram and the assurance case diagram into a single diagram should be considered (Fig. 1). An assurance case is generally developed using goal structuring notation (GSN), therefore, the proposed EA modeling approach is also applicable to an assurance case. The relationship between the element in the system architecture and the evidence in the assurance case can be presented as a “realize relation.”
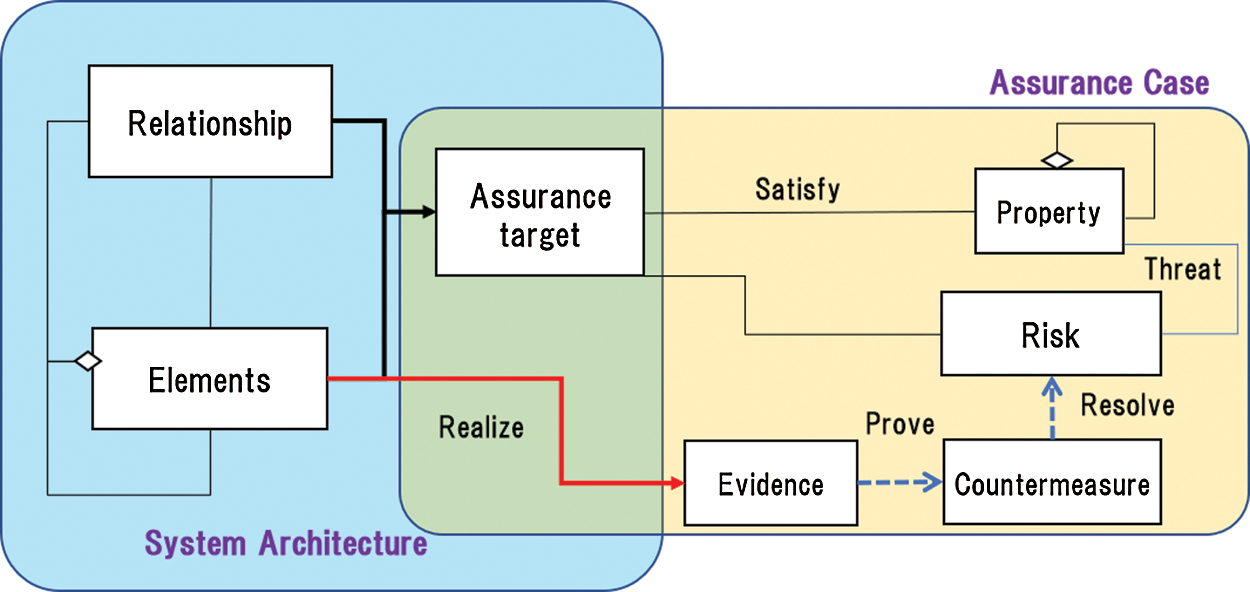
Figure 1: Integration of system architecture and assurance case diagrams
Assurance cases can also be extended for NFR quantitative evaluations and security analyses. With weighted evaluations, the general practice is to assign weight values to the elements or relationships of the model [51,52]. When the target system is a system with complex state transitions, the interactions in the system will become important. However, in such a scenario, it is necessary to verify explicitly that these interrelations are correctly expressed since EA or system models generally need to be modeled manually. Zhi et al. [53] proposed an approach to model such systems with model checking to visualize complex interactions. The EA modeling procedure can be summarized as Fig. 2.

Figure 2: Generic procedure of EA model development
EA model transformation based on a wilderness weather station system has been discussed in our previous work [54]. Here, a similar target system is used as the case study. Such weather stations are deployed by the government of a country with large areas of wilderness to help monitor climate change and improve the accuracy of weather forecasts in remote areas [55]. The EA scenario of a wilderness weather station system can be summarized as follows.
(1) The weather station system collects data from a set of instruments that measure temperature, pressure, sunshine, rainfall, wind speed, and wind direction. (2) The weather station system collects meteorological data, performs some initial data processing, and transmits the data to the data management system. (3) The data management and archiving system collects the data from all wilderness weather stations, carries out data processing and analysis, and archives the data in a form that can be retrieved by other systems, such as weather forecasting systems. (4) The station maintenance system can communicate by satellite with all wilderness weather stations to monitor the status of these systems and provide reports of problems. It can update the embedded software in these systems. In the event of system problems, the station maintenance system can also be used to control a wilderness weather system remotely. (5) The weather station system includes a number of instruments that measure weather parameters, such as wind speed and direction, ground and air temperatures, barometric pressure, and rainfall over a 24-h period. Each instrument is controlled by a software system that takes parameter readings periodically and manages the collected data. Wildness weather stations are battery-powered and must be entirely self-contained. All communications are through a relatively slow-speed satellite link, and the weather station must have a mechanism (solar or wind power) to charge its batteries. (6) The potential risks, availability of devices and security of data should be fully considered.
Now apply the EA method to the wilderness weather station system using ArchiMate. First, core artifacts are extracted from the EA scenario after analyzing the EA scenario. Then a systemigram is created as a metamodel of the system (Fig. 3). It is also necessary to define the mapping between the elements and relations of the metamodel and the ArchiMate modeling language. A complete four-layer model is given, but this is not necessary for all EA scenarios. To classify the elements and relationships according to the characteristics of each layer, system software should be allocated to technology architecture (TA), and corresponding applications and services should be in application architecture (AA) and business architecture (BA). Application goals, requirements, and risks should be discussed in relation to the motivation architecture (MA). The elements and relationships in the system diagram are aggregated and decomposed according to the properties of each layer, and then new elements and relationships for decomposition are defined. Typically, the aggregation and decomposition process requires sufficient knowledge of the system. The core artifacts, classification, and mapping results are presented in Tab. 1.
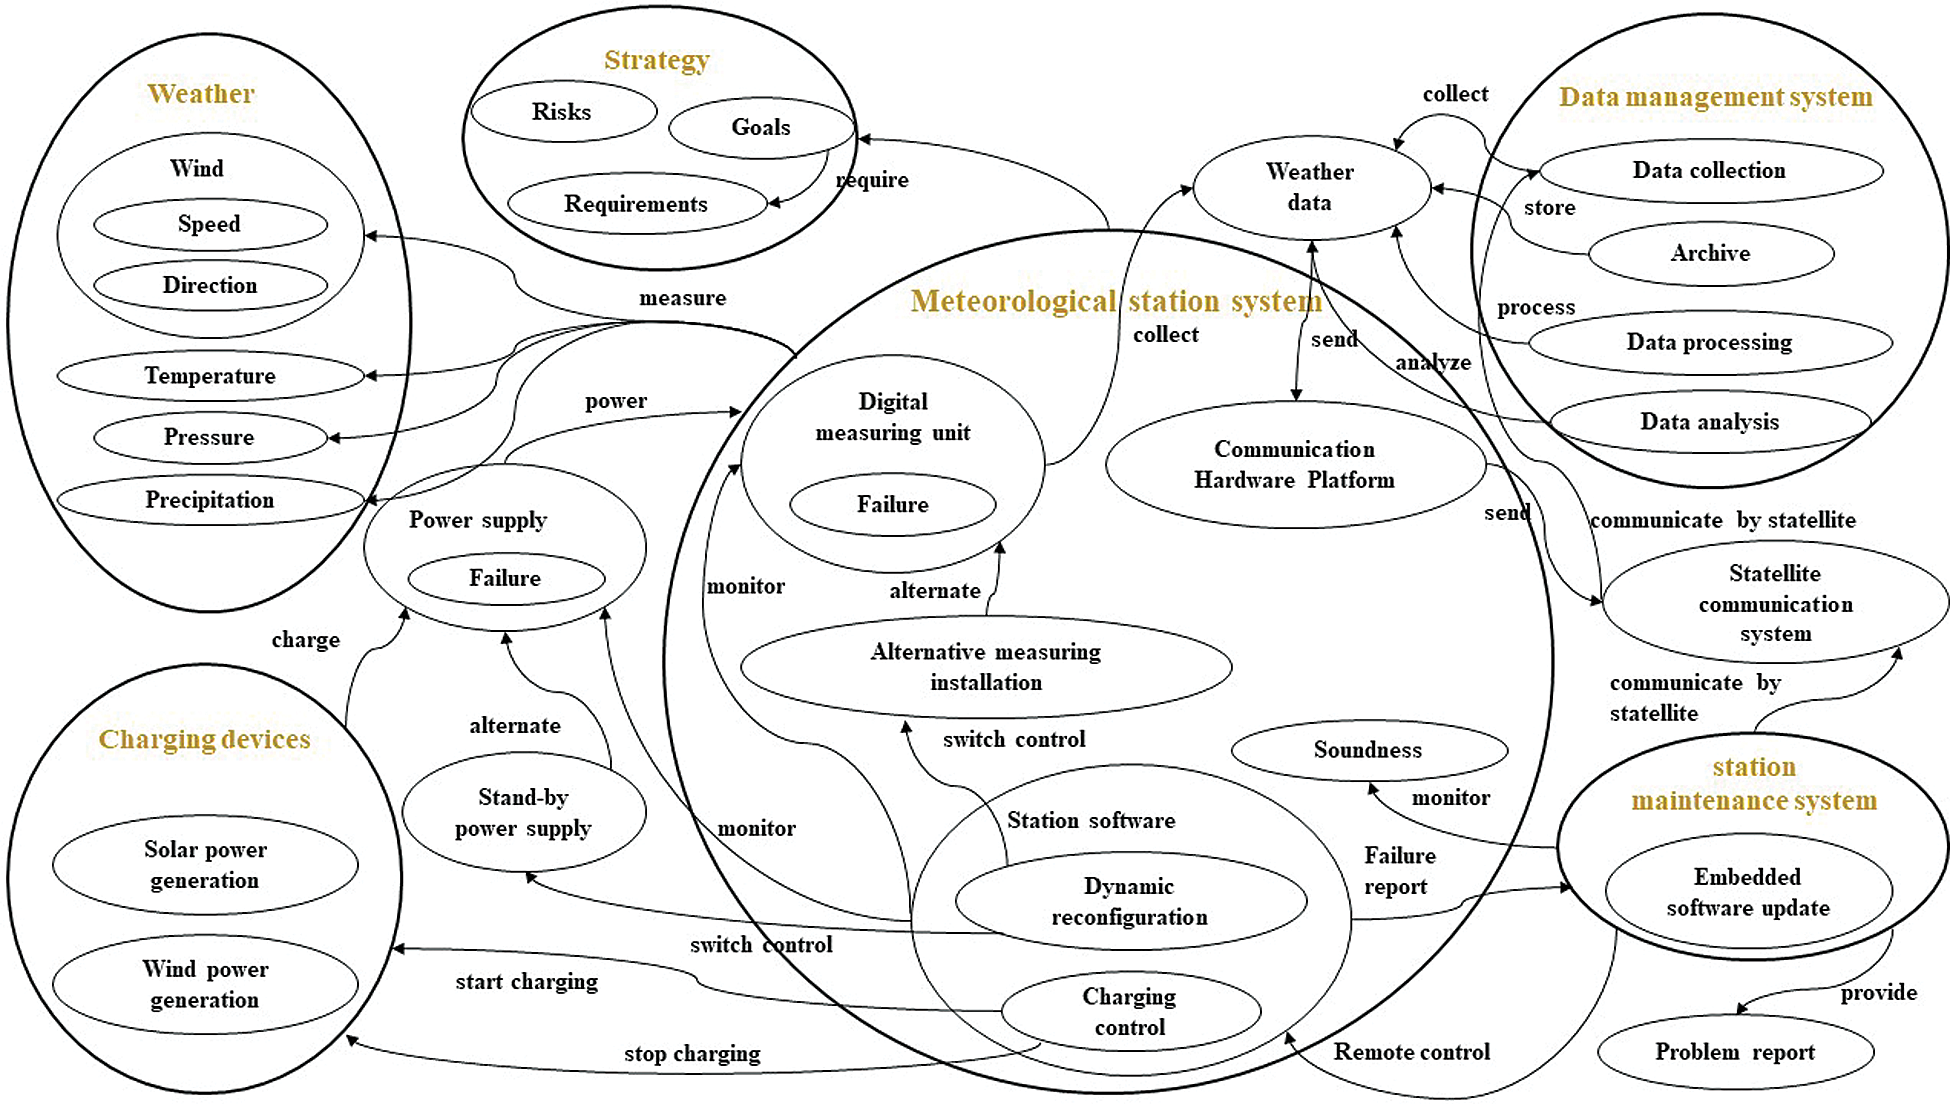
Figure 3: Systemigram of the wilderness weather station system
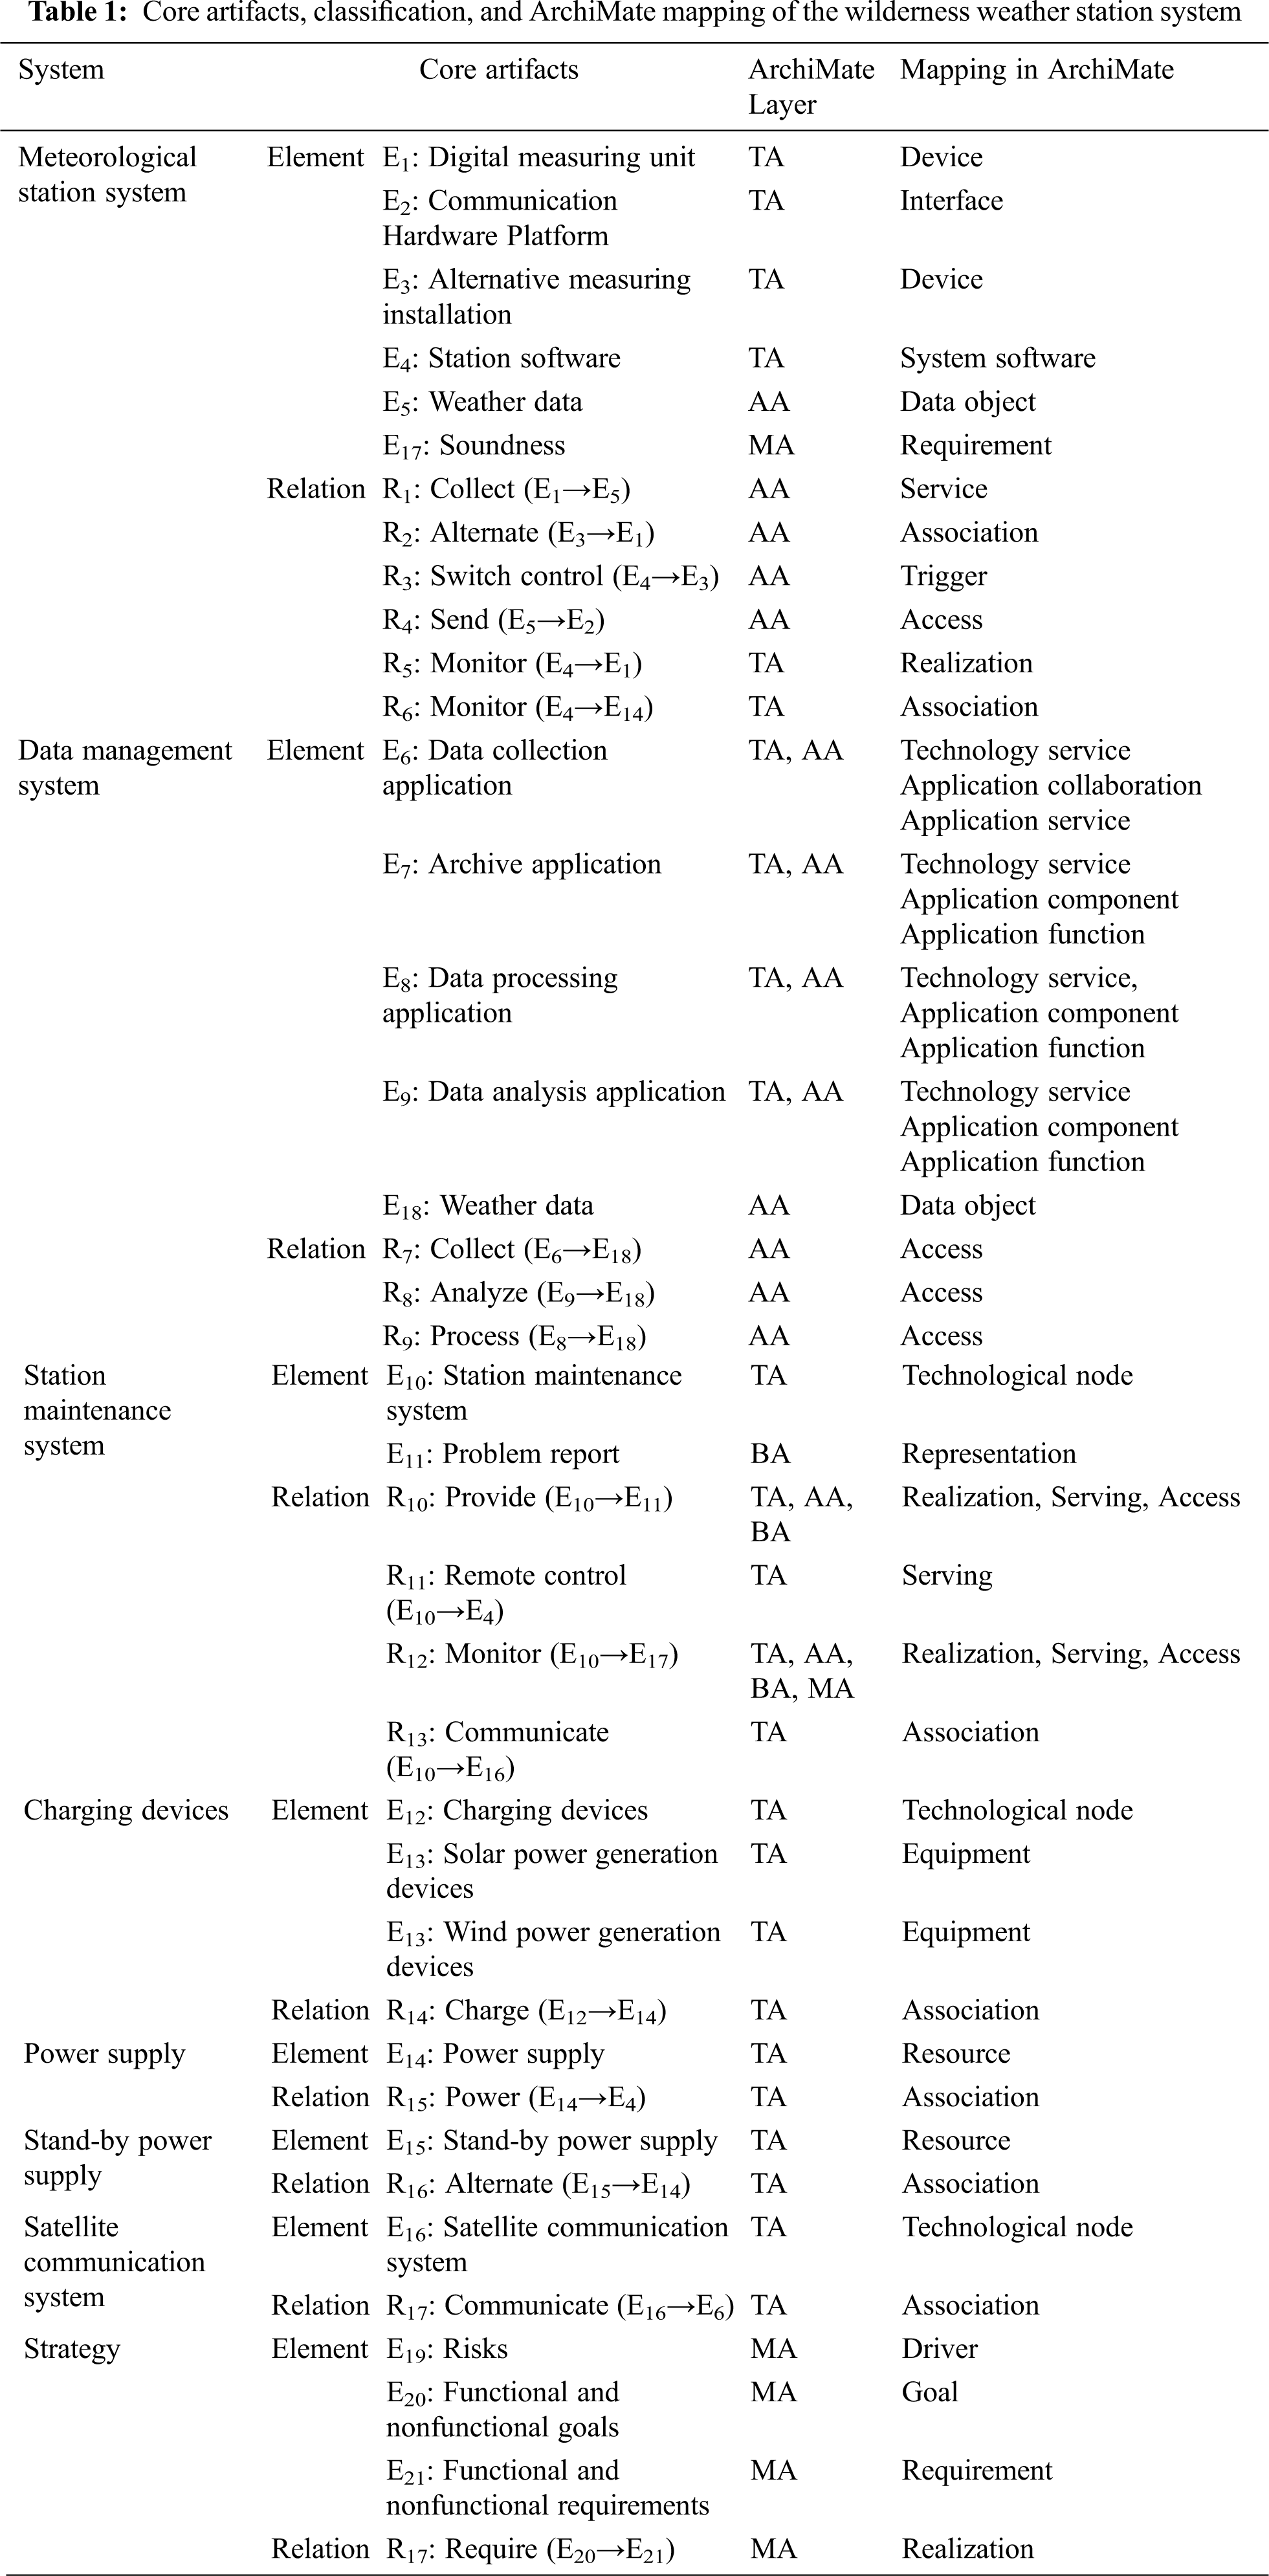
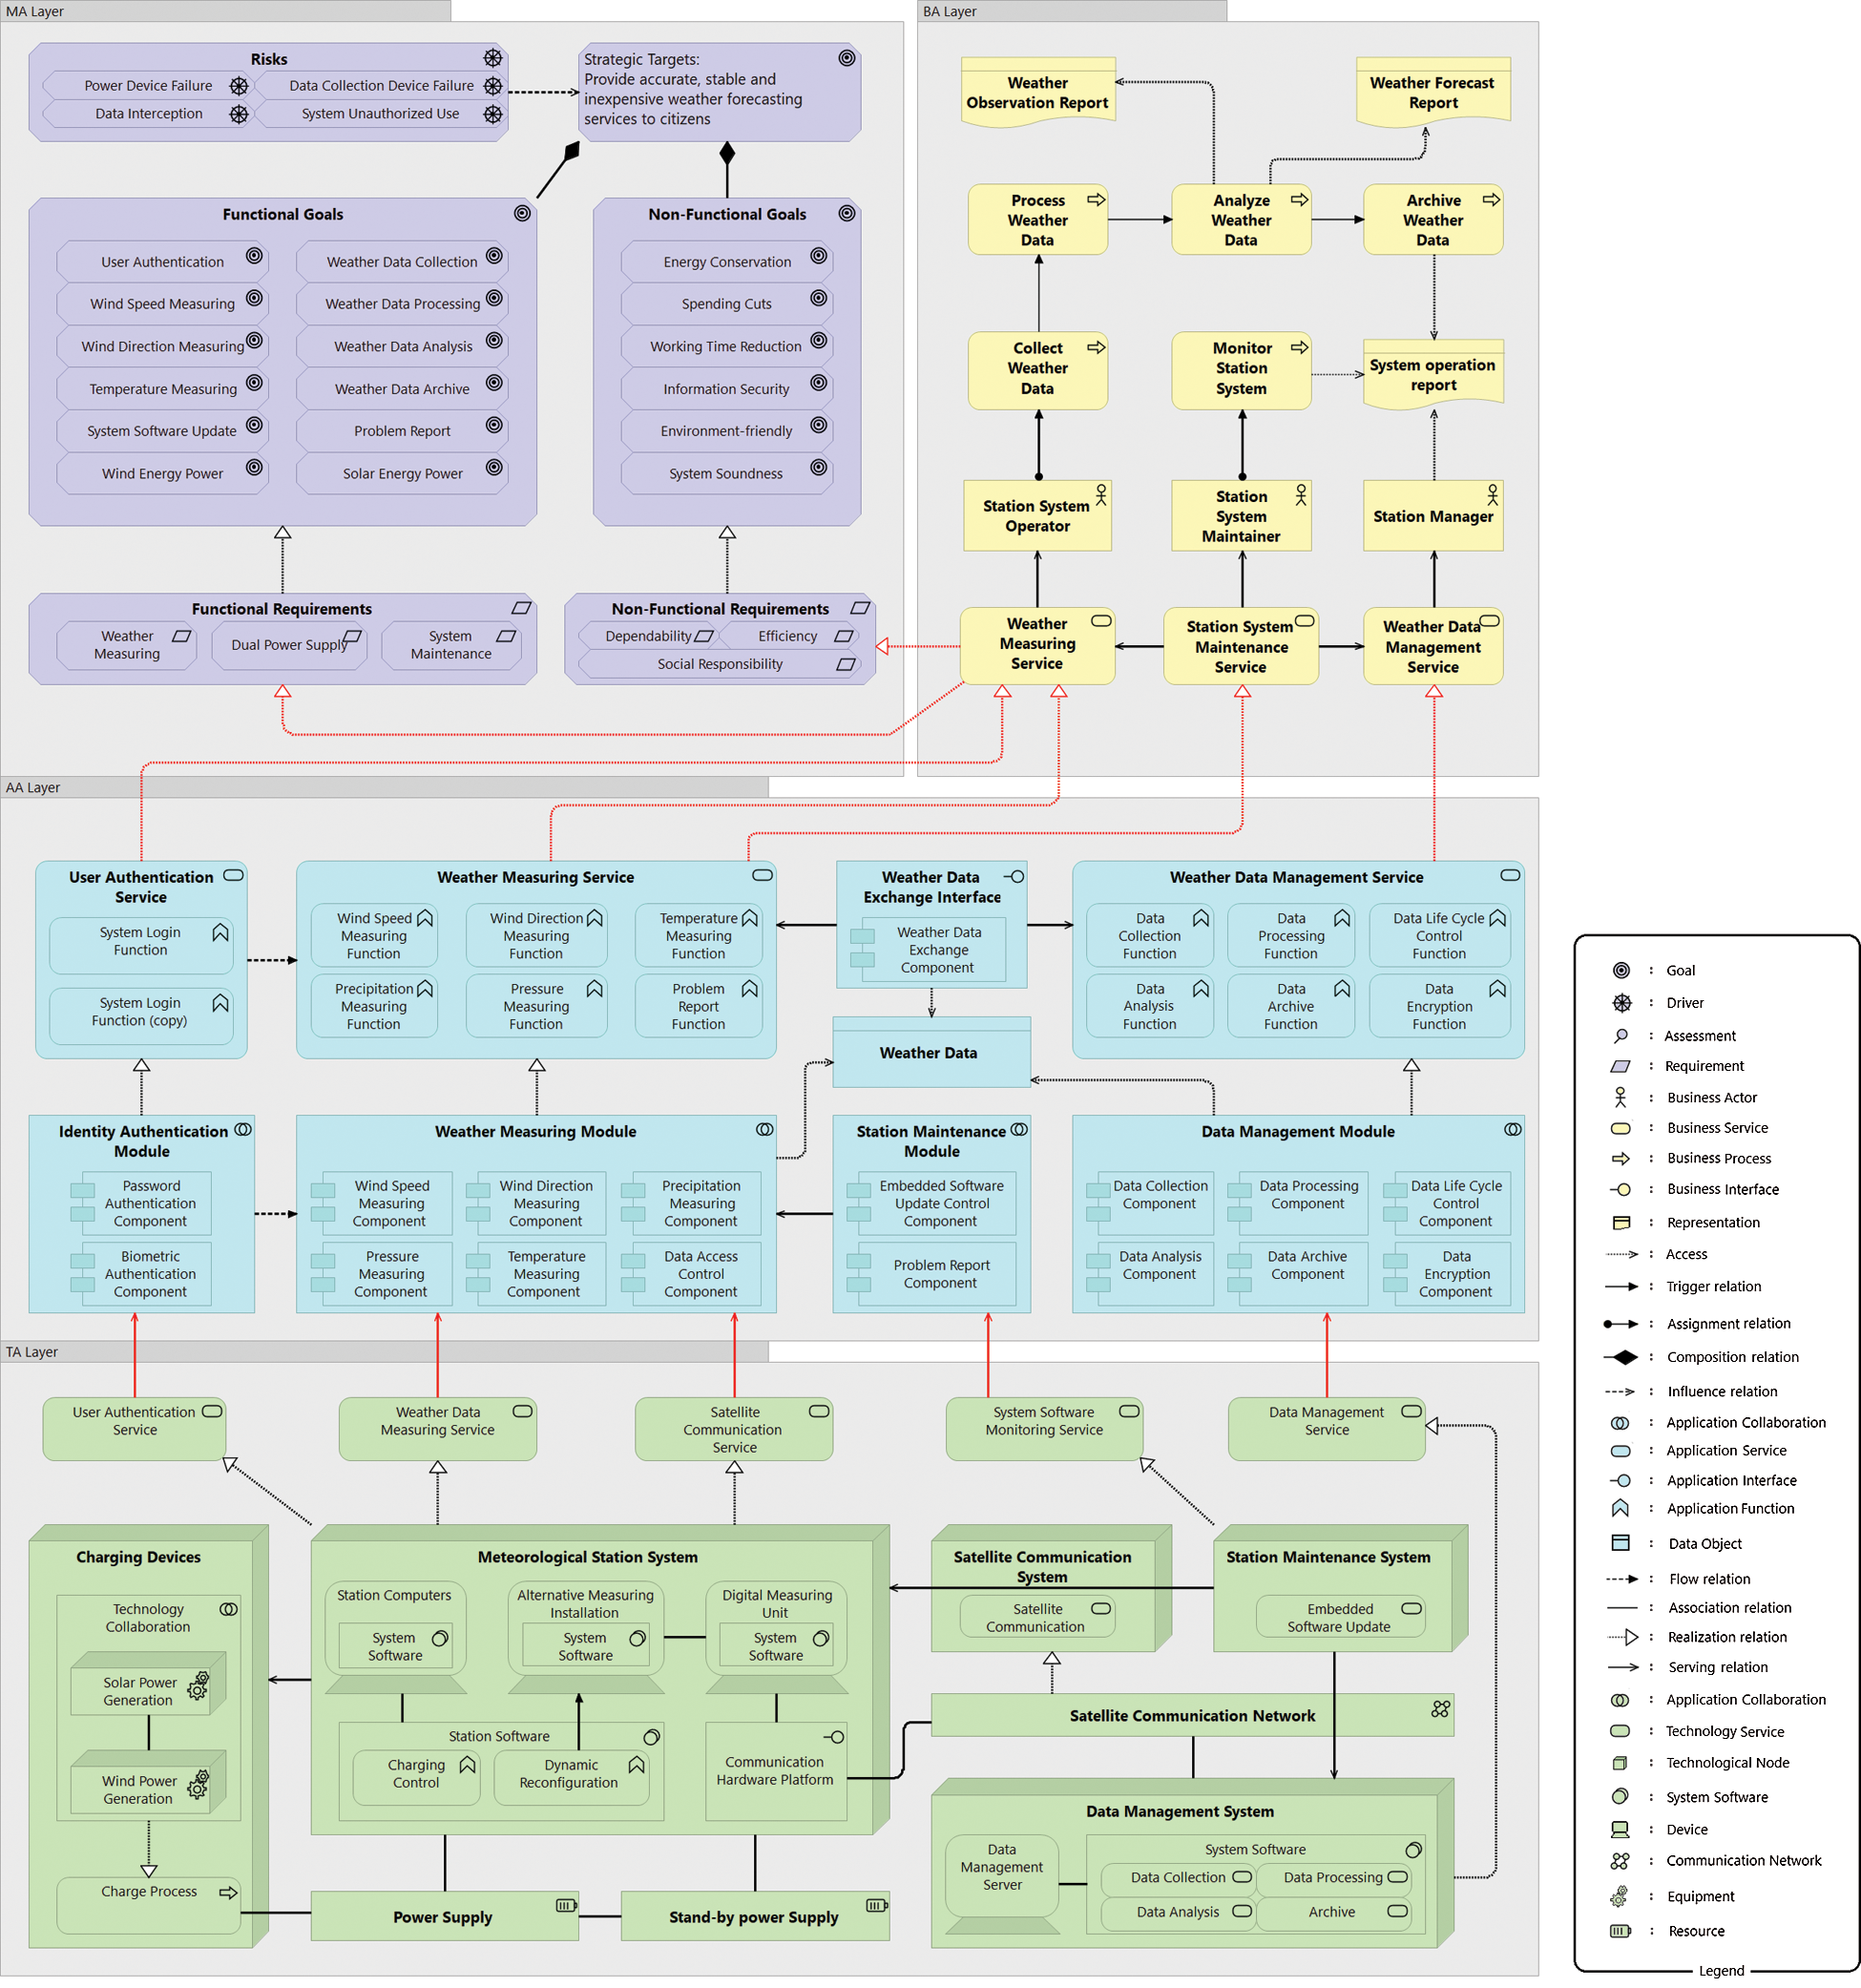
Figure 4: EA model of the wilderness weather station system in ArchiMate
The EA models for the wilderness weather station system in ArchiMate representation are shown in Fig. 4. Information coverage ratio is used to measure the visualization capability of the developed EA model. The information coverage ratio is defined as the total number of specific nouns and verbs of the domain contained in the EA model, divided by the total number of specific nouns and verbs of the domain contained in the aforementioned enterprise scenario of the system.
Controlled experiments are conducted to verify the effectiveness of the EA modeling approach. Sixteen software engineers and eight graduate students were invited to participate in the experiments, and then they were divided into four groups (Groups A, B, C, and D) for comparative experiments.
Prior to implementing the controlled experiments, three hypotheses are formulated.
[Hypothesis 1]: Using the introduced method to model system scenarios is feasible.
[Hypothesis 2]: A metamodel can be transformed based on the modeling procedure.
[Hypothesis 3]: The EA model derived from the modeling procedure is sufficient to restore the EA scenario.
The experiment process to evaluate the proposed method is designed as follows.
System introduction: Only members of Group A received a 15-min explanation of the target system—the wilderness weather station system (in the case study of Section 3).
Method seminar: The members of all groups received a one-hour seminar on system architecture modeling methods (modeling system architecture from system scenarios) and the proposed EA methods. The members of all groups took part in a 90-min seminar to familiarize them with the basics of ArchiMate.
Pre-experiment: A pre-experiment was conducted to determine the time-limited term under time pressure conditions.
Group experiment: An experiment was prepared for each of the four groups. The assigned tasks were as follows. Members of Group A performed EA modeling of the target system using the introduced EA methodology based on the target system scenario. Members of Group B transformed the systemigram (Fig. 3) based on the introduced EA methodology. Members of Group C restored the system scenario based on the systemigram (Fig. 3). Members of Group D restored the target system scenario based on the proposed target system model (Fig. 4). The simplified wilderness weather station system scenario has been described in the case study section. The time limits for Groups A and B, Groups C and D were 90 and 60 min, respectively. An overview of the controlled experiment is shown in Fig. 5.
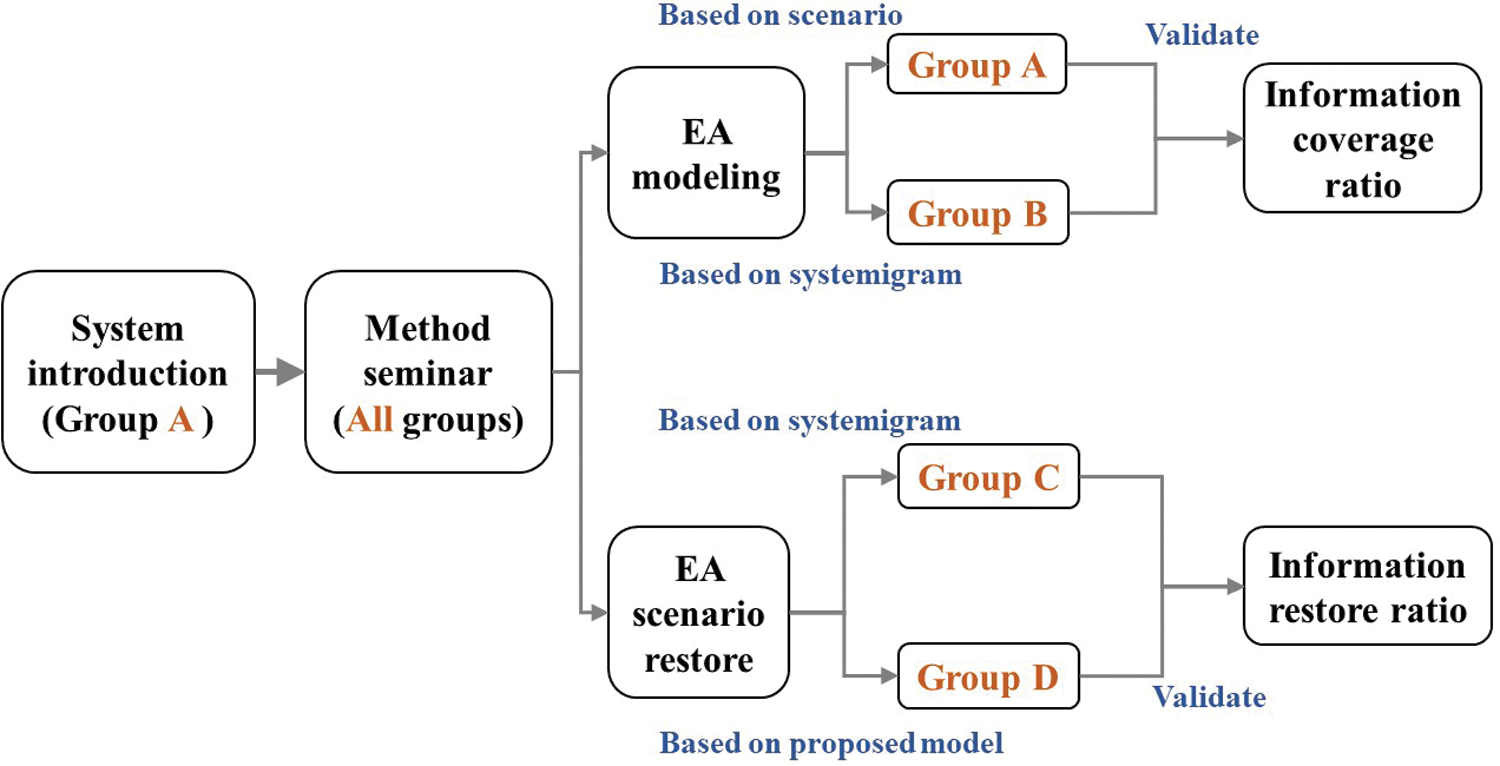
Figure 5: Overview of the controlled experiment
The evaluation criterion for Group A was the information coverage ratio (Tab. 1). The evaluation criterion for Group B was also the information coverage ratio; however, in this case, the comparison object was the systemigram rather than the system scenario. For Groups C and D, the evaluation criterion was the information restore ratio. All created scenarios were scored on a ten-point scale by an independent system design expert not associated with the research or the experiment.
Sixteen software engineers with knowledge of EA modeling and eight graduate students majoring in software engineering participated in the experiment. For the software engineers, we planned and experimented a training seminar as an empirical investigation. The seminar met both our and the participants’ objectives. The goal of the seminar was for the software engineers to gain knowledge and skills, i.e., EA visualization modeling methodology. Our purpose was to analyze the feasibility with practitioners as the object. For the students, the experiment was conducted in weekly student seminars.
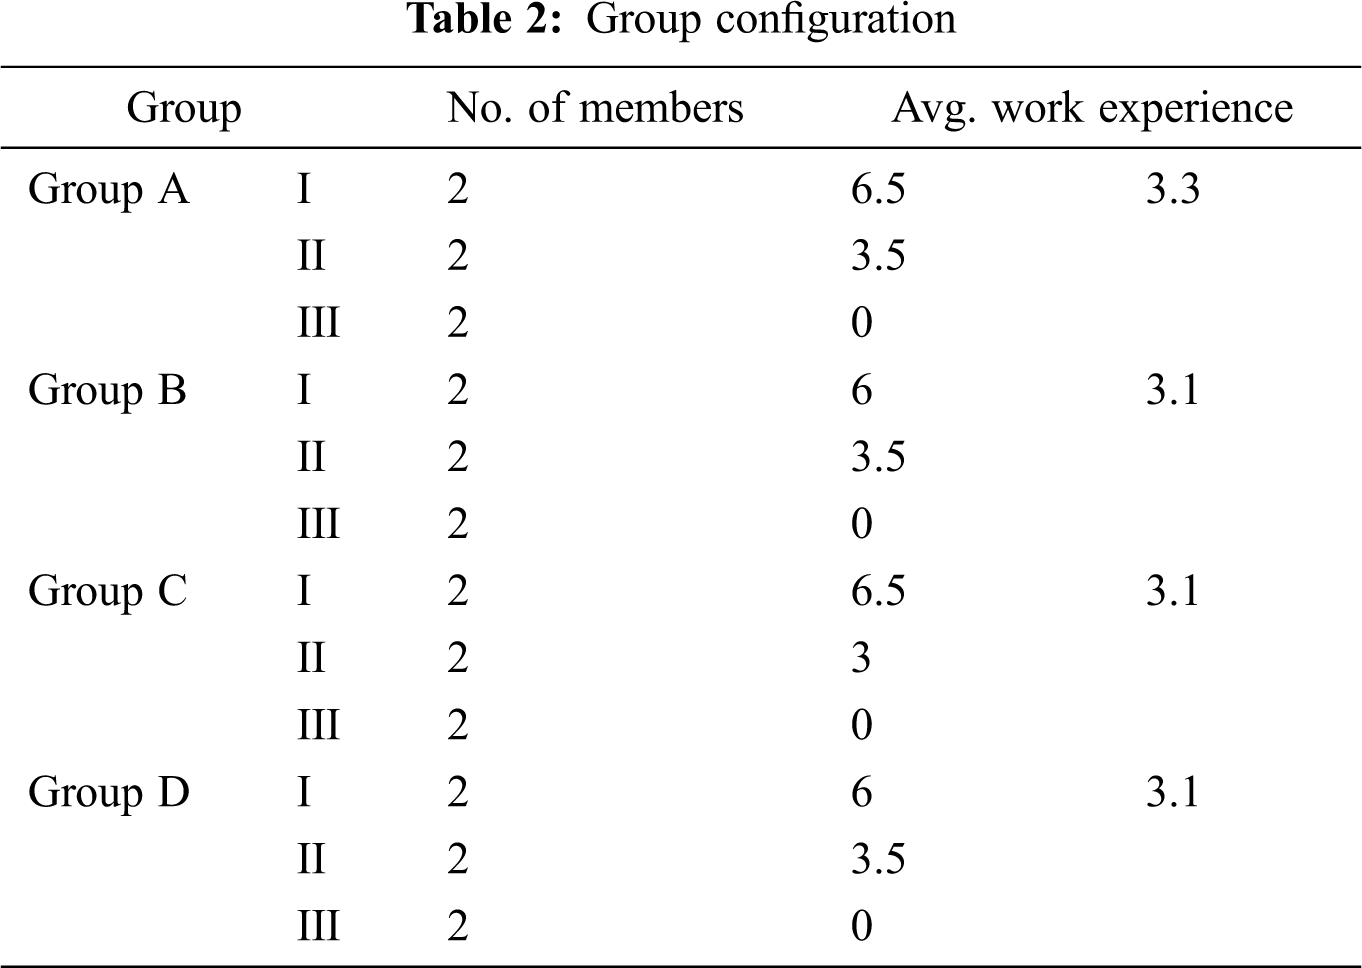
The subjects were divided into three teams according to their work experience: Team I, more than five years; team II, 0–5 years; team III: students. To make the experimental results objective, all subjects were single-blind. The group configurations of this experiment are shown in Tab. 2. A t-test showed that there was no significant difference in experience (α = 0.05) between each group.
The experimental results for Groups A and B are summarized in Tab. 3. The information coverage ratio of system elements and relationships was calculated. The experimental results for Groups C and D are summarized in Tab. 4. In addition to the evaluation scores by the system design expert, the information restore ratio of the system elements and the relationships were also calculated based on their created scenarios. The calculations were performed without knowing any information about the subjects. The total restore rates for Groups C and D are compared in Fig. 6.
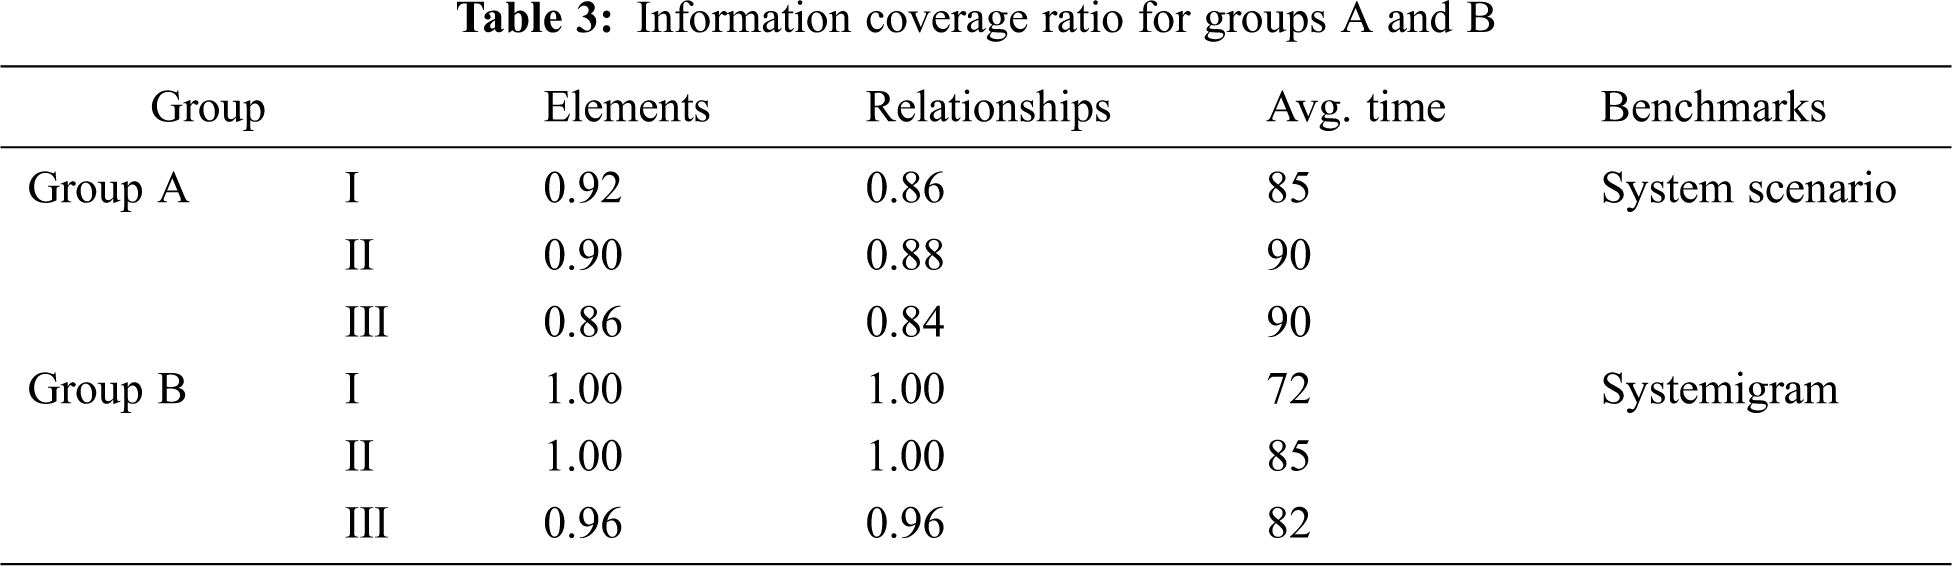
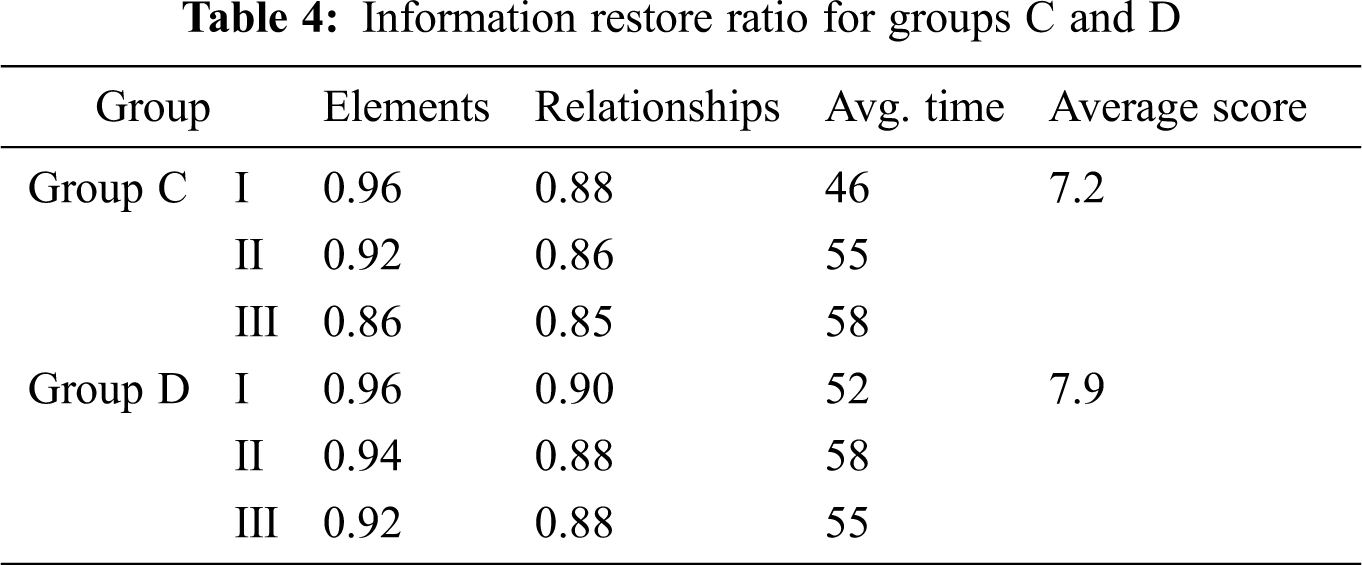
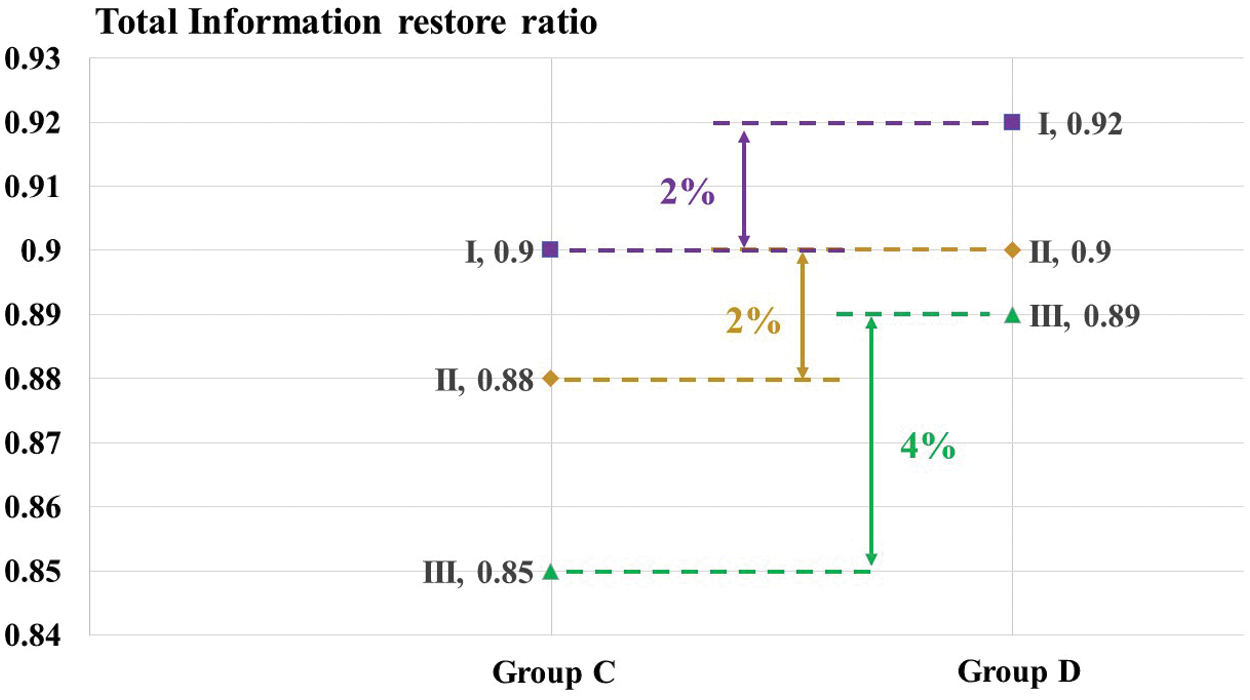
Figure 6: Total restore rate comparison between Groups C and D
In this section, experimental results are analyzed to test the stated hypotheses.
[Hypothesis 1]: The members of Group A knew the target system scenario, and they modeled the system architecture with the introduced procedure. Hypothesis 1 can be confirmed according to the experimental results: the created EA models have a high information coverage ratio (Tab. 3).
[Hypothesis 2]: The members of Group B did not know the target system, and they modeled the system architecture with the introduced EA model method based on a systemigram. They also achieved a good performance (Tab. 3). The results demonstrate that a systemigram can be transformed into an ArchiMate model.
[Hypothesis 3]: Groups C and D created the system scenarios based on the introduced systemigram and the EA model. The scenarios created by Group D have high information restore rate. Therefore, the results demonstrated that the introduced method does not reduce the readability of EA model and is efficient in understanding system scenarios. Group D outperformed Group C; however, the difference was minimal (Fig. 6). This may be due to two reasons: (1) the standard answers we set only contain the major elements and relationships (specific nouns and verbs), and (2) the target system is less complex. Furthermore, Group D’s scenarios achieved a higher average score from the system design expert, which indicates that the scenario created based on the introduced EA model shows more comprehensive information.
As the sample size was relatively small, the independent sample t-test was used to analyze the experimental results for each group, the test results showed that experienced engineers perform better than inexperienced students.
To verify the effectiveness of the introduced EA visualization method, three hypotheses were postulated and four controlled experiments were designed to verify these hypotheses. According to the experimental results, the introduced EA visualization method is feasible and effective.
UML is the most commonly used EA modeling language for the large software companies in Japan, while systemigram is favored by smaller companies. These modeling methods usually have neither uniform rules nor obvious defects, and most companies have used them for many years. To carry out further empirical research, a questionnaire is designed and an anonymous questionnaire survey is conducted on all 16 software engineers who participated in the experiments.
Questionnaire: the practicability, necessity, adaptability, promotion value, and persuasiveness of the introduced EA modeling method were queried. Participants responded to the questions using a five-point scale: (1) strongly disagree; (2) disagree; (3) neither agree nor disagree; (4) agree; (5) strongly agree. The responses were assigned 1-5 point, respectively. On average, all questions received positive results. Among them, the promotion value score was the highest, which means that the participants think that the introduced generic modeling method is instructive. The lowest score was the necessity, which indicates that participants felt that this method was not urgently needed for their current work. The questionnaire results are presented in Fig. 7.
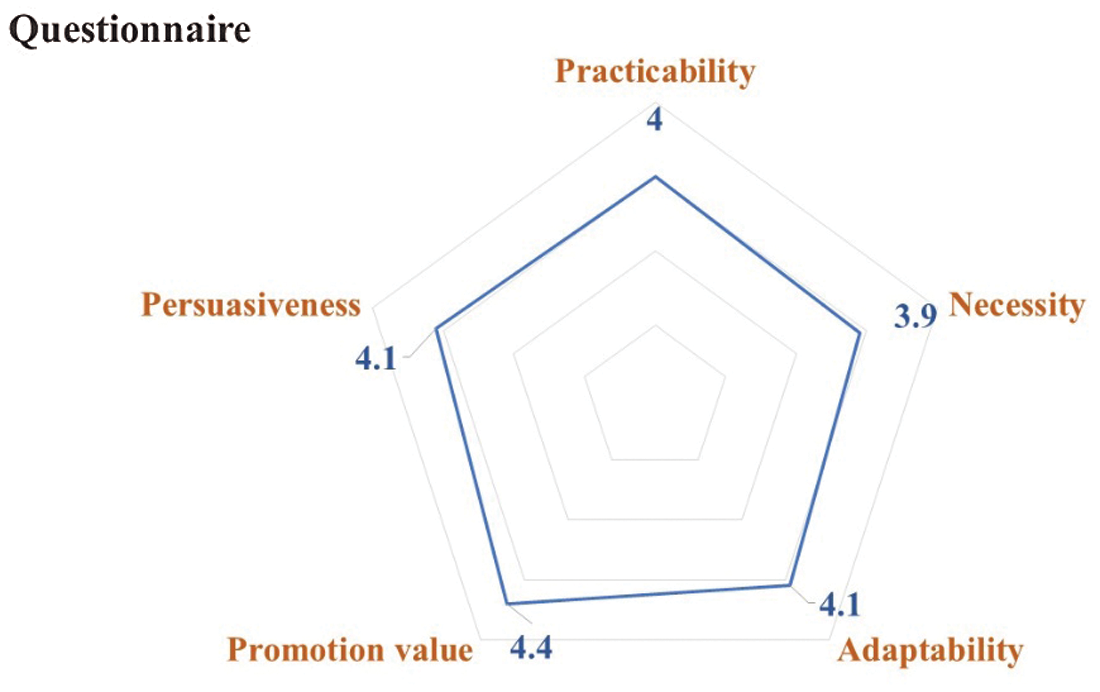
Figure 7: Questionnaire results
5.2.1 EA Visualization Procedure
A systematic review of the existing literature to analyze existing EA modeling methodologies is conducted in our previous work. This paper first introduced a detailed generic EA visualization procedure by summarizing these existing fragmented methodologies. A detailed case study was conducted to enhance the understanding. In the case study, a simplified system scenario and the corresponding metamodel (systemigram) were introduced. Then, according to the modeling method, ArchiMate modeling language was used to define the system elements and relationships in detail and restructure them into a well-visualized model. However, the target system is less complex, and a more extensive EA scenario may be required to verify effectiveness.
Experiments were conducted with software engineers and graduate students majoring in software engineering as the subjects to evaluate the effectiveness of the proposed approach. To validate the experiments, the following issues should be considered: whether the constituent elements of the experiment can be guaranteed; how a human-oriented experiment affects the effectiveness; and whether the experimental results can be extended to an actual working environment. The subjects were divided into four groups according to their work experience, and there is no significant difference in the work experience. The experiments for each group were designed and carried out independently. Due to the small scale of the system used in the experiments, the experimental results may not be generalizable. However, the target system can be considered as a part of a large EA scene. Indeed, large-scale EA scenarios are often decomposed according to certain criteria before modeling.
This paper presents a general modeling methodology to improve the visualization of EA models. To the best of our knowledge, this is the first empirical study that introduces a general EA visualization procedure using ArchiMate. The contributions of this study are summarized as follows: (1) Based on the previous systematic literature review, a detailed EA modeling procedure is introduced that uses ArchiMate for general use. (2) A detailed case study is carried out to show the modeling procedure. (3) Controlled experiments are conducted with 24 subjects to verify the feasibility of the modeling procedure, and the experimental results confirmed that it is feasible to use the introduced method to model system scenarios. Besides, the experimental results also show that a metamodel (systemigram) can be transformed to an ArchiMate model based on the modeling procedure, and the EA model derived from the modeling procedure is sufficient to restore the EA scenario. However, it should be mentioned that this EA visualization approach may not be applicable to some novel EA modeling concepts, such as augmented reality EA modeling, virtual reality EA modeling, and 3D EA modeling.
Acknowledgement: We would like to thank the Nagoya University students and Sumitomo Electric Industries software engineers for their cooperation.
Funding Statement: This work was supported by 2020 TSUBAME project of Tokyo Institute of Technology.
Conflicts of Interest: The authors declare that they have no conflicts of interest to report regarding the present study.
1. Z. Zhou, Q. Zhi, S. Morisaki and S. Yamamoto, “A systematic literature review on enterprise architecture visualization methodologies,” IEEE ACCESS, vol. 8, pp. 96404–96427, 2020. [Google Scholar]
2. The Open Group, The ArchiMate 3.1 Specification, 2019. [Google Scholar]
3. D. Quartel, W. Engelsman, H. Jonkers and M. V. Sinderen, “A goal-oriented requirements modelling language for enterprise architecture,” in IEEE Int. Enterprise Distributed Object Computing Conf., Auckland, New Zealand, pp. 3–13, 2009. [Google Scholar]
4. D. Quartel, M. Steen and M. M. Lankhorst, “Application and project portfolio valuation using enterprise architecture and business requirements modelling,” Enterprise Information Systems, vol. 6, no. 2, pp. 189–213, 2012. [Google Scholar]
5. J. Mylopoulosand J. Castro, “Tropos: A framework for requirements-driven software development,” Information Systems Engineering: State of the Art and Research Themes, 1st ed., Berlin, Germany, Springer-Verlag, pp. 261–273, 2000. [Google Scholar]
6. A. Teka, N. Condri-Fernandez, I. Kurtev, D. Quartel and W. Engelsman, “Change impact analysis of indirect goal relations: Comparison of NFR and TROPOS approaches based on industrial case study,” in IEEE Int. Workshop on Model-Driven Requirements Engineering, Chicago, pp. 58–67, 2012. [Google Scholar]
7. A. K. Jallow, P. Demian, C. J. Anumba and A. N. Baldwin, “An enterprise architecture framework for electronic requirements information management,” International Journal of Information Management, vol. 37, no. 5, pp. 455–472, 2017. [Google Scholar]
8. M. Vicente, N. Gama and M. M. D. Silva, “Using ArchiMate to represent ITIL metamodel,” in IEEE Conf. on Business Informatics, Vienna, Austria, pp. 270–275, 2013. [Google Scholar]
9. N. Siva, M. M. D. Silva, B. Barafort, M. Vicente and P. Sousa, “Using ArchiMate to model a process assessment framework,” in Proc. of the 30th Annual ACM Symp. on Applied Computing, New York, pp. 1189–1194, 2015. [Google Scholar]
10. G. Emmanuel, S. S. Kusumawardani and R. Ferdiana, “The requirements analysis of Elisa business architecture with education enterprise architecture perspective,” in Int. Conf. on Science and Technology, Yogyakarta, Indonesia, pp. 1–6, 2018. [Google Scholar]
11. V. Peristeras and K. Tarabanis, “Governance enterprise architecture (GEADomain models for e-governance,” in Proceedings of Int. Conf. on Electronic Commerce, New York, pp. 471–479, 2004. [Google Scholar]
12. S. Zhang, S. Yang and J. Song, “Research on collaborative IT governance model oriented to business architecture,” in Proc. of IEEE Int. Conf. on Computer Supported Cooperative Work in Design, Whistler, BC, Canada, pp. 116–120, 2013. [Google Scholar]
13. S. Buckl, A. M. Ernst, F. Matthes, R. Ramacher and C. M. Schweda, “Using enterprise architecture management patterns to complement TOGAF,” in IEEE Int. Enterprise Distributed Object Computing Conf., Auckland, New Zealand, pp. 34–41, 2009. [Google Scholar]
14. F. AhlemannEric, E. Stettiner, M. Messerschmidt and C. Legner, Strategic enterprise architecture management. Berlin, Germany: Springer-Verlag, 2012. [Google Scholar]
15. S. Hanschke, J. Ernsting and H. Kuchen, “Integrating agile software development and enterprise architecture management,” in Hawaii Int. Conf. on System Sciences, HI, USA, pp. 4099–4108, 2015. [Google Scholar]
16. M. Iacob, D. Quartel and H. Jonkers, “Capturing business strategy and value in enterprise architecture to support portfolio valuation,” in IEEE Int. Enterprise Distributed Object Computing Conf., Beijing, China, pp. 11–20, 2012. [Google Scholar]
17. A. Luo, J. Fu and J. Liu, “An impact analysis method of business processes evolution in enterprise architecture,” in Int. Conf. on Progress in Informatics and Computing, Shanghai, China, pp. 733–737, 2016. [Google Scholar]
18. K. Hinkelmann, A. Gerber, D. Karagiannis, B. Thoenssen, A. van der Merwe et al., “A new paradigm for the continuous alignment of business and IT: Combining enterprise architecture modelling and enterprise ontology,” Computers in Industry, vol. 79, pp. 77–86, 2016. [Google Scholar]
19. P. Gomes, G. Cadete and M. M. D. Silva, “Using enterprise architecture to assist business continuity planning in large public organizations,” in IEEE Conf. on Business Informatics, Thessaloniki, Greece, pp. 70–78, 2017. [Google Scholar]
20. A. Aldea, M. Iacob and D. Quartel, “From business strategy to enterprise architecture and back,” in IEEE Int. Enterprise Distributed Object Computing Workshop, Stockholm, Sweden, pp. 145–152, 2018. [Google Scholar]
21. P. Bahl, R. Chandra, A. Greenberg, S. Kandula, D. A. Maltz et al., “Towards highly reliable enterprise network services via inference of multi-level dependencies,” in Proc. of the 2007 Conf. on Applications, Technologies, Architectures, and Protocols for Computer Communications, Kyoto, Japan, pp. 13–24, 2007. [Google Scholar]
22. T. Sommestad, M. Ekstedt and P. Johnson, “Combining defense graphs and enterprise architecture models for security analysis,” in Int. IEEE Enterprise Distributed Object Computing Conf., Munich, Germany, pp. 349–355, 2008. [Google Scholar]
23. U. Franke, W. R. Flores and P. Johnson, “Enterprise architecture dependency analysis using fault trees and Bayesian networks,” in Proc. of the 2009 Spring Simulation Multiconference, San Diego, California, pp. 1–8, 2009. [Google Scholar]
24. E. Zambon, S. Etalle, R. J. Wieringa and P. Hartel, “Model-based qualitative risk assessment for availability of IT infrastructures,” Software & Systems Modeling, vol. 10, no. 4, pp. 553–580, 2011. [Google Scholar]
25. M. Korman, T. Sommestad, J. Hallberg, J. Bengtsson and M. Ekstedt, “Overview of enterprise information needs in information security risk assessment,” in IEEE Int. Enterprise Distributed Object Computing Conf., Ulm, Germany, pp. 42–51, 2014. [Google Scholar]
26. G. Biggs, T. Sakamoto and T. Kotoku, “A profile and tool for modelling safety information with design information in SysML,” Software & Systems Modeling, vol. 15, no. 1, pp. 147–178, 2016. [Google Scholar]
27. E. Grandry, C. Feltus and E. Dubois, “Conceptual integration of enterprise architecture management and security risk management,” in IEEE Int. Enterprise Distributed Object Computing Conf. Workshops, Vancouver, BC, Canada, pp. 114–123, 2013. [Google Scholar]
28. K. Gaaloul and H. A. Proper, “An access control model for organisational management in enterprise architecture,” in Int. Conf. on Semantics, Knowledge and Grids, Beijing, China, pp. 37–43, 2013. [Google Scholar]
29. W. Abbass, A. Baina and M. Bellafkih, “Improvement of information system security risk management,” in IEEE Int. Colloquium on Information Science and Technology, Tangier, Morocco, pp. 182–187, 2016. [Google Scholar]
30. N. Mayer and C. Feltus, “Evaluation of the risk and security overlay of Archimate to model information system security risks,” in IEEE Int. Enterprise Distributed Object Computing Workshop, Quebec City, QC, Canada, pp. 106–116, 2017. [Google Scholar]
31. N. Mayer, J. Aubert, E. Grandry, C. Feltus, E. Goettelmann et al., “An integrated conceptual model for information system security risk management supported by enterprise architecture management,” Software & Systems Modeling, vol. 18, no. 3, pp. 2285–2312, 2019. [Google Scholar]
32. R. Lagerström, P. Johnson and D. Höök, “Architecture analysis of enterprise systems modifiability—models, analysis, and validation,” Journal of Systems and Software, vol. 83, no. 8, pp. 1387–1403, 2010. [Google Scholar]
33. C. Becker, G. Antunes, J. Barateiro, R. Vieira and J. Borbinha, “Modeling digital preservation capabilities in enterprise architecture,” in Annual Int. Digital Government Research Conf.: Digital Government Innovation in Challenging Times, College Park, Maryland, USA, 2011. [Google Scholar]
34. J. Lakhrouit and K. Baïna, “State of the art of the maturity models to an evaluation of the enterprise architecture,” in Int. Symp. ISKO-Maghreb, Marrakech, Morocco, pp. 1–8, 2013. [Google Scholar]
35. G. Plataniotis, S. de Kinderen, D. van der Linden, D. Greefhorst and H. A. Proper, “An empirical evaluation of design decision concepts in enterprise architecture,” in The Practice of Enterprise Modeling, Berlin, Heidelberg, pp. 24–38, 2013. [Google Scholar]
36. H. Florez, M. Sánchez and J. Villalobos, “Extensible model-based approach for supporting automatic enterprise analysis,” in IEEE Int. Enterprise Distributed Object Computing Conf., Ulm, Germany, pp. 32–41, 2014. [Google Scholar]
37. V. Borozanov, S. Hacks and N. Silva, “Using machine learning techniques for evaluating the similarity of enterprise architecture models,” in Advanced Information Systems Engineering, Cham, pp. 563–578, 2019. [Google Scholar]
38. J. S. Addicks and H.-J. Appelrath, “A method for application evaluations in context of enterprise architecture,” in Proc. of ACM Symp. on Applied Computing, Sierre, Switzerland, pp. 131–136, 2010. [Google Scholar]
39. H. Ahmadi, B. Farahani, F. S. Aliee and M. A. Motlagh, “Cross-layer enterprise architecture evaluation: An approach to improve the evaluation of TO-BE enterprise architecture,” in Proc. of the Int. Conf. on Omni-Layer Intelligent Systems, Crete, Greece, pp. 223–228, 2019. [Google Scholar]
40. M. R. Majedi and K. A. Osman, “A novel architectural design model for enterprise systems: Evaluating enterprise resourceplanning system and enterprise application integration against service oriented architecture,” in Int. Conf. on Pervasive Computing and Applications, Alexandria, Egypt, pp. 116–121, 2008. [Google Scholar]
41. H. Chen, R. Kazman and O. Perry, “From software architecture analysis to service engineering: An empirical study of methodology development for enterprise SOA implementation,” IEEE Transactions on Services Computing, vol. 3, no. 2, pp. 145–160, 2010. [Google Scholar]
42. G. Antunes, J. Barateiro, C. Becker, J. Borbinha and R. Vieira, “Modeling contextual concerns in enterprise architecture,” in IEEE Int. Enterprise Distributed Object Computing Conf/. Workshops, Hong Kong, China, pp. 3–10, 2011. [Google Scholar]
43. A. Šaša and M. Krisper, “Enterprise architecture patterns for business process support analysis,” Journal of Systems and Software, vol. 84, no. 9, pp. 1480–1506, 2011. [Google Scholar]
44. B. Fritscher and Y. Pigneur, “Business IT alignment from business model to enterprise architecture,” in Advanced Information Systems Engineering Workshops, Berlin, Heidelberg, pp. 4–15, 2011. [Google Scholar]
45. V. Agievich, V. Taratukhin, J. Becker and R. Gimranov, “A new approach for collaborative enterprise architecture development,” in Int. Forum on Strategic Technology, Tomsk, Russia, pp. 1–5, 2012. [Google Scholar]
46. M. E. Iacob, L. O. Meertens, H. Jonkers, D. A. C. Quartel, L. J. M. Nieuwenhuis et al., “From enterprise architecture to business models and back,” Software & Systems Modeling, vol. 13, no. 3, pp. 1059–1083, 2014. [Google Scholar]
47. P. Loucopoulos, C. Stratigaki, M. H. Danesh, G. Bravos, D. Anagnostopoulos et al., “Enterprise capability modeling: Concepts, method, and application,” in Int. Conf. on Enterprise Systems, Basel, Switzerland, pp. 66–77, 2015. [Google Scholar]
48. T. Bucher, R. Fischer, S. Kurpjuweit and R. Winter, “Analysis and application scenarios of enterprise architecture: An exploratory study,” in IEEE Int. Enterprise Distributed Object Computing Conf. Workshops, Hong Kong, China, pp. 28, 2006. [Google Scholar]
49. S. H. Spewak, S. C. Hill and J. A. Zachman, Enterprise architecture planning: Developing a blueprint for data, applications, and technology, 2nd edition, A Wiley-QED Publication, NY, USA, 1993. [Google Scholar]
50. ISO/IEC/IEEE 15026-1:2019: Systems and software engineering—systems and software assurance. Geneva, Switzerland: International Organization for Standardization, 2019. [Google Scholar]
51. S. Yamamoto, “Assuring security through attribute GSN,” in Int. Conf. on IT Convergence and Security, Kuala Lumpur, Malaysia, pp. 1–5, 2015. [Google Scholar]
52. Z. Zhou, Q. Zhi, S. Morisaki and S. Yamamoto, “An evaluation of quantitative non-functional requirements assurance using archiMate,” IEEE Access, vol. 8, pp. 72395–72410, 2020. [Google Scholar]
53. Q. Zhi, Z. Zhou and S. Morisaki, “A composite safety assurance method for developing system architecture using model checking,” International Journal of Systems and Software Security and Protection, vol. 12, no. 1, pp. 78–93, 2021. [Google Scholar]
54. C. Xia, Q. Zhi, Z. Zhou and S. Yamamoto, “An approach to transform enterprise architecture models from systemigrams,” in IEEE Int. Conf. on Software Engineering and Service Science, Beijing, China, pp. 571–574, 2019. [Google Scholar]
55. I. Sommerville, Software engineering, 10th edition. London, UK: Pearson, 2015. [Google Scholar]
 | This work is licensed under a Creative Commons Attribution 4.0 International License, which permits unrestricted use, distribution, and reproduction in any medium, provided the original work is properly cited. |