DOI:10.32604/csse.2022.018269
| Computer Systems Science & Engineering DOI:10.32604/csse.2022.018269 | |
| Article |
Intelligent Identification and Resolution of Software Requirement Conflicts: Assessment and Evaluation
1College of Computer and Information Sciences, Al Imam Mohammad Ibn Saud Islamic University, Riyadh 13318, Saudi Arabia
2College of Computing and Informatics, Saudi Electronic University, Riyadh 11673, Saudi Arabia
*Corresponding Author: Marwah Almasri. Email: m.almasri@seu.edu.sa
Received: 03 March 2021; Accepted: 03 May 2021
Abstract: Considerable research has demonstrated how effective requirements engineering is critical for the success of software projects. Requirements engineering has been established and recognized as one of the most important aspects of software engineering as of late. It is noteworthy to mention that requirement consistency is a critical factor in project success, and conflicts in requirements lead to waste of cost, time, and effort. A considerable number of research studies have shown the risks and problems caused by working with requirements that are in conflict with other requirements. These risks include running overtime or over budget, which may lead to project failure. At the very least, it would result in the extra expended effort. Various studies have also stated that failure in managing requirement conflicts is one of the main reasons for unsuccessful software projects due to high cost and insufficient time. Many prior research studies have proposed manual techniques to detect conflicts, whereas other research recommends automated approaches based on human analysis. Moreover, there are different resolutions for conflicting requirements. Our previous work proposed a scheme for dealing with this problem using a novel intelligent method to detect conflicts and resolve them. A rule-based system was proposed to identify conflicts in requirements, and a genetic algorithm (GA) was used to resolve conflicts. The objective of this work is to assess and evaluate the implementation of the method of minimizing the number of conflicts in the requirements. The methodology implemented comprises two different stages. The first stage, detecting conflicts using a rule-based system, demonstrated a correct result with 100% accuracy. The evaluation of using the GA to resolve and reduce conflicts in the second stage also displayed a good result and achieved the desired goal as well as the main objective of the research.
Keywords: Requirement conflicts; genetic algorithm; rule-based system; software requirements; requirements engineering
Requirements engineering is one of the most important components of software engineering. A requirements engineer’s goal is to keep the set of requirements consistent and up-to-date in the project duration [1]. Successful requirements engineering involves: understanding the needs of stakeholders, understanding the problem domain, providing specification templates and examples to ensure a high level of quality, maintaining a good relationship between stakeholders to fulfill user needs, validating that the documenting requirements match the collected requirements; managing requirements development, and assigning requirements engineering activities to skilled software engineers and team members for better performance [2–4]. A number of research studies have indicated that conflict resolution in requirements is a critical factor in project success [5]. It is crucial to detect and resolve conflicts in the early phases of the project lifecycle because delays in detecting problems may cause expensive reiterations of all other phases [6]. According to recent research, a high number of conflicting requirements are stated as in Poort et al. [7], n2 conflicts are reported in n requirements, whereas 40%–60% of conflicts were reported in Rao [8]. Using manual techniques to define requirement conflicts requires substantial effort and time for software engineers. Automating the process will facilitate the procedures, but it would still require human analysis. Hence, project costs may incur owing to human error and wrong decision making. Furthermore, most of the proposed approaches in the previous research were not evaluated to measure their efficiency.
In our previous work [9,10], we surveyed state-of-the-art techniques used for detecting and resolving requirement conflicts and analyzed their strengths and weaknesses. We also developed a rule-based system to detect the conflicts between requirements. An intelligent method to solve the requirement conflict using an optimization technique (Genetic Algorithm “GA”) was also proposed. This paper implements the proposed framework in order to solve the requirement conflicts automatically and efficiently using GAs. In this paper, we explain how we conduct experiments to evaluate the proposed methods’ performance. The performances are then measured by plotting the number of conflicts after each experiment; if the number of conflicts decreases, it means that the overall performance is acceptable and the objective function of decreasing conflicts in requirements is achieved.
This paper is organized as follows. Section 2 discusses the methodology used in detail. Section 3 describes the experimental framework used to evaluate the performance of the proposed methodology. Finally, Section 4 summarizes conclusions based on the findings.
This section discusses the proposed approach in detail. It compromises two stages: identifying the conflicts and resolving them. The algorithm for the proposed approach in [10] is as follows:
Start
Get input from Excel
Calculate conflicts
Build the initial population
Repeat until reaching limited number of iteration OR specific percentage of conflicts
Run Fitness (Conflicts in each solution)
Select Solutions
Apply Crossover
Apply Mutation
Stop
2.1 Stage 1: Identifying Conflicts
At this stage, a rule-based system including sequence steps to detect the conflicts between functional requirements is used. A rule-based system usually consists of facts, rules, and a termination condition [11].
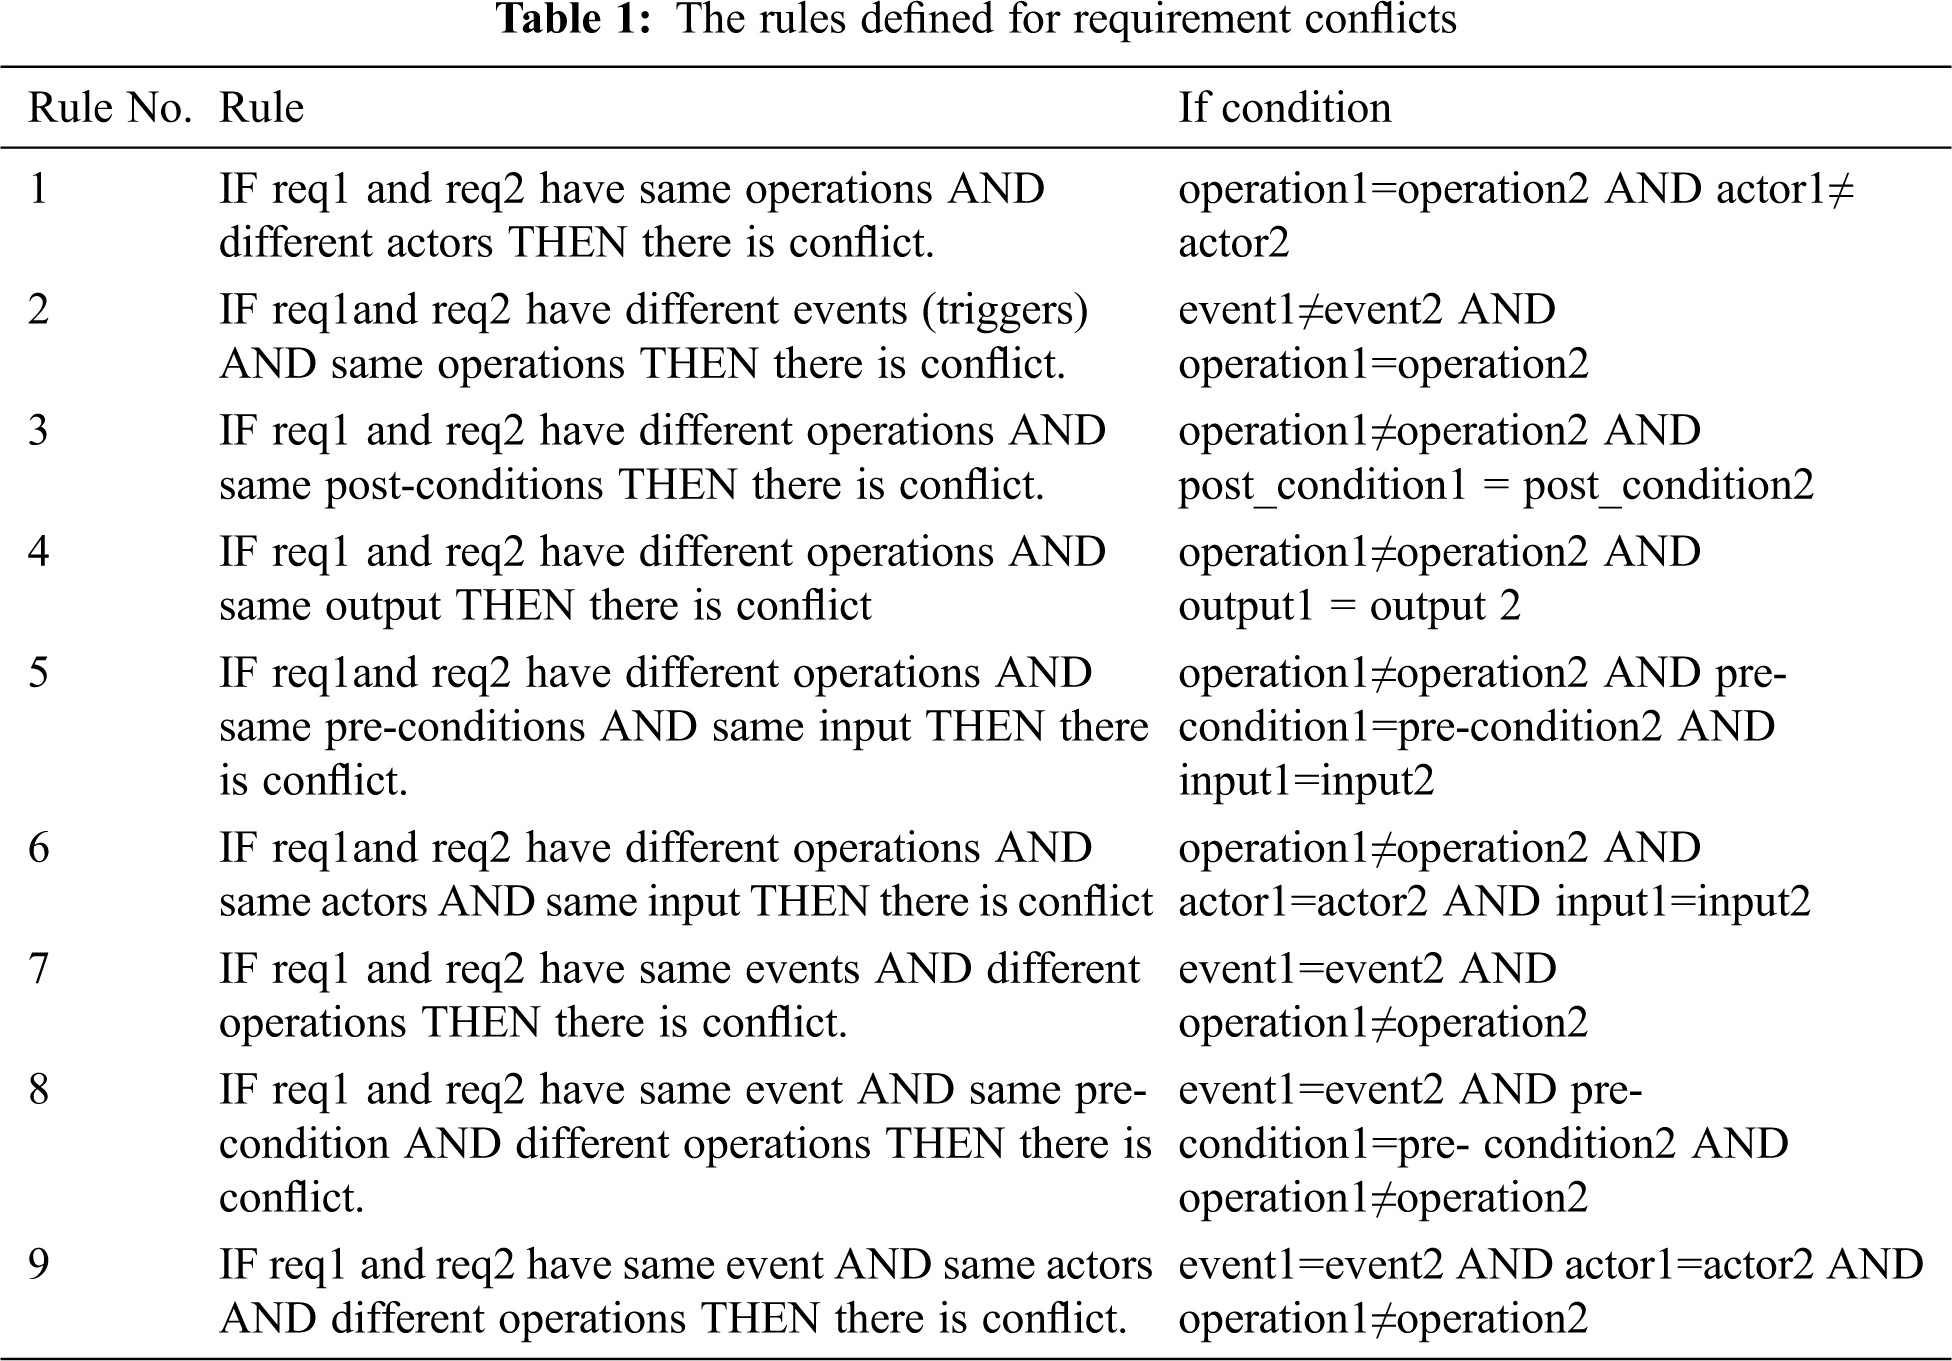
2.1.1 Developing the If-Then Rules
A group of if-then rules is built to test if there are conflicts between any two requirements. The rules are constructed according to the elements that define the function requirements and are built based on a discussion with experts in requirements engineering on the definition of conflicts between two functional requirements. These rules are then defined using the elements of the functional requirements (operation, actor, event, pre-condition, input, post condition, and output), which can be read and analyzed from the functional requirements defined in a structured natural language in tables. They are defined to consider the most unacceptable results or conflicts that may be caused by running two functional requirements. They are based on comparing the main elements of the functional requirements. The rules will determine if any two requirements in FRs are conflicts or not as portrayed in Tab. 1. These rules can be increased or updated based on the definition of requirement conflicts for functional requirements. These nine rules are used in the experiments to test the proposed approach and its efficiency.
2.1.2 Reading the Function Requirements
A structured natural language is used for requirements specification. To assist the analysis of requirements, the function requirements are formatted in the form of a table on an Excel spreadsheet, containing the main elements that define each requirement and the need to detect conflicts (FR-id, operation, actor, trigger, pre-condition, input, post-condition, and output). The function requirements are read from an Excel file and tested through the set of rules to determine if there are any conflicts between the two requirements. The system also defines which rule to detect the conflicts.
2.1.3 Finding and Listing the Conflicts Between Function Requirements
The system displays the FR-id for the two requirements with conflicts and rule number that fulfill (realize) the condition.
2.2 Stage 2: Resolving the Conflicts
Genetic algorithms (GAs) are strong and useful tools that have the ability to solve complex problems [12]. They can solve optimization problems rapidly, accurately, and consistently [13]. A GA has very good parallel capabilities [13]. It can provide a group of solutions instead of a single solution. It works with both discrete, continuous, and multi-objective functions [14]. Additionally, it can produce good enough and fast enough solutions [15]. To apply the GA in the area of resolving requirement conflicts, the main elements of GA should be defined in the problem area. They are depicted in the following Fig. 1, where “Gene” denotes that each function requirement is represented by one variable, “Chromosome” refers to a set of requirements that represents one solution, and “Population” presents to a set of solutions (collection of a set of requirements). The algorithm of Stage 2 [10] is as follows:

Figure 1: Main elements of GA in the problem area
Start
Build the initial population
Repeat until Stopping Criteria (reaching limited number of iteration OR specific percentage of conflicts)
Calculate Fitness (Conflicts in each solution)
Select Solutions for GA
Apply Crossover
Apply Mutation
Stop
Two different methods are built to apply the GA to reduce and solve the conflicts between requirements. The basic algorithm is the same for all; the only difference is in building the initial population.
The initial population is built randomly. The advantage of this method is that it considers all values in the initial population at its greater probability to accommodate all kinds of permutations and higher efficiency. But sometimes random combinations of some attributes can make the function requirement less meaningful; however, this is normal for randomization as one of the basic attributes of GAs.
The initial population is built randomly with restrictions on the similarities between some attributes to make sure the requirements are logically correct. In method one, the initial population is built randomly, which may cause some requirements with less meaning. To ensure that meaningless entries are not allowed, conditions have to be put in a population generation. In this way, when generating a population, the system will check the attributes and choose further appropriate attributes according to these constraints. Furthermore, the value is randomly chosen with conditions. This reduces meaningless entries by a great extent and perhaps provides us some guarantee of quality solutions.
This section discusses the design and execution of the proposed approach. It also highlights the analysis of the obtained results as well as the performance evaluation for each stage.
The objective of this experiment was to evaluate the performance of the proposed approach [10] in detecting and reducing the conflicts in functional requirements. The performance was measured by the effectiveness and feasibility of both parts of the proposed approach. The effectiveness was measured by observing whether the system provided the desired output. Effectiveness entailed producing the right output in terms of quantity and quality, whereas feasibility evaluated the accuracy of the results achieved by the approach. The accuracy of the rule-based system was measured by comparing the number of conflicts and the FR-ID that had conflicts arising from the system with the one that detected conflicts manually. If they are the same, this means that the proposed approach detected all conflicts accurately. The effectiveness of the GA-based system was determined by comparing the percentage of conflicts before and after using the GA technique. If the number is reduced and the percentage of conflicted requirement has decreased, this indicates that the proposed approach has satisfactory results and works effectively.
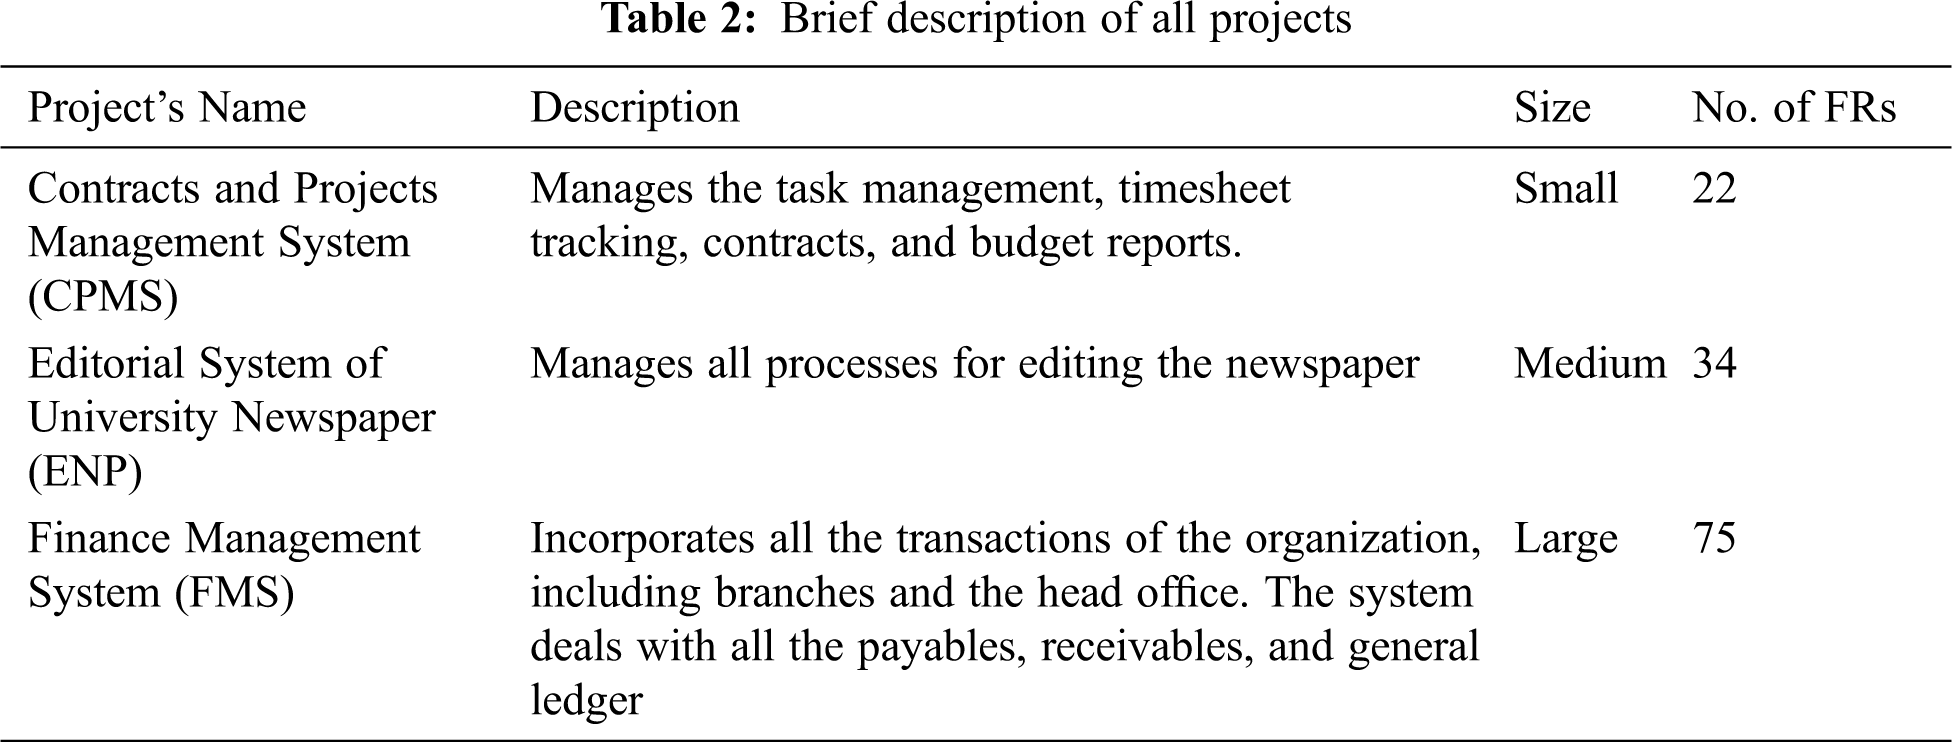
The experiments were conducted on three different real-world industrial projects. To test the approach on a different number of functional requirements with different conflict percentages, the projects were selected with varying sizes of functional requirements (small, medium, and large projects). Small projects were 25 or fewer use cases, middle projects were 25 to less than 74 use cases, and large projects were 74 and more use cases. A brief description of the three projects is provided in Tab. 2 below.
The proposed methodology with two different methods was implemented using MATLAB for all three projects. Experiments were conducted ten times for each project. The results of the experiments were recorded at two levels: one after the first part that detected the conflicts, and the other after applying the GA as follows:
- Ten experiments for three projects with two different methods 10 × 3 × 2 = 60;
- Methods 1 and 2 had two different versions 60 + (20 × 3) = 120 different experimental results.
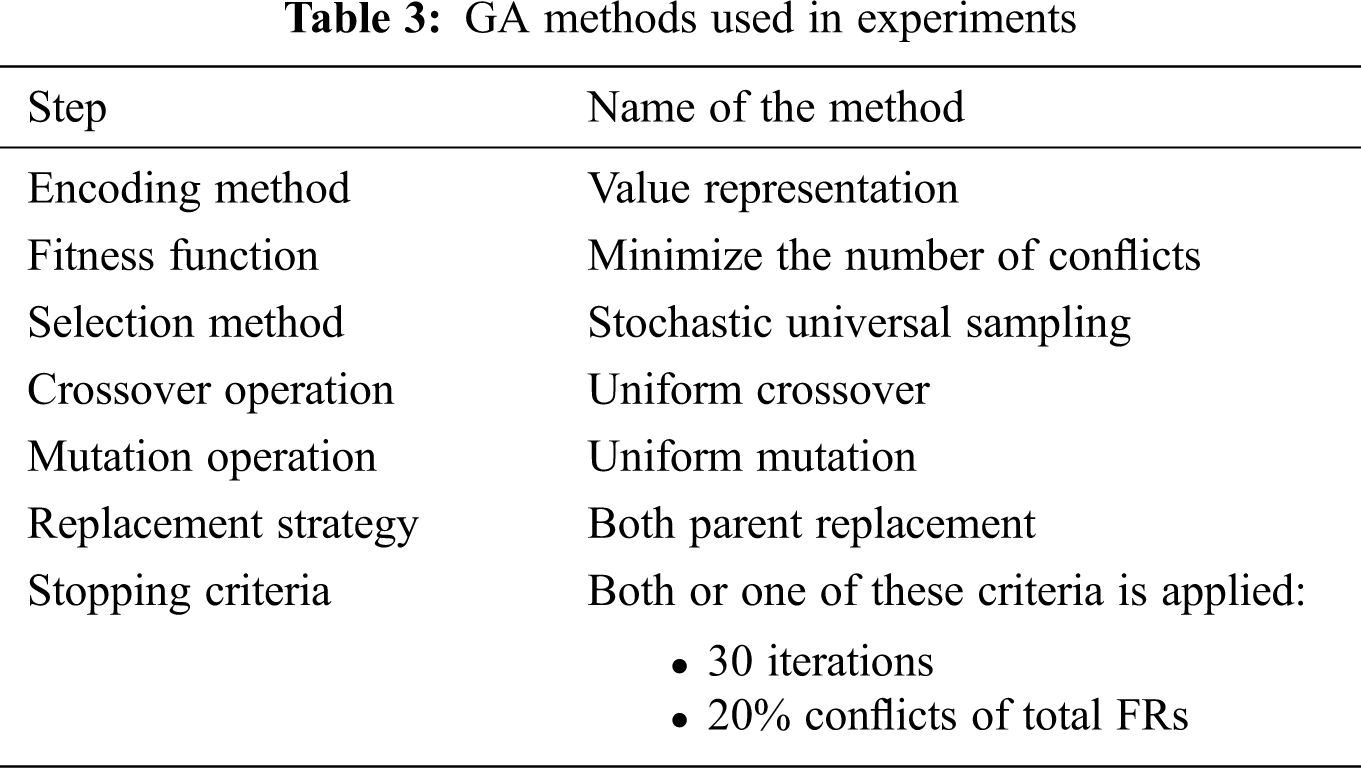
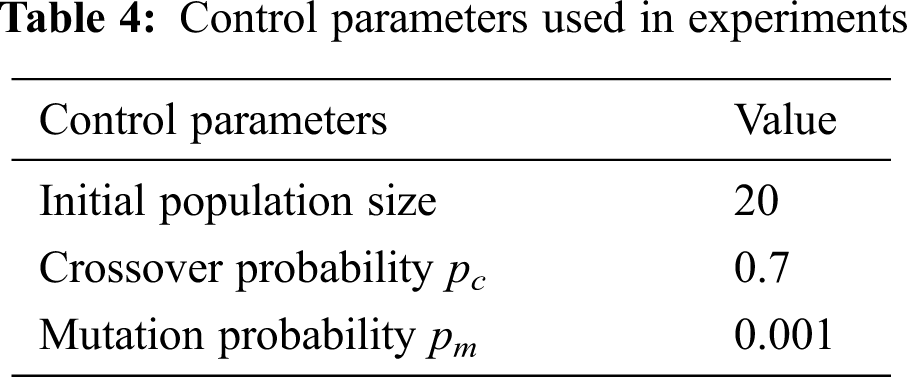
3.3 Control Parameters of Genetic Algorithm
Tab. 3 lists the methods used in each step of the GA. Tab. 4 displays the values of the most important control parameters in GA. These values were chosen after trying different values in specific ranges based on suggestions in previous studies.
3.4 Experiment Results and Discussion
In this section, the results are analyzed and discussed to evaluate the performance of the proposed approach. There is a separate evaluation for each stage. The statistical procedures were performed using Statistical Package for Social Sciences (SPSS) version 20. Descriptive statistics (means, standard deviations, and standard errors) were used for expressing variables.
3.4.1 Stage 1: Detecting Conflicts Using Rule-Based System
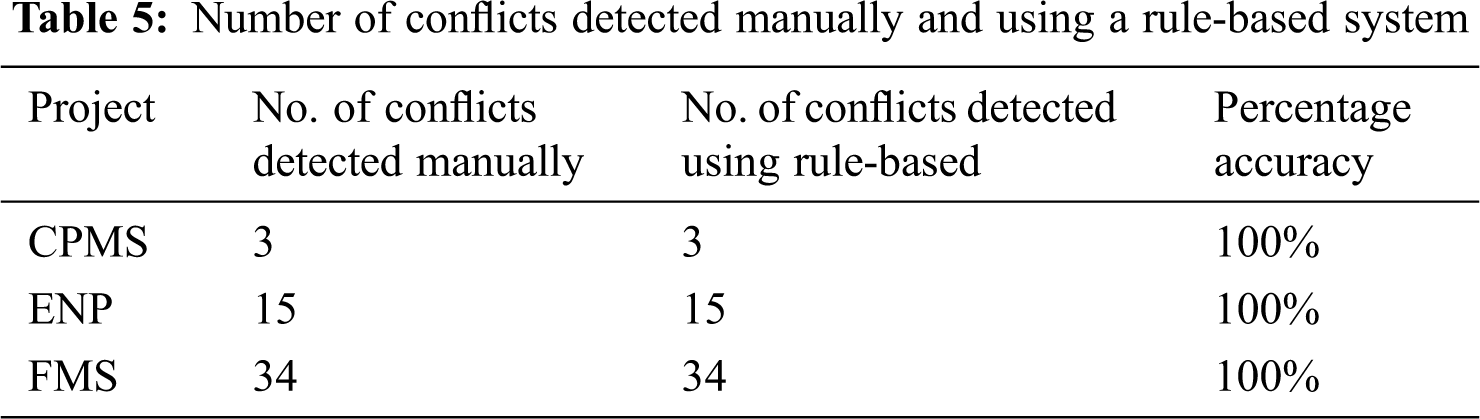
The results of applying the rule-based system in the three projects are presented in Tab. 5, showing the number of conflicts that were detected manually, the number of conflicts detected using rule-based, and the percentage of accuracy between the two. With reference to the accuracy of the proposed approach, Tab. 5 depicts how the method provides results with 100% accuracy. Therefore, we can now prove the rule-based system works just as effectively in detecting all possible conflicts.
3.4.2 Stage 2: Resolving Conflicts Using Genetic Algorithm
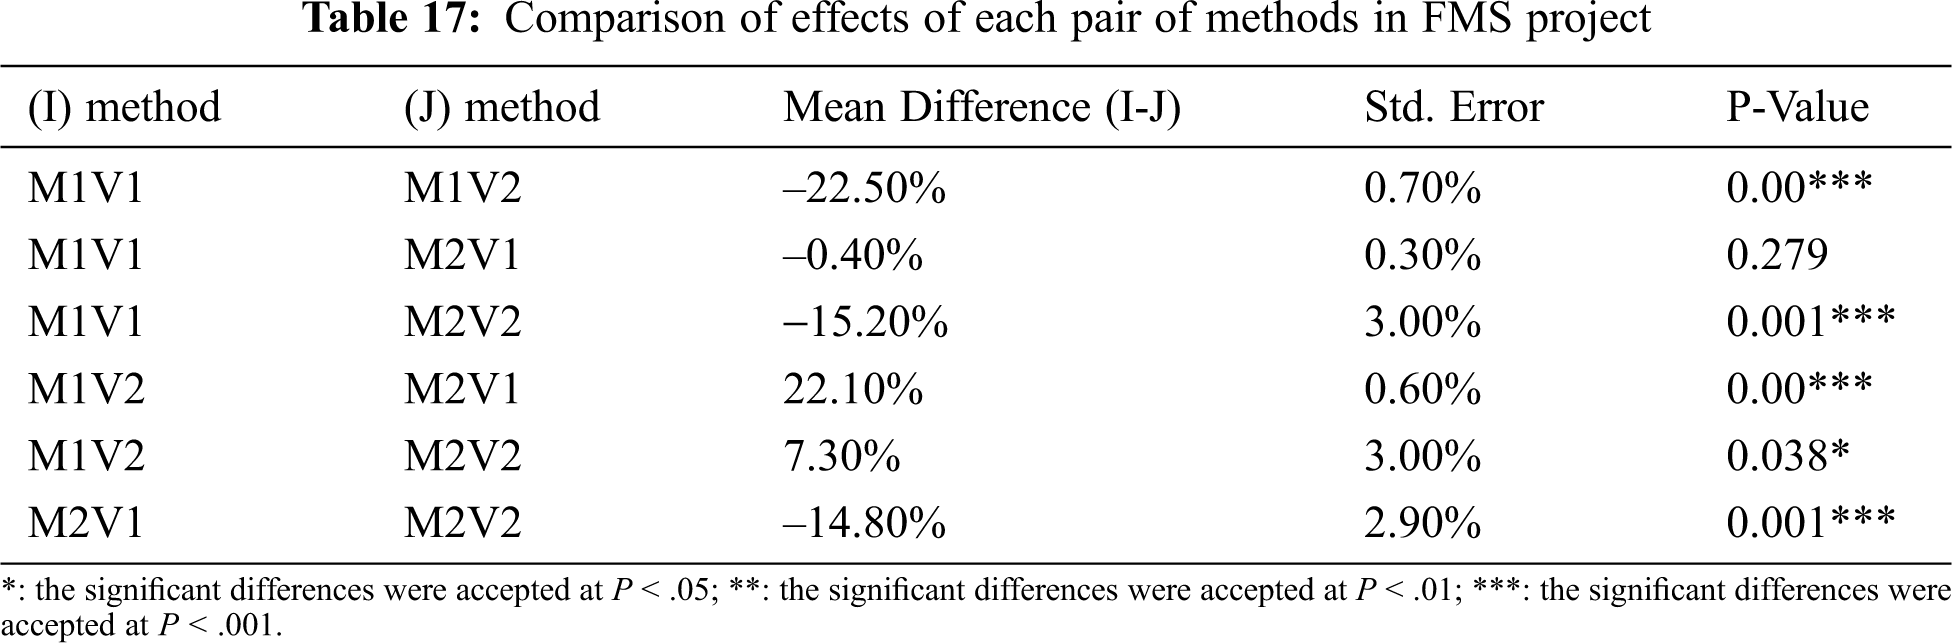
GA is a probabilistic stochastic global search algorithm. This means that if the same set of parameters runs multiple times, the results are different for each operation. Thus, the results are different in various runs. Method 1 and 2 have two different versions in the experiments. The difference is in the stopping criteria that were applied. In the first version, only reaching a solution with less than 20% of total functional requirements was applied. This percentage was chosen to obtain optimal results in lesser run time. However, sometimes for large data, it may take a longer execution time to reach this percentage. Therefore, the second version was built to avoid a long execution time in certain situations and obtain optimal results in a lesser run time. The iteration count was set to 30 in addition to stopping criteria set at reaching a solution with less than 20% of total functional requirements, i.e., 20% or 30 iterations, whichever happens first, would stop the loop. Thus, in the experiments, there are four different methods: Method 1 Version 1 (M1V1), Method 1 Version 2 (M1V2), Method 2 Version 1 (M2V1), and Method 2 Version 2 (M2V2).
The discussion of the GA’s application results in the three projects was conducted in consideration of the percentage of conflicts and the percentage of the resolved conflicts after the application of each method. The results of the effects are expected to be the same because the percentage of the resolved conflicts is calculated from the percentage of the conflicts. The detailed results are shown for both versions.
The analysis of the results have four different objectives as follows:
1. Compare the effects of the proposed approach of decreasing conflicts for each project,
2. Explore the different effects of various methods for each project,
3. Contrast the different effects of each method in various projects,
4. Compare the effect of various methods.
3.4.2.1 Compare the Effects of the Proposed Approach of Decreasing Conflicts for Each Project
To study the effects of each method in reducing conflicts, the percentage of conflicts after applying each method was compared with the percentage of conflicts in the original data of the project. There are two tables for each project: one is the effects on the percentage of conflict, and the other is the effects on the percentage of resolved conflicts. One sample t-test was performed to compare each method with the baseline value. The tables contain the following information:
• Test value: percentage of conflicts in the original data;
• N: number of experiments;
• Mean: mean of (conflicts or resolved conflicts) in the ten experiments;
• P-value: when there is an asterisk next to the p-value in the table, it means there is a significant difference between the compared items. When there is no asterisk, thus there is no difference between the compared items.
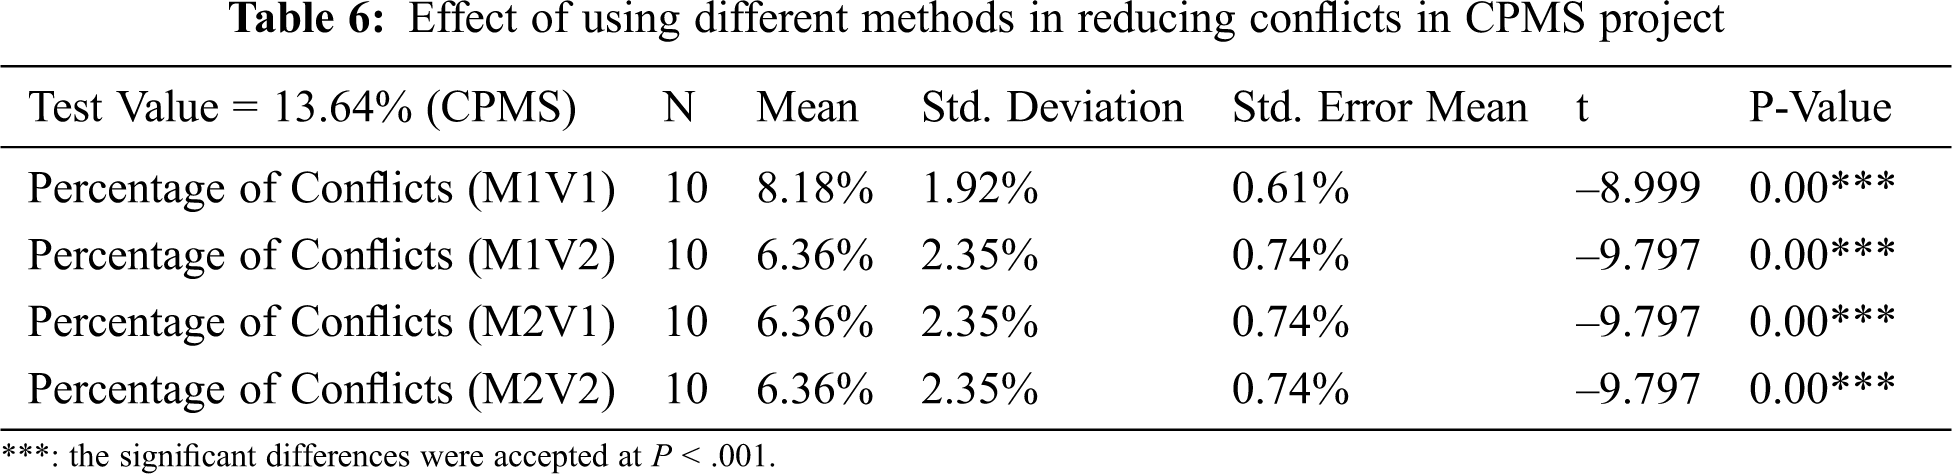
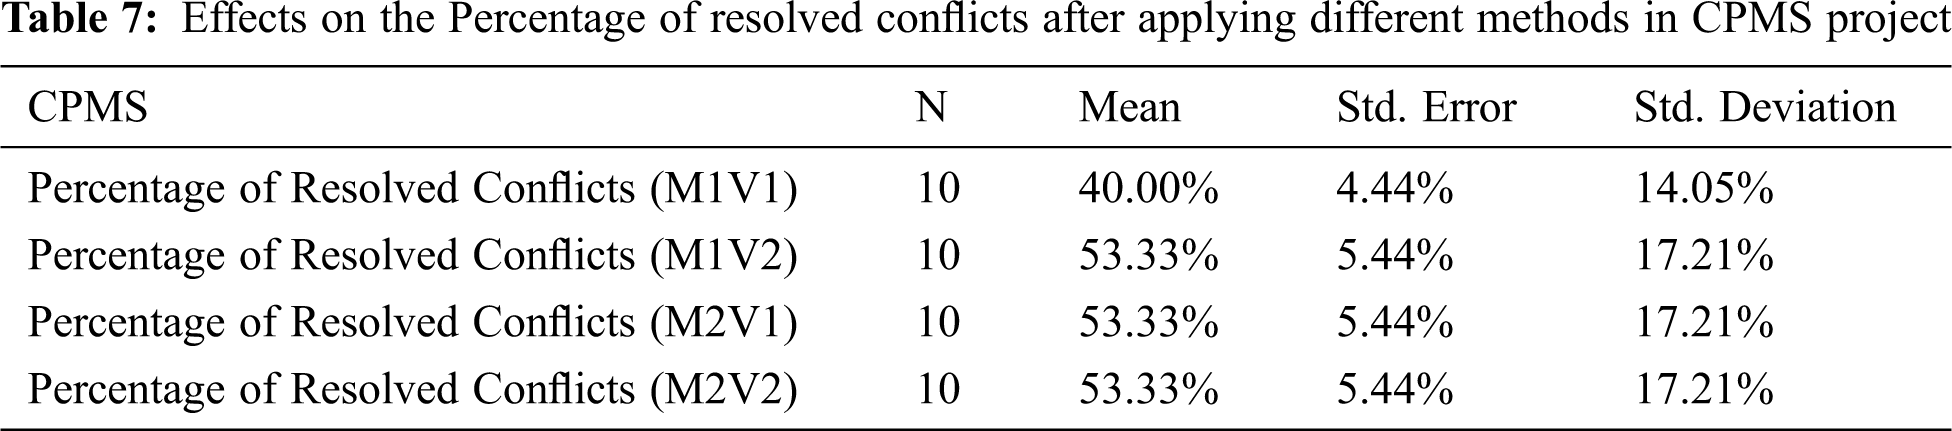
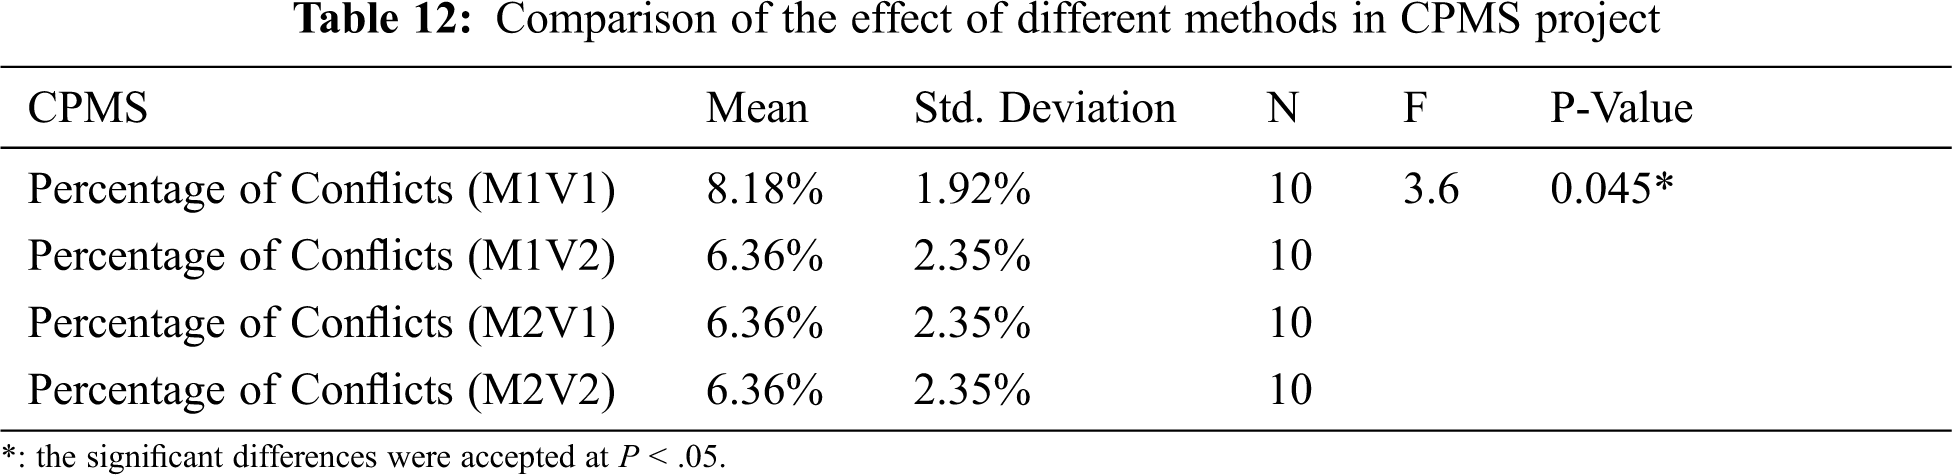
The p-value in Tab. 6 shows that there is a significant difference between the original test value and the results after applying different methods. This illustrates that the mean of conflicts after applying the different methods is between 6.36% and 8.18%, less than the percentage of conflicts in the original data at 13.64%. Thus, the approach with different methods is effective since it decreases the percentage of conflicts between 5.46% and 9.09%. The information in Tab. 7 supports the previous analysis since the resolved conflicts are between 40% and 53.33%. There are three methods that provide the same results in the project: M1V2, M2V1, and M2V2. In each of these methods, the percentage of conflicts decreases to 6.36%. Although the percentage of conflicts in M1V2 and M2V2 are the same, the set of function requirements from M2V2 is more meaningful; it was built from an initial population with conditions. The standard error for the mean shows a very low value between 0.61% and 0.74%. Fig. 2 shows the comparison of the mean of the different methods with the original data.

Figure 2: Comparison of mean of conflict percentage in different methods with original data percentage in CPMS project
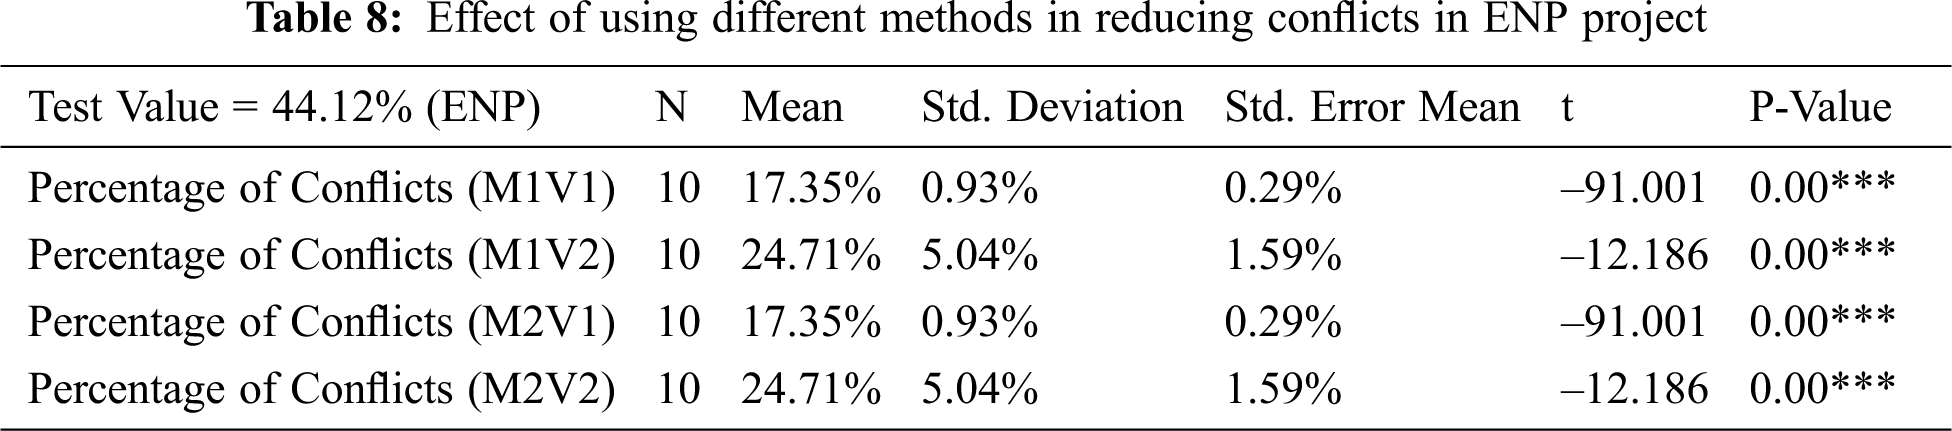
The p-value in Tab. 8 shows a significant difference between the original test value and the results after applying the different methods. This demonstrates that the mean of the conflicts after applying the different methods is between 17.35% and 24.71%, which is less than the percentage of conflicts in the original data at 44.12%. Thus, the approach with different methods is effective since it decreases the percentage of conflicts between 19.41% and 28.53%. The information in Tab. 9 supports the previous analysis as the resolved conflicts are between 44% and 60.67%. Additionally, Tab. 9 shows V1 in both M1 and M2 yield the same result of 17.35% of conflicts since iteration in V1 is a continuous process until it reaches a solution with less than 20% of conflicts, and then the results are usually in the same percentage of conflicts. However, the results of the experiment also show that M1V1 usually needs more iterations (more time) to reach the required percentage. Furthermore, V2 in both M1 and M2 yield the same result of 24.71%, and these results demonstrate that in most of the experiments, the stopping criteria is 30 iterations before reaching 20% of conflicts. Even though the decrease in percentage is the same, the set of requirements produced by M2 may be better; it is produced from a constrained initial population. The standard error for the mean in Tab. 8 depicts a very low value between 0.29% and 1.59%. Fig. 3 illustrates the comparison of the mean of the different methods with the original data.

Figure 3: Comparison of mean of conflict percentage in different methods with original data percentage in ENP project
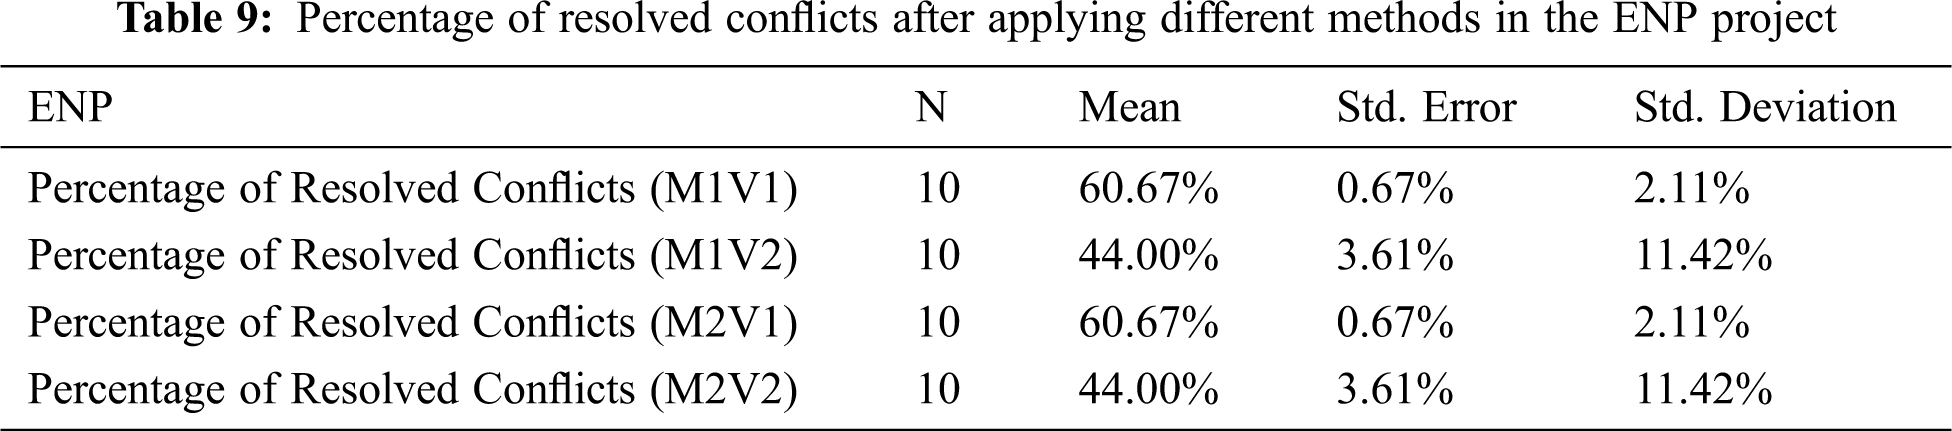
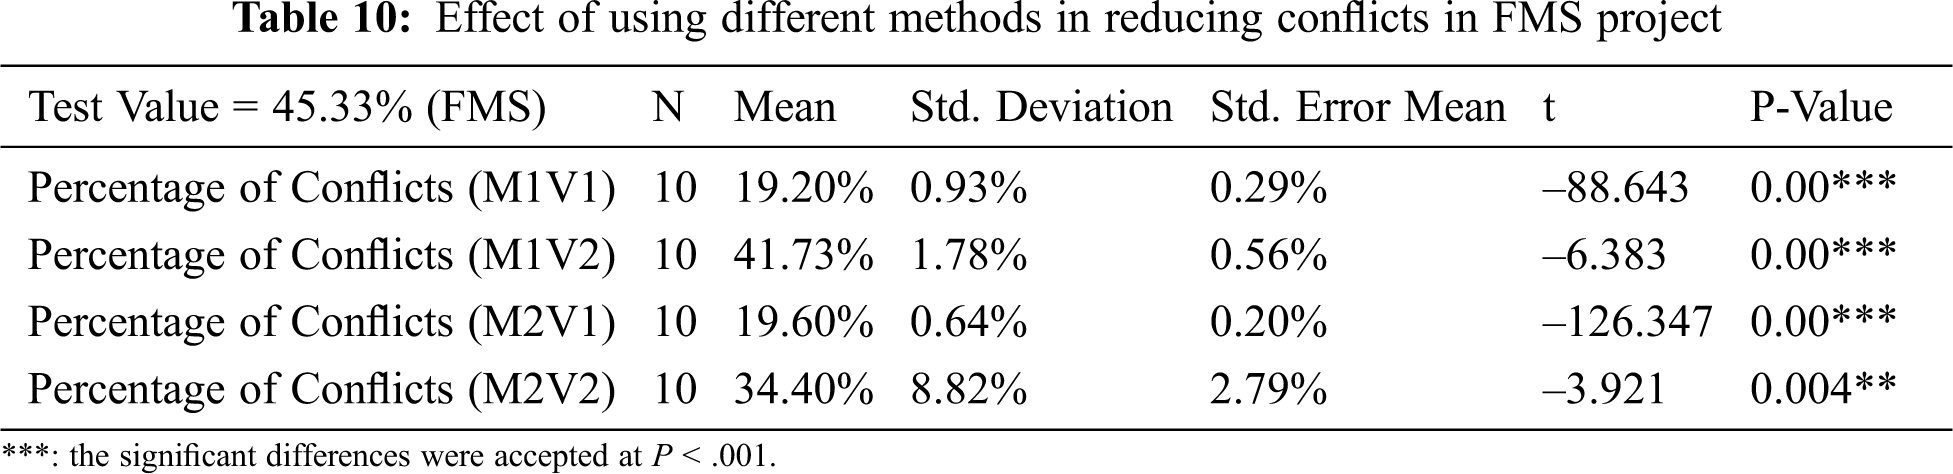
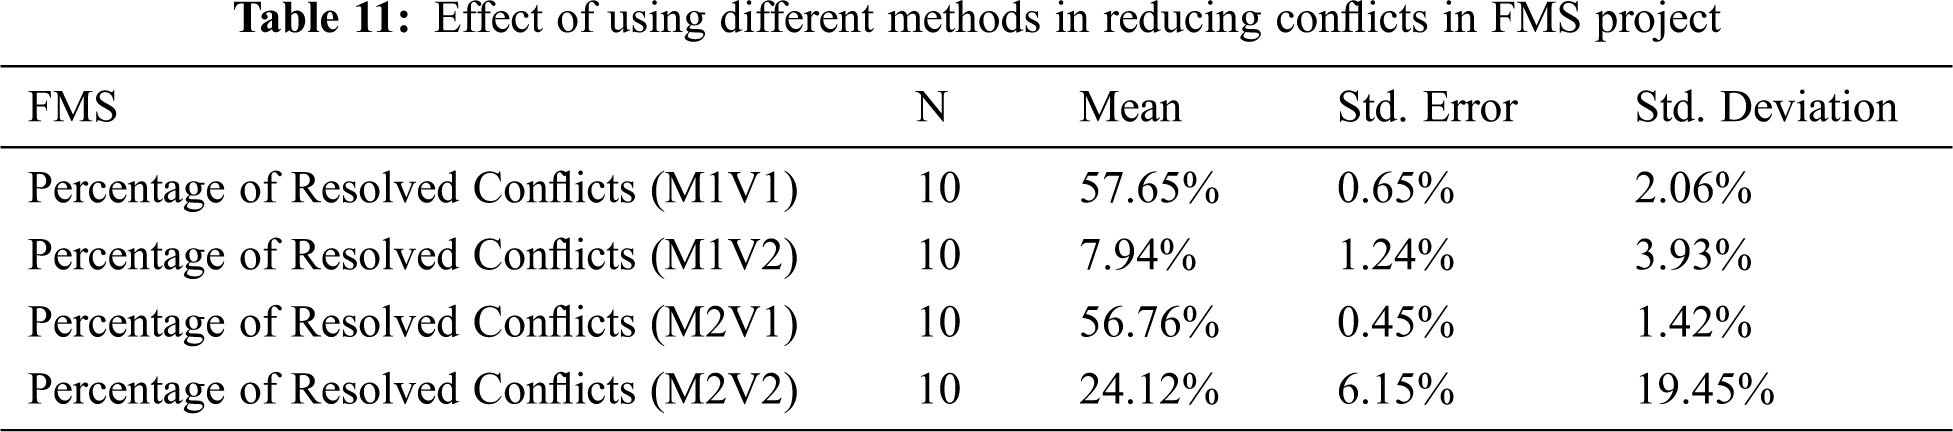
The p-value in Tab. 10 shows that there is a significant difference between the original test value and the result after the application of different methods. This demonstrates that the mean of conflicts after applying the different methods is between 19.60% and 41.73%, less than the percentage of conflicts in the original data (45.33%). Thus, the approach with different methods is effective since it decreases the percentage of conflicts below 3.6% in the worst case in M1V2. The information in Tab. 11 supports the previous analysis as the resolved conflicts are between 7.94% in M1V2 and 57.65% in M1V1. Moreover, as illustrated in Fig. 4, M1V1 and M2V1 have similar results with much better results than M1V2 and M2V2. The standard error for the mean shows a very low value between 0.20% and 2.79%.

Figure 4: Comparison of mean of conflict percentage in different methods with original data percentage in FMS project
To sum up, M1V2 usually has the worst results in comparison; this may be due to the stopping criteria in V2 reaching 30 iterations or less than 20% of conflicts. In addition, the initial population in M1 is built completely at random; thus reaching 20% may take time, and the loop usually stops after 30 iterations with a high percentage of conflicts. Moreover, V1s in M1 and M2 usually have the same or very similar results. Because the stopping criteria in V1 reach less than 20% of conflicts in both methods, the loop continues until reaching this percentage in both methods. Therefore, we can see how the set of function requirements in M2 can be more meaningful since it is built randomly from a conditional initial population.
3.4.2.2 Exploring the Different Effects of Various Methods for Each Project
To test if there is a significant difference between the effects of various methods for each project, a comparison between all different methods was conducted. The p-value determines if there is a difference or not. If there is a significant difference, then a comparison between each of the two methods is prepared to determine exactly which methods have differences and which methods have the same effects. In addition, the tables show the difference between the means of both methods. If the mean is positive, it means that the second comparison method has a better result (fewer conflicts) than the first method; If it is negative, then it is the opposite. For repeated measures, One-way Analysis of Variance (“ANOVA”) was used to compare the different methods for each project.
The tables contain the following information:
• Mean: the mean of the conflicts in each method;
• N: number of experiments;
• Mean difference: the difference between the mean in the two methods.
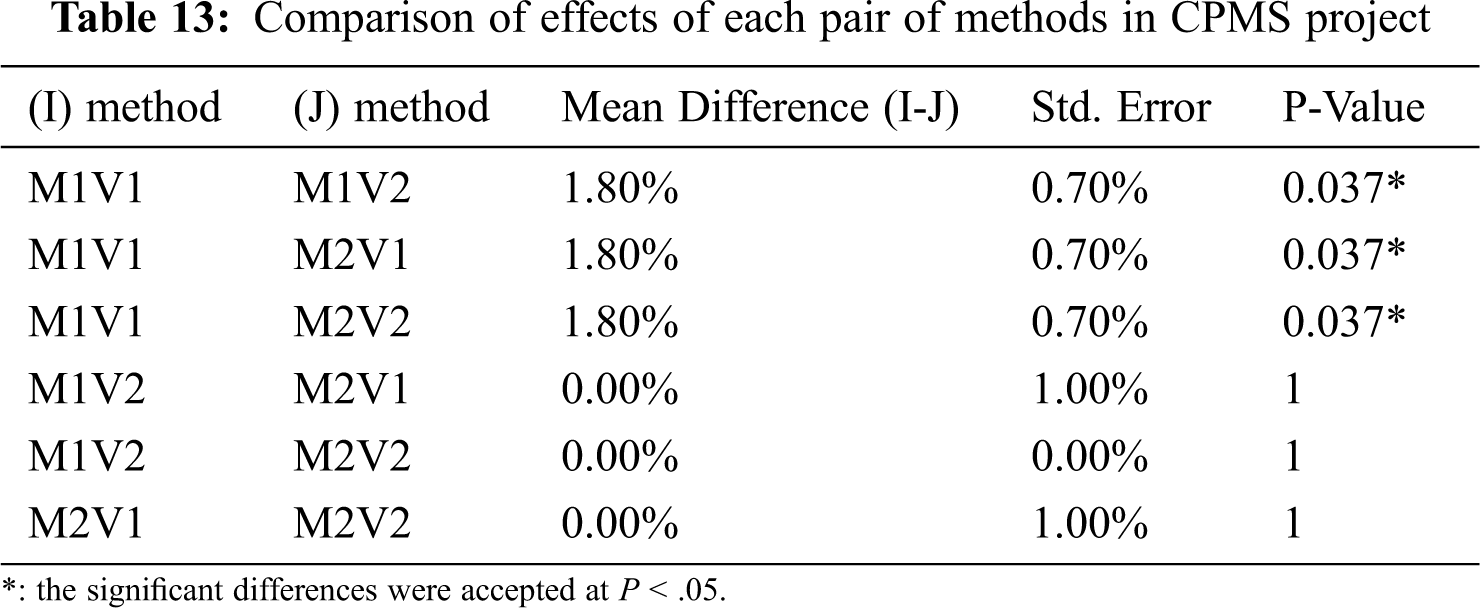
Tab. 12 posits that there is a significant difference in the performance of the various methods applied in this project. Tab. 13 shows which pair of methods have an explicit difference. M1V1 has a significant difference from all other methods, and the difference in the mean is positive; therefore, this means that all other methods have better results than M1V1. Other methods show no differences in their performance. In addition, M1V2 and M2V1, M1V2 and M2V2, and M2V1 and M2V2 yield the same results in the CPMS project.
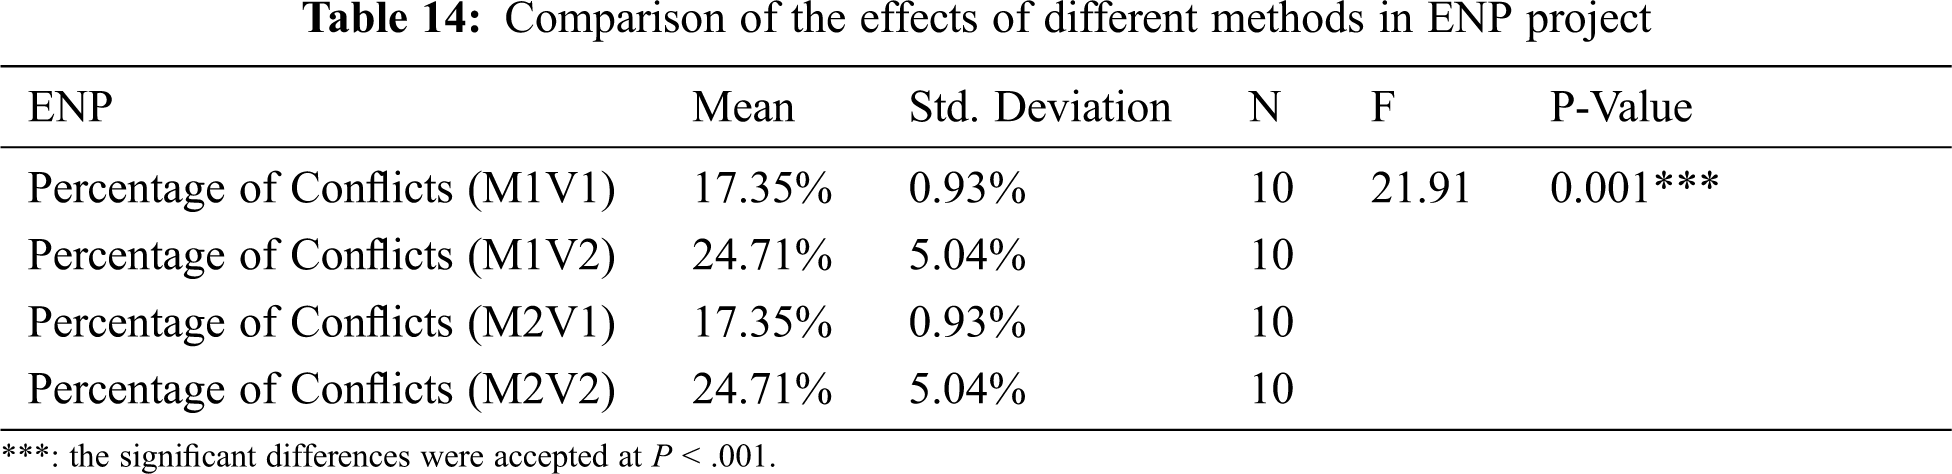
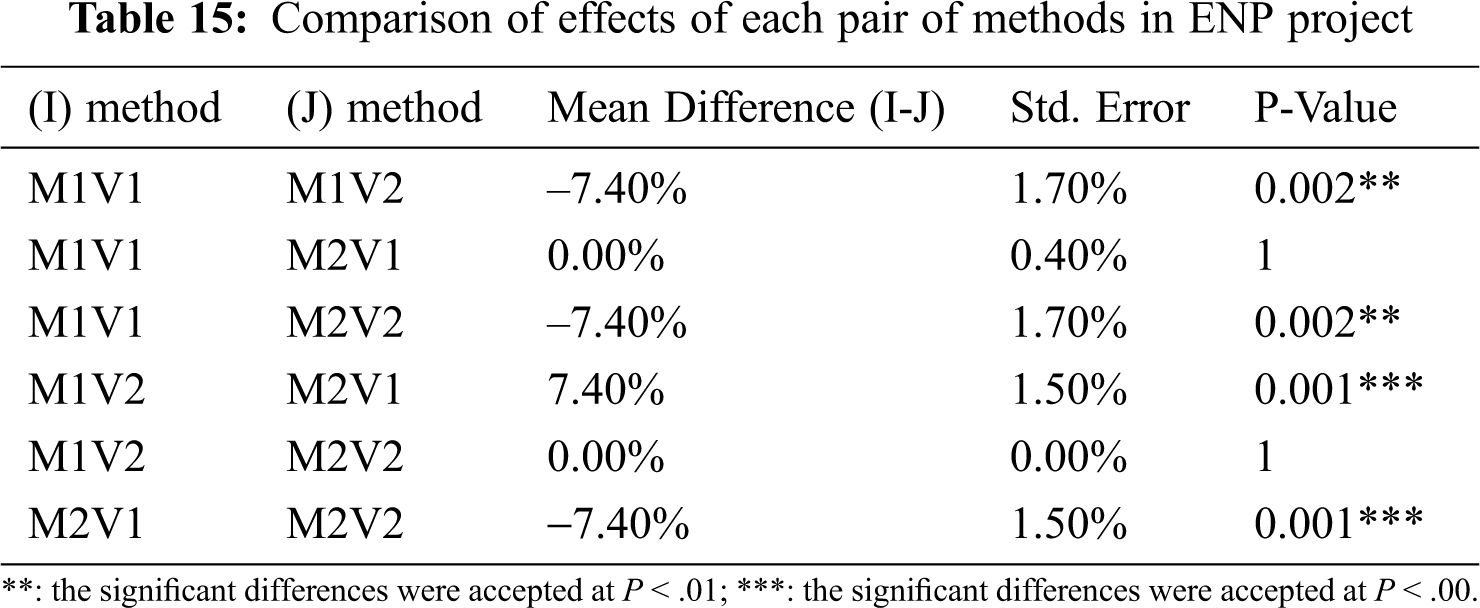
Tab. 14 illustrates that there is a difference in the performance of the methods in the ENP project, whereas Tab. 15 portrays that there is a difference in all pairs of methods, except for V1 in both methods and V2 in both methods. The mean difference between them is zero; the results of version one in both methods are the same as well as for version two. This is because the difference between Method 1 and Method 2 is the building of the initial population; however, the stopping criteria and other operations are the same. Therefore, the percentage of the conflicts may be the same, but V2 built with a more logical initial population may have a better set of function requirements.
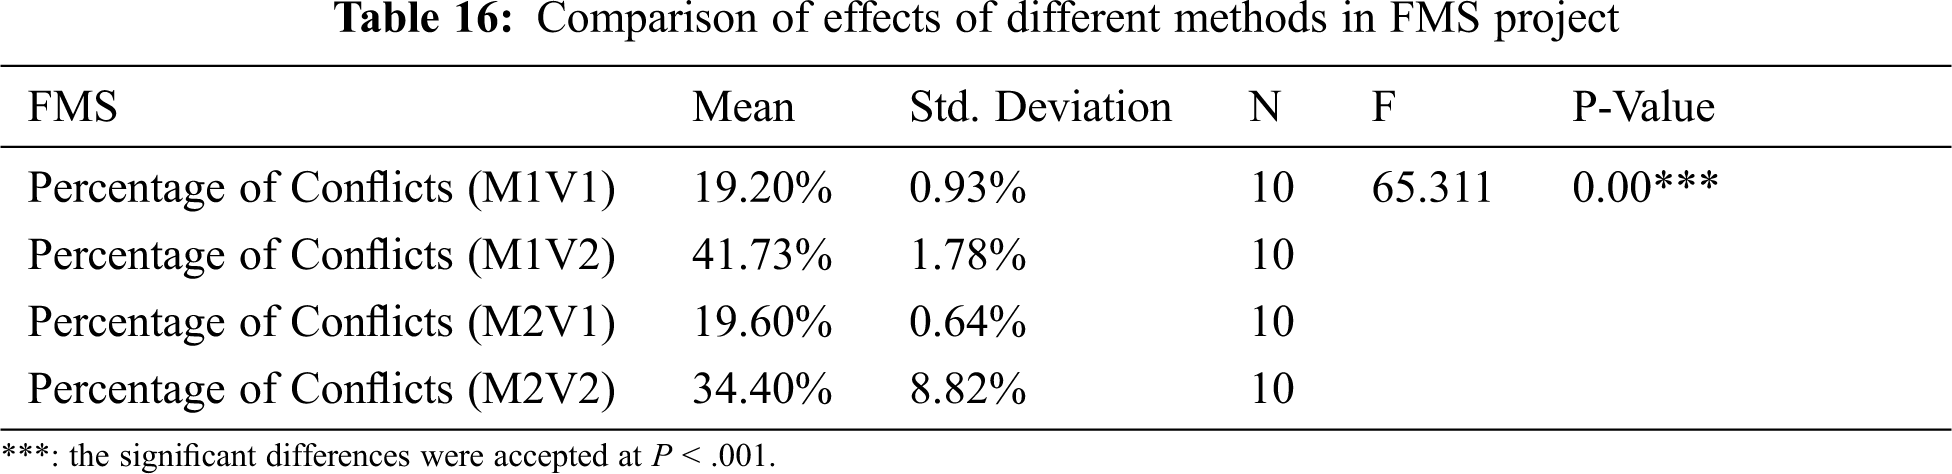
Tab. 16 shows a significant difference between the methods when applied in the project, while Tab. 17 demonstrates that all pairs of methods have differences in their performance except for V1s in both methods with the same effects in the project.
Based on the previous analysis, we can conclude that V1 in both methods has the same performance in the last two projects due to the size of the projects (medium and large).
3.4.2.3 Contrasting the Different Effects of Each Method on Various Projects
After exploring the different effects of various methods for each project, a comparison was conducted to study the effects of each method on the various projects. For each method, there are two tables: one to demonstrate if there are different effects for the method in all projects, and the second one to compare the effects of the method in each pair of projects to verify if its effect on these projects is the same. Moreover, if the effect is dissimilar, the difference between the means denotes which method works better in each project. A figure for each method is presented to clarify the different effects of the methods in reducing the conflicts for all projects. For each project, two bars are presented: one is the percentage of the original data conflicts, while the other is the mean of the conflicts after applying the method. Then, ANOVA was used to compare more than two projects for the same method, and Post-hoc testing was used to compare two projects when ANOVA was significant.
Tab. 18 shows a significant difference in the performance of M1V1 in various projects, whilst Tab. 19 explicitly denotes which pair of projects has similar or different effects of the method.
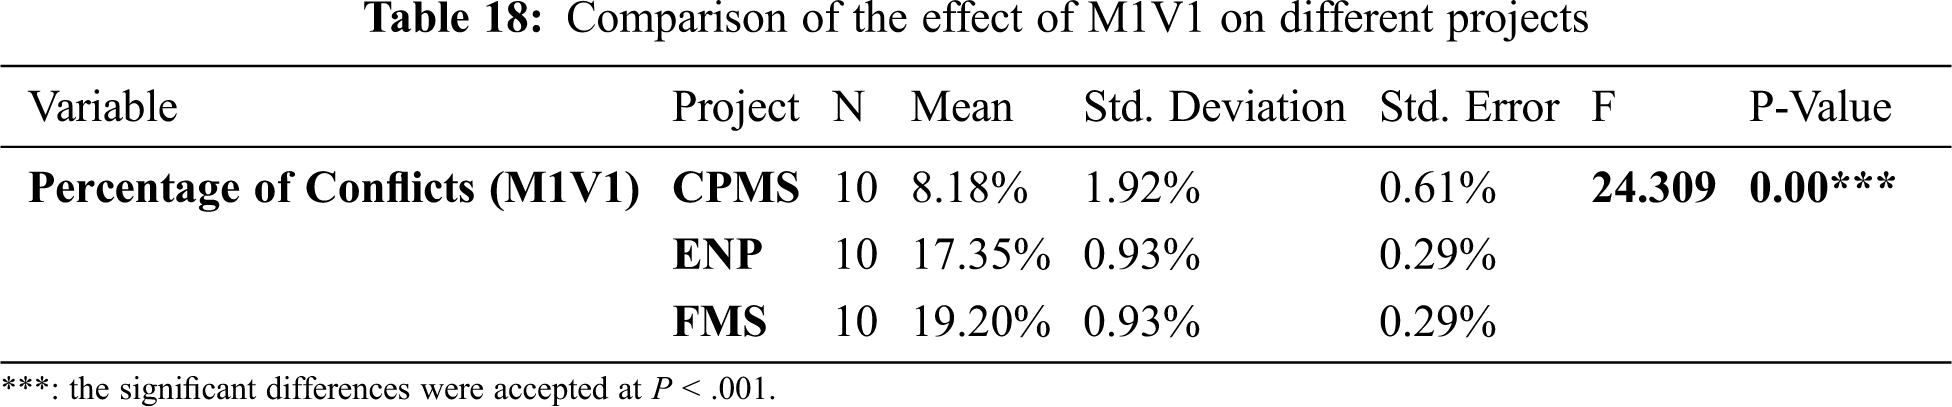
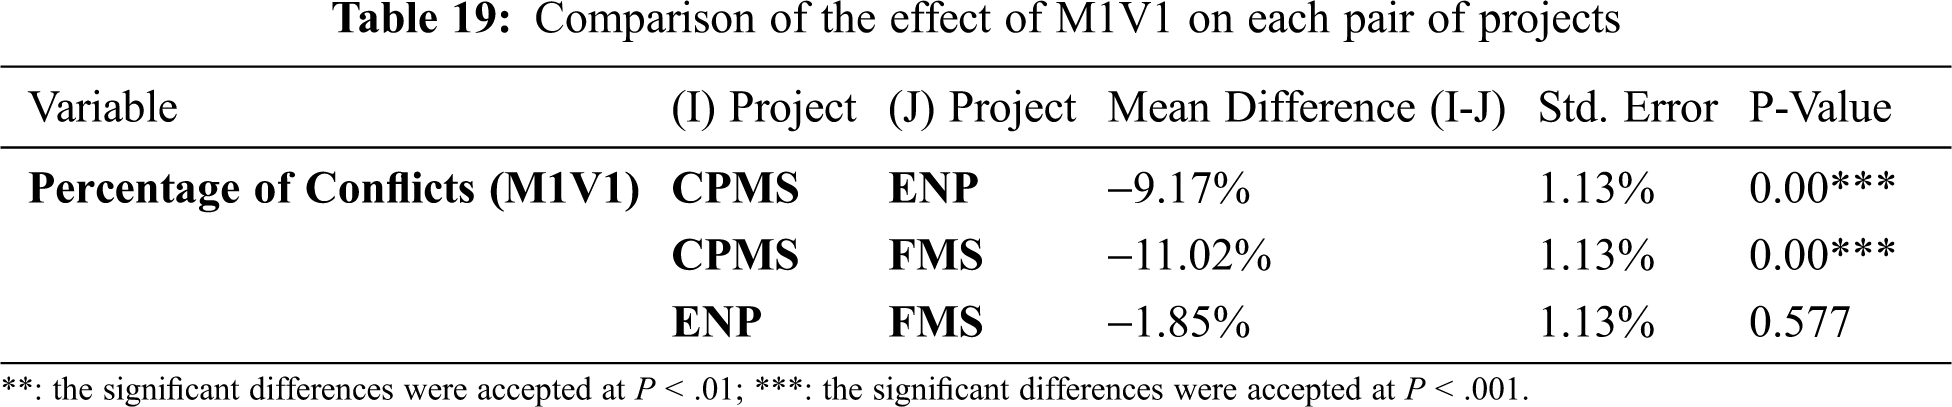
Fig. 5 displays the different effects of M1V1 on all projects. By comparing the difference between the conflicts in the original data and the conflicts mean in each project in Tab. 20, we can conclude that M1V1 has the best results in the ENP project, as well as very similar results in the FMS project.

Figure 5: Different effects of M1V1 in various projects

Tab. 21 demonstrates a significant difference in the performance of M1V2 in various projects, whereas Tab. 22 explains how the method has the same effect in ENP and FMS projects. The methods have different performances in all other pairs of projects.
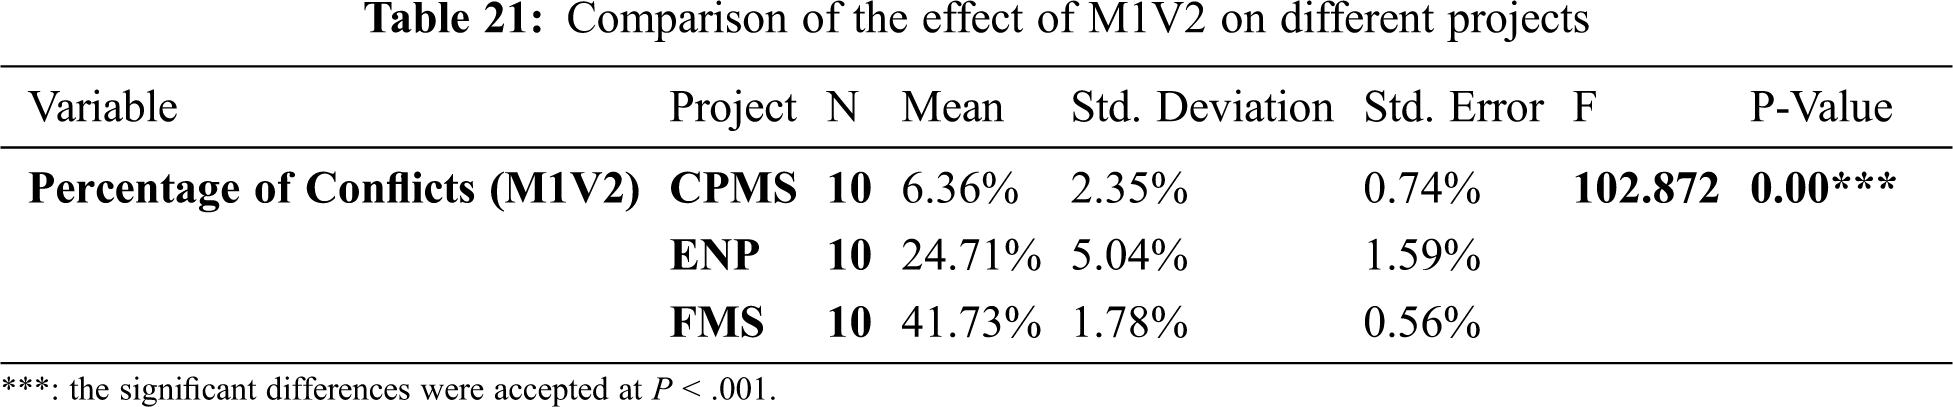
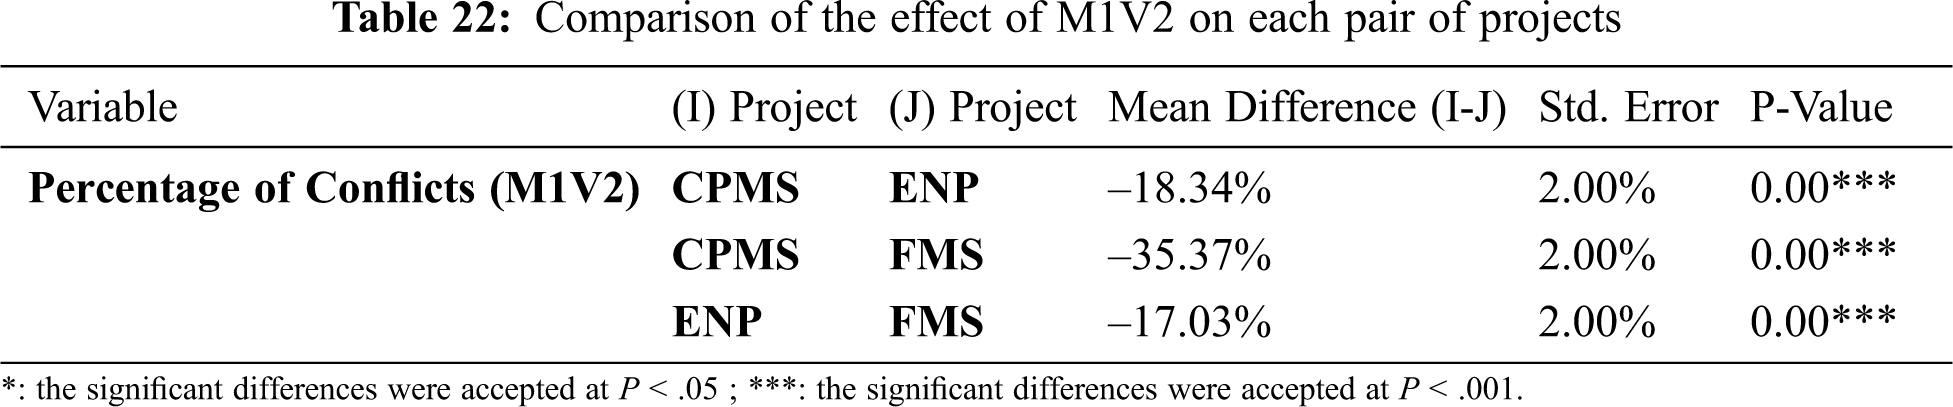
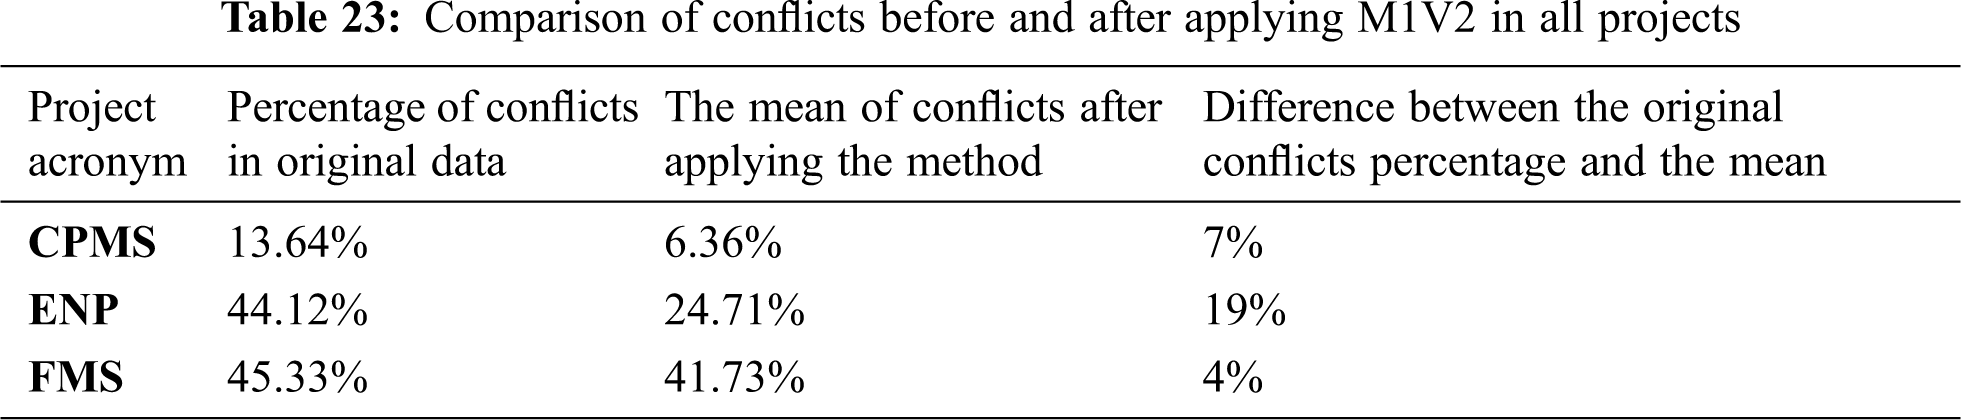
Fig. 6 below shows the different effects of M1V2 in all projects. When we compare the difference between the conflicts in the original data and the conflicts mean in each project in Tab. 23, we can infer that M1V2 works better in ENP.

Figure 6: Different effects of M1V2 in various projects
Tab. 24 posits that there is a significant difference in the performance of M2V1 in various projects, while Tab. 25 illustrates when the method has the same effect in a pair of projects and when its performance is different in other pairs of projects.

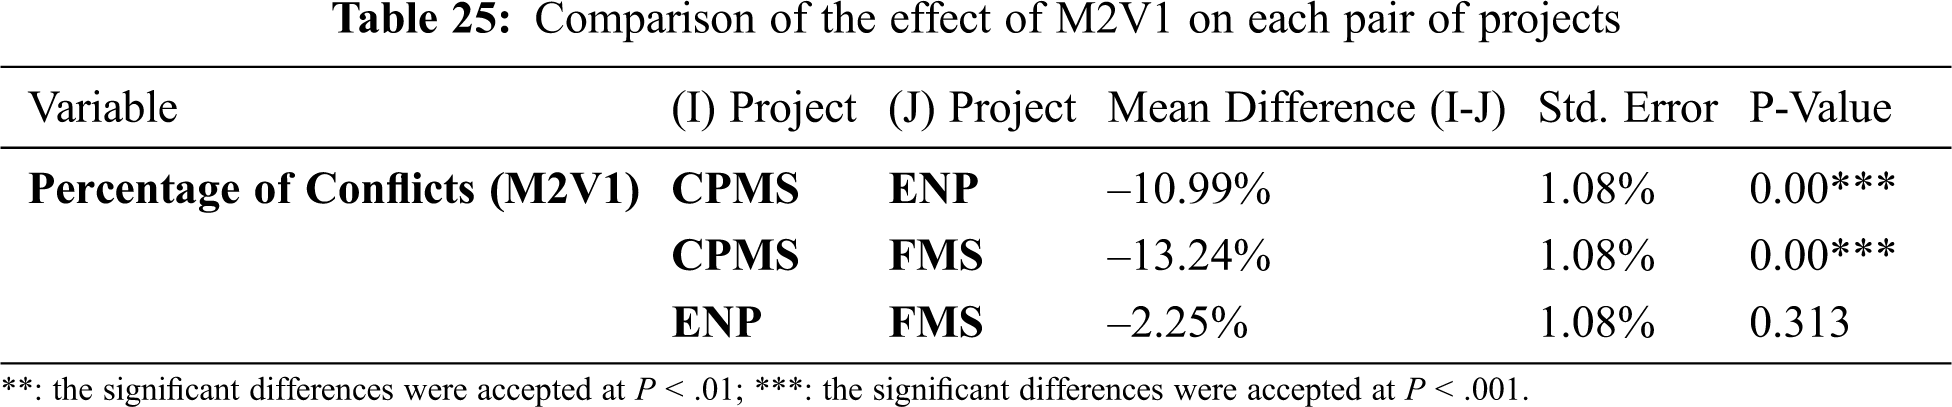
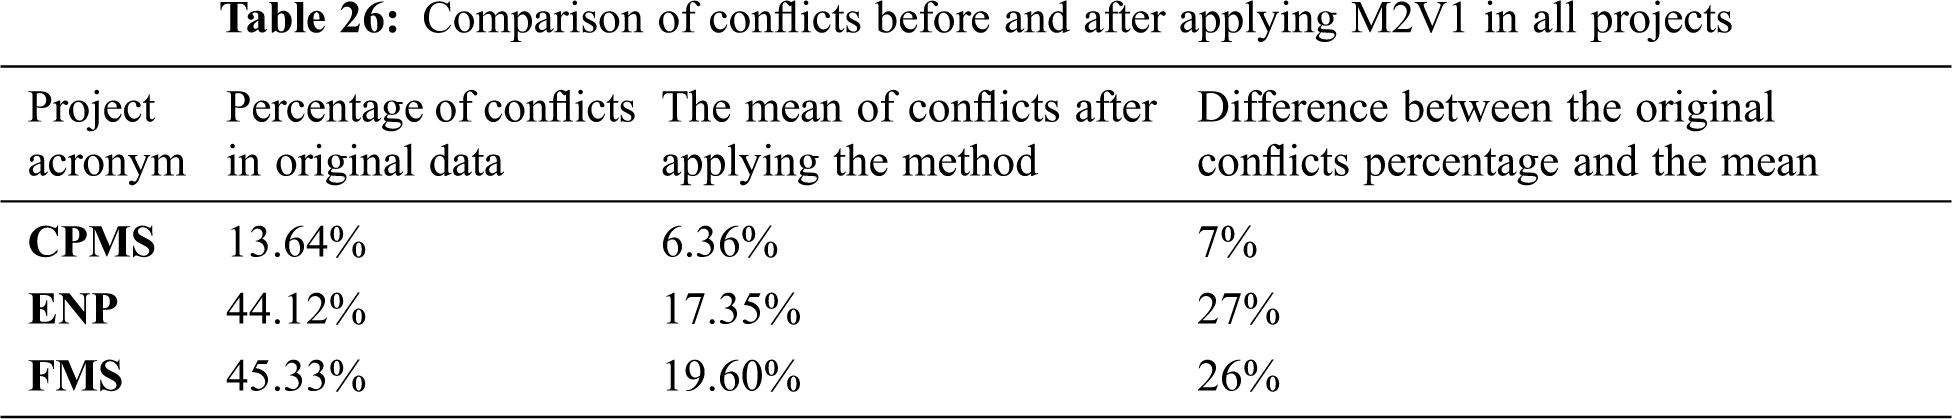
Fig. 7 shows the different effects of M2V1 in all projects. When studying the difference between the conflicts in the original data and the conflicts mean in each project in Tab. 26, it seemed that M2V1 yielded the best results in ENP with very close results in FMS.

Figure 7: Different effects of M2V1 in various projects
The p-value in Tab. 27 indicates a significant difference in the performance of M2V2 in various projects. Although Tab. 28 demonstrates that M2V2 had the same effects in the CPMS, ENP, and FMS projects, in all other pairs of projects, the method was affected differently.
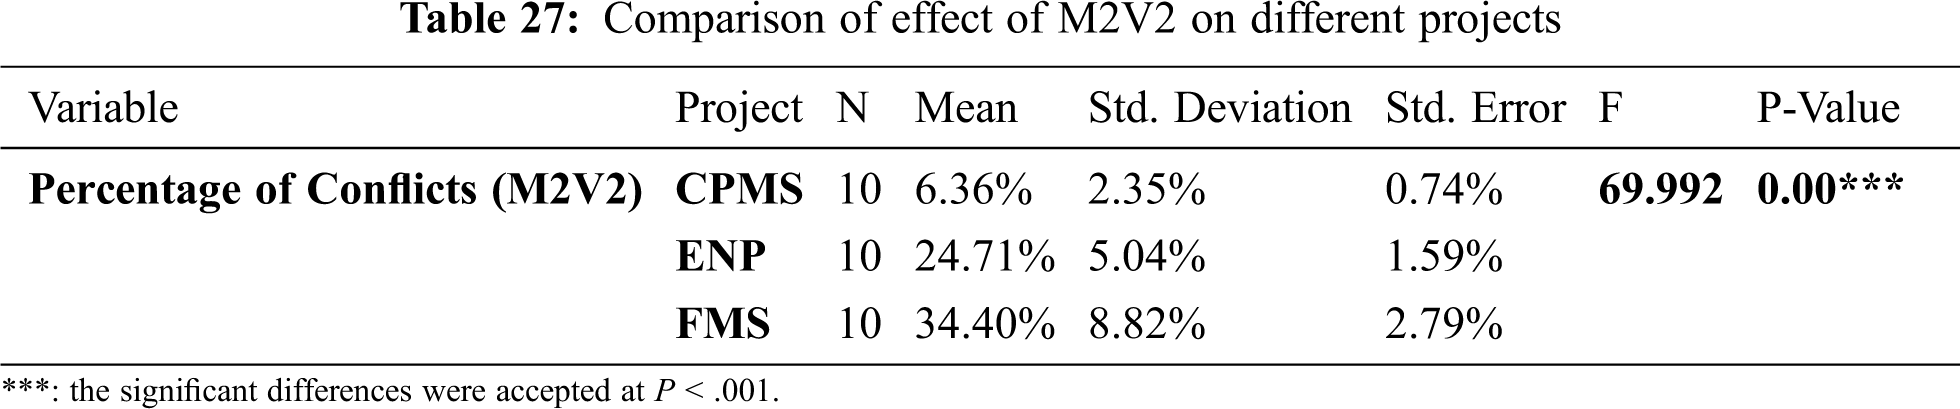
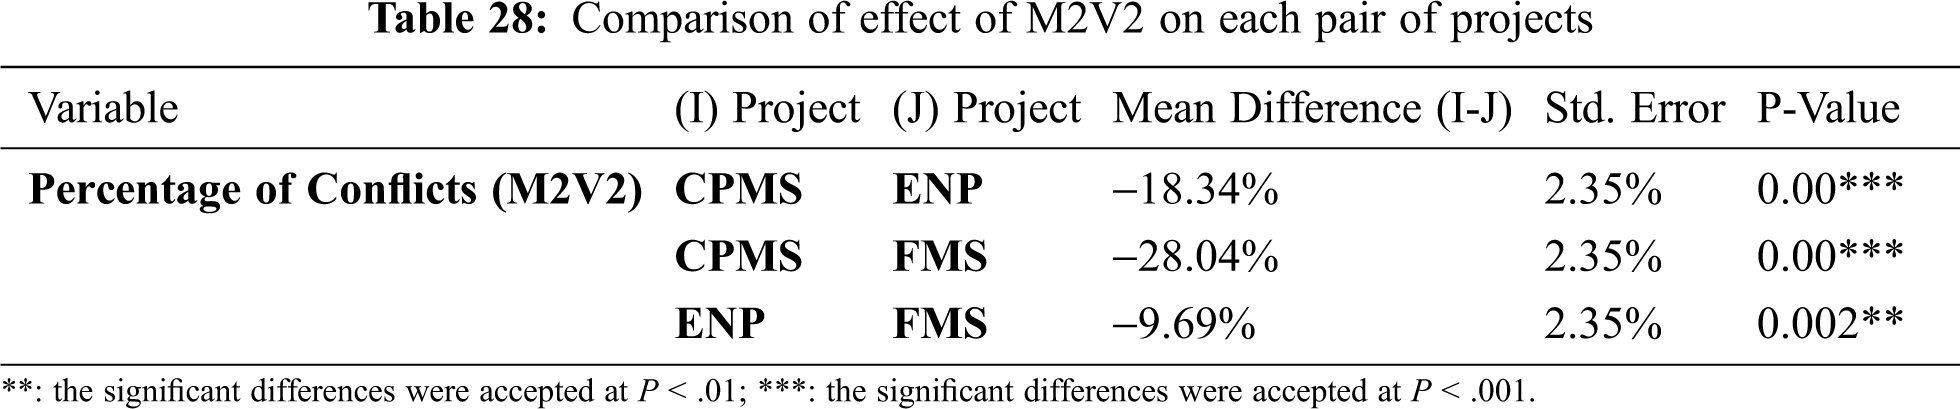
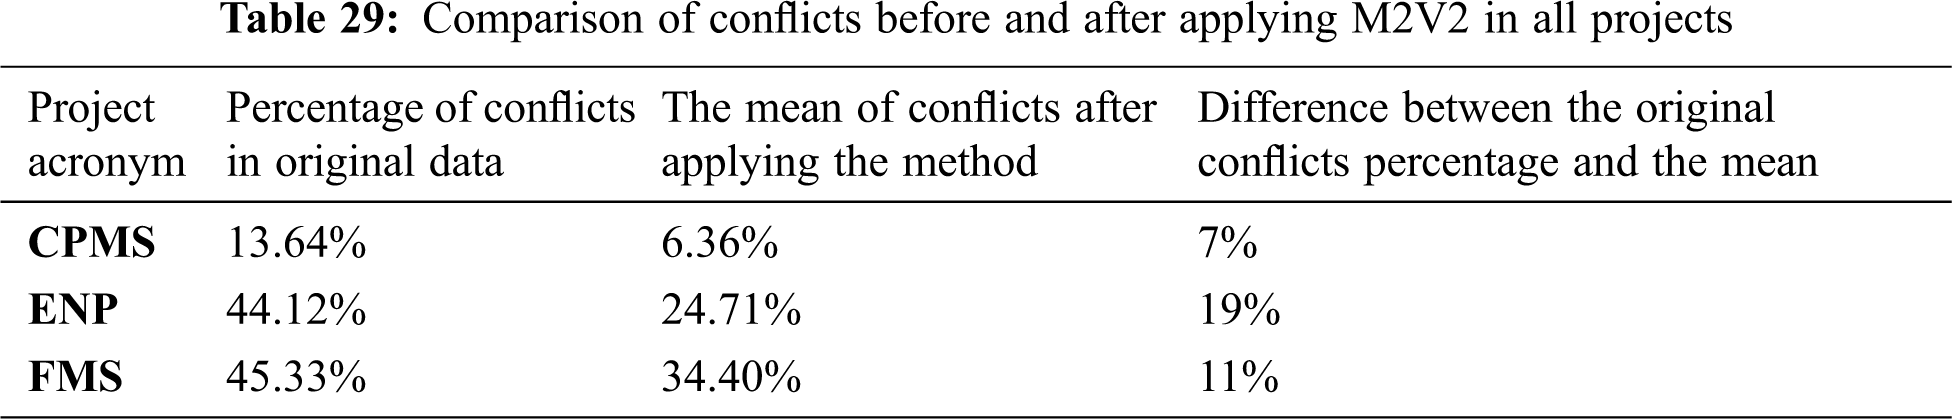
Fig. 8 explains the different effects of M2V2 in all projects. When comparing the difference between the conflicts in the original data and the conflicts mean in each project in Tab. 29, we can see that M2V2 had the best result in the ENP project with the largest difference than other projects.
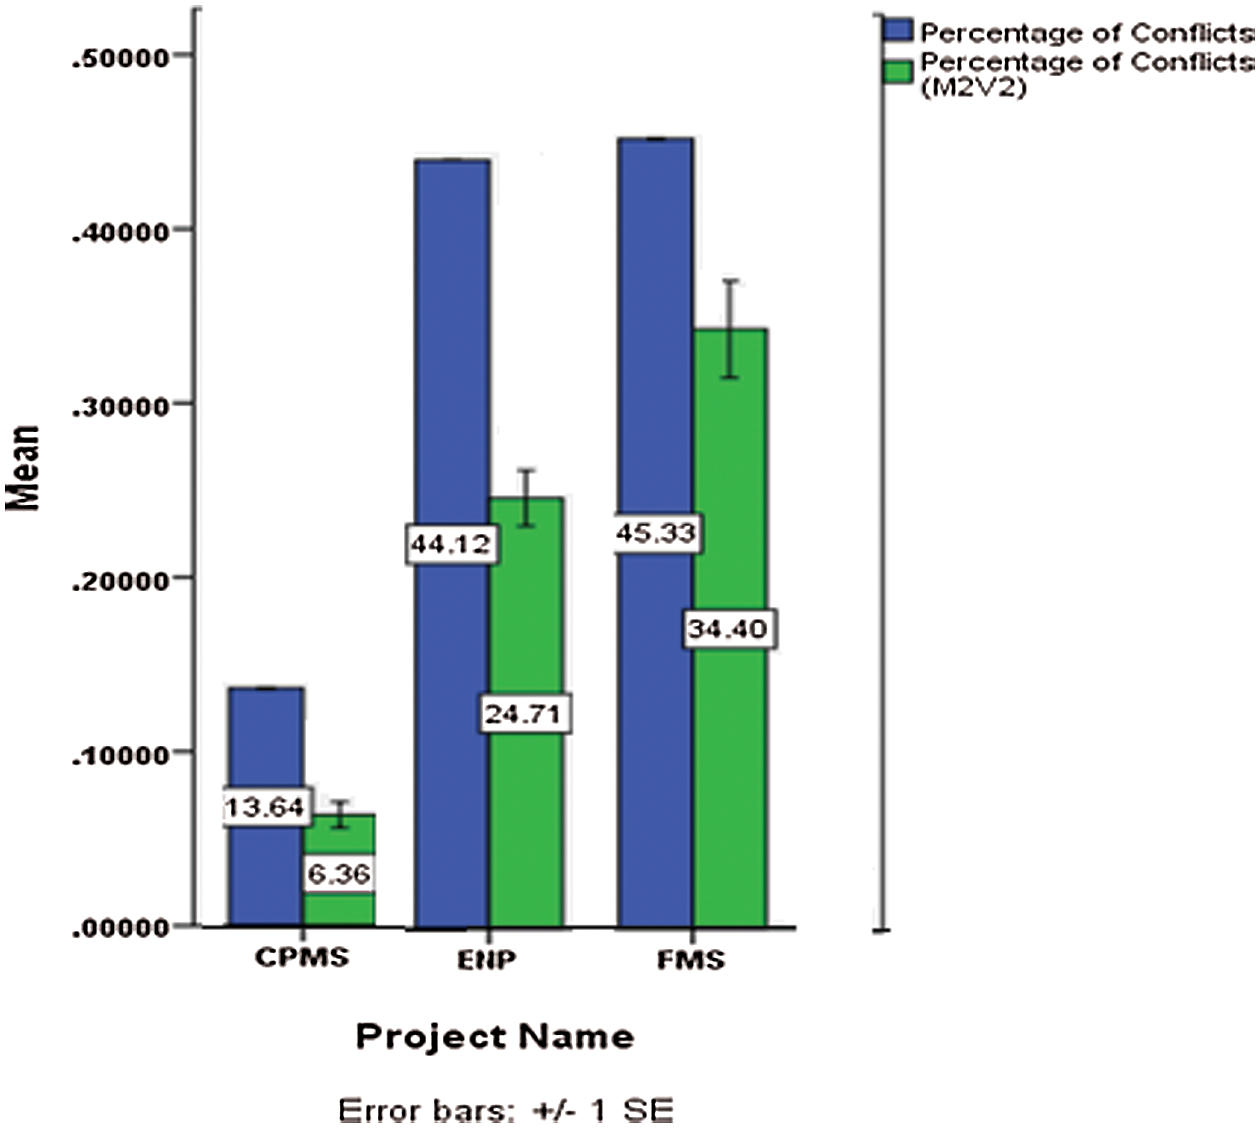
Figure 8: Different effects of M2V2 in various projects
3.4.2.4 Compare the Effect of Various Methods
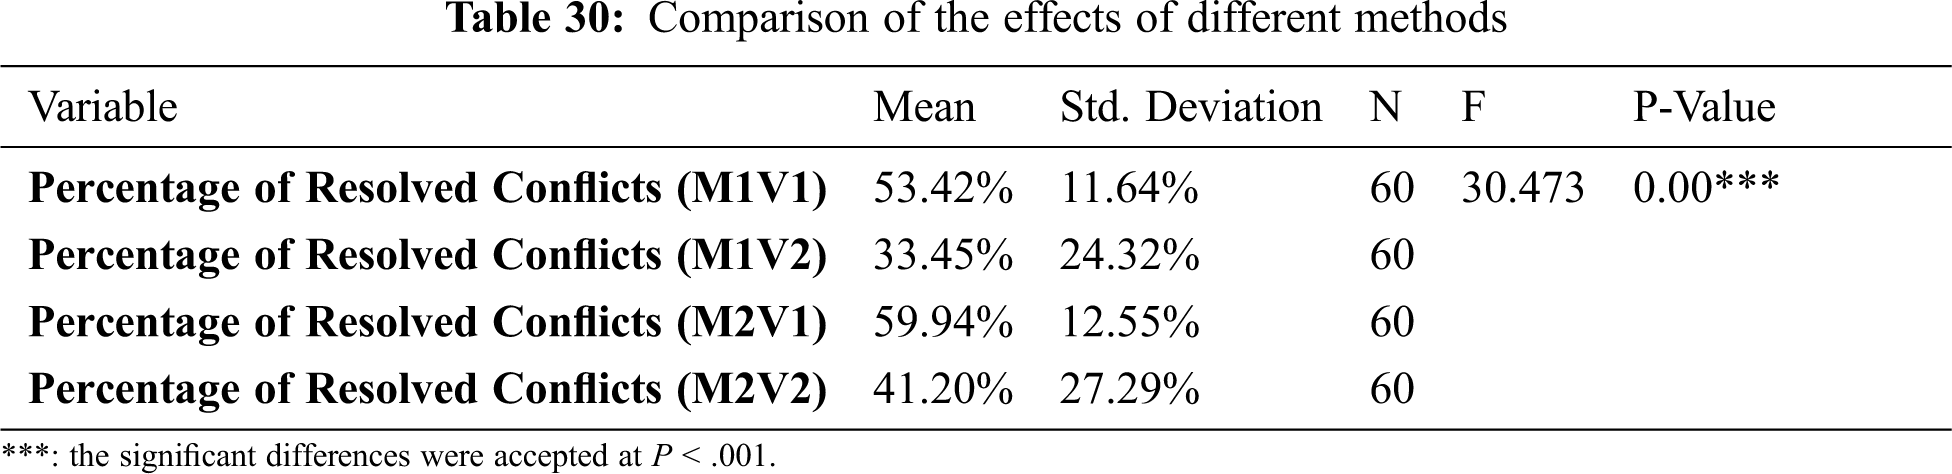
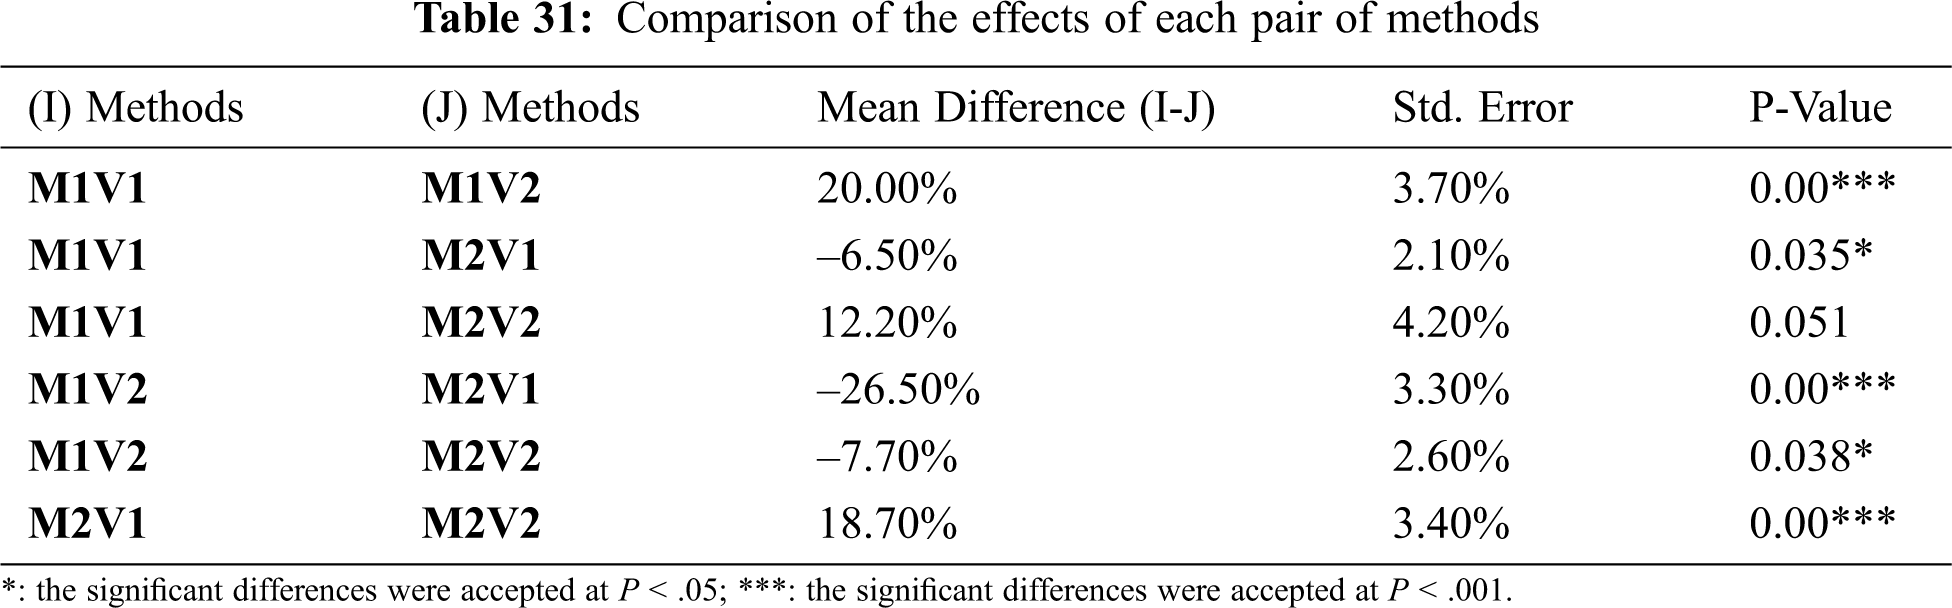
To check for a significant difference between the effects of various methods, a comparison of all the different methods based on the percentage of resolved conflicts was conducted. The p-value determined if there was a difference or not. If there is a significant difference, then a comparison between each of the two methods is conducted to determine exactly which methods have differences and which one has the same/similar effects. In addition, the tables show the difference between the means of both methods. If the mean is positive, this means that the first comparison method has a better result (more resolved) than the second method. If it is negative, then it is the opposite. Tab. 30 below shows that there is a significant difference in the effects of various methods. However, to examine which of the methods has differences, we can refer to Tab. 31 to compare each pair of methods; it illustrates that all comparisons between the methods show different effects except for M1V1 and M2V2 show a similar effect.
Fig. 9 shows the mean percentage comparison of the resolved conflicts for the different methods. It is clear that M2V1provides the best results with 59.94%, followed by M1V1 with 53.42% and M2V2 with 41.20%. The worst results are the M1V2 with 33.45%.

Figure 9: Comparison of the means of resolved conflicts in different methods
To sum up the results, with regards to the approach of automatically detecting the conflicts using a rule-based system, the method is considered effective as it detected conflicts correctly with 100% accuracy. The results demonstrate that for all three projects, all the different methods are effective in reducing and resolving the conflicts in varying efficiency ratios in comparison to the original conflict percentage. The method with the best performance for each project is determined and supported by graphs. From the first point of analysis, the results indicate that all the methods are effective in all the projects. However, how this effect is similar or different will be addressed in the second point of analysis.
The study indicates that for each project, there is a significant difference in the effect of the various methods in reducing the conflicts percentage. More specifically, a comparison of each pair of methods is conducted, which determined whether or not they share the same effect. If there is a different percentage, the better method is specified. After that, we contrasted the different effects of each method in various projects. We studied how the effect of each method was different in the various projects. Moreover, it is determined which method is more effective in which particular projects and these results are supported by graphs.
Finally, to test if there is a significant difference between different methods, a comparison between various methods based on the percentage of resolved conflicts is conducted. Three comparisons were made while eliminating the effect of the project name. The results show that the various methods have significant differences.
By applying an artificially intelligent technique to detect and resolve conflicts in requirements, the proposed technique warranted saving a lot of time and effort for the software engineers. Additionally, this increased the quality of analysis of the requirements, which in turn yielded more accurate results in detecting and resolving conflicts in requirements. The approach was evaluated after each stage. The first stage, detecting conflicts using a rule-based system, demonstrated a result correctly with an accuracy of 100%. The evaluation using the GA to resolve and reduce the conflicts in the second stage displayed extremely good results and achieved the desired goal of minimizing the number of conflicts. There were different objectives for the analysis of the results for this stage. The first goal was to demonstrate the effectiveness of the proposed approach in reducing the number of conflicts. The results demonstrated that for all three projects, the proposed technique was effective in reducing and resolving the conflicts in an optimized manner within acceptable thresholds. Moreover, this study showed that for each project, there was a significant difference in the effect of the proposed technique in reducing the percentage of conflicts.
In addition, two different methods were used for the basic algorithm with two versions of each. As a result, a total of four different methods were built, evaluated, and compared. The evaluation of the performance of the approach showed a high accuracy of 100% in detecting the conflicts correctly. The main goal of reducing the number of conflicts was achieved using the GA.
Funding Statement: The authors received no specific funding for this study.
Conflicts of Interest: The authors declare that they have no conflicts of interest to report regarding the present study.
1. T. Moser, D. Winkler, M. Heindl and S. Biffl, “Requirements management with semantic technology: An empirical study on automated requirements categorization and conflict analysis,” in Advanced information systems engineering: Proceedings of the 23rd International Conference (CAiSeLondon, United Kingdom, pp. 3–17, 2011. [Google Scholar]
2. B. H. C. Cheng and J. M. Atlee, “Research directions in requirements engineering,” in Future of Software Engineering (FOSE ’07), pp. 285–303, 2007. [Google Scholar]
3. C.-L. Liu, “Ontology-based requirements conflicts analysis in activity diagrams,” in Proc. of the Int. Conf. on Computational Science and its Applications, Part 11, ICCSA 2009, Seoul, South Korea, New York: Springer, pp. 1–12, 2009. [Google Scholar]
4. G. Aouad and Y. Arayici, “Requirements engineering in software development,” Requirements Engineering for Computer Integrated Environments in Construction. New York: Wiley-Blackwell, 13–39, 2010. [Google Scholar]
5. A. P. Engelbrecht, Computational Intelligence: An Introduction. New York, USA: John Wiley & Sons, 2007. [Google Scholar]
6. D. Mairiza, D. Zowghi and V. Gervasi, “Conflict characterization and analysis of nonfunctional requirements: An experimental approach,” in Intelligent Software Methodologies, Tools and Techniques (SoMeTProc. of the 12th Int. Conf. on New Trends in Software Methodologies, Tools and Techniques, IEEE Hungary, pp. 83–91, 2013. [Google Scholar]
7. E. R. Poort and P. H. N. de With, “Resolving requirement conflicts through non-functional decomposition,” in Software Architecture (WICSAProc. Fourth Working IEEE/IFIP Conf., Oslo, Norway, pp. 145–154, 2004. [Google Scholar]
8. S. S. Rao, “Introduction to Optimization,” in Engineering Optimization. New York, USA: John Wiley & Sons, Inc, pp. 1–62, 2009. [Google Scholar]
9. M. Aldekhail, A. Chikh and D. Ziani, “Software requirement conflicts identification: Review and recommendations,” International Journal of Advanced Computer Science and Applications, vol. 7, no. 10, pp. 326–335, 2016. [Google Scholar]
10. M. Aldekhail and D. Ziani, “Intelligent method for software requirement conflicts identification and removal: Proposed framework and analysis,” International Journal of Computer Science and Network Security, vol. 17, no. 12, pp. 91, 2017. [Google Scholar]
11. A. Ligeza, “Principles of verification of rule-based systems,” Logical Foundation for Rule-Based Systems. Springer, 191–197, 2006. [Google Scholar]
12. X. S. Yang, “Genetic algorithms,” in Nature-Inspired Optimization Algorithms. Oxford: Elsevier, pp. 77–87, 2014. [Google Scholar]
13. R. Malhotra, N. Singh and Y. Singh, “Genetic algorithms: Concepts, design for optimization of process controllers,” Computer and Information Science, vol. 4, no. 2, pp. 39–54, 2011. [Google Scholar]
14. B. Dorronsoro, P. Ruiz, G. Danoy, Y. Pigné and P. Bouvry, “Introduction to evolutionary algorithms,” in Evolutionary Algorithms for Mobile Ad Hoc Networks. New York: John Wiley & Sons, Inc, 27–47, 2014. [Google Scholar]
15. Y. H. Said, “On genetic algorithms and their applications,” Handbook of statistics, vol. 24, pp. 359–390, 2005. [Google Scholar]
 | This work is licensed under a Creative Commons Attribution 4.0 International License, which permits unrestricted use, distribution, and reproduction in any medium, provided the original work is properly cited. |