DOI:10.32604/csse.2022.016003
| Computer Systems Science & Engineering DOI:10.32604/csse.2022.016003 | |
| Article |
A Tradeoff Between Accuracy and Speed for K-Means Seed Determination
1Computer Engineering Department, Imam Khomeini International University, Qazvin, Iran
2Faculty of Science and Technology, University of the Faroe Islands, Torshavn, Faroe Islands
*Corresponding Author: Morteza Mohammadi Zanjireh. Email: Zanjireh@eng.ikiu.ac.ir
Received: 18 December 2020; Accepted: 30 April 2021
Abstract: With a sharp increase in the information volume, analyzing and retrieving this vast data volume is much more essential than ever. One of the main techniques that would be beneficial in this regard is called the Clustering method. Clustering aims to classify objects so that all objects within a cluster have similar features while other objects in different clusters are as distinct as possible. One of the most widely used clustering algorithms with the well and approved performance in different applications is the k-means algorithm. The main problem of the k-means algorithm is its performance which can be directly affected by the selection in the primary clusters. Lack of attention to this crucial issue has consequences such as creating empty clusters and decreasing the convergence time. Besides, the selection of appropriate initial seeds can reduce the cluster’s inconsistency. In this paper, we present a new method to determine the initial seeds of the k-mean algorithm to improve the accuracy and decrease the number of iterations of the algorithm. For this purpose, a new method is proposed considering the average distance between objects to determine the initial seeds. Our method attempts to provide a proper tradeoff between the accuracy and speed of the clustering algorithm. The experimental results showed that our proposed approach outperforms the Chithra with 1.7% and 2.1% in terms of clustering accuracy for Wine and Abalone detection data, respectively. Furthermore, achieved results indicate that comparing with the Reverse Nearest Neighbor (RNN) search approach, the proposed method has a higher convergence speed.
Keywords: Data clustering; k-means algorithm; information retrieval; outlier detection; clustering accuracy; unsupervised learning
Machine Learning (ML) is a widely used field in data science that tries to increases the learning abilities of machines employing learning algorithms. It is classifying into two categories; Supervised and Unsupervised learning methods [1,2]. One of the unsupervised ML methods deployed to create clusters with similar objects is called clustering. Ideally, after the clustering, all objects within a cluster have the highest similarity while other objects of different clusters are distinguishable well [3,4]. Clustering not only can analyze the data without labels but also can label them [5]. The cluster-based analysis has numerous applications in marketing, economic sciences, pattern recognition, data analysis, image processing, text identification, Ad-hoc & Sensor Networks, and security issues [3,6–8].
K-means algorithm is one of the most popular algorithms in this field due to its simplicity [9]. The steps of the k-means algorithm are [10]:
1-The k points are selected randomly as the initial seeds (k is selected among n available points).
2-Each object is located in the corresponding cluster according to its similarity to the initial seeds.
3-Cluster centers are computed. Each cluster center is equivalent to the average object in that cluster.
4-According to the new cluster centers, the second and third steps will be repeated until no change is seen in clusters (the algorithm is terminated).
Despite the widespread usage of the k-means algorithm, it suffers from a few drawbacks. These drawbacks include the problem of determining the number of clusters in advance of algorithm implementation [11], its restriction to the dense clusters with spherical shape [12], and high sensitivity to the outliers and noises because of using the square Euclidean distance metric [13]. Moreover, the Local Optimum convergence problem [14,15] and the Performance dependency to the primary seed selection [14,15] are its other drawbacks. Nevertheless, the clustering sensitivity to the initial seeds is the most noticeable issue because this can lead to empty clusters and even slower run time [16]. Also, selecting appropriate initial seeds leads to a decrease in inter-cluster inconsistencies. In other words, while the primary seeds are near to their optimum values, the clustering quality would be significantly improved and vice versa. Other problems, except determining the number of clusters, can be addressed by selecting the proper initial clusters in their early stage [14].
Therefore, this research is focusing on determining the initial seeds in the k-mean’s algorithm properly. The proper selection of initial seeds increases the clustering accuracy and reduces the total number of iterations. The closer initial conditions to their optimum values lead to the clustering accuracy increases, and consequently, the number of iterations decreases [16]. This issue is a considerable advantage for processing big datasets.
Thus far, many efforts have been made to select optimal seeds. Usually, in existing methods, the clustering accuracy and its run-time are inversely related to each other. In other words, the clustering speed is reducing with increasing the clustering accuracy. In this paper, a method with the k-means algorithm is presented that provides a proper tradeoff between accuracy and speed. We mainly focus on outlier data to reduce the sensitivity to the noise and outlier. The appropriate selection of the seeds is a noticeable improvement in both accuracy and speed. It is critical to avoid choosing outlier data as initial seeds. In contrast to the most available literature, we consider several important subjects such as data distribution and outlier removal. Finally, our proposed method is compared with several others approaches using two criteria: accuracy and the number of convergence iterations. The rest of this paper is organized as follows:
The literature and background of this research are presented in the next section. In Section 3, our proposed method is discussed in detail. The experimental results are shown in Section 4. Finally, in the Section 5, conclusions and our suggestions for future works are presented.
The quality of the clustering algorithm has been considerably affecting by initial seeds. Thus several approaches have been presented for addressing this problem [17]. In this section, a number of the most well-known methods for initializing seeds, their positive and negative points, and their sensitivity to the outliers are investigated.
The first method for seed initialization is presented in [18]. In this method, the initial k seeds are selected randomly from the dataset, and the rest are assigned to other clusters. This method uses the fact that by random selection of primary clusters, the probability of selecting the nearest points to the center of the clusters is more likely to be considered as the primary clusters [3]. In other words, more density points (points that are good candidates) are more likely to be selected as primary candidates. In other words, despite its simplicity and high speed, different runs might cause results.
In [19], selected only K seeds are assigning randomly to one of the K nearest cluster centers. Then, the k-mean should be run before the next point assignment. The disadvantage of this method is its high computational complexity; therefore, it is not suitable for large databases [20].
Faber [21] also chose initial solutions randomly from the dataset by itself rather than data space. Primary data are selected from data points in the dataset rather than from data space. This method can lead to more accurate clustering results in many cases. In several methods, the initial k seeds are considered as primary values. If the pixels are randomly arranged, this method is similar to the Faber method [9].
In various methods, the initial seeds are determined based on the data density [9,22]. Its main problem is its meager run time. However, there are high costs to compute the density and order of them [3]. In 2012, Kathiresan et al. [23], instead of density data, set the data based on the Z-Score. The Z-Score indicates that the given data is higher or lower than the mean value [14].
In Tou et al. [24], the first point of the dataset is selected as the first seed. Then, the distance from this point to the next point in the data is computed and considered the second seed. This distance must be greater than the threshold. Otherwise, the next point in the dataset is spotted, and these steps are repeated until finding the second seed [16]. Once the second seed is selected, the distances between the third and two previous seeds are computed and compared with the threshold. If both are more than the threshold, then the point is chosen as the third seed. These steps continue until selecting k’th seeds [14]. In this method, the user can control the distance between cluster centers. The results of this method are dependent on the data orders in the dataset. The main problem of this method is determining the threshold value by the user [3].
In the Boryczka [25] method, the data with the highest samples in the center is considered the first seed. The next one is selecting based on the Sum of Squared Errors (SSE) reduction. A point located a greater distance with previous resolutions is selected as the next step [14]. This process continues until finding the kth point. Because of the distance computing of each pair of objects in each iteration, the time complexity of this method is O(
KKZ (Katsavounidis et al. [27]) algorithm is similar to the previous method, but they considered the first data as the edge data. After, the far point regarding the first one is selected as the second seed. Then the distance of all points is calculated, and the nearest point is determined. The point with more distance from the nearest neighbor pixels is selected as the third seed [3]. These steps continue to determine the kth point. Outliers and noises in the dataset can degrade this method effectively [28].
In [29], a new approach called Bootstrap was presented. This approach initially selects S samples randomly from primary data (S = 10 was recommended by them). Then, the k-means algorithm is implemented on each subset. They claimed that their algorithm is robust against outlier data with high efficiency [17]. The main disadvantage of their method is its massive computation requirement. Therefore, this algorithm cannot be used in situations where time, space, and speed are noticeable. In some cases, to improve the results, they combined the k-means method with hierarchical clustering [14,30]. Since outliers and noises cause inappropriate clustering results, several methods are avoiding them as selected initial seeds. In Random Partition Method [31], the dataset is divided into K clusters. Each data is allocated to one of the clusters based on uniform distribution. Then, the cluster center is calculated as its primary seed for all clusters. These steps are repeated several times to achieve the best clustering result [31]. This method is fast with the linear time complexity. The main drawback of this method is its different clustering results in different execution times. If the outlier data is selected as the seed, it may lead to an empty cluster. Also, in this approach, there is no mechanism to prevent close points as the initial seeds.
In research [32], they developed an advanced algorithm to find primary seeds. At the first step, the distance between each pair of data is calculated. Two closest points are added to A1 and removed from the D set. Then, those data closer to the A1 elements are inserted in A1 and are removed from the D set. This rule is repeated until the number of elements of the A1 points reached the threshold. In the second stage, A2 is crated, and this procedure continues until the kth set, Ak, is filled. Now, the average of all elements in the Ai is considered as i’th seed (i = {1, 2, …, k}).
In this section, our novel and efficient methodology for determining the initial seeds of the k-means algorithm is presented. Before diving into our model, it is necessary to know more about two relevant studies introduced by Chithra et al. [8] and Karbasi [5]. Then, our proposed method is demonstrated in more detail.
This method is similar to K-means++. The k-means++ method is one of the most popular methods in the k-means family by reducing iterations numbers. The k-means++ algorithm converges quickly with higher accuracy [33]. Its details are as follows:
At first, a particular point among all data is spotted as Ext. This point should have the most significant gap rather than others. Fig. 1 shows a dataset with ten samples in 2D space (the Ext point is marked by Red color). Euclidean distance from all the remaining points to the Ext is computed (1.22, 2.01, 3.04, 3.51, 8.01, 9.27, 10.10, 11.14, and 12.02). Then, all points are sorted based on the distance from the point to point (See Fig. 1). After distance sorting, the difference between two consecutive distances is obtained.
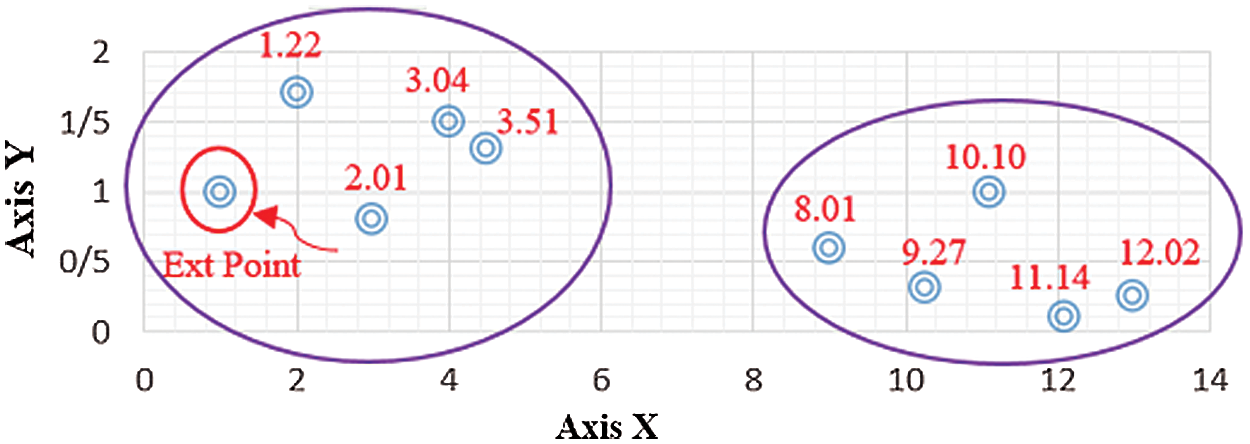
Figure 1: The grouped data points
After calculating the difference in two consecutive distances, we obtain the mean values of the previous step (the mean value = 1.35). Then, all the distances are divided into “m” groups. The value of m is unknown before this step. According to Fig. 1, the two successive distances with a smaller or equal amount to the mean value are placed in the same group. Now, the value of m = 2 is obtained.
Depending on the k value, one of the following three cases may occur:
A) If
B)
C)
One of the essential advantages of this method is its high convergence speed compared to many methods. The placement of members with distance less equal or equal to the average distance in a group leads to a more accurate result. The initial seeds are closer to the final values, and the algorithm converges in its very early steps. It is worthy of mentioning that in large databases, decreasing one stage of the k-means algorithm leads to a significant increase in speed [5].
In this method, at first, the range of attribute values is calculated and stored in the “R” variable. The proposed method is based on numeric attributes. The range of the values is limited to the subtraction of the minimum and maximum values. The variable is the result of R dividing by the number of clusters. The first seed would be the sum of the minimum value, while the rest are obtained from previous seed and
3.3 The First Proposed Algorithm
The main problem of the Chithra method is the lack of attention to the data distribution in the data space. For example, in both the distributed data and high-density data, the primary seeds are considered the same. As said before, in their algorithm, the minimum and maximum amounts are used to calculate the initial seeds without any knowledge about data distribution. After obtaining the range of values, it is divided into k of the same portion. Each seed has the same distance as compared to previous ones. In some data, the seeds’ distance may not be the same. As a result, it reduces the clustering accuracy and increases the convergence time of the algorithm.
Lack of attention to the extent of data distribution causes some unwanted problems, such as creating empty clusters. To solve the mentioned problem, we involve the following steps in our algorithm:
Definition of
1. Initialization of the
2. Applying the updating procedure for
Considering the mean distance, if the distances of the points are high, each seed would be more distinguishable than the last seed. The
3.4 The Second Proposed Algorithm
The main drawback of the Chithra method is ignoring the outliers. Although outlier detection would be considered as the extra step, it can affect the clustering results noticeably. In particular, in the applications that clustering tasks have to be run dynamically and frequently. Consider the following example shown in Fig. 2 with two clusters and two outlier points. For clustering these data using the k-means algorithm, two primary seeds should be determined at the first step (Fig. 2). Besides, the primary seeds selected and clustering implemented according to the Chithra algorithm (Fig. 3).
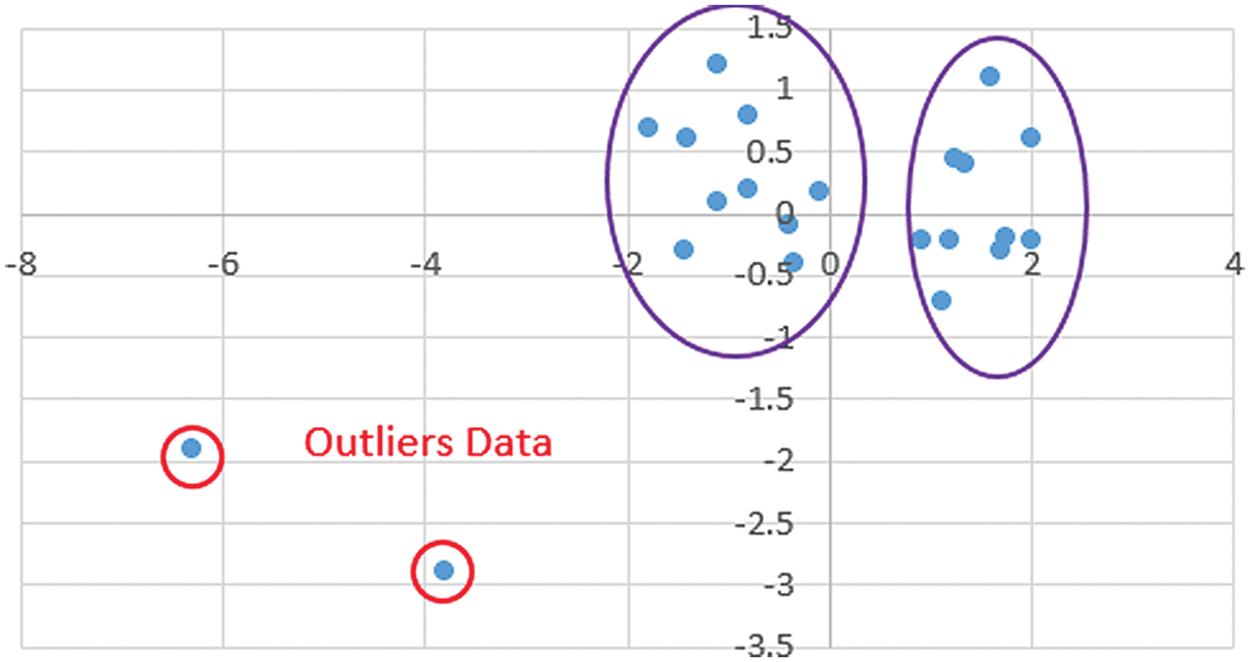
Figure 2: A sample dataset with two clusters and two outlier points
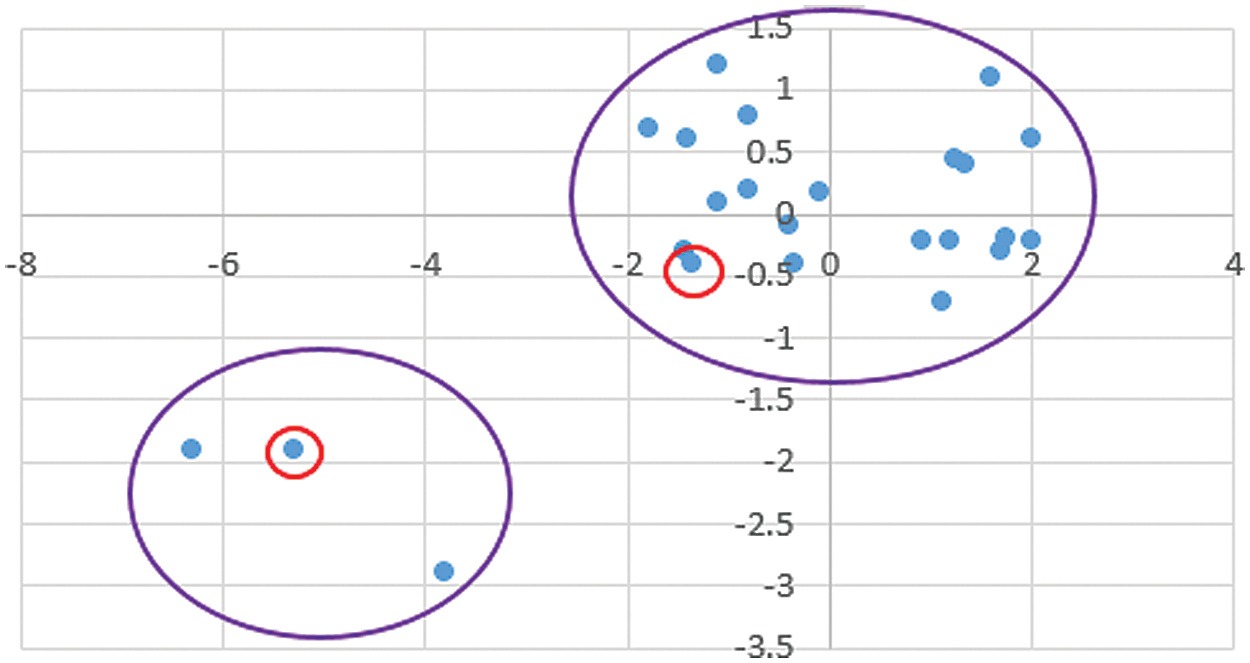
Figure 3: The clustering results of the Chithra model at the first iteration
In the next step, the average of each cluster is calculated as the center of that cluster. After determining these centers, data clustering is not changed from the previous stage, and the algorithm ends up. Now, the final clustering of the data is shown in Fig. 4.
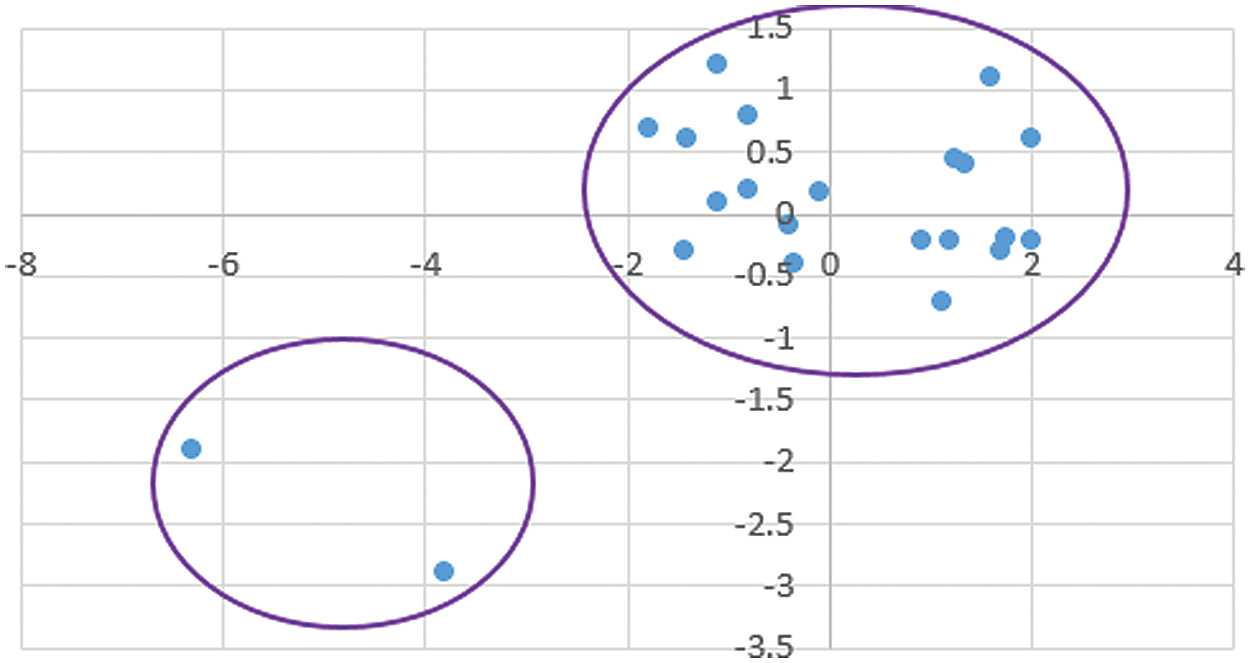
Figure 4: The final result of the clustering (Chithra model)
As shown clearly, the outliers are allocated in one cluster while the rest of the data (the mainstream of the data) are clustered into another. This issue is because Chithra tries to separate the data to k parts equally without any attention to the data distribution. For this reason, if outliers are available in the dataset (something that is not avoidable in the real world), the clustering quality might be decreased strongly. Even in some cases, this may lead to empty clusters. For example, consider the data set presented in Fig. 5, then Fig. 6 shows the primary seeds and clustering results after implementing the k-means algorithm in the first iteration.
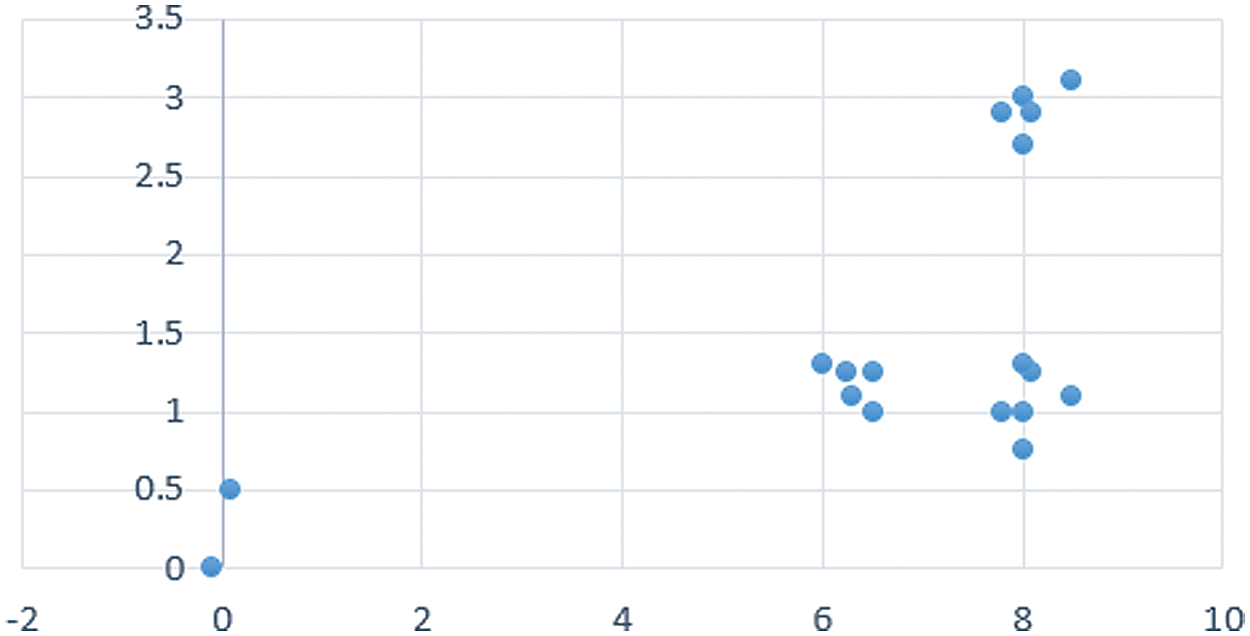
Figure 5: A sample dataset including three clusters and two outliers
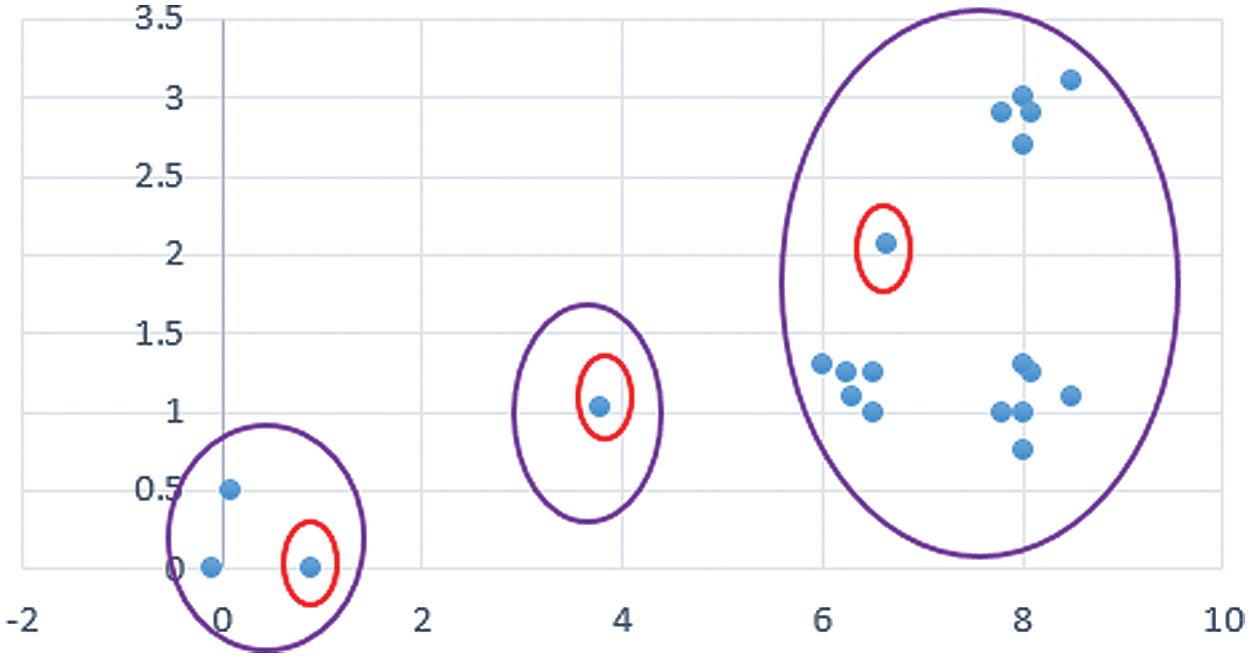
Figure 6: The clustering results in the first iteration
Now, the average of each cluster is determined as the new center (Fig. 7). Then, the clusters are reconfigured concerning the assigned center. A shown in Fig. 7, no data is assigned to the second cluster (same as in the previous one). Because the cluster centers have remained constant during this step, the algorithm is terminated. The consequent result is shown in Fig. 7.
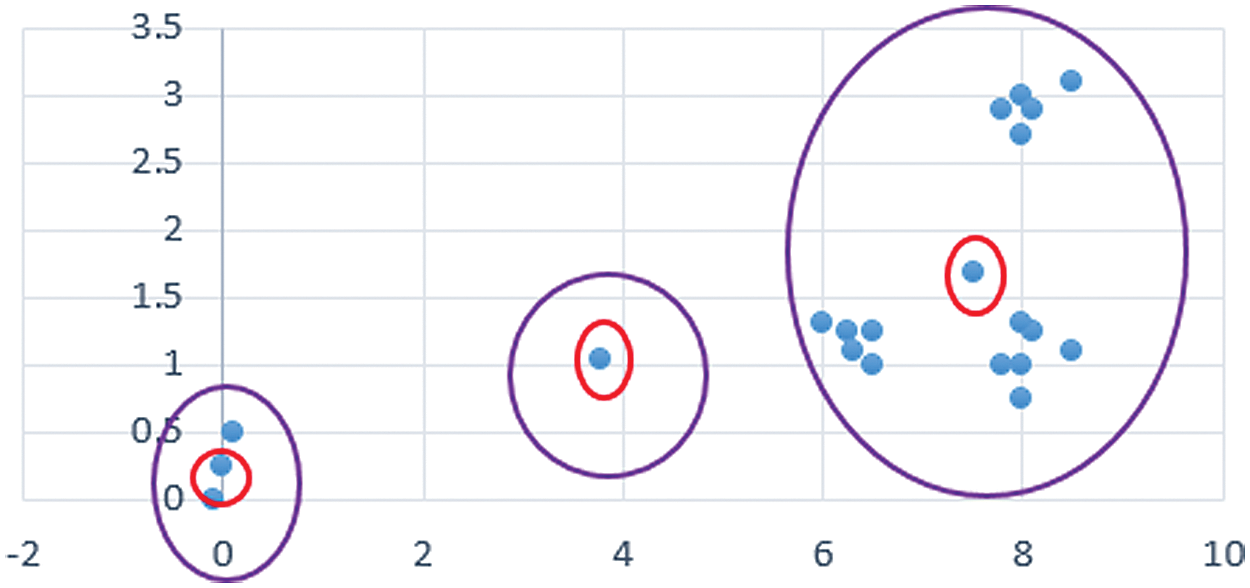
Figure 7: The data clustering at the final iteration
However, in the first proposed method, the data sparsity is considered, it might lead to empty clusters. Our evaluation shows that outliers are considered as primary seeds in some scenarios. To solve the mentioned issues, we first divide the data into m groups found on the Paniz algorithm and remove groups with the number of elements less than or equal to three. We know that outlier objects have more distance than others. Since we employed the average distance during our clustering method, outliers are separated from others. In other words, because outlier objects usually have more distance than average distance, they are placed in separate groups. Here, m is the number of remaining groups after the removal of some clusters. For instance, if we obtain five groups at the beginning of the task and then one is removed, m is considered to 5. Recalling one of the three cases described in Sections 3-1, the first proposed method is used to determine the initial seeds instead of considering the middle of numbers in each group. The second proposed method is as follow:
1. We are detecting outliers found on the Paniz approach.
2. Following these rules for the obtained clusters in the previous iteration:
• Definition of
• Initialization of the
• Applying the updating procedure for
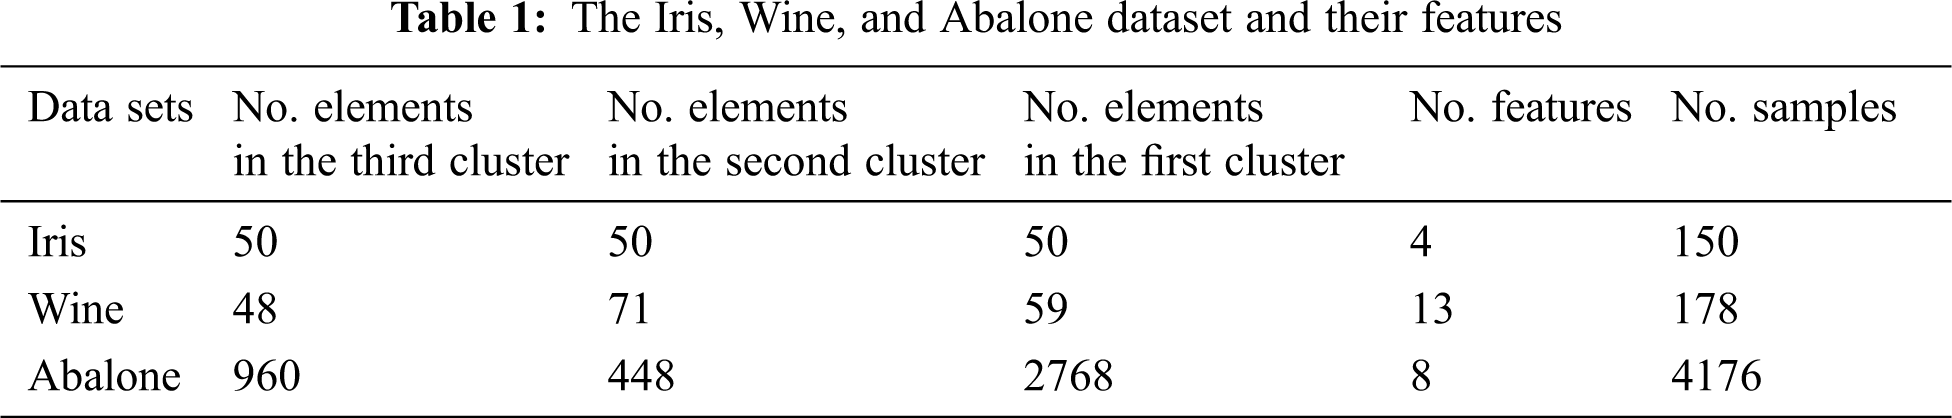
To evaluate the performance of our proposed method, we use the Iris, Wine, and Abalone datasets which are popular datasets for clustering [22]. Tab. 1 shows the information about each dataset used to evaluate the results.
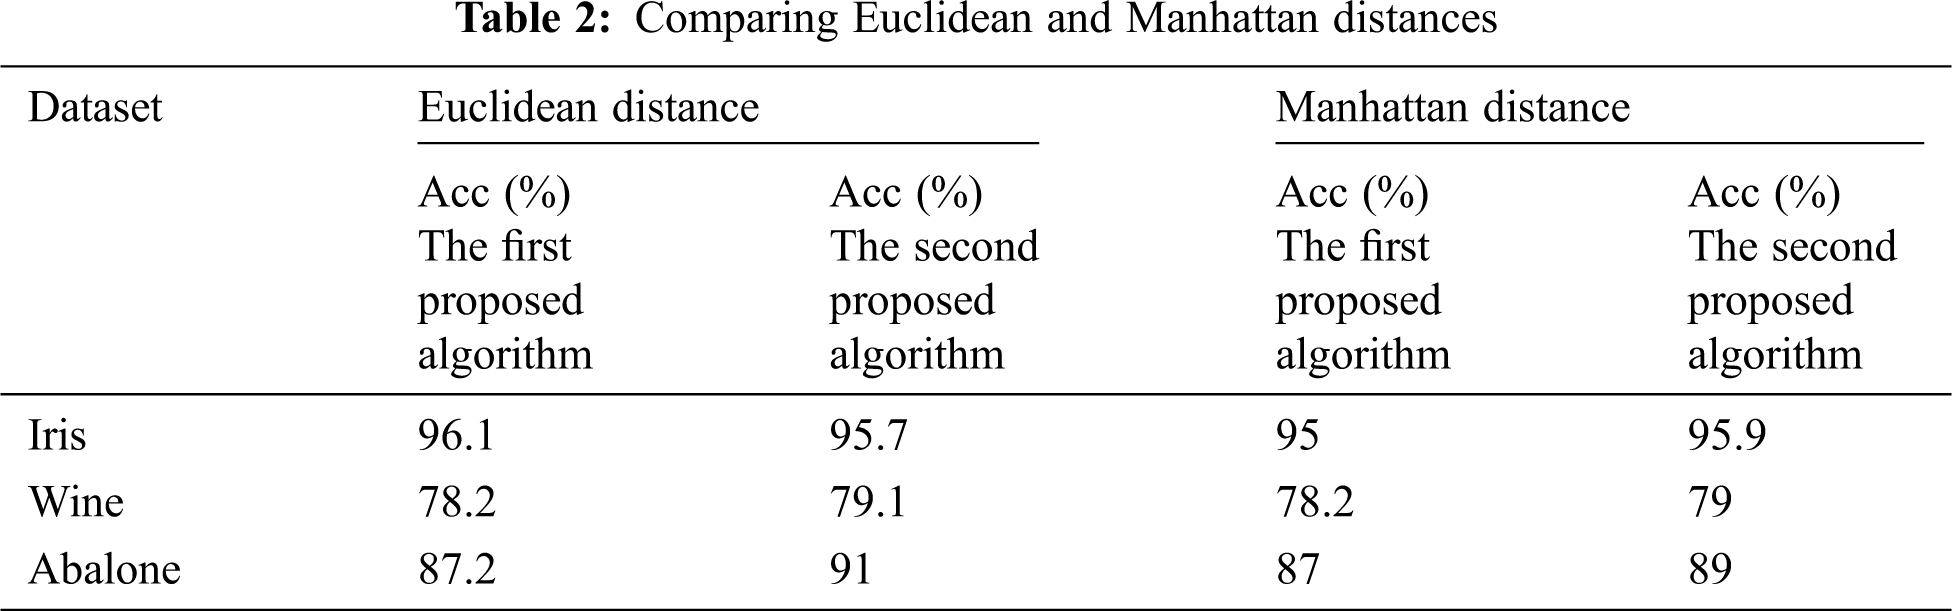
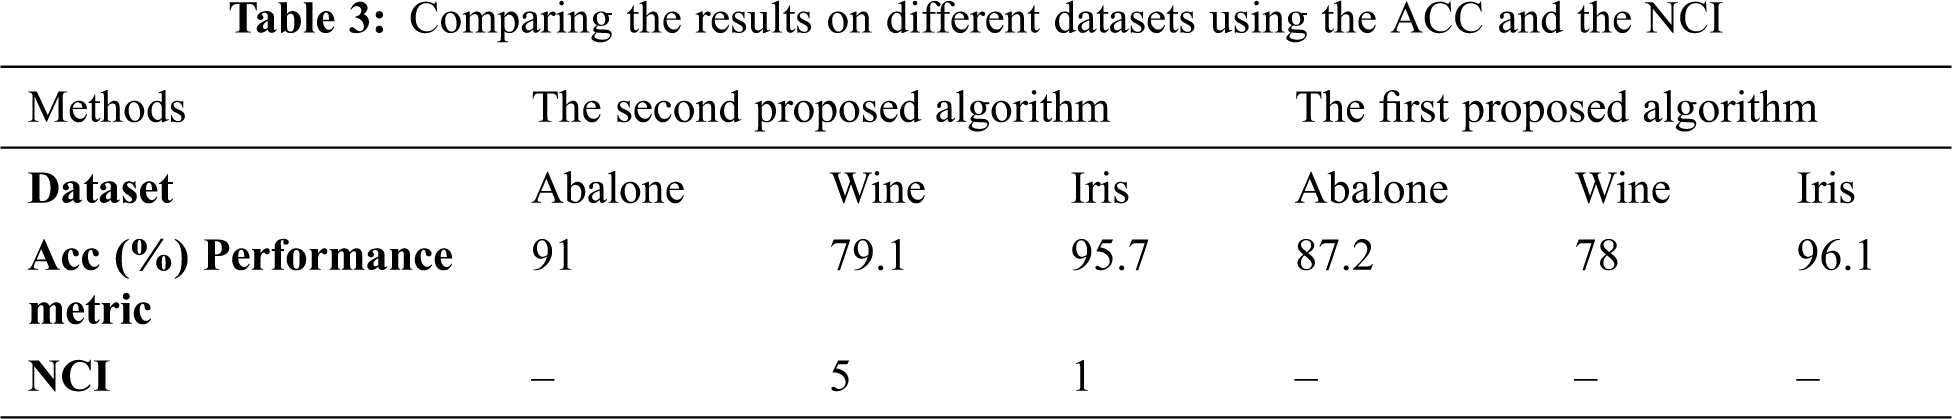
The clustering algorithm consists of two parts: The primary seeds selection and the k-means algorithm implemented in C++. The criteria used to evaluate the performance of the methods are the Accuracy (Acc) and the Number of Convergence Iterations (NCI). One of the essential performance metrics for determining the clustering results is accuracy. The Acc shows that what percentage of the datasets are appropriately clustered. Another criterion is to count the number of iterations to achieve convergence or NCI. The lower NCI shows that better performance is achieved. The lower NCI occurs when initial seeds are closely selected to the original cluster centers. In this research, the Euclidean and Manhattan distance measures are employed to measure the difference between two elements in the clustering procedure. Usually, better accuracy is obtained while using Euclidean distance. In our first and second proposed methods, we achieved slightly more accuracy using Euclidean distance rather than Manhattan distance (Approximately 0.43% and 0.63% higher accuracy than Manhattan distance). The obtained accuracy is shown using the Euclidean and Manhattan distance of Tab. 2. In the following, we only use Euclidean distance to present the results. In Tab. 3, we compare the achieved clustering results on different datasets using the Acc and the NCI.
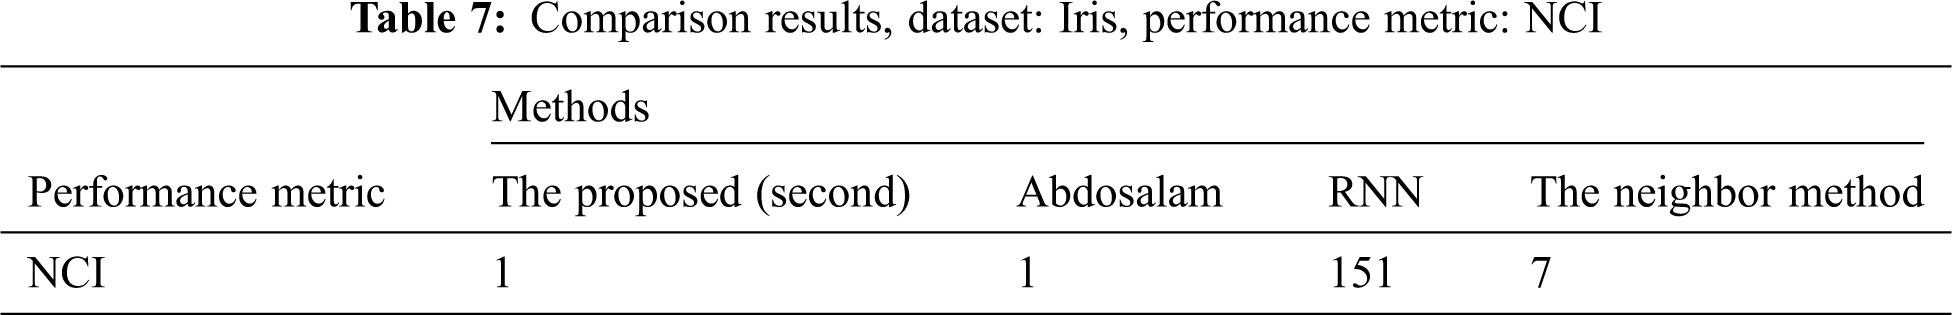
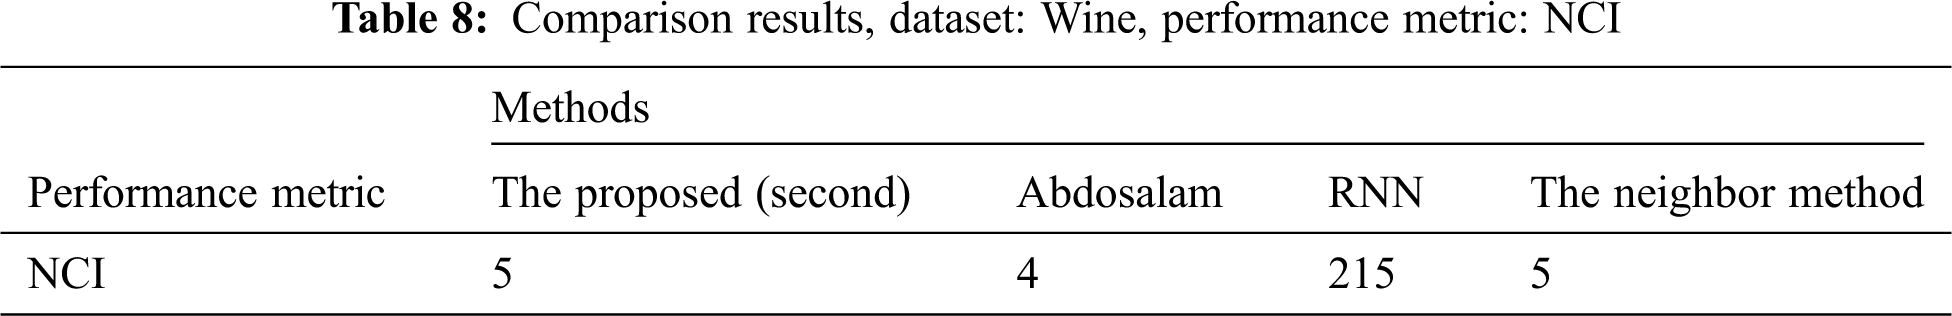
Now, we should compare our achieved results with available algorithms under similar conditions. Tabs. 4–6 draw a wide comparison on Iris, Wine, and Abalone dataset based on the Acc. Furthermore, Tabs. 7 and 8 also compare the clustering results with [8,11,26,34,35] found on NCI.
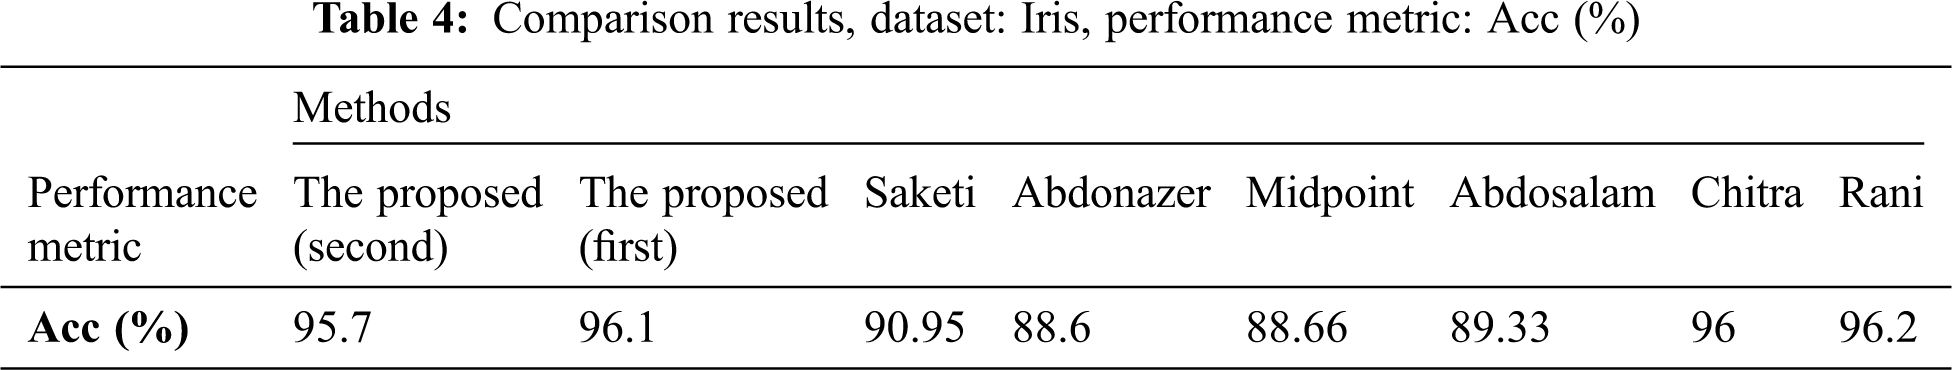
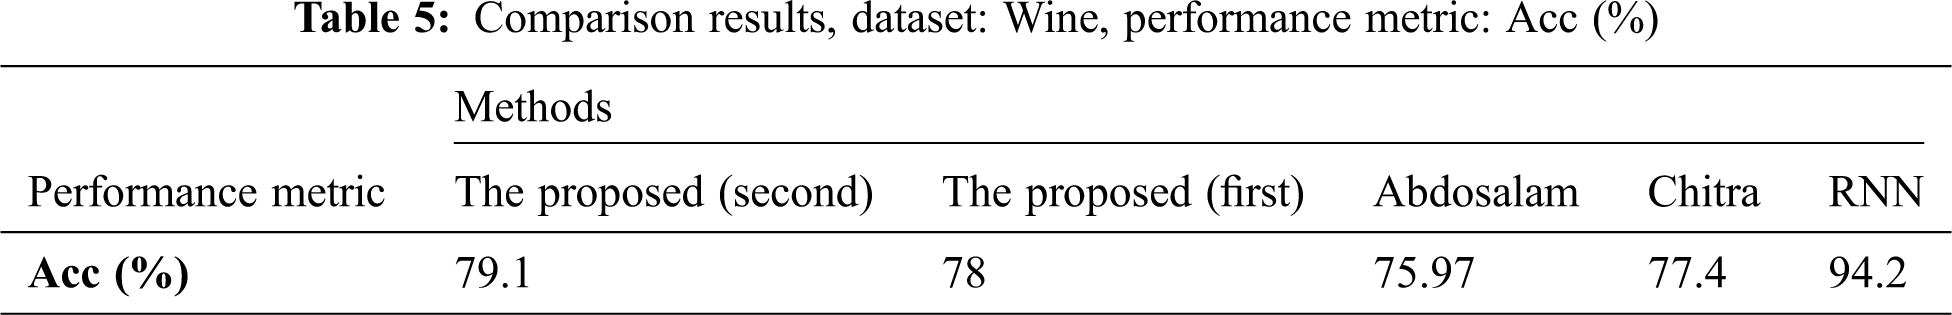
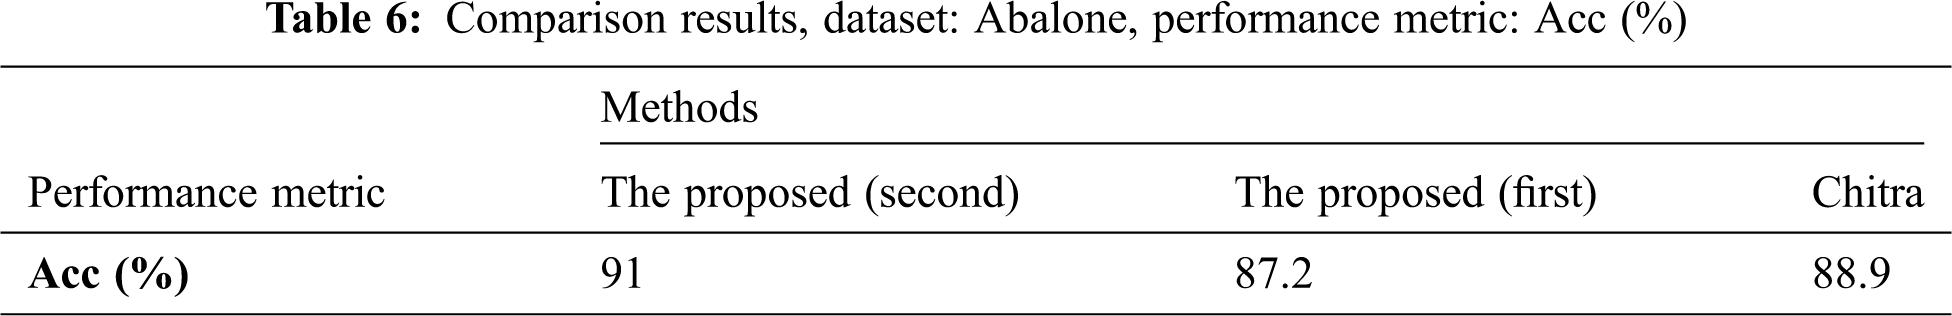
Tabs. 4–8 show that the accuracy of the proposed methods on the Iris dataset outperforms other methods in most cases. The accuracy of our method on Wine and Abalone are improved by about 1.7% and 2.1% comparing with the Chithra method. Besides, the number of iterations for our proposed method hit the minimum value compared to others, chiefly.
The NCI of our proposed method is 1 and 5 for the Iris and Wine datasets, respectively, while it is 151 and 252 for Reverse Nearest Neighbor (RNN) approach. These noticeable achievements demonstrate that our algorithm can spot the primary seeds in its very early iteration. Our selected primary seeds are very close to the actual cluster centers. It is worthy of considering that the lower NCI leads to a faster execution time. The reason for increasing the accuracy and decreasing the NCI is considering the data distribution and removing outliers in our proposed algorithm.
Clustering is an unsupervised machine learning method that aims to create clusters with similar objects. The clustering received considerable attention due to its deep and wide usage in different applications such as marketing, economics, sciences, pattern recognition, computer vision, and information analysis. One of the popular clustering algorithms is the k-means algorithm. Its popularity is due to its simplicity. Nevertheless, it has some disadvantages such as the problem of its requirement for determining the number of clusters in advance, its restriction to the dense clusters with a spherical shape, high sensitivity to the outliers, the local optimum convergence problem, performance dependency to the selection of the initial seeds, and the dead-unit. Among all the mentioned problems, the performance dependency on selecting the primary seeds is much more noticeable than others. Because all other problems can be solved by selecting the appropriate initial seeds, on the other hand, increasing speed and accuracy are related inversely. As a result, increasing one causes another to decrease and vice versa.
Our proposed method tries to establish a proper tradeoff between these two factors. In our method, the data with equal or less than the average distance are allocated to the same group. Those groups with the number of members equal to or less than a threshold are then considered as the outliers and removed from the dataset. Next, the minimum plus half of the mean value of the group is calculated as the seed. In our algorithm, due to distributing seeds among all data space and avoiding outliers as the primary seeds, both high Acc and low NCI are obtained together. This achievement is essential, particularly for big data applications. The proposed algorithm prevents the point-of-spot problem and is a good selection for large databases. Our proposed method is evaluated with the Iris, Wine, and Abalone datasets. In brief, the experimental results showed that our proposed approach outperforms the Chithra with 1.7% and 2.1% in terms of the clustering accuracy for the Wine and Abalone detection datasets, respectively. Besides, we achieved the NCI of about 1 and 5 for the Iris and Wine datasets, respectively. Compare it with 151 and 252 for Reverse Nearest Neighbor (RNN) approach. These noticeable achievements show that our algorithm is strong enough to find the primary seeds near their optimum values in its very early iterations.
Currently, most clustering methods are designed for static data. In the current study, the performance of our proposed algorithm was evaluated on static data as well. In future works, we study the performance and effectiveness of the proposed method on dynamic data found on more complex outlier removal algorithm found on the machine learning and deep learning algorithms [36–43].
Funding Statement : The authors received no specific funding for this study.
Conflicts of Interest: The authors declare that they have no conflicts of interest to report regarding the present study.
1. S. Theodoridis and K. Konstantinos, Pattern Recognition, 2nd ed., Amsterdam, Netherlands: Elsevier, 2003. [Google Scholar]
2. V. Vu and N. Labroche, “Active seed selection for constrained clustering,” Intelligent Data Analysis, vol. 21, no. 3, pp. 537–552, 2017. [Google Scholar]
3. H. Singh and K. Kaur, “Review of existing methods for finding initial clusters in K-means algorithm,” International Journal of Computer Applications, vol. 68, no. 14, pp. 24–28, 2013. [Google Scholar]
4. A. Jain, “Data clustering: 50 years beyond K-means,” Pattern Recognition Letters, vol. 31, no. 8, pp. 651–666, 2010. [Google Scholar]
5. P. Karbasi, “A fast seeding technique for k-means algorithm,” Ph.D. dissertation. Baylor University, 2014. [Google Scholar]
6. G. Gan and K. M., “Ng, k -means clustering with outlier removal,” Pattern Recognition Letters, vol. 90, no. 2, pp. 8–14, 2017. [Google Scholar]
7. M. B. Abubaker, Efficient Data Clustering Algorithms. Gaza: Islamic University of Gaza, 2013. [Google Scholar]
8. P. L. Chithra and U. Jeyapriya, “Premeditated initial points for K-means clustering,” International Journal of Computer Science and Information Security, vol. 15, no. 9, pp. 278–281, 2017. [Google Scholar]
9. D. Steinley and M. J. Brusco, “Initializing K-means batch clustering: A critical evaluation of several techniques,” Journal of Classification, vol. 24, no. 1, pp. 99–121, 2007. [Google Scholar]
10. A. Patel and P. Singh, “New approach for K-mean and K-medoids algorithm,” International Journal of Computer Applications Technology and Research, vol. 2, no. 1, pp. 1–5, 2013. [Google Scholar]
11. D. S. Rani and V. Shenbagamuthu, “Modified K-means algorithm for initial centroid detection,” International Journal of Innovative Research in Computer and Communication Engineering, vol. 2, no. 1, pp. 1562–1565, 2007. [Google Scholar]
12. J. Peña, J. Lozano and P. Larrañaga, “An empirical comparison of four initialization methods for the K-means algorithm,” Pattern Recognition Letter, vol. 20, no. 10, pp. 1027–1040, 1999. [Google Scholar]
13. J. J. Manoharan, S. H. Ganesh and J. G. R. Sathiaseelan, “Outlier detection using enhanced K-means clustering algorithm and weight-based center approach,” International Journal of Innovative Research in Computer and Communication Engineering, vol. 5, no. 4, pp. 453–464, 2016. [Google Scholar]
14. T. M. Kodinariya, “Survey on exiting method for selecting initial centroids in K-means clustering,” International Journal of Engineering Development and Research, vol. 2, no. 2, pp. 2865–2868, 2014. [Google Scholar]
15. S. Shabazhusen and A. P. Ketan, “A survey paper on improvisation of K-means clustering algorithm with implementation on e-commerce data,” International Journal for Scientific Research and Development, vol. 5, no. 1, pp. 125–128, 2017. [Google Scholar]
16. K. Kaur, D. Dhaliwal and R. K. Vohra, “Statistically refining the initial points for K-means clustering algorithm,” International Journal of Advanced Research in Computer Engineering & Technology, vol. 2, no. 11, pp. 2278–1323, 2013. [Google Scholar]
17. M. E. Celebi, H. A. Kingravi and P. A. Vela, “A comparative study of efficient initialization methods for the k-means clustering algorithm,” Expert Systems with Applications, vol. 40, no. 1, pp. 200–210, 2013. [Google Scholar]
18. E. W. Forgy, “Cluster analysis of multivariate data: Efficiency versus interpretability of classifications,” Biometrics, vol. 21, no. 3, pp. 768–769, 1965. [Google Scholar]
19. J. Macqueen, “Some methods for classification and analysis of multivariate observation,” in Proc. of the 5th Berkeley Symp. on Mathematical Statistics and Probability, Berkeley, USA, vol. 1, pp. 281–297, 1967. [Google Scholar]
20. F. Khan, “An initial seed selection algorithm for k-means clustering of georeferenced data to improve replicability of cluster assignments for mapping application,” Applied Soft Computing, vol. 12, no. 11, pp. 3698–3700, 2012. [Google Scholar]
21. V. Faber, “Clustering and the continuous k-means algorithm,” Los Alamos Science, vol. 1, no. 22, pp. 138–144, 1994. [Google Scholar]
22. S. S. Khan and A. Ahmad, “Cluster center initialization algorithm for K-means clustering,” Pattern Recognition Letter, vol. 25, no. 11, pp. 1293–1302, 2004. [Google Scholar]
23. V. Kathiresan and P. Sumathi, “An efficient clustering algorithm based on Z-score ranking method,” in Int. Conf. on Computer Communication and Informatics, Coimbatore, India, pp. 10–13, 2012. [Google Scholar]
24. J. T. Tou and R. C. Gonzalez, Pattern Recognition Principles. Boston, USA: Addison-Wesley, 1974. [Google Scholar]
25. U. Boryczka, “Finding groups in data: Cluster analysis with ants,” Applied Soft Computing, vol. 9, no. 1, pp. 61–70, 2009. [Google Scholar]
26. M. Sakthi and A. S. Thanamani, “An effective determination of initial centroids in K-means clustering using kernel PCA,” International Journal of Computer Science and Information Technologies, vol. 2, no. 3, pp. 955–959, 2011. [Google Scholar]
27. I. Katsavounidis, C. J. Kuo and Z. Zhang, “A new initialization technique for generalized Lloyd iteration,” IEEE Signal Processing Letters, vol. 1, no. 10, pp. 144–146, 1994. [Google Scholar]
28. R. T. Aldahdooh and W. Ashour, “DIMK-means distance-based initialization method for K-means clustering algorithm,” International Journal of Intelligent Systems and Applications, vol. 5, no. 2, pp. 41–51, 2013. [Google Scholar]
29. P. S. Bradley and U. M. Fayyad, “Refining initial points for K-means clustering,” in Proc. of the 15th Int. Conf. on Machine Learning, San Francisco, USA, pp. 91–99, 1998. [Google Scholar]
30. T. Su and J. Dy, “A deterministic method for initializing K-means clustering,” in 16th IEEE Int. Conf. on Tools with Artificial Intelligence, Boca Raton, FL, USA, pp. 784–786, 2004. [Google Scholar]
31. D. Steinley, “Local optima in K-means clustering: What you don’t know may hurt you,” Psychological Methods, vol. 8, no. 3, pp. 294–304, 2003. [Google Scholar]
32. K. A. A. Nazeer and M. P. Sebastian, “Improving the accuracy and efficiency of the K-means clustering algorithm,” in Proc. of the World Congress on Engineering, vol. 1, 2009. [Google Scholar]
33. A. Pandey and M. Shukla, “Survey performance approach k-mean and k-medoid clustering algorithm,” Binary Journal of Data Mining & Networking, vol. 4, no. 1, pp. 14–16, 2014. [Google Scholar]
34. A. M. Fahim, A. M. Salem, F. A. Torkey and M. A. Ramadan, “An efficient enhanced k-means clustering algorithm,” Journal of Zhejiang University-SCIENCE A, vol. 7, no. 10, pp. 1626–1633, 2006. [Google Scholar]
35. M. Yedla, S. R. Pathakota and T. M. Srinivasa, “Enhancing K-means clustering algorithm with improved initial center,” International Journal of Computer Science and Information Technologies, vol. 1, no. 2, pp. 121–125, 2010. [Google Scholar]
36. M. Bahaghighat, Q. Xin, S. A. Motamedi, M. M. Zanjireh and A. Vacavant, “Estimation of wind turbine angular velocity remotely found on video mining and convolutional neural network,” Applied Sciences, vol. 10, no. 10, pp. 35–44, 2020. [Google Scholar]
37. M. Ghorbani, M. Bahaghighat, Q. Xin and F. Özen, “ConvLSTMConv network: A deep learning approach for sentiment analysis in cloud computing,” Journal of Cloud Computing: Advances, Systems, and Applications, vol. 9, no. 16, pp. 16–28, 2020. [Google Scholar]
38. F. Abedini, M. Bahaghighat and M. S’hoyan, “Wind turbine tower detection using feature descriptors and deep learning,” Facta Universitatis, Series Electronics and Energetics, vol. 33, no. 1, pp. 133–153, 2019. [Google Scholar]
39. M. Bahaghighat, F. Abedini, M. S’hoyan and A. J. Molnar, “Vision inspection of bottle caps in drink factories using convolutional neural networks,” in Proc. of the IEEE 15th Int. Conf. on Intelligent Computer Communication and Processing, Cluj-Napoca, Romania, 2019. [Google Scholar]
40. M. Bahaghighat, L. Akbari and Q. Xin, “A machine learning-based approach for counting blister cards within drug packages,” IEEE Access, vol. 7, pp. 83785–83796, 2019. [Google Scholar]
41. P. Tang, Y. Wang and N. Shen, “Prediction of college students’ physical fitness based on K-means clustering and SVR,” Computer Systems Science and Engineering, vol. 35, no. 4, pp. 237–246, 2020. [Google Scholar]
42. E. Amouee, M. M. Zanjireh, M. Bahaghighat and M. Gorbani, “A new anomalous text detection approach using unsupervised methods, FACTA University,” FACTA University, Series Electronics and Energetics, vol. 33, no. 4, pp. 631–653, 2020. [Google Scholar]
43. M. Bahaghighat, M. Mirfattahi, L. Akbari and M. Babaie, “Designing quality control system based on vision inspection in pharmaceutical product lines,” in Proc. of Int. Conf. on Computing, Mathematics and Engineering Technologies, Sukkur, Pakistan, pp. 1–4, 2018. [Google Scholar]
 | This work is licensed under a Creative Commons Attribution 4.0 International License, which permits unrestricted use, distribution, and reproduction in any medium, provided the original work is properly cited. |