DOI:10.32604/csse.2022.018467
| Computer Systems Science & Engineering DOI:10.32604/csse.2022.018467 | |
| Article |
Tracking Dengue on Twitter Using Hybrid Filtration-Polarity and Apache Flume
1Department of Information Systems, Faculty of Computer Science & Information Technology, Universiti Malaya, 50603, Kuala Lumpur, Malaysia
2School of Computer Science and Engineering SCE, Taylor’s University, Subang Jaya, 47500, Malaysia
3Department of Information Technology, College of Computers and Information Technology, Taif University, Taif, 21944, Saudi Arabia
4Department of Computer Science, College of Computers and Information Technology, Taif University, Taif, 21944, Saudi Arabia
*Corresponding Author: Norjihan Binti Abdul Ghani. Email: norjihan@um.edu.my
Received: 09 March 2021; Accepted: 07 May 2021
Abstract: The world health organization (WHO) terms dengue as a serious illness that impacts almost half of the world’s population and carries no specific treatment. Early and accurate detection of spread in affected regions can save precious lives. Despite the severity of the disease, a few noticeable works can be found that involve sentiment analysis to mine accurate intuitions from the social media text streams. However, the massive data explosion in recent years has led to difficulties in terms of storing and processing large amounts of data, as reliable mechanisms to gather the data and suitable techniques to extract meaningful insights from the data are required. This research study proposes a sentiment analysis polarity approach for collecting data and extracting relevant information about dengue via Apache Hadoop. The method consists of two main parts: the first part collects data from social media using Apache Flume, while the second part focuses on querying and extracting relevant information via the hybrid filtration-polarity algorithm using Apache Hive. To overcome the noisy and unstructured nature of the data, the process of extracting information is characterized by pre and post-filtration phases. As a result, only with the integration of Flume and Hive with filtration and polarity analysis, can a reliable sentiment analysis technique be offered to collect and process large-scale data from the social network. We introduce how the Apache Hadoop ecosystem – Flume and Hive – can provide a sentiment analysis capability by storing and processing large amounts of data. An important finding of this paper is that developing efficient sentiment analysis applications for detecting diseases can be more reliable through the use of the Hadoop ecosystem components than through the use of normal machines.
Keywords: Big data analysis; data filtration; text analysis; sentiment analysis; social media; event detection
The recent era of technology development has significantly assisted mankind in the early and accurate prediction of epidemics. The online collaborative media has provided a convenient platform for users to share and view very recent updates related to disasters and epidemics. As of August 2020, there were 3.5 billion or more social media active users [1]. Social media sites and applications, such as Facebook, Twitter, and others, have become a major medium for information sharing that has content based on user participation and user-generated content. Examples of interactions in social media include conveying news, disaster event alerts, sharing opinions, reviewing products, and many more [2–7]. According to [8], these interactions, such as user comments, user tweets, user posts, and user reviews are also known as user-generated content, which is solely produced by users during their online interaction with other users to seek services and usage of social platforms for social media interaction.
Data analysis and filtration are important to extract high-quality content from the noisy text found within the user-generated textual content in social media. Furthermore, user-generated content, especially in social media, is common without any standard since users are creating the contents without any definite logic (as human nature) [9]. The quality of the user-generated content distributed ranges from very excellent quality to bad quality since the web produces users-data (as an outcome of social networking) unstructured and fuzzy [10]. The non-standard tokens may deviate from the customary vocabulary in terms of composition, or even concerning the semantic understanding of the texts. Thus, it becomes a massive challenge to mine fruitful information from social media content. Twitter (a recent and popular social media platform) has been one of the most popular social interaction sites since its launch in 2006 [11]. The fundamental aspect of Twitter is its ‘tweet’, which is the message sent by users into the Twitter text stream known as the Twittersphere [12,13]. The stream of tweets provided by users is used as the basis to extract the information encapsulated therein.
In this paper, we propose a method for collecting data and extracting relevant information about dengue via Apache Hadoop. This consists of two parts: the first part collects data from the social media using Apache Flume, while the second part focuses on querying and extracting relevant information via the Hybrid Filtration-Polarity Algorithm, which is proposed in this research. The proposed algorithm allows analysis of the polarity bias of the search term/keyword within its context, while, being concurrent, it adopts the analysis of the text and sentiment of the whole text to improve the precision of the returned result. The proposed method is applied to detect the occurrence of dengue from Twitter feeds, as, nowadays, dengue has become a challenge in many countries around the world. Many dengue cases have been reported throughout the years [14–17]. Twitter is chosen as the social media as it allows real-time sharing of personal status by online users as the social sensors, as discussed in [18,19]. Therefore, the sharing and communicating of personal status by users over Twitter feed allows the possibility for the occurrence of such a disease to be detected at an early stage for further action to be taken.
The paper is organized as follows. Section 2 discusses the previous studies conducted that relate to this research. Section 3 introduces the proposed method that is applied in this research, while the proposed Hybrid Filtration-Polarity Algorithm is discussed in Section 4. Section 5 presents the experiments and results. Section 6 discusses the contributions and indicates the direction for future research as a conclusion.
Previously, many studies have been undertaken to identify strategies to extract and detect useful information, such as events or the occurrence of disease over the Twitter stream [20–23]. Most of the relevant studies chose a selection of keywords or even hashtags to detect the occurrence of an event or disease, as tweets containing the selected keyword were deemed relevant to the event. [24] proposed an algorithm that creates a keyword-graph based on the keyword co-occurrence and demonstrated its reliability in Tweet-frequency time series solely from Twitter for detecting events. Similarly, this methodology for extracting information using a selection of keywords has been applied to the detection of disease occurrence at its early stage over the Twitter stream. Among these studies, [25] proposed a method that relies on Natural Language Processing (NLP) to detect an influenza epidemic with high correlation. However, the massive data explosion in recent years has led to difficulties in terms of storing and processing large amounts of data. This is because it requires a reliable mechanism to gather the data and a suitable technique to extract meaningful insights from the collected data. Apache Hadoop [26], which is based on a combination of commodity machines and resources that form a distributed file system, is considered to be one of the most mature technologies to store and process large-scale data.
Sentiment analysis plays an important role in mining opinion or identifying emotions in user-produced contents [27]. It is widely used in many areas ranging from business holders conducting product reviews to identify customer feedback and reviews regarding their products; as discussed in [28–29], as well as public opinion, financial predictions [30] or even predicting real-world events [31–32]. Machine learning is an approach that adapts to learn from a certain task that is run over time. In contrast, the lexicon-based approach is an unsupervised learning method to process the annotation for analyses of user sentiments and relies on the sentiment lexicon, which is a precompiled collection of sentiment terms [33], or the use of opinion words [34], such as ‘cheap’, ‘good’, ‘rich’ or ‘amazing’, to process such tasks. Different from the supervised or machine-learning approach, this type of approach does not require the storing of a large data corpus and training, which, consequently, makes the whole process run faster.
There have also been many significant research efforts on the text as well as sentiment analysis in leveraging social media data extraction, such as event-based detection over the social media text stream. Recent work in research has concentrated on mining useful information from user-generated web content for conducting inference or prediction. In [35], a framework was proposed that focuses on investigating and overcoming the problem of ambiguous views about a particular event from different social users to efficiently mine information from the social media through the exploitation of the content, location and time information from the tweets. In [36], they presented a supervised learning framework to infer the occurrence and magnitude of events in tweets by selecting the text-based characteristics that attain the semantic notion of the target implication using the statistical learning method.
The proposed methodology introduced in Fig. 1 is used in this study to extract and detect the occurrence of dengue cases using the sentiment analysis polarity approach. As shown in Fig. 1, the proposed method consists of two phases:
i) collecting and storing data from social media using Flume and Hive, and
ii) querying and extracting relevant information via the Hybrid Filtration-Polarity algorithm over Hive.
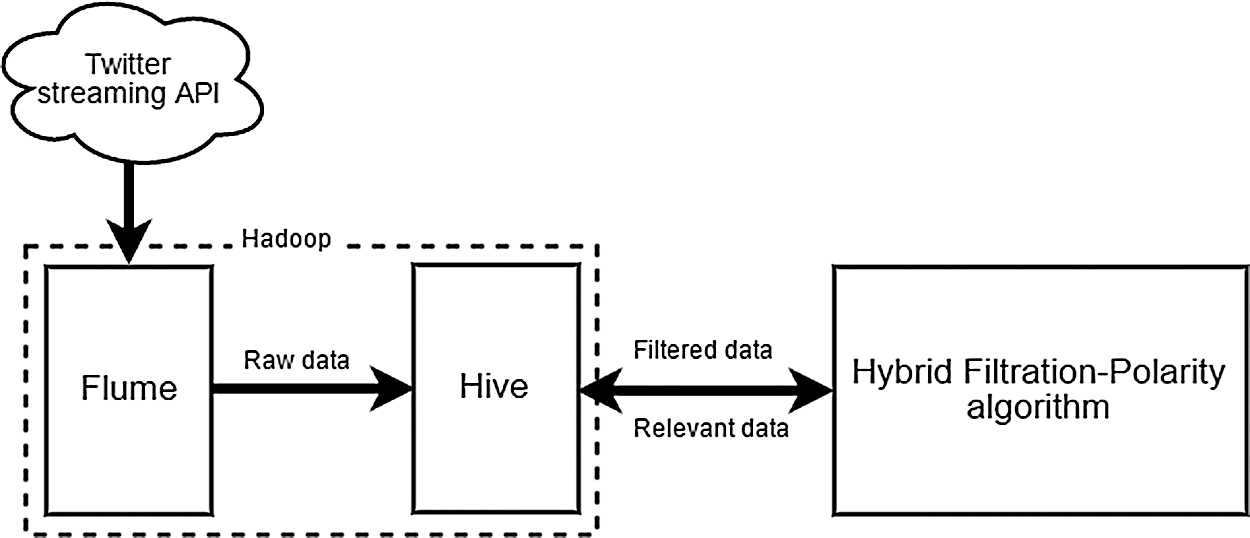
Figure 1: The Proposed Method
This method adopts the Apache Hadoop as a platform to store and process the collected data, and the Hybrid Filtration-Polarity algorithm is proposed to calculate the sentiment analysis. The algorithm is introduced based on the concept of data conditioning introduced by [37], which is a process for transforming any noisy and raw social media content into high-quality data based on the selected variable. The two phases proposed by [37] are adopted in this proposed method:
i) Collecting and filtering the raw data as determined by four dimensions – time windows, location, the user characteristic, and search term.
ii) Determining the predictor variables, such as the sentiment-based variable, which is selected as the variable to be measured and computed concerning our framework.
The experimentation and results obtained from the proposed method are discussed further in Sections IV and V.
Apache Hadoop is considered to be the most mature platform used for storing and processing large-scale data [38]. It contains several components that can be used efficiently for semantic analysis tasks with efficient storage and processing capability. Hadoop processes the data using the MapReduce algorithm, in which the tasks are executed in parallel over different machines [38]. Hadoop is not only capable of storing and processing the data but can develop applications and run them on different sets of clusters, as well as deliver a complete data analysis of the products for large-scale data within a reasonable time.
Hadoop is characterized by MapReduce and HDFS. The MapReduce consists of processing large quantities of data in analogy to larger collections involving specific hardware requirements. In contrast, the HDFS (Hadoop Distributed File System) consists of storing data in a specific architecture developed to deal with larger masses of data [38]. The main feature of HDFS is its ability to distribute the file system and process large-scale data on large clusters with a high fault-tolerant processing ability. It is created on master/slave topology, in which the master is represented by a single NameNode that takes control of the metadata of the file system and the data nodes of the cluster’s slaves. The Hadoop framework contains other modules, such as Hive, Pig, Hbase, Oozie, Sqoop, and Flume [39]. In this paper, Flume is used to extract the stream data from Twitter, and Hive is used to save the extracted data [40]. The general architecture for using Flume and Hive to extract and store the data from Twitter is described in Fig. 2.
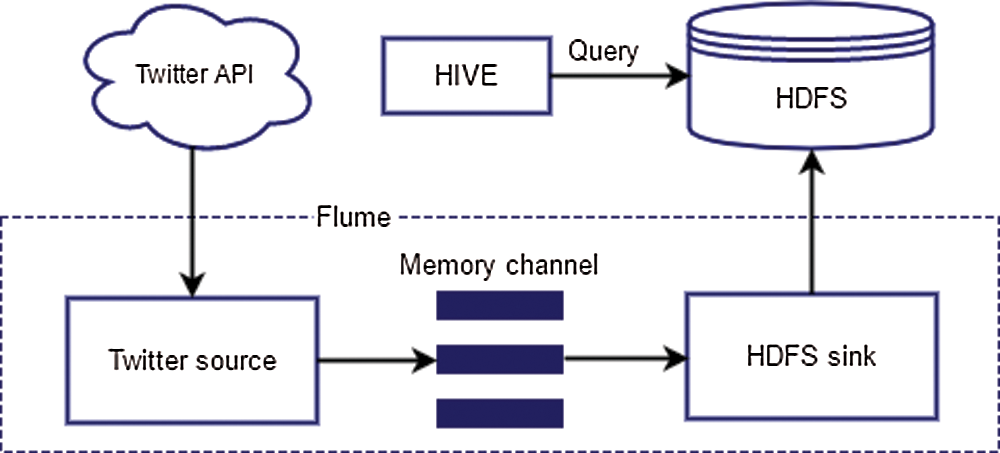
Figure 2: Control Flow of Twitter Data via Hadoop Ecosystem
Apache Flume is the software built on Apache Hadoop to collect, aggregate, and shift large amounts of data into the HDFS. It has been shown that Flume is robust and trusted file collection software. Flume can deal with and collect the log files generated by servers via integrating and transferring files to the HDFS for a long time with huge amounts of data employing its fault-tolerant processing capability. Flume is characterized by a simple and scalable architecture, which is interpreted by the concept of agents and collectors [40], as shown in Fig. 3.
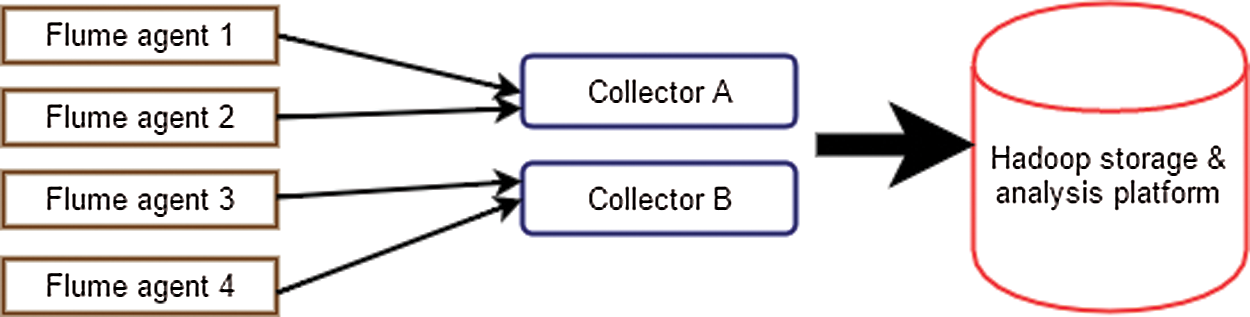
Figure 3: Flume Architecture Topology
Hive is a data warehouse tool located on top of the Hadoop to process the structured data stored in HDFS. The main idea behind Hive consists of making the querying and analysis of big data easier and practical. The data in Hive is structured into tables, partitions, and buckets.
In the tables, the data are serialized and stored in files within a particular directory. Each table has a specific HDFS directory. Users can connect tables by using the serialization of the underlying data. Moreover, Hive is supported by the built-in serialization functions, which provide the compression and de-serialization of the data. In contrast, users can add support for new data formats via defining personalized serialize and de-serialize procedures called SerDe’s. It has been shown that Hive supports external tables on data, such as the data located in HDFS and other local directories [40].
In the partitions, each table can contain one or more partitions that are distributed within a set of sub-directories of the table. This is a technique for dividing the tables into different related parts based on the values of the partitioned columns, such as data, city, and street. This technique represents an easy way to query portions of the data. The tables are then sub-divided into buckets to provide another dimension to the data structure, which can be used for efficient querying. The bucketing mechanism is based on the value of the hash function of a particular column of the table.
Fig. 4 describes the Hive architecture, which is equipped with an SQL-Like interface to process the data stored in HDFS. Setting up Hive on Hadoop first requires the JSON SerDe to be configured. To make sure that the querying is tuned up, it is essential to ensure that the Hive table can interpret the JSON data. As Hive is set by default to deal with the delimited row format, and the Twitter data are in the JSON format, which is not compatible, the Hive SerDe interface is used for the interpretation of the loaded content. It is important to mention that Hive supports embedding customized scripts written in Java/Python using a simple row-based streaming interface and that it is this feature that is used to run the Hybrid Filtration-Polarity algorithm.
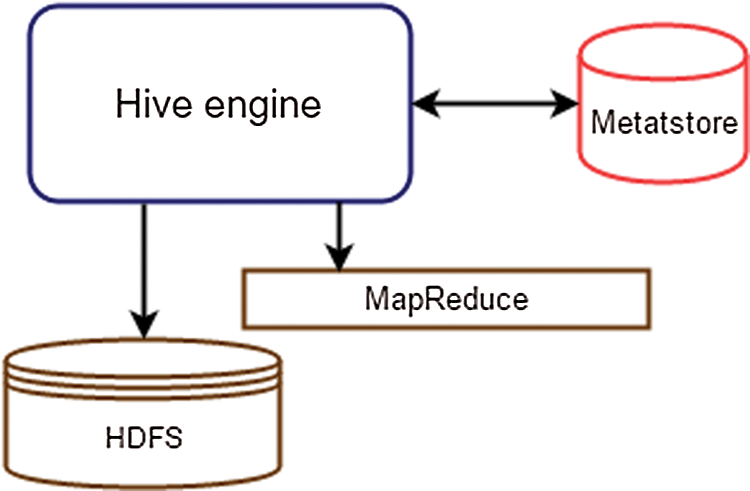
Figure 4: A Typical Hive Architecture
3.3 Hybrid Filtration-Polarity Algorithm
This research adopts the data conditioning concept in which the implementation is through a series of identified and required processes for filtering and analyzing text to extract useful and high-quality information from social media user-generated content. The two fundamental components involved in this algorithm are text analysis and sentiment analysis. Fig. 5 describes the process for using the Hybrid Filtration-Polarity algorithm for detecting the occurrence of events from the text generated by users in social media.
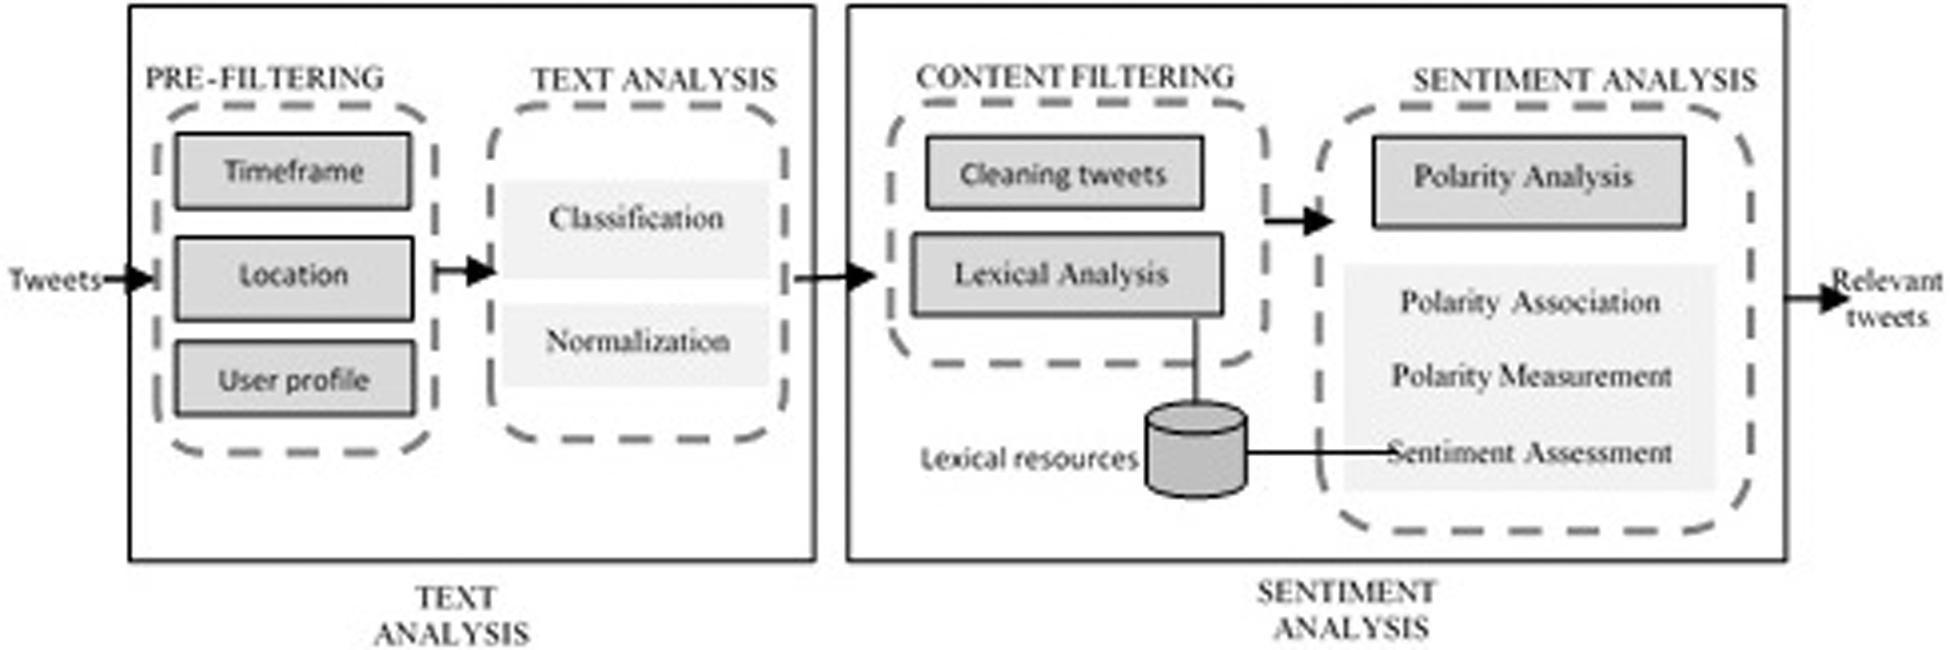
Figure 5: Hybrid Filtration-Polarity Algorithm Process
The data input is shifted by HiveQL from the HDFS. This is an unstructured stream of textual contents stored by Flume in HDFS in the form of raw data, in which the data require to be cleaned and prepared for analysis. From the specified involvement of unstructured data collected from social media platforms by undertaking a specific sequence of steps – pre-filtering – before the filtration process that takes place in the second phase. Text analysis is an imperative element that needs to be employed while filtering the significant quality data from specified contents. This is an important aspect that needs highlighting, especially when dealing with the noisy and raw-natured user-produced content, such as social media data. This research proposes two phases that are involved in the text analysis – text classification and text normalization.
Text classification, as shown in Fig. 6, is one of the text analysis processes. Examples of previous studies on text classification are [41] who proposed a novel approach to classify the text semantically (featured small text classification) using Twitter [42], and also hashtag categories created through contemporary classification employing Twitter [43].
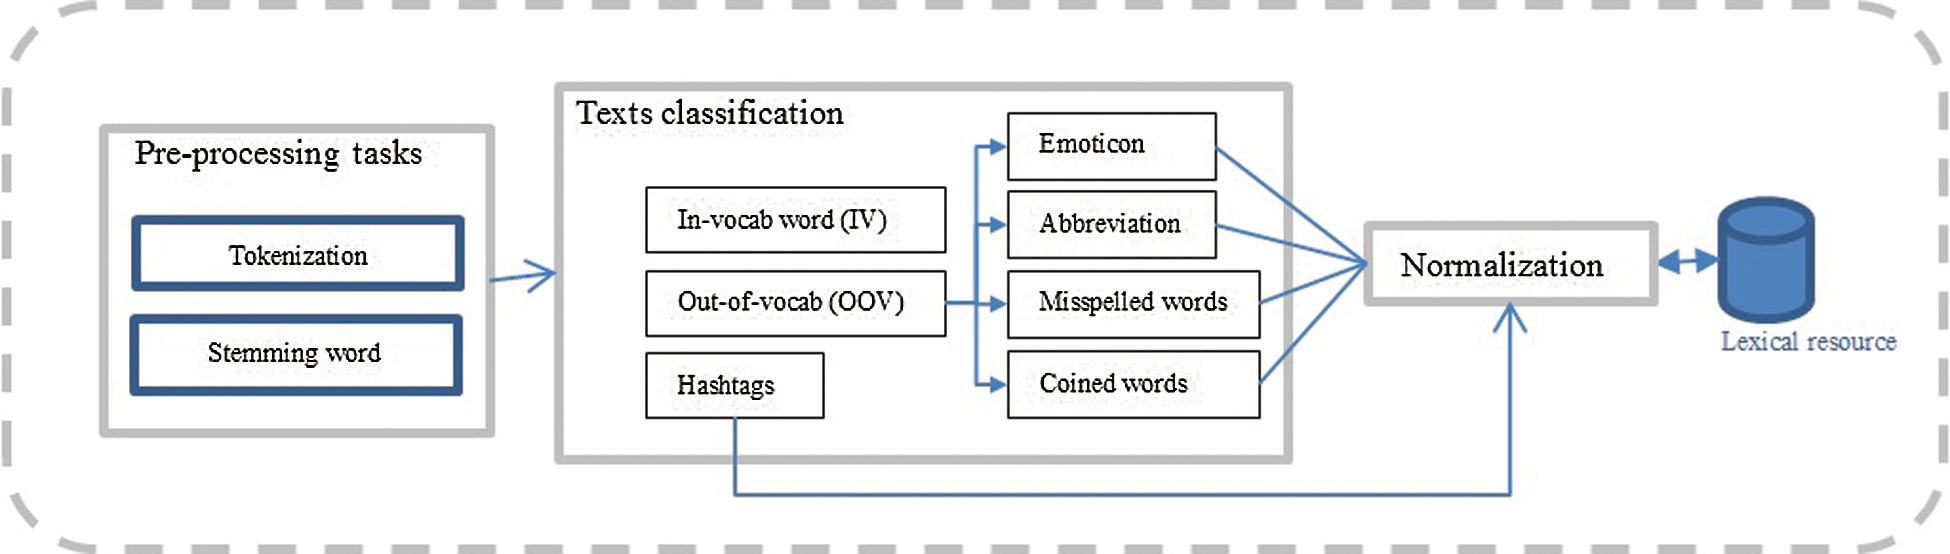
Figure 6: Text Analysis Structure
Text normalization is a process that transforms unstructured text into a standard text. It is similar to spell checking but different in terms of its lexical variants [44], which are often beyond standard vocabulary. Accordingly, this is because most of today’s user-generated textual content is often unstructured and noisy due to commonplace shorthand like b4 ‘before’, or exaggerated word lengthening to show emphasis like bestttt ‘best’ and so forth. Examples of unstructured data that might be created in social media are spelling errors, ad-hoc abbreviations, phonetic substitutions, and many more. Accordingly, the process of accessing relevant information becomes more difficult in the social media data environment. Many previous studies have focused on word/lexical-based normalization [45,46] and many more.
The assemblage of text streams is detected based on the sentiment lexicon before being assessed based on a lexical resource, such as WordNet, in terms of its sentiment polarity, which is the next step.
The analysis of sentiment polarity is exercised as shown in Fig. 7. Two types of input are processed in this phase. Firstly, the text corpora are strained featuring the domain context of the subject in the content straining phase, and, secondly, is the supporting context of the sentiment lexicon mined in the previous phase.
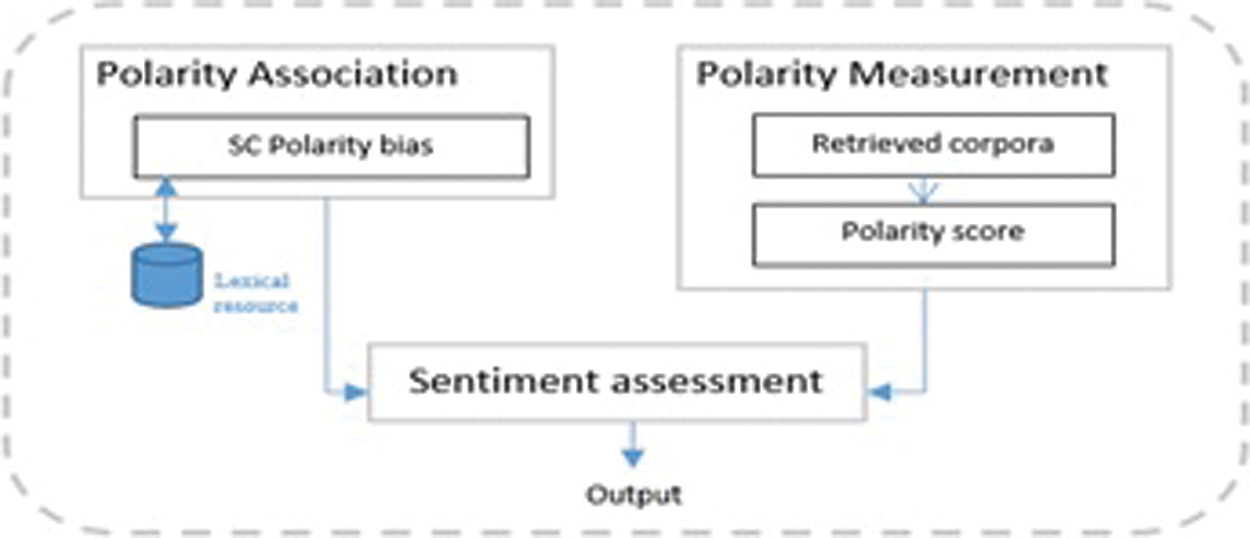
Figure 7: Sentiment Analysis
The supporting context of the sentiment lexicon given in the particular search term in the content straining step is stated and featuring the lexical resources (e.g., SentiWordNet 3.0) [47], to analyze the partiality of its polarity connotation; this can be negative, positive, negative or can be neutral even. The polarity partiality is employed to determine the envisioned sentiment prognosis, which is subsequently accorded with the polarity partiality of the attained corpora. The calculation of sentiment for each corpus is then measured based on the assigned score. The calculation is done by finding the overall score of sentiments in each text repository for identifying its polarity partiality. The sentiment polarity partiality is termed in collection for each text repository; so that to assess the sentiments at the document level. The allocation and assessment of whole polarity bias are based on a text repository resource [47].
In an assessment of sentiments, the polarity of sentiment partiality of each given corpus is determined and accorded against the SC polarity partiality. This is to ensure that only corpora with a similar polarity bias are presented as relevant results as the output. Accordingly, IV represents words that can be found within the lexical resources, such as WordNet [47], while words that are preceded by the # symbol (hashtag), such as #dengue and #feveroftheday, are categorized into hashtags. Other words that are not found illustrated in the resources are categorized into OOV; words that might be a form of slang (coined words), abbreviations, or emoticons. After the classification process, the normalization of the text takes place based on the lexical resource. OOV examples of text conditions that need normalization could be because of misspelling, such as bokk instead of book; or coined, sleepzzz instead of sleep; abbreviations; or even emoticon symbols. To progress to the next phase, the OOV words must be normalized and transformed into standard words.
The implementation of the algorithm using the proposed framework with a dataset is described in this section.
First, the tweets were randomly collected using the streaming API of Twitter and the keywords #dengue and dengue were extracted and stored as a .csv file. Then, only English tweets with the above keywords were filtered and extracted. However, many tweets were removed due to the lack of user location from the Twitter accounts. Fig. 8 shows an example of the data extracted from Twitter.
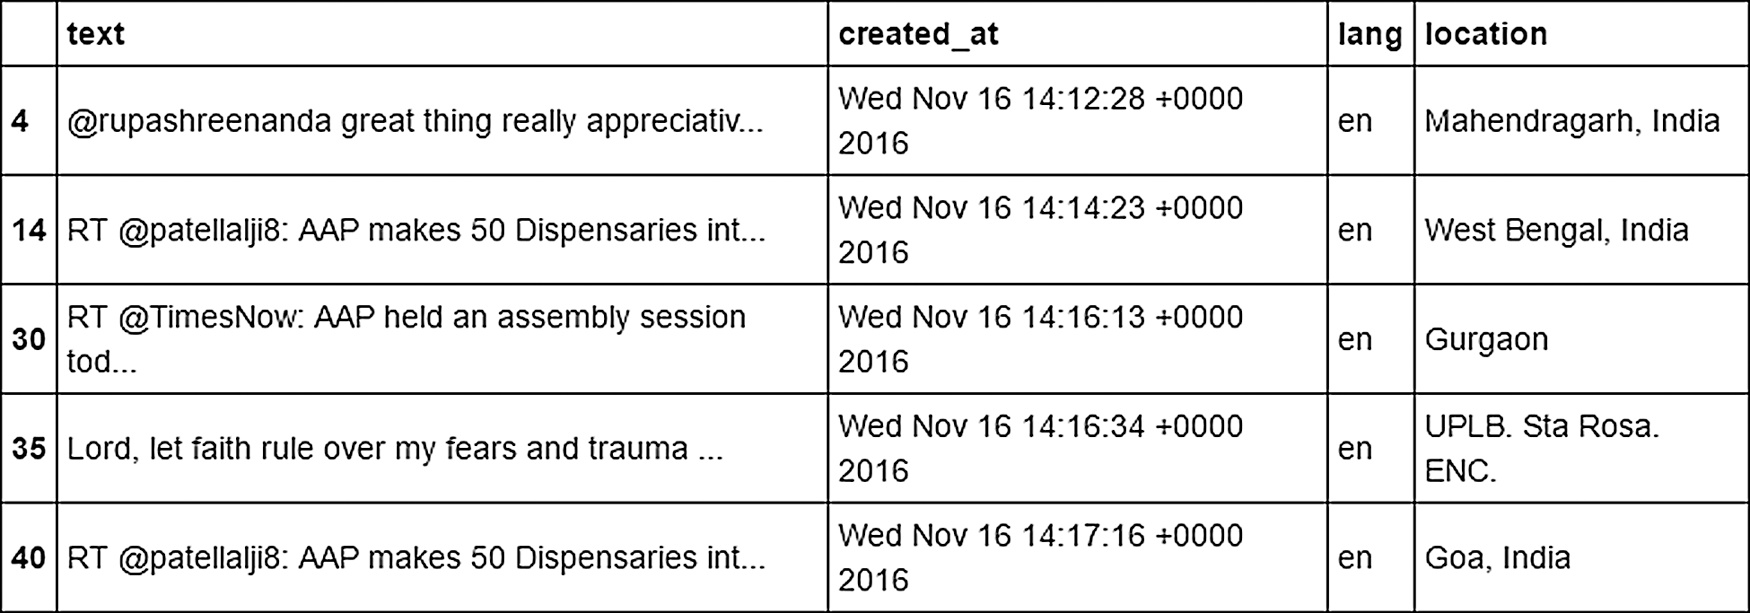
Figure 8: Examples of Data Extracted from Twitter
As mentioned in the previous section, the pre-filtering process must be conducted on the tweets acquired previously. This phase involved intensive pre-filtering steps for each tweet collected from the previous phase that would subsequently be passed as pre-filtered tweets to the next phase. Twitter feeds were filtered and extracted based on the three aspects mentioned in Section IV. For the Twitter feed, the filtration was to ensure that the tweets collected were from the original author/tweeter rather than from those who retweet the content. All pre-filtered tweets were passed to the next phase as input.
Based on the tweets retrieved from the keyword, the tweets must be classified. In this research, the classification of the tweets was done according to two categories; news and opinion. First, the data were split using Cross-Validation in which the Repeated Random Sub-Sampling Validation method was used. This method randomly split the dataset into training and validation data. For each split, the model was fitted to the training data, and the predictive accuracy was assessed using the validation data. The output of this split was the training set and the test set. Then, the naive Bayes classifier was applied to build a classifier based on the training data previously obtained. Naive Bayes classifiers are highly scalable and require several linear parameters in the number of variables (features/predictors) in a learning problem. The classification accuracy was calculated using the test data for which we obtained 0.9. Tweets were then classified using the classifier that had been built. Fig. 9 shows an example of the tweets after the classification.
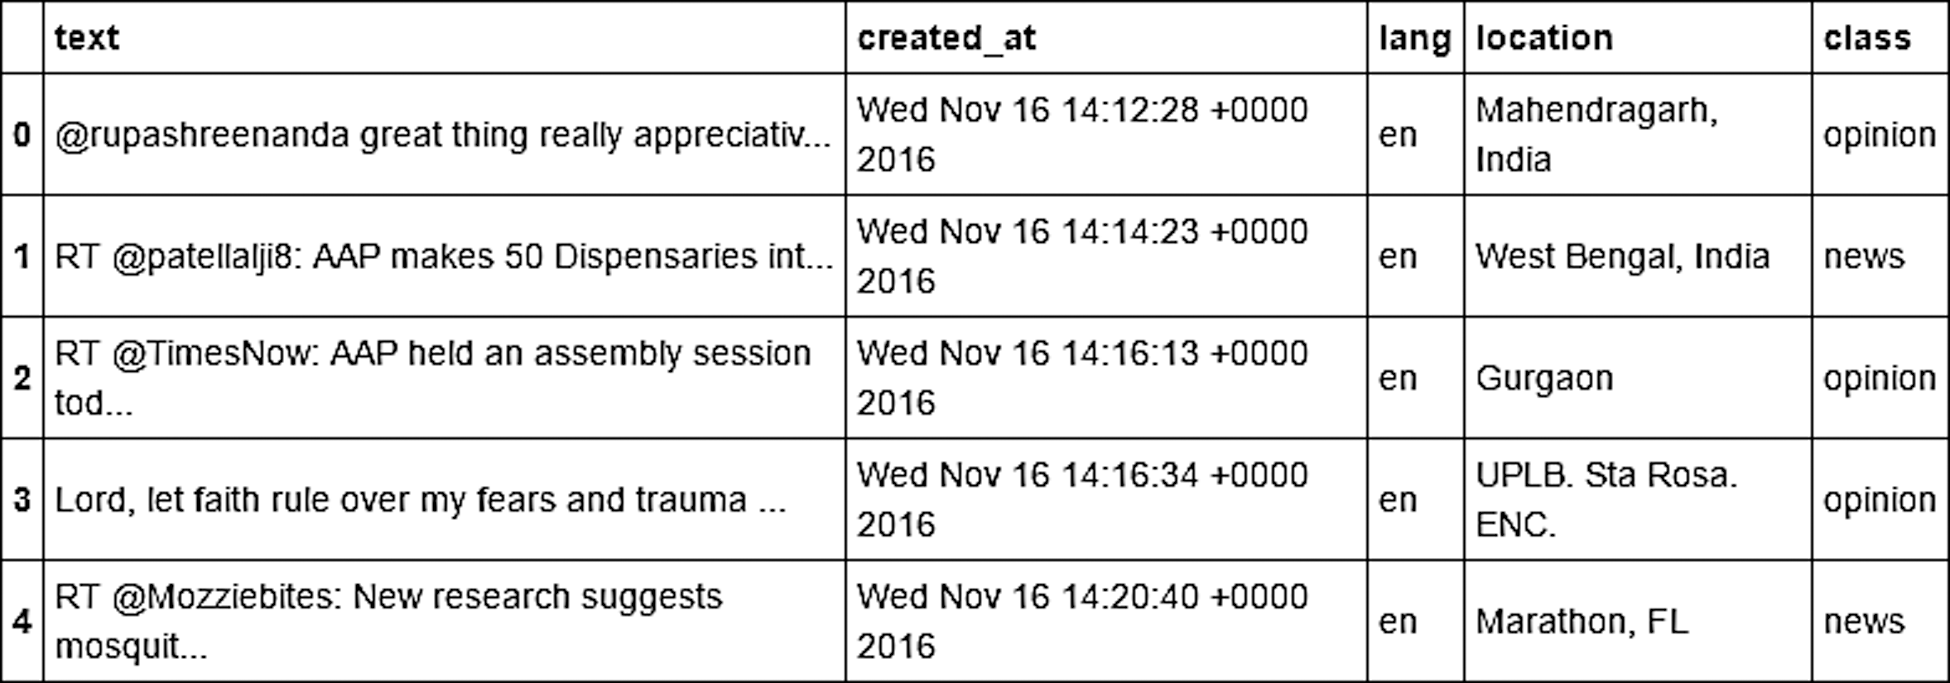
Figure 9: An example of the Tweets after Classification
Cleaning the tweets is important before performing sentiment analysis. This is the phase in which the mined tweets were obtained from the .csv file and the sentiment analysis function was performed. The tweets must be cleaned for running the sentiment analysis of the content “opinion” and checking the areas suspected of a dengue epidemic. The cleaning phase performs the following tasks:
• Remove the empty rows
• Remove URL
• Remove any non-English words
• Remove any duplicate tweets
• Remove tweets with null location
• Reset indexes and
• Standardize the words
iv. Cleaning the Tweets Sentiment Analysis and Polarity Analysis
Cleaning The analysis of sentiment polarity was executed as shown in Fig. 7 in the previous section. Using the cleaned data, sentiment analysis was performed. The data were then classified based on the type of data – opinion or news – and normalized. Fig. 10 shows the number of opinion tweets according to the city.
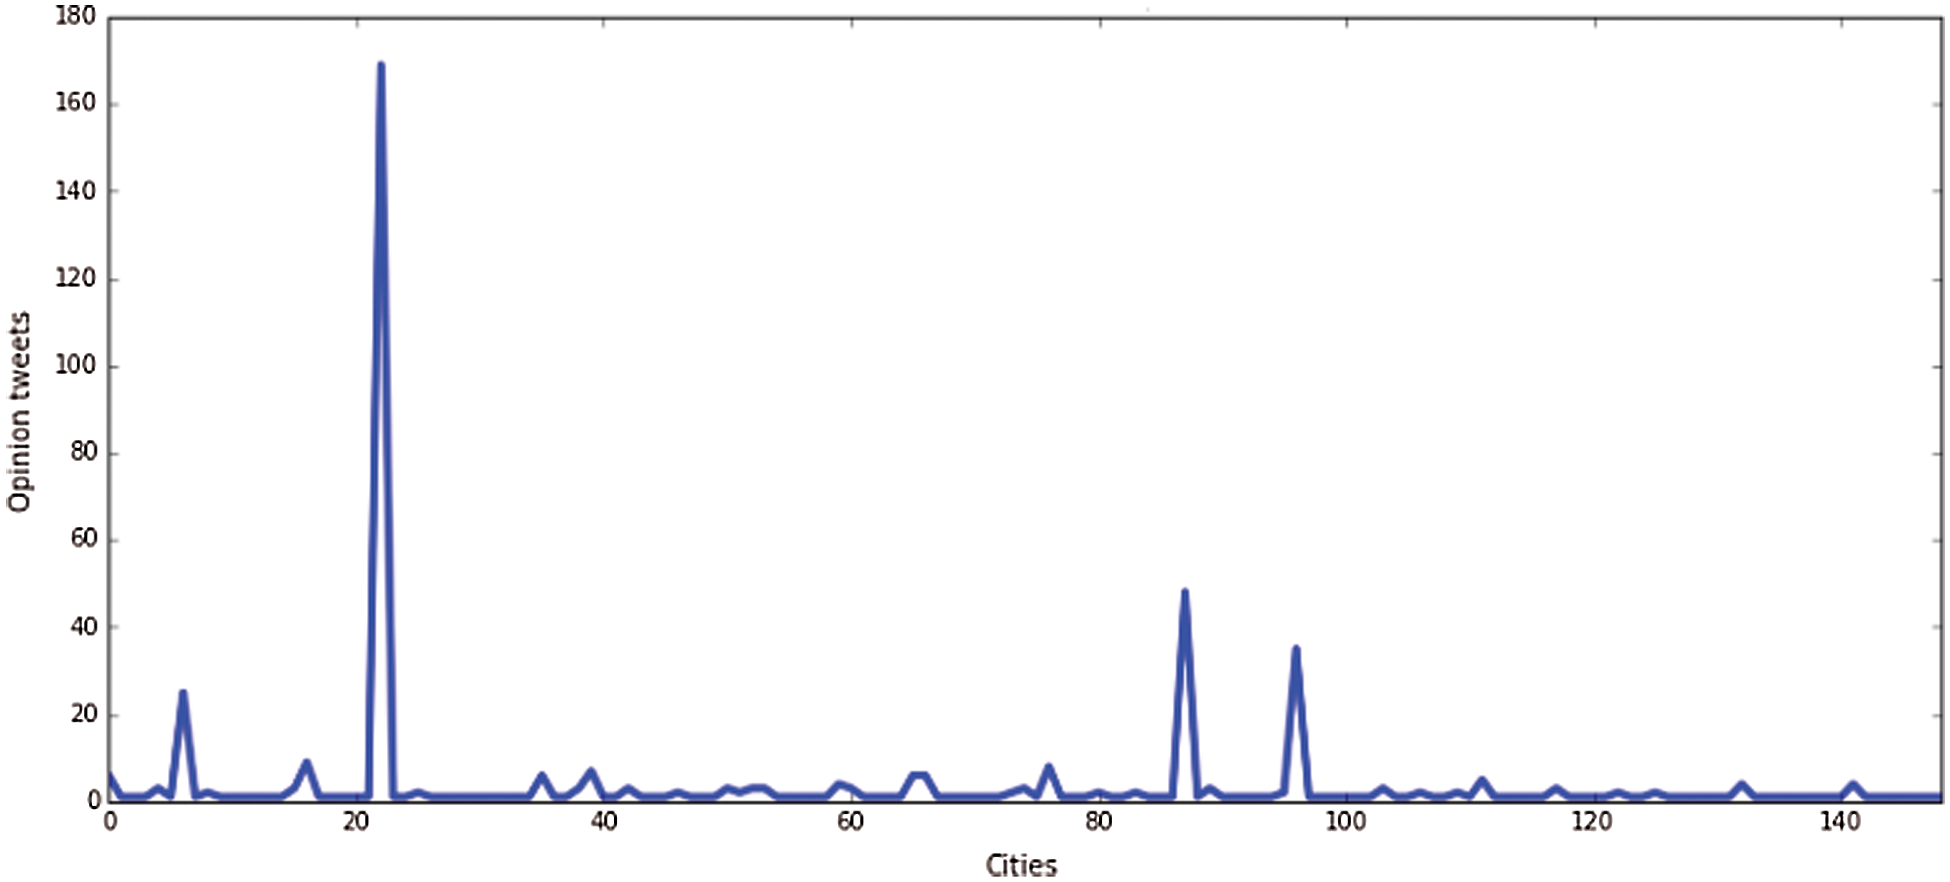
Figure 10: Number of Opinion Tweets per City
The sentiment analysis was examined using the Polarity analysis of the tweets. The polarity analysis was done using the TextBlob, which is a Python (2 and 3) library for processing textual data. It provides a simple API for common natural language processing (NLP) tasks, such as part-of-speech tagging, noun phrase extraction, sentiment analysis, classification, translation, and more. The polarity score is a float within the [−1.0, 1.0], while subjectivity is a float within the range [0.0,1.0], where 0.0 is very objective, and 1.0 is very subjective.
It was executed based on the following:
If PolarityScore > 0, the tweet has an overall ‘positive opinion’.
If PolarityScore <= 0, the tweet has an overall ‘negative opinion’.
This was executed as follows:
from textblob import TextBlob
opinion[‘Polarity’] = None
lst = [ ]
dlst = opinion.index
c=-1
for tweet in opinion[‘text’]:
res = TextBlob(tweet).sentiment
if res [0]>0:
res =‘pos’
else:
if res [0] <=0 :
res =‘neg’
lst.append(res)
for i in dlst:
c=c+1
opinion.loc[i,‘Polarity’] = lst[c]
opinion.head()
The polarity result is shown in Fig. 11 below.
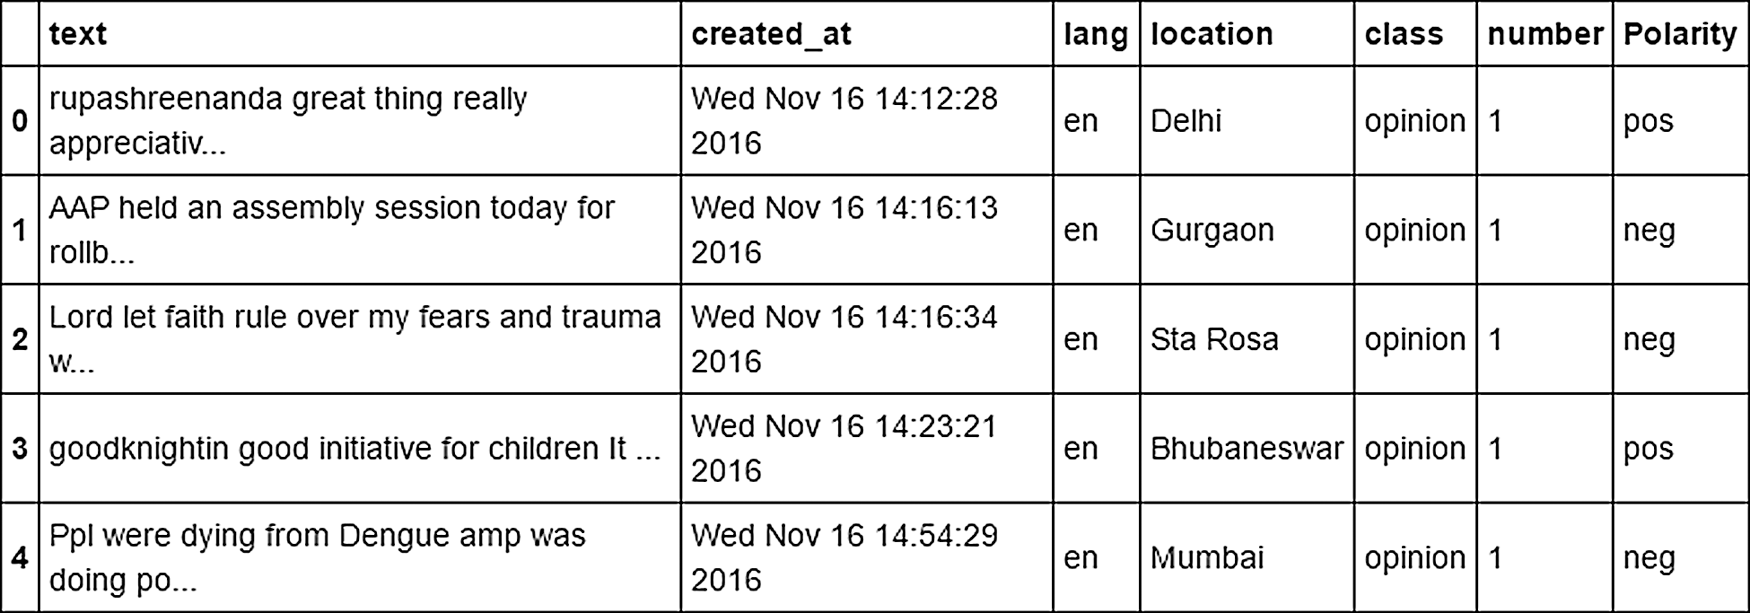
Figure 11: Polarity Result
To detect the dengue epidemic, only Negative polarity was considered. The negative polarity is when it was considered that a dengue case has occurred, as shown in Fig. 12.
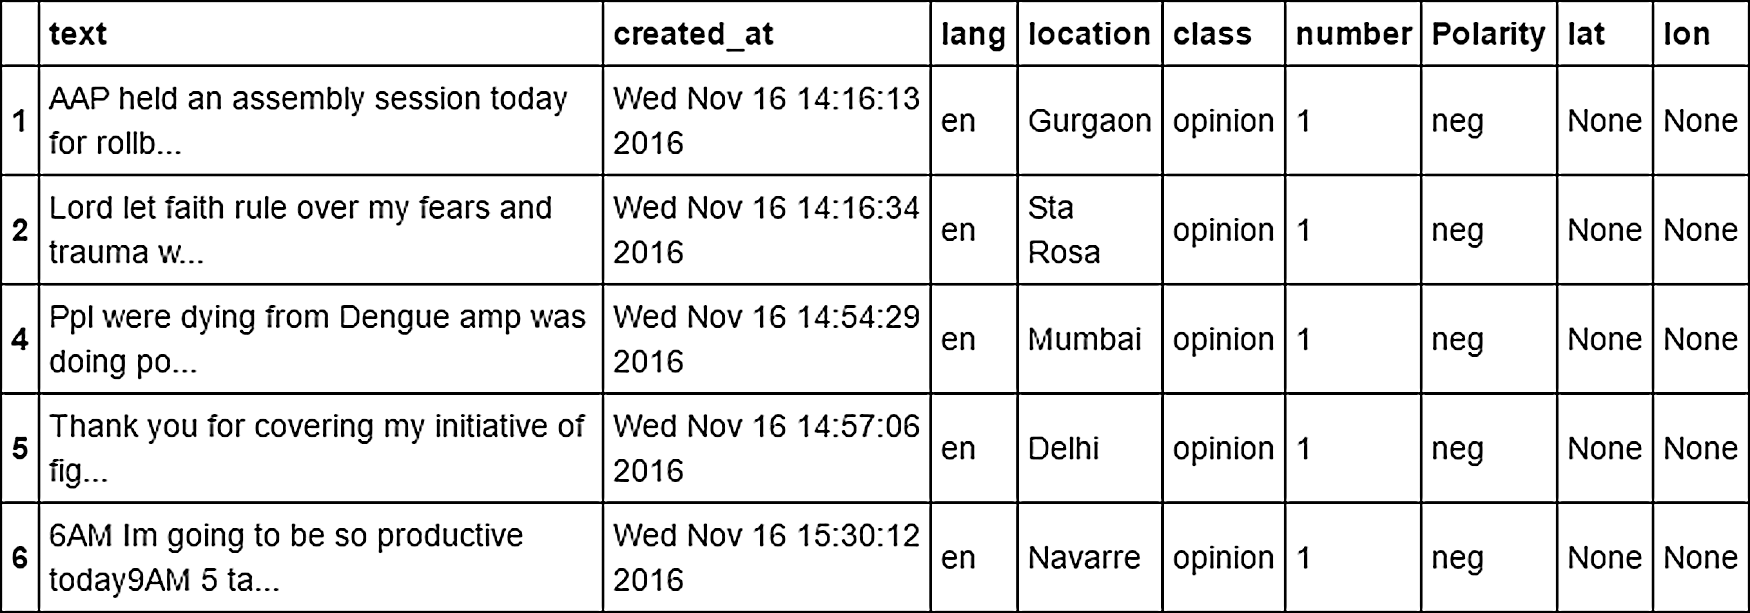
Figure 12: Negative Polarity for Dengue Epidemic
Then, the locations where dengue has occurred are visualized, as shown in Fig. 13.
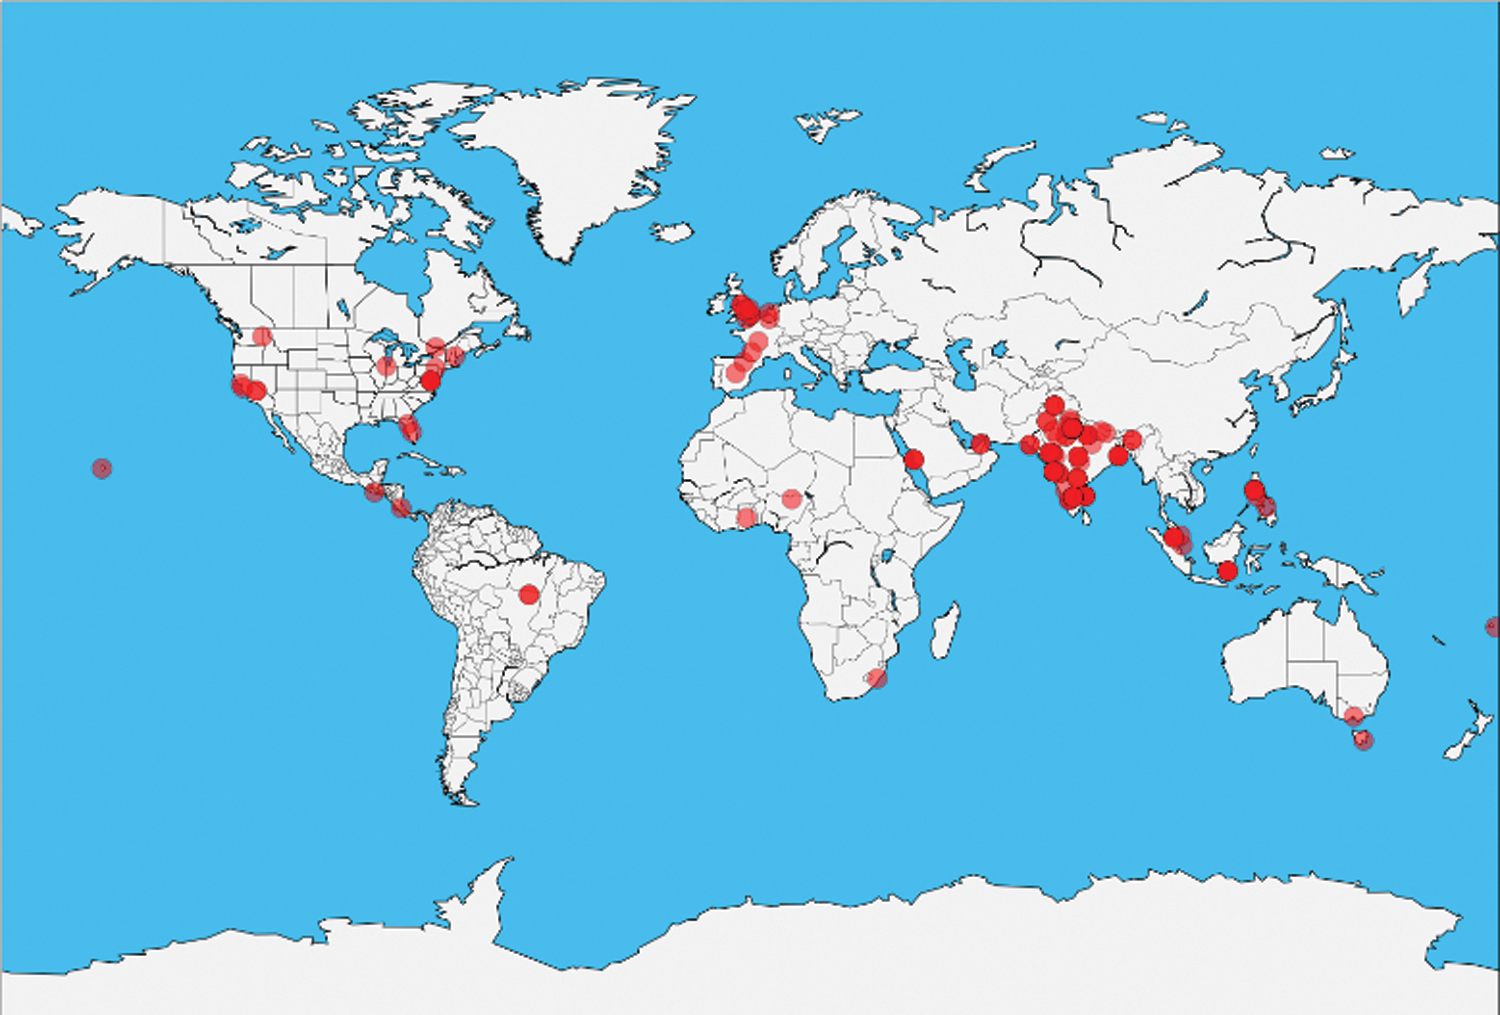
Figure 13: Top Locations of Dengue
This paper proposed the implementation of the Hybrid Filtration-Polarity Algorithm via Apache Flume, which provides a systematic methodology for researchers to leverage user-generated textual content from social media to extract high quality and useful information that can be of benefit. One of the highlights of this paper is how the proposed algorithm can be implemented to detect the occurrence of an event using social media large-scale data streams.
Filtering and analyzing the textual information from social media is a crucial process to extract and detect information from which inferences can be drawn. However, most recent studies only focused on certain aspects of analysis in extracting and detecting relevant information of events from the social media text stream. Moreover, most of the existing approaches did not support large-scale data.
The proposed method includes more details that hitherto have been overlooked and exploits the sentiment and semantic information captured in the search term or keyword provided for filtering the content, as well as the analysis of the sentiment and textual content generated by the user in the social media text stream. Accordingly, the fundamentals of our method are:
- Integration of sentiment lexicon into search term/keyword
- Exploitation of sentiment and semantic information captured in search terms/keywords provided for filtering social media content.
- Adaptation of detailed analysis on the sentiment and textual content generated by the user in the social media text stream.
This study introduces a method for sentiment analysis of the Twitter data stream. The method constitutes two main parts: The Hadoop ecosystem and the Hybrid Filtration-polarity. The Hadoop ecosystem can ensure high performance for large-scale data extraction and storage within its distributed structure, while the Hybrid Filtration-Polarity algorithm can perform filtration and analysis of the data stored on Hadoop and extract meaningful insights. The proposed method provides more details that have been overlooked and exploit the sentiment and semantic information captured in the search term/keyword provided for filtering the content as well as the analysis of the sentiment and textual content generated by the user in the social media text stream. This paper proposes the following:
- A method that features the Apache Hadoop, which enables the algorithm to deal with large scale data
- The Hybrid Filtration-Polarity Algorithm, which is used to calculate the sentiment analysis values of the Twitter data
Based on the implementation carried out, the method is suitable for handling large amounts of data retrieved from social media, such as Twitter, where the data can be analyzed and useful information extracted therefrom. The implementation shows that the dengue epidemic can be tracked using the Hybrid Filtration-Polarity. We conclude that the potential analysis of social media data, such as Twitter data, can be used to transform the way people, especially in health care, can gain information. Subsequently, it can be used to help them make decisions.
Acknowledgement: This work is supported by the UMRG Programme-AET (Innovative Technology (ITRC)), at the University of Malaya under grant RP0291-14AET.
Funding Statement: Taif University Researchers Supporting Project number (TURSP-2020/98).
Conflict of Interest: The authors declare that they have no conflicts of interest to report in the present study.
1. J. Clement, “Number of social media users worldwide 2010-2021,” 2010. [Online]. Available at: https://www.statista.com/statistics/278414/number-of-worldwide-social-network-users. [Google Scholar]
2. D. M. Hartley, “Using social media and internet data for public health surveillance: the importance of talking,” Milbank Quarterly, vol. 92, no. 1, pp. 34–39, 2014. [Google Scholar]
3. G. A. Miller, “WordNet: A lexical database for English communications,” Communications of the ACM, vol. 38, no. 11, pp. 39–41, 1995. [Google Scholar]
4. T. Sakaki, M. Okazaki and Y. Matsuo, “Tweet analysis for real-time event detection and earthquake reporting system development,” IEEE Transactions on Knowledge and Data Engineering, vol. 25, no. 4, pp. 919–931, 2013. [Google Scholar]
5. X. Zhang, H. Fuehres and P. A. Gloor, “Predicting stock market indicators through Twitter, I hope it is not as bad as I fear,” Procedia – Social and Behavioral Sciences, vol. 26, pp. 55–62, 2011. [Google Scholar]
6. Y. Xie, Z. Chen, Y. Cheng and K. Zhang, “Detecting and tracking disease outbreaks by mining social media data,” in Proc. of the Twenty-third International Joint Conference on Artificial Intelligence, Menlo Park, California, pp. 2958–2960, 2013. [Google Scholar]
7. Z. Xiang and U. Gretzel, “Role of social media in online travel information search,” Tourism Management, vol. 31, no. 2, pp. 179–188, 2010. [Google Scholar]
8. E. Agichtein, C. Castillo, D. Donato, A. Gionis and G. Mishne, “Finding high-quality content in social media,” in Proc. of the Int. Conf. on Web Search and Web Data Mining, Palo Alto, California, USA, pp. 183, 2008. [Google Scholar]
9. N. A. Ghani and S. S. Kamal, “Sentiment-based filtration and data analysis framework for social media,” in Proc. of the 5th Int. Conf. on Computing and Informatics, Istanbul, Turkey, pp. 11–13, 2015. [Google Scholar]
10. R. Irfan, C. King, D. Grages, S. Ewen, S. Khan et al., “A survey on text mining in social networks,” Knowledge Engineering Review, vol. 30, no. 2, pp. 157–170, 2015. [Google Scholar]
11. A. Java, X. Song, T. Finin and B. Tseng, “Why we Twitter: Understanding microblogging,” in Proc. of 9th WebKDD 1st SNA-KDD, 2007 Workshop on Web Mining and Social Network Analysis, San Jose, California, pp. 56–65, 2007. [Google Scholar]
12. N. Arceneaux and S. Weiss, “Seems stupid until you try it: press coverage of Twitter,” New Media & Society, vol. 12, no. 8, pp. 1262–1279, 2010. [Google Scholar]
13. D. Boyd, S. Golder and G. Lotan, “Tweet, tweet, retweet: Conversational aspects of retweeting on twitter,” in Proc. of 43rd Hawaii Int. Conf. on System Sciences, Honolulu, USA, pp. 1–10, 2010. [Google Scholar]
14. E. G. Radke, C. J. Gregory, K. W. Kintziger, E. K. Sauber-Schatz, E. A. Hunsperger et al., “Dengue outbreak in Key West,” Emerging Infectious Diseases, vol. 18, no. 1, pp. 135–137, 2012. [Google Scholar]
15. H. Mohammed, M. Ramos, J. Armstrong, J. Muñoz-Jordán, K. Arnold-Lewis et al., “An outbreak of dengue fever in St. Croix (US Virgin Islands),” PLoS One, vol. 5, no. 10, pp. 1–5, 2010. [Google Scholar]
16. L. Dar, S. Broor, S. Sengupta, I. Xess and P. Seth, “The first major outbreak of dengue hemorrhagic fever in Delhi,” India Emerging Infectious Diseases, vol. 5, no. 4, pp. 589–590, 1999. [Google Scholar]
17. M. Ratsitorahina, J. Harisoa, J. Ratovonjato, S. Biacabe, J. Reynes et al., “Outbreak of dengue and chikungunya fevers,” Emerging Infectious Diseases, vol. 14, no. 7, pp. 1135–1137, 2008. [Google Scholar]
18. T. Cheng and T. Wicks, “Event detection using Twitter: A spatio-temporal approach,” PLoS One, vol. 9, no. 6, e97807, 2014. [Google Scholar]
19. Z. Cheng, J. Caverlee and K. Lee, “A content-driven framework for geolocating microblog users,” ACM Transactions on Intelligent Systems and Technology, vol. 4, no. 1, pp. 1–27, 2013. [Google Scholar]
20. G. Paltoglou, “Sentiment-based event detection in Twitter,” Journal of the Association for Information Science and Technology, vol. 67, no. 7, pp. 1576–1587, 2015. [Google Scholar]
21. T. Toivonen, V. Heikinheimo, C. Fink, A. Hausmann, T. Hiippala et al., “Social media data for conservation science: A methodological overview,” Biological Conservation, vol. 233, no. 1, pp. 298–315, 2019. [Google Scholar]
22. P. S. Earle, D. C. Bowden and M. Guy, “Twitter earthquake detection: Earthquake monitoring in a social world,” Annals of Geophysics, vol. 54, no. 6, pp. 708–715, 2011. [Google Scholar]
23. J. Li and C. Cardie, “Early stage influenza detection from Twitter,” arXiv, 2013. [Google Scholar]
24. H. Sayyadi, M. Hurst and A. Maykov, “Event detection and tracking in social streams,” in Proc. of the Third Int. Conf. on Weblogs and Social Media, ICWSM 2009, San Jose, California, USA, vol. 4, pp. 311–314, 2009. [Google Scholar]
25. E. Aramaki, S. Maskawa and M. Morita, “Twitter catches the flu: detecting influenza epidemics using Twitter,” in Proc. of the 2011 Conference on Empirical Methods in Natural Language Processing, Edinburgh, Scotland, pp. 1568–1576, 2011. [Google Scholar]
26. Apache Hadoop. 2021. [Online]. Available at http://wiki.apache.org/hadoop. [Google Scholar]
27. B. Pang and L. Lee, “Opinion mining and sentiment analysis,” Foundations and Trends® in Information Retrieval, vol. 2, no. 1–2, pp. 1–135, 2008. [Google Scholar]
28. C. M. K. Cheung and M. K. O. Lee, “What drives consumers to spread electronic word of mouth in online consumer-opinion platforms,” Decision Support Systems, vol. 53, no. 1, pp. 218–225, 2012. [Google Scholar]
29. L. Chen, L. Qi and F. Wang, “Comparison of feature-level learning methods for mining online consumer reviews,” Expert Systems Applications, vol. 39, no. 10, pp. 9588–9601, 2012. [Google Scholar]
30. Y. Hu and W. Li, “Document sentiment classification by exploring description model of topical terms,” Computer Speech and Language, vol. 25, no. 2, pp. 386–403, 2011. [Google Scholar]
31. R. Moraes, J. F. Valiati and W. P. Gavião Neto, “Document-level sentiment classification: An empirical comparison between SVM and ANN,” Expert System. Applications, vol. 40, no. 2, pp. 621–633, 2013. [Google Scholar]
32. J. Bollen, H. Mao and X. Zeng, “Twitter mood predicts the stock market,” Journal Computer Science, vol. 2, no. 1, pp. 1–8, 2011. [Google Scholar]
33. W. Medhat, A. Hassan and H. Korashy, “Sentiment analysis algorithms and applications: A survey,” Ain Shams Engineering Journal, vol. 5, no. 4, pp. 1093–1113, 2014. [Google Scholar]
34. X. Ding, B. Liu and P. S. Yu, “A holistic lexicon-based approach to opinion mining,” in Proce. of the Int. Conf. on Web Search and Web Data Mining, WSDM 2008, Palo Alto, California, USA, pp. 231–240, 2008. [Google Scholar]
35. X. Zhou and L. Chen, “Event detection over twitter social media streams,” VLDB Journal, vol. 23, no. 3, pp. 381–400, 2014. [Google Scholar]
36. V. Lampos and N. Cristianini, “Nowcasting events from the social web with statistical learning,” ACM Transactions on Intelligent Systems and Technology, vol. 3, no. 4, pp. 1–22, 2012. [Google Scholar]
37. E. Kalampokis, E. Tambouris and K. Tarabanis, “Understanding the predictive power of social media,” Internet Research, vol. 23, no. 5, pp. 544–559, 2013. [Google Scholar]
38. W. Tom, Hadoop: The definitive Guide, 3rd edition, O’Reilly Media, Inc., Boston MA: Yahoo Press, 2012. [Google Scholar]
39. L. Chuck, Hadoop in Action, 1st edition, Manning Publications, Shelter Island, 2010. [Google Scholar]
40. H. Alex, Hadoop in Action, 1st edition, Manning Publications, Shelter Island, 2012. [Google Scholar]
41. R. Nagaraj, V. Thiagarasu and P. Vijayakumar, “A novel semantic level text classification by combining NLP and Thesaurus concepts,” IOSR Journal of Computer Engineering, vol. 16, no. 4, pp. 14–26, 2010. [Google Scholar]
42. B. Sriram, “Short text classification in twitter to improve information filtering,” in Proc. of the 33rd International ACM SIGIR Conference on Research and Development in Information Retrieval, SIGIR 2010, Geneva, Switzerland, pp. 841–842, 2010. [Google Scholar]
43. M. JafariAsbagh, E. Ferrara, O. Varol, F. Menczer and A. Flammini, “Clustering memes in social media streams,” in Proc. of the 2013 IEEE/ACM Int. Conf. on Advances in Social Networks Analysis and Mining, Niagara Falls, ON, Canada, vol. 4, no. 1, pp. 548–555, 2014. [Google Scholar]
44. B. Han, P. Cook and T. Baldwin, “Lexical normalization for social media text,” ACM Transactions on Intelligent Systems and Technology, vol. 4, no. 1, pp. 1–27, 2013. [Google Scholar]
45. D. L. Pennell and Y. Liu, “Normalization of informal text,” Computer Speech & Language, vol. 28, no. 1, pp. 256–277, 2014. [Google Scholar]
46. J. Porta and L. Sancho, “Word normalization in Twitter using finite-state transducers,” in Proc. of 29th Conference of the Spanish Society for Natural Language Processing (SEPLN 2013Madrid, Spain, pp. 86–90, 2013. [Google Scholar]
47. S. Baccianella, A. Esuli and F. Sebastiani, “SentiWordNet 3.0: An enhanced lexical resource for sentiment analysis and opinion mining,” in Proc. of the Int. Conf. on Language Resources and Evaluation, LREC 2010, Valletta, Malta, pp. 2200–2204, 2010. [Google Scholar]
 | This work is licensed under a Creative Commons Attribution 4.0 International License, which permits unrestricted use, distribution, and reproduction in any medium, provided the original work is properly cited. |