DOI:10.32604/csse.2022.018837
| Computer Systems Science & Engineering DOI:10.32604/csse.2022.018837 | |
| Article |
Hybrid Active Contour Mammographic Mass Segmentation and Classification
Department of Electronics and Instrumentation Engineering, Kongu Engineering College Perundurai, Erode, 638060, India
*Corresponding Author: K. Yuvaraj. Email: kyuvarakeie2020@gmail.com, yuvarajkumarasamy@gmail.com
Received: 23 March 2021; Accepted: 28 May 2021
Abstract: This research implements a novel segmentation of mammographic mass. Three methods are proposed, namely, segmentation of mass based on iterative active contour, automatic region growing, and fully automatic mask selection-based active contour techniques. In the first method, iterative threshold is performed for manual cropped preprocessed image, and active contour is applied thereafter. To overcome manual cropping in the second method, an automatic seed selection followed by region growing is performed. Given that the result is only a few images owing to over segmentation, the third method uses a fully automatic active contour. Results of the segmentation techniques are compared with the manual markup by experts, specifically by taking the difference in their mean values. Accordingly, the difference in the mean value of the third method is 1.0853, which indicates the closeness of the segmentation. Moreover, the proposed method is compared with the existing fuzzy C means and level set methods. The automatic mass segmentation based on active contour technique results in segmentation with high accuracy. By using adaptive neuro fuzzy inference system, classification is done and results in a sensitivity of 94.73%, accuracy of 93.93%, and Mathew’s correlation coefficient (MCC) of 0.876.
Keywords: Feature optimization; hybrid active contour; segmentation; mass classification; mass feature extraction; medical image analysis
The X-ray of breast is called a mammogram, which is used to locate cancer at an early stage. Mass is nothing but a lump that has its own shape and marginal properties. Benign is an initial stage of cancer and marginated smoothly, whereas malignancy becomes more violent with time. Mass can be categorized into three types, namely, well-defined, speculated, and ill-defined [1,2]. Numerous studies have been conducted to identify a mass in its early stages. The literature has indicated that segmentation, which is highly efficient, accurate, and fully automatic, is needed for spotting a mass at its beginning phase [3,4].
This paper is organized as follows. Section 1 describes a mammographic mass and its three types. Section 2 discusses mammographic mass segmentation based on iterative active contour. Section 3 illustrates the automatic seed selection technique. Section 4 discusses an automatic mask selection-based active contour. Section 5 deals with classification. Lastly, Section 6 draws the conclusion and future scope.
2 Iterative Active Contour-Based Mass Segmentation
Mammographic image with mass is considered an input and preprocessing techniques are used, which include cropping and equalization using histogram. Preprocessed images are subjected to iterative thresholding to extract a rough boundary. Active contour is applied to the iterative threshold image, leading to final segmentation. The main advantage of contour-based segmentation is that it preserves mass region information, edge, and shape. All processes are carried out and the results are obtained using MATLAB. Fig. 1 shows the architecture diagram of the iterative active contour segmentation.

Figure 1: Architecture diagram of the iterative active contour technique
Images are obtained from the MIAS database and collected from the Clarity Imaging Center, Coimbatore. The mass region is cropped and the preprocessed gray scale picture is converted into a binary image using the iterative threshold technique [5,6]. The threshold value θ is calculated iteratively based on the foreground and background strengths. The threshold value of the image shown in Fig. 2 is calculated as 128. The original, preprocessed, and threshold images are shown in Fig. 2.
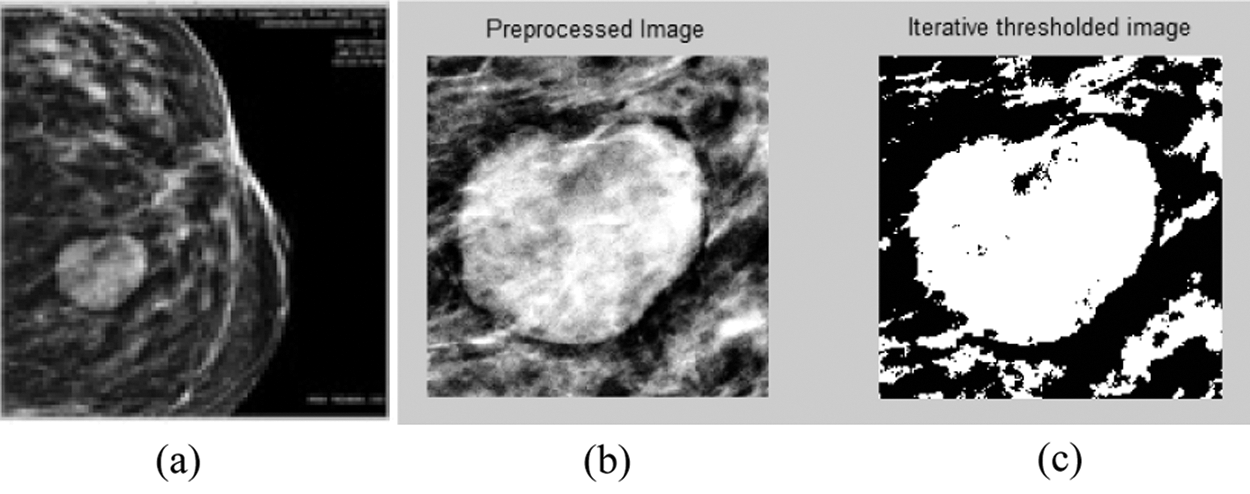
Figure 2: (a) Actual, (b) preprocessed, and (c) iterative threshold images
Threshold image is taken as input. The mask image size is taken as the same size of the iterative threshold image. Within this image, a square mask of size 111 × 111 is defined. On the basis of energy minimization, the defined mask will fit to the boundary. Gradient descent minimization is used to minimize snake energy [7]. The force acting on the contour is as follows:
The total energy of the contour is as follows:
where
The external energy acting on the contour is as follows:
where
Eq. (8) represents the next iteration of the contour:
The iteration repeats until the snake converges its minimal boundary [8]. Fig. 3 illustrates various stages involved in the proposed method of mass segmentation [9,10]. The output obtained (450th iteration) for a sample image is given in the following section.
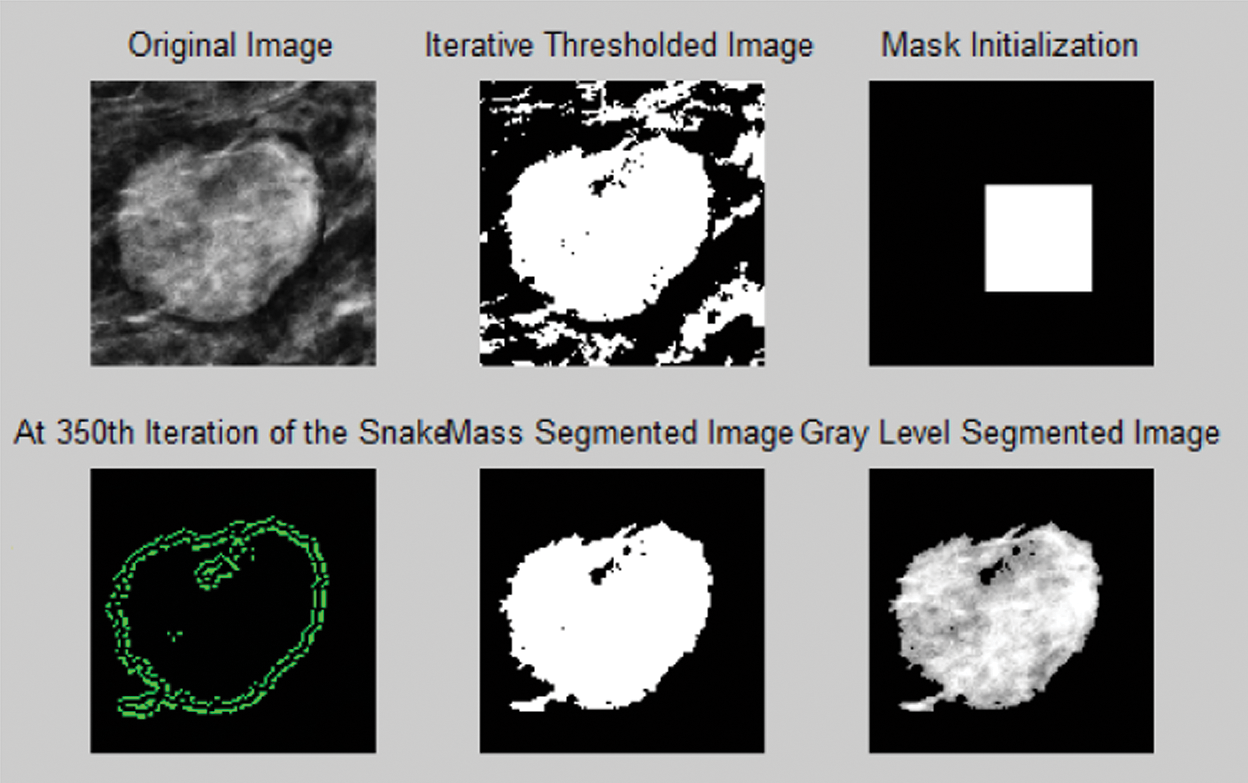
Figure 3: Various stages of output in the proposed iterative active contour-based segmentation
The mass affected area in the mammographic image is cropped manually and allowed for further processing. This drawback is avoided by adopting a new segmentation scheme, in which the entire image is considered without cropping.
3 Automatic Seed Selection Based on Region Growing Technique
Fig. 4 shows the flow diagram of the automatic selection of seed based on the region growing [11,12] mass segmentation technique [13,14]. As a pre-study, a mask of size 20 × 20 is initialized for various reference images. For regions within the mask, statistical features are extracted, namely, contrast, dissimilarity, sum average, sum variance, and auto correlation, as listed in Tab. 1. For the image under testing, if the extracted features lie in the range of the predefined statistical features of mass, then the seed is fixed. The input image is subjected to thresholding. Thereafter, the final gray level segmented picture is obtained. The mask is moved in case of a mismatch in the extracted features.
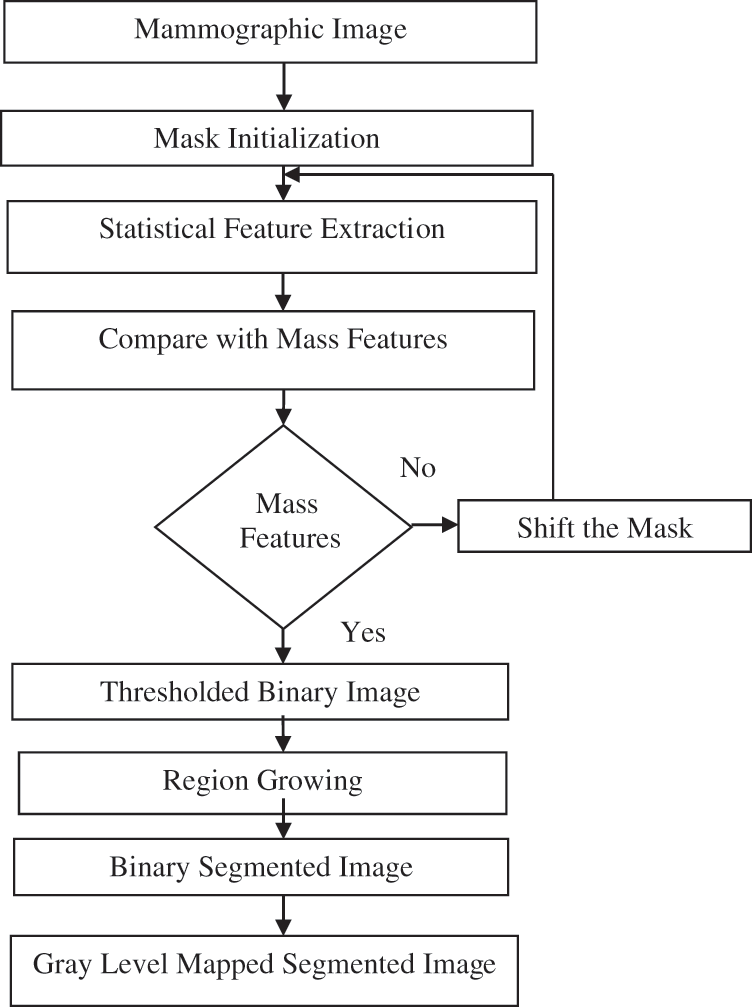
Figure 4: Flow diagram of the automated seed selection-based region growing mass segmentation technique
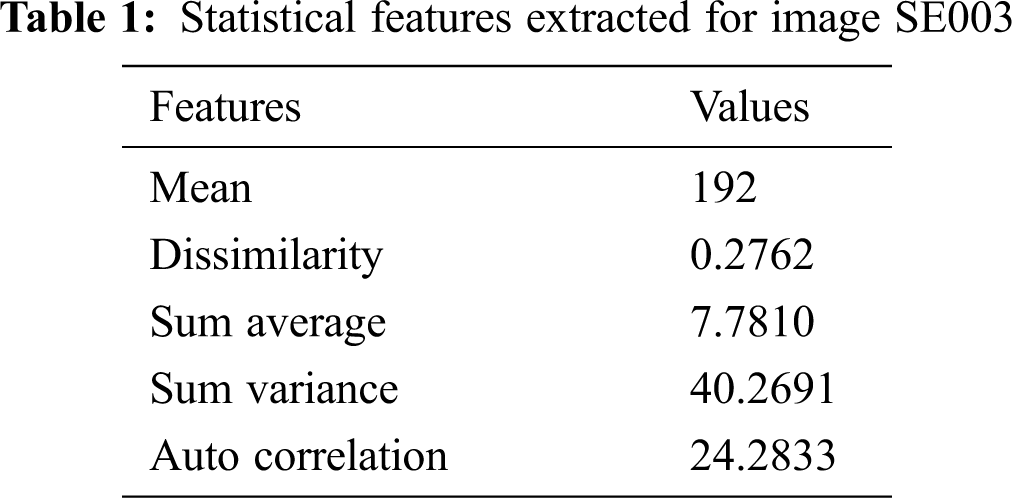
Fig. 5 shows the various stages of mass segmentation using automatic seed selection-based region growing technique.
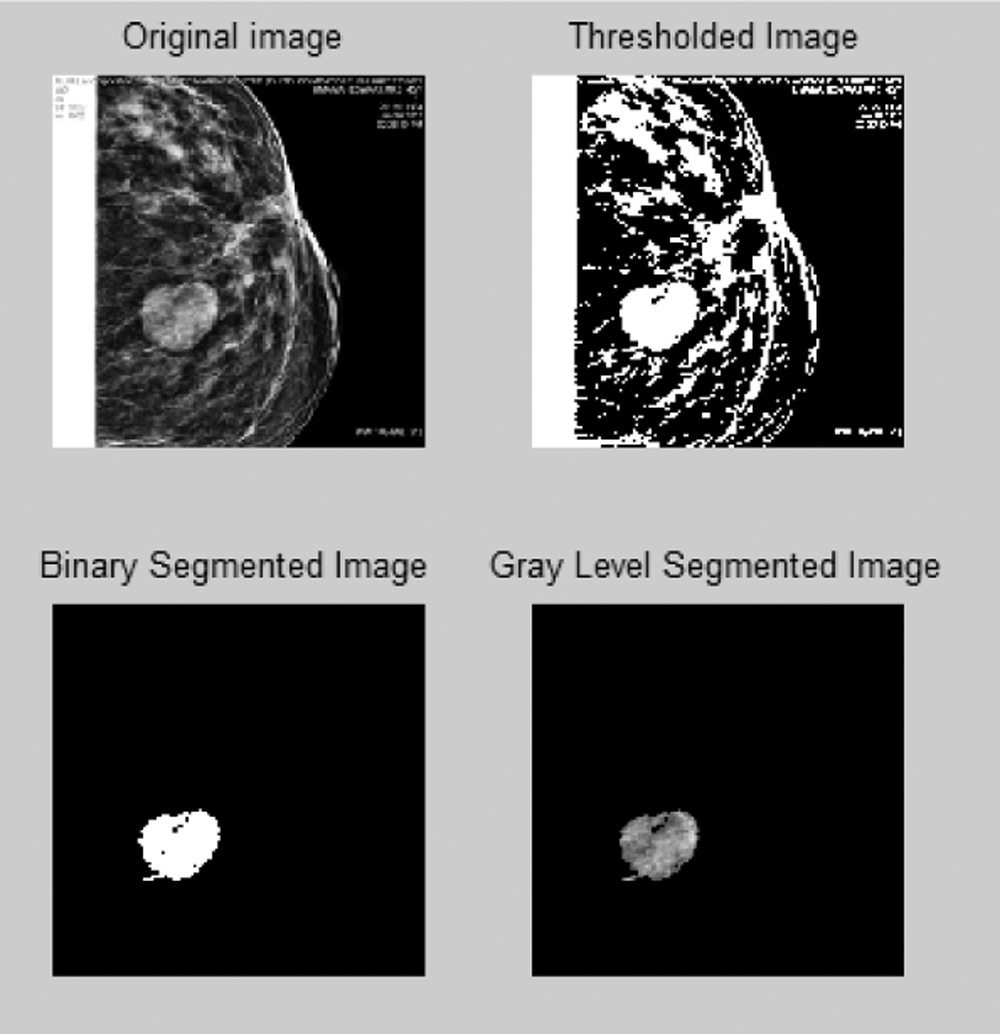
Figure 5: Various stage outputs of the proposed automatic region growing-based segmentation
Fig. 6 shows over segmentation. A single pixel can act as a bridge for leakage. The active contour technique is utilized to solve this problem.
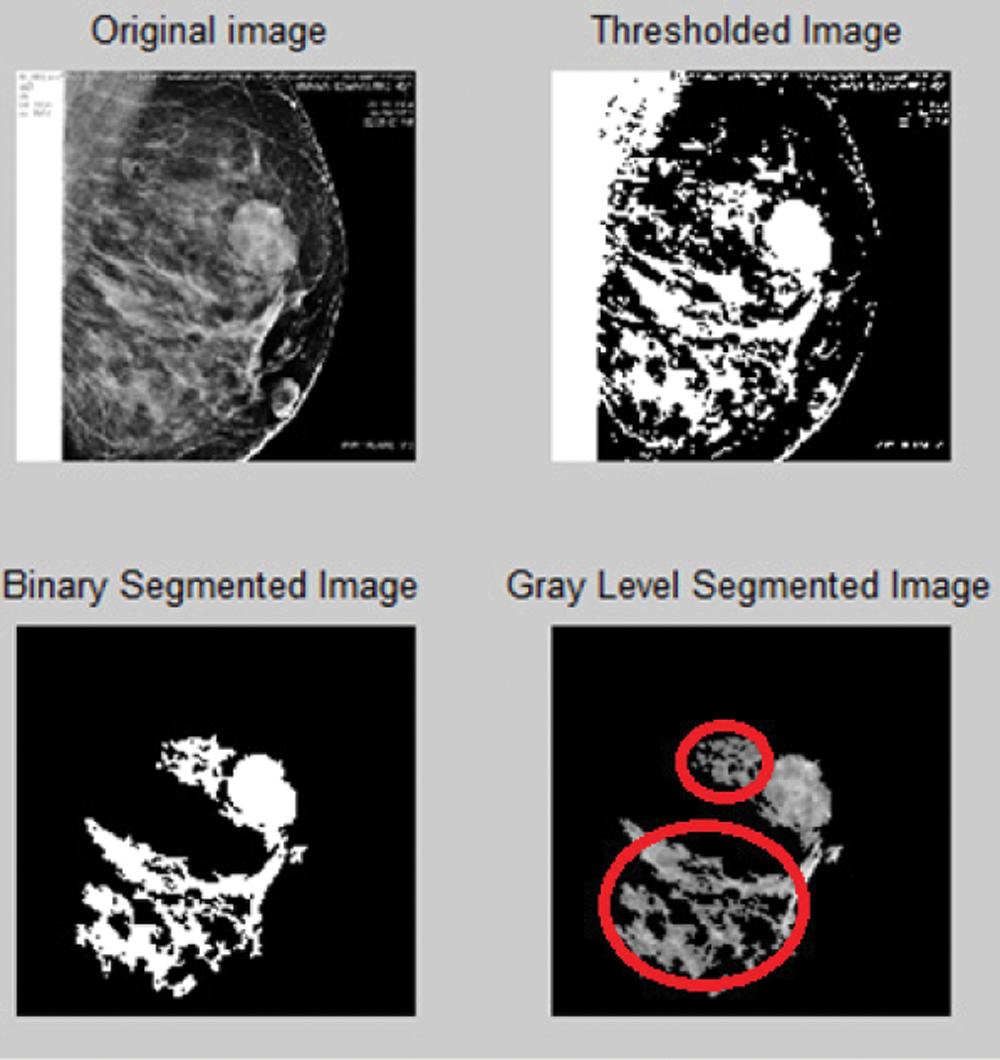
Figure 6: Over segmentation for the proposed automatic region growing-based segmentation
4 Automatic Mass Selection-Based Active Contour Technique
This method completely aims at automatic mask selection based on the active contour technique. The mask for the active contour technique is chosen automatically by reading the mass features. Fig. 7 illustrates the flow diagram of the fully automatic active contour-based mass segmentation.
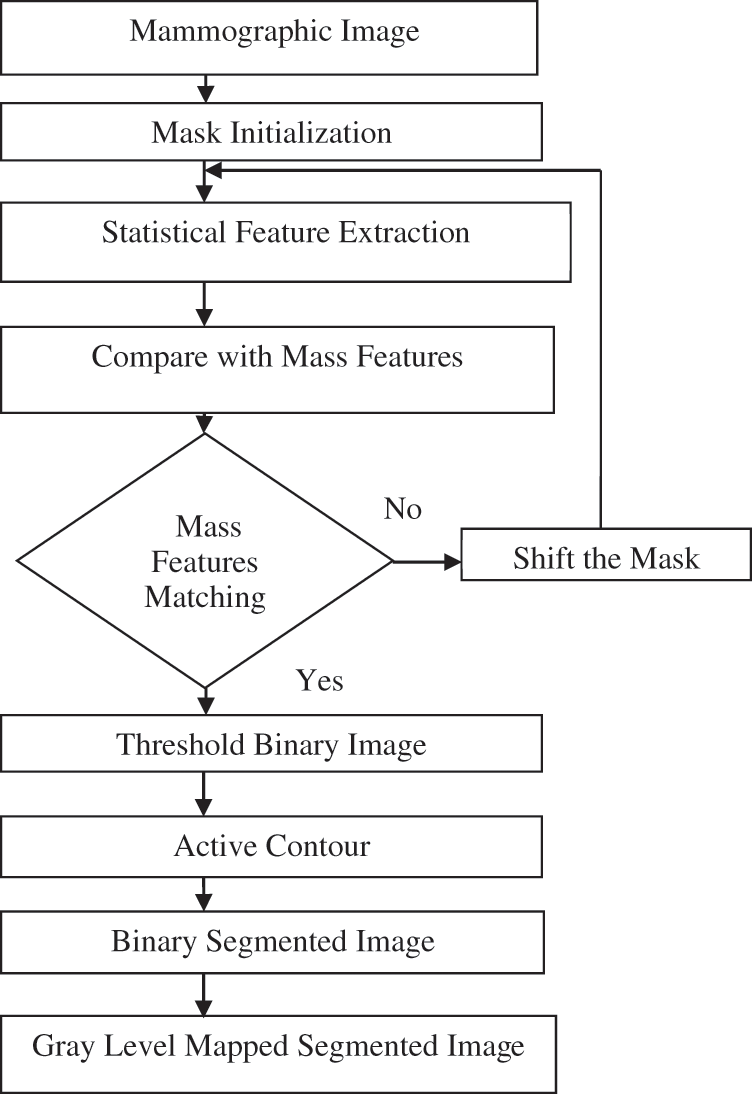
Figure 7: Flow diagram of the proposed fully automatic mass segmentation based on active contour
A mask of size 20 × 20 is initialized. Five statistical features are extracted for the regions within the mask (same as in method 2). If the extracted features lie in the range of the predefined features of mass, then the mask is fixed. The input image is subjected to thresholding and active contour technique is implemented thereafter [15]. Lastly, gray level segmented image is obtained. Thereafter, the mask is moved in case of mismatch in the extracted features [16]. Fig. 8 depicts the output of the preceding method.
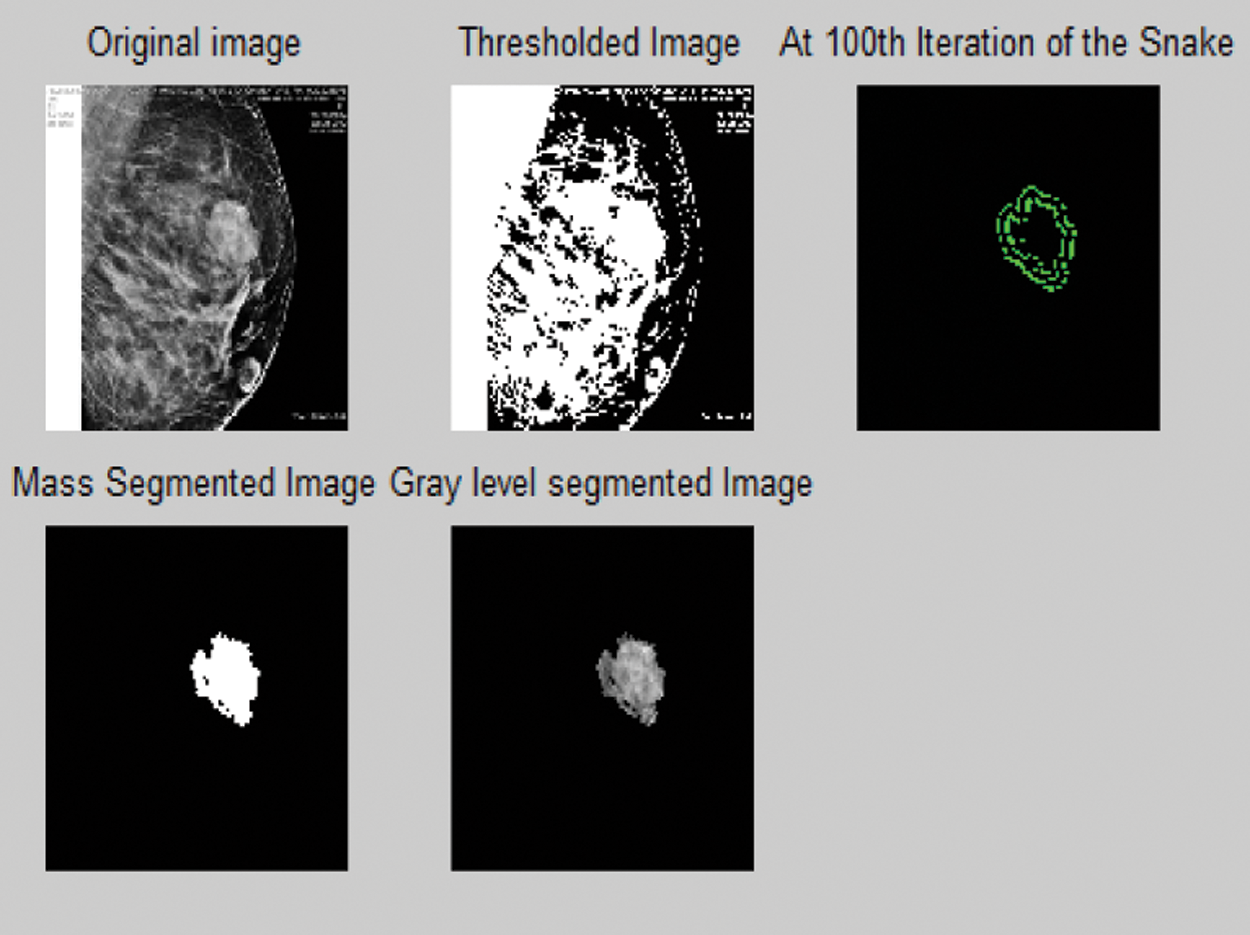
Figure 8: Various stages of outputs in the proposed automatic active contour-based segmentation
Fig. 9 shows the output of the three proposed methods for various mammographic images. Evidently, over segmentation for image 2 is prevented by using the automatic active contour technique.
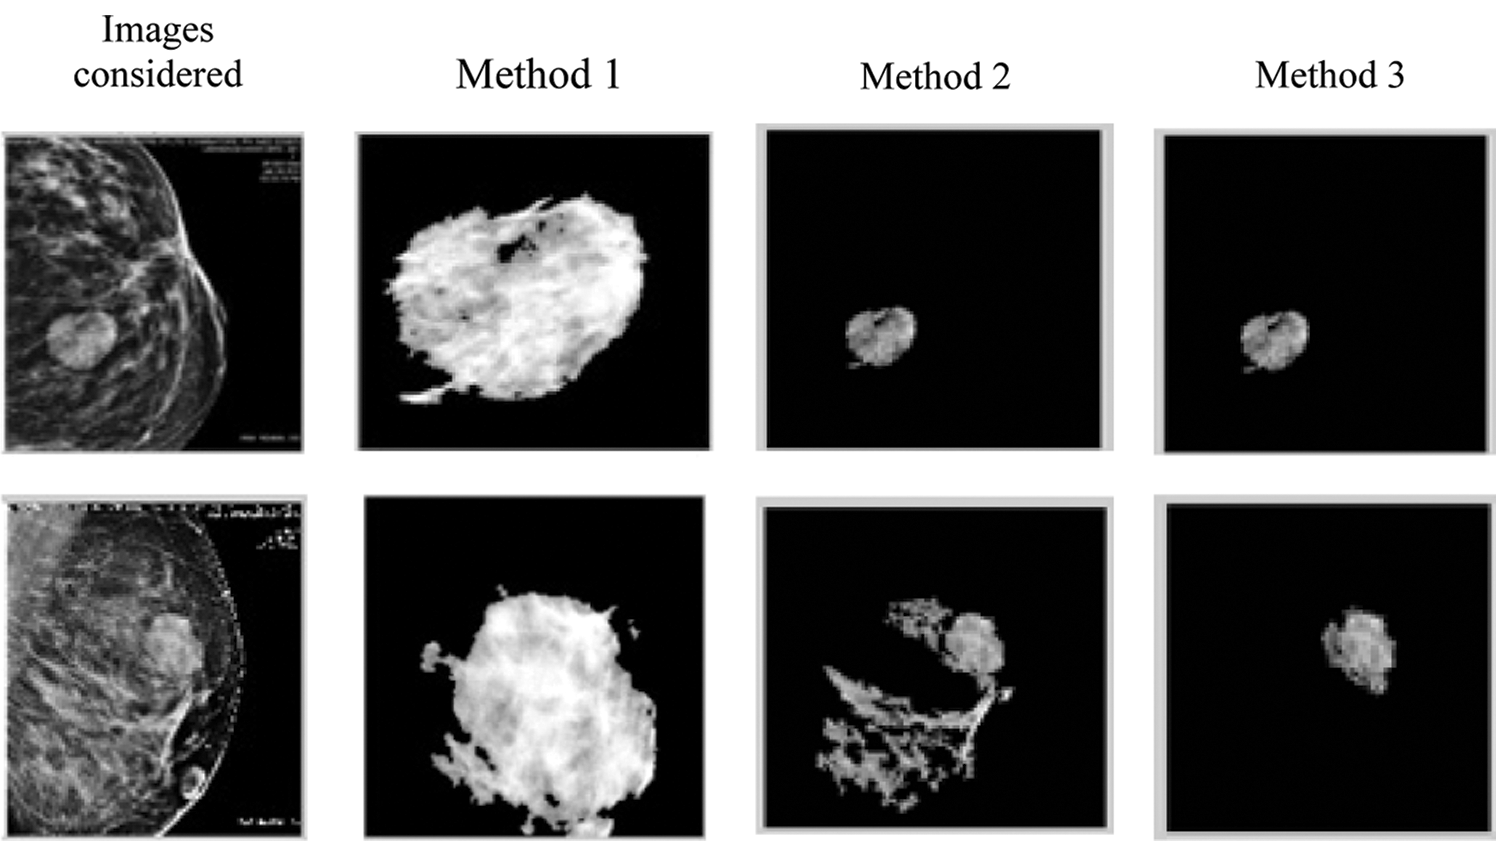
Figure 9: Output of the three proposed methods for various mammographic images
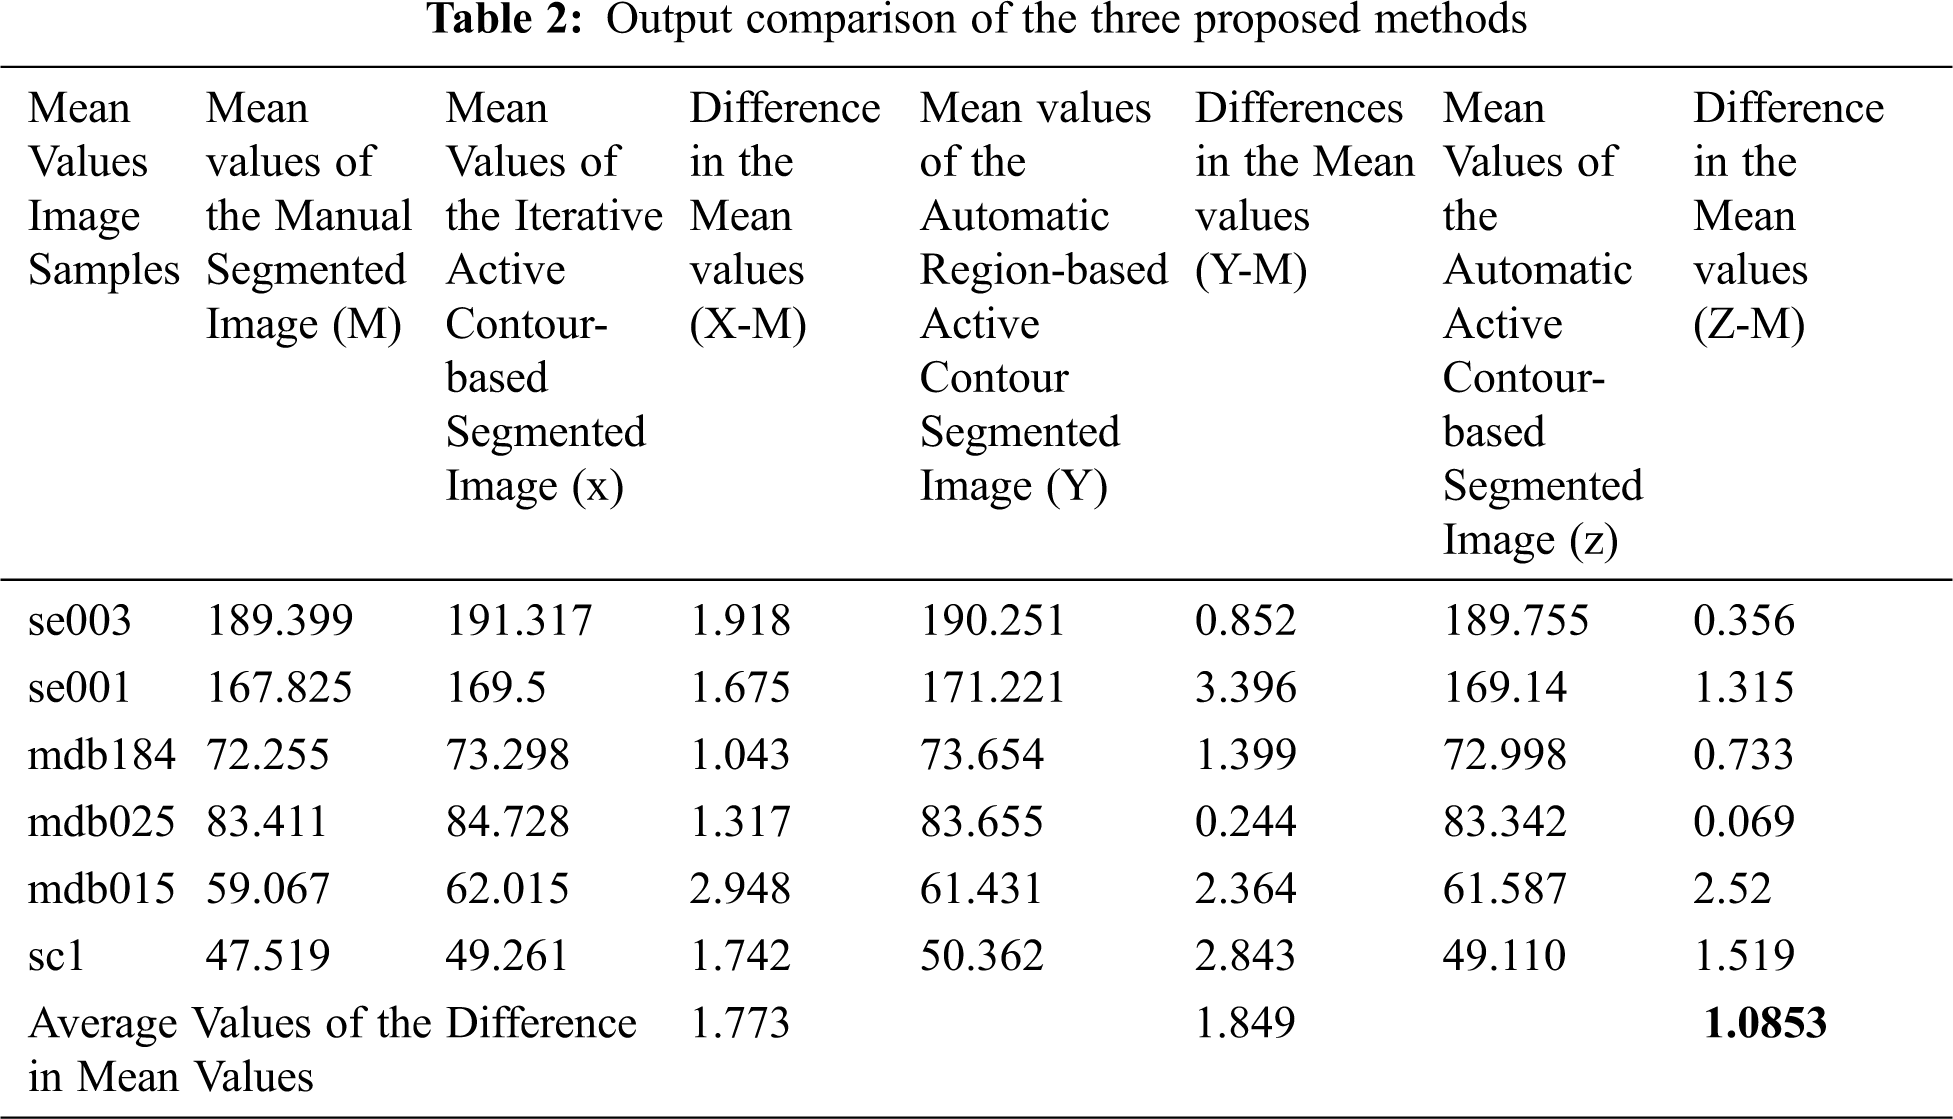
The expected output is marked manually by the physician, and the mean values of the three proposed methods are calculated in Tab. 2. Note that the difference in the mean values of the proposed method 3 is 1.085. This value is closer to zero, thereby indicating the closeness of the segmentation.
The proposed method is compared with the existing methods, such as the fuzzy C means (FCM) clustering and level set methods (see Fig. 10).
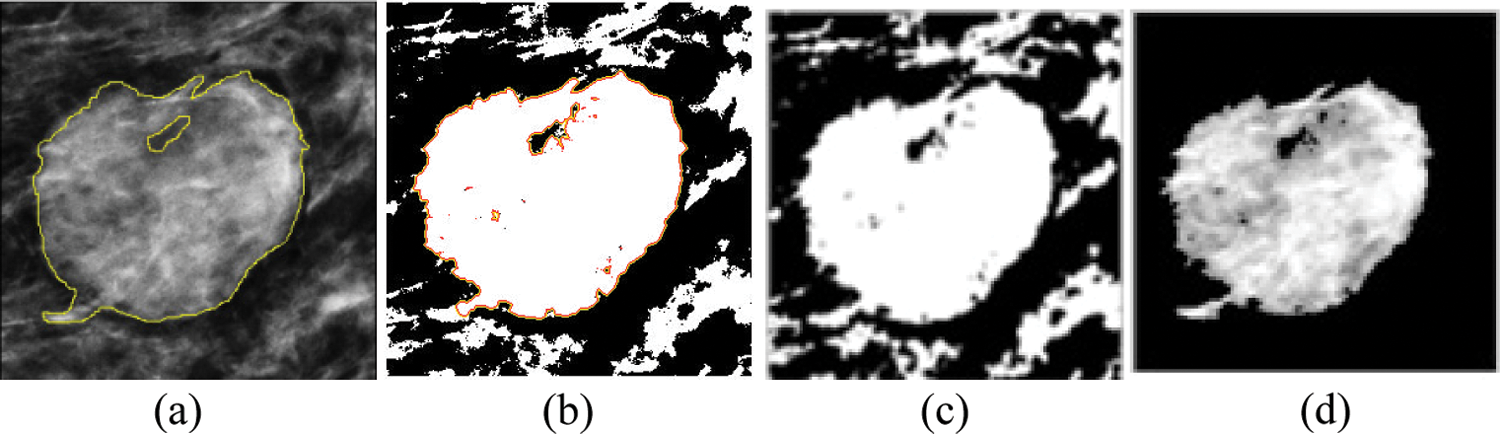
Figure 10: Comparison of the segmented outputs: Proposed method with the existing algorithms: (a) manually marked, (b) level set, (c) FCM, and (d) proposed methods
The statistical means of the preceding methods are compared using Fiji (see Tab. 3).
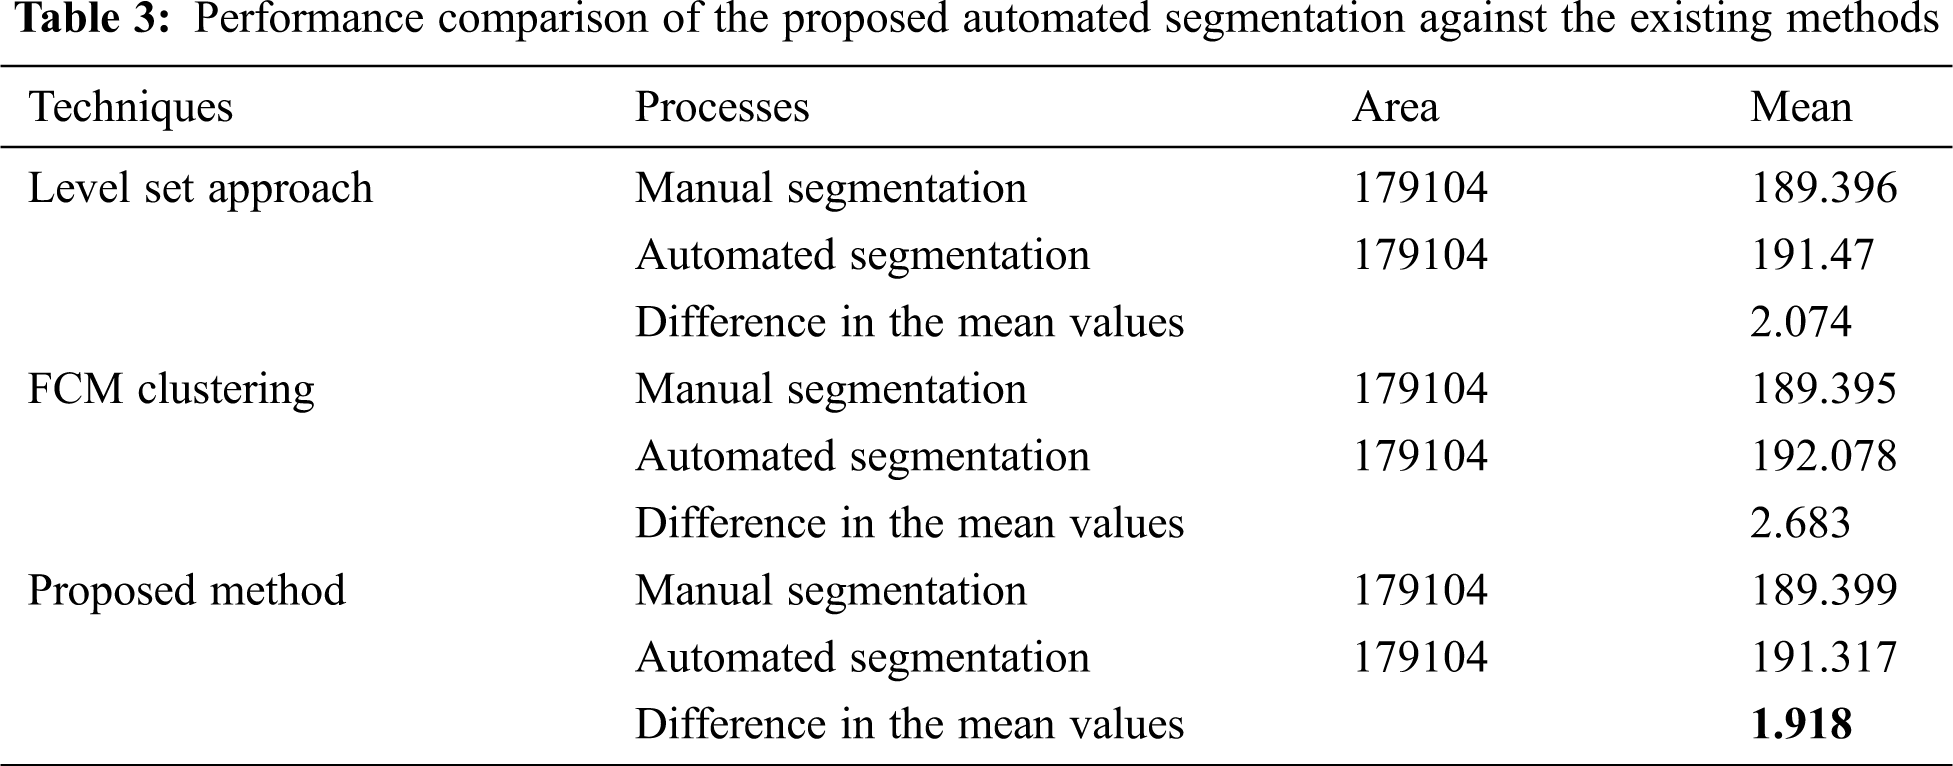
Tab. 3 shows that the proposed algorithm holds good because its difference of mean value is low, which shows the closeness of segmentation.
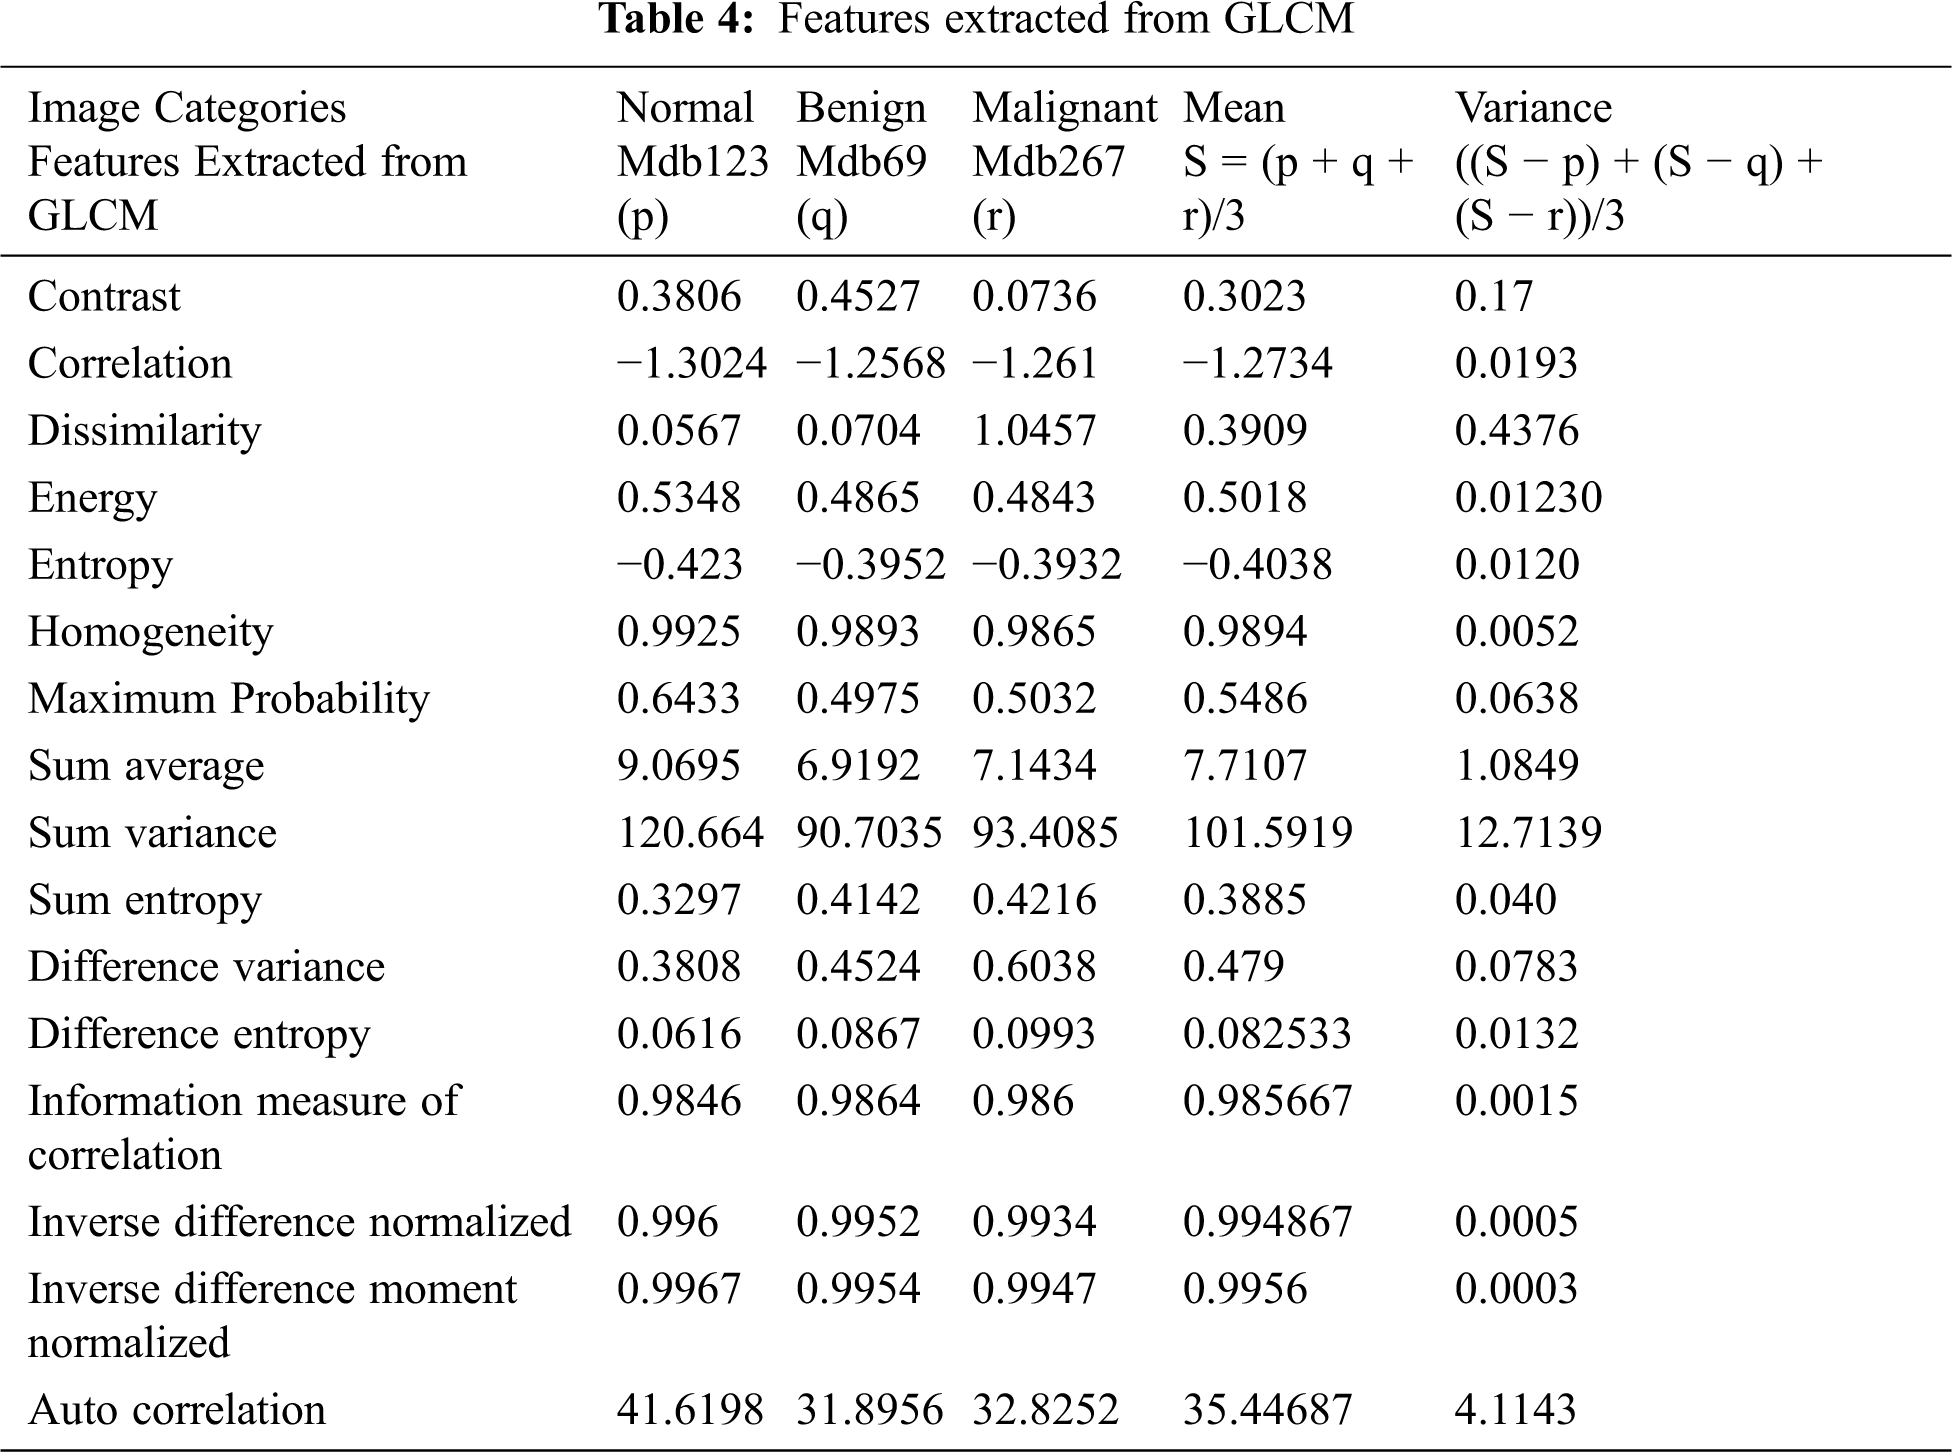
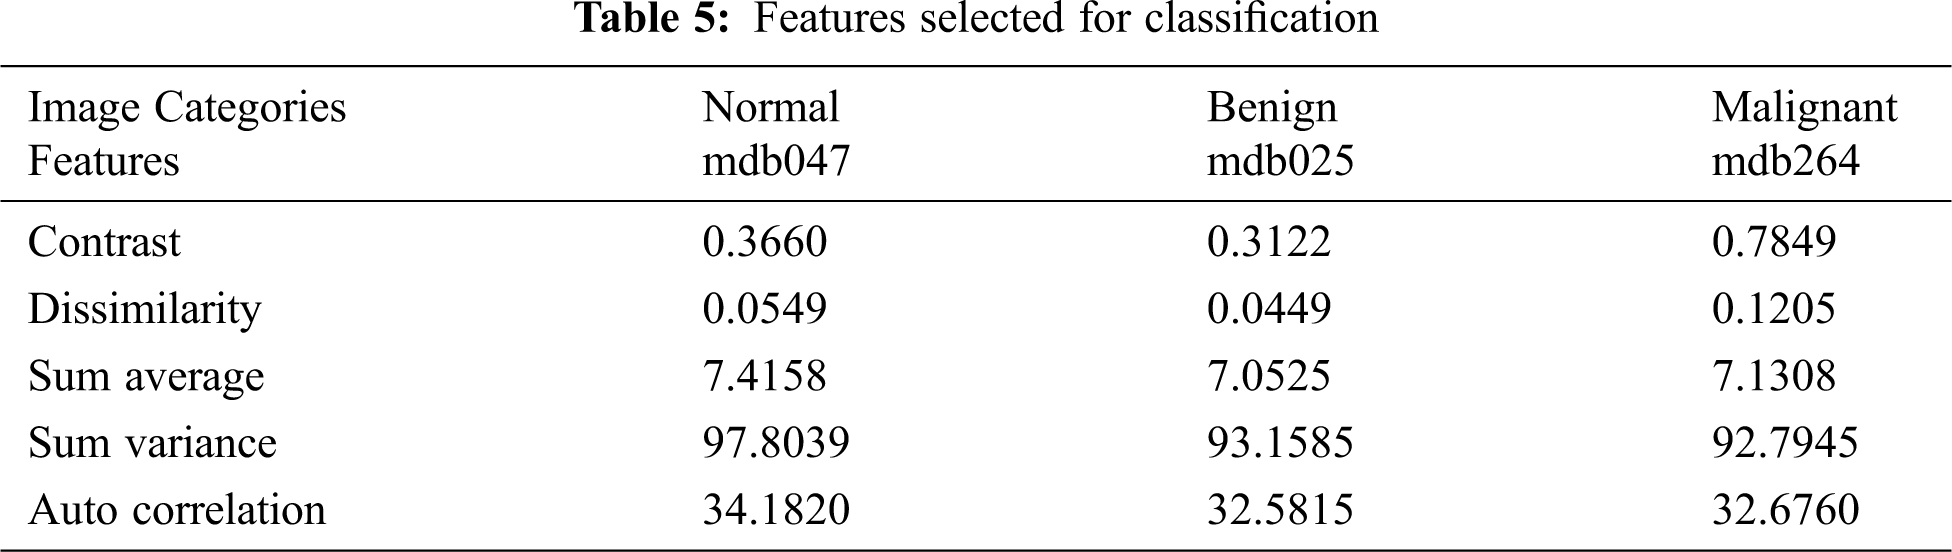
From the segmented result of the automatic active contour technique, a 20 × 20 mask is defined and the following statistical features are extracted from its formulated gray level co-occurrence matrix (GLCM). Initially, 16 statistical features are extracted, as shown in Tab. 4. Based on variance, five features are selected and listed in Tab. 5.
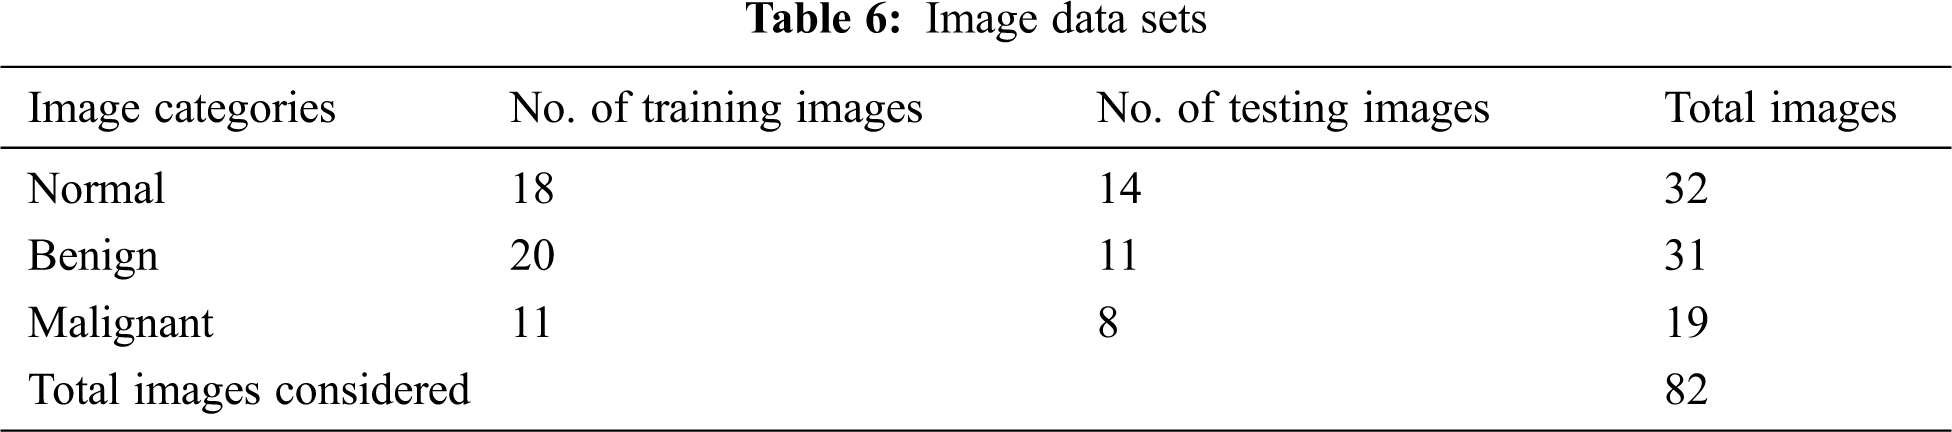
ANFIS is used as a classifier [17,18]. Various membership functions and their testing errors are shown in Fig. 11. The triangular membership function with minimum error of 0.463 is considered. Three triangular membership functions are used for each input. A total of 729 rules are framed. Tab. 6 lists the number of images considered for classification.
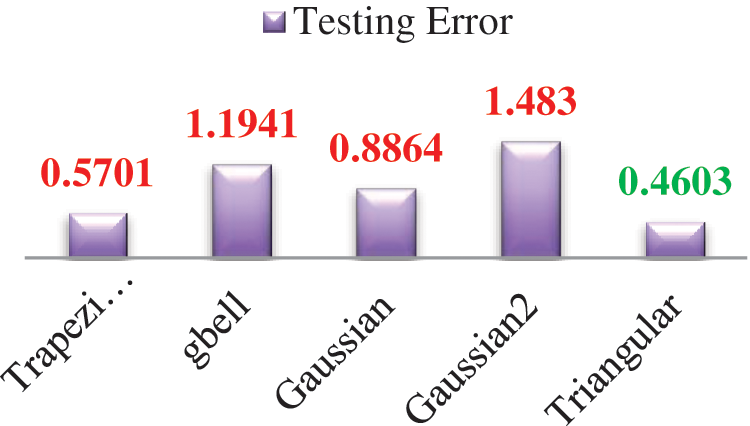
Figure 11: Various membership functions and their testing errors
The classified ANFIS plot is shown in Fig. 12. As presented in Fig. 12, a confusion matrix is formed and shown in Tab. 7.
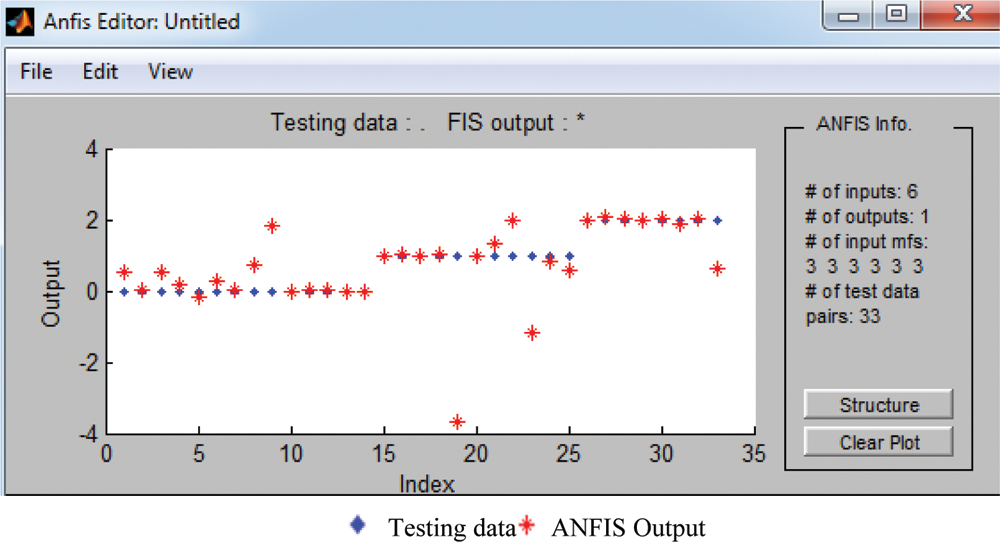
Figure 12: ANFIS classifier output
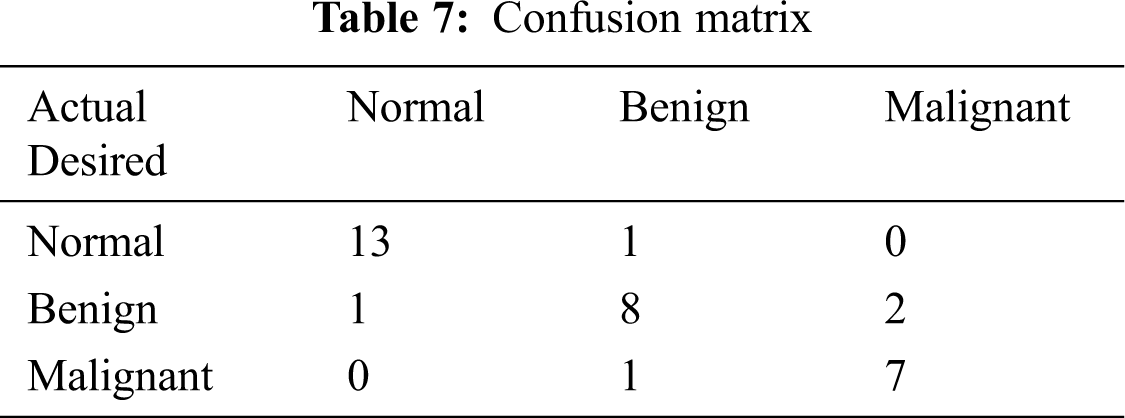
From the confusion matrix, the following performance metrics are calculated: sensitivity, specificity, precision, accuracy, and MCC [15]:
The preceding values are calculated and listed in Tab. 8.
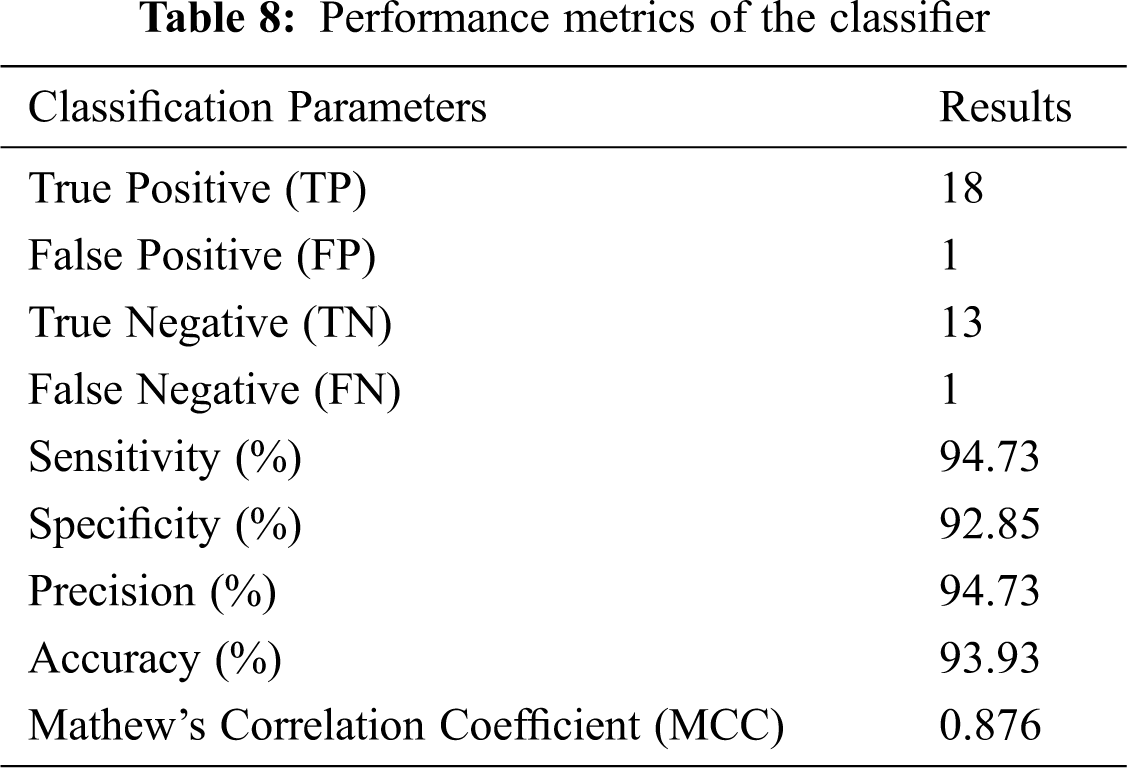
Tab. 8 shows that accuracy is inferred to be 93.93% and MCC is 0.876. Hence, a high accurate classification is made. The proposed method serves as a second opinion for doctors in diagnosing cancer.
Women are mostly affected by breast cancer, thereby resulting in this disease becoming a major cause of death. Thus, technology for early detection should be identified. Evidently, the proposed method is of high medical significance in detecting early-stage cancer.
This research proposes a new hybrid active contour mass segmentation. The result of the segmentation and existing techniques are compared with the manual segmentation, proving that the proposed iterative active contour technique stays good in mass segmentation. The classification result proves satisfying in terms of accuracy, sensitivity, and MCC.
In the future, numerous images should be considered and examined using the proposed method, and different modalities can also be included. Along with statistical features, other features, such as structures and patterns, can also be considered. Classification may be performed using advance classifiers.
Funding Statement: The authors received no specific funding for this study.
Conflicts of Interests: The authors declare that they have no conflicts of interest to report regarding the present study.
1. A. Mencattini, G. Rabottino, M. Salmeri, R. Lojacono and E. Colini, “Breast mass segmentation in mammographic images by an effective region growing algorithm,” in Advanced Concepts for Intelligent Vision Systems, Lecture Notes in Computer Science, Berlin, Heidelberg: Springer, vol. 5259, pp. 948–957, 2008. [Google Scholar]
2. A. Oliver, J. Freixenet, J. Martí, E. Pérez, J. Pont et al., “A review of automatic mass detection and segmentation in mammographic images,” International Journal on Medical Image Analysis, vol. 14, no. 2, pp. 87–110, 2010. [Google Scholar]
3. B. Charan Patel and G. R. Sinha, “Energy and region based detection and segmentation of breast cancer mammo graphic images,” International. Journal of Image Graphics and Signal Processing, vol. 6, pp. 44–51, 2012. [Google Scholar]
4. F. Akram, J. Heon Kim, C. Gun Lee and K. Nam Choi, “Segmentation of regions of interest using active contours with SPF Function,” Computational and Mathematical Methods in Medicine, vol. 2015, pp. 710326:1–710326:14, 2015. [Google Scholar]
5. Z. Han, H. Chen, J. Li and C. Yao, “A novel method of mass segmentation in mammogram,” in Int. Conf. on Systems and Informatics (ICSAI2012Yantai, China, pp. 1412–1416, 2012. [Google Scholar]
6. M. Mustafa, H. N. Omar Rashid, N. R. Hasma Abdullah, R. Samad and D. Pebrianti, “Mammography image segmentation: Chan-vese active contour and localized active contour approach,” Indonesian Journal of Electrical Engineering and Computer Science, vol. 5, no. 3, pp. 577–588, 2017. [Google Scholar]
7. N. Petrick, H. Ping, C. Heang, P. ChanBerkman, S. B. Sahiner et al., “Combined adaptive enhancement and region-growing segmentation of breast masses on digitized mammograms,” Medical Physics, vol. 26, no. 8, pp. 1642–1654, 1999. [Google Scholar]
8. B. Sahiner, N. Petrick, H. Ping Chan, L. M. Hadjiiski and C. Paramagul, “Computer-aided characterization of mammographic masses: Accuracy of mass segmentation and its effects on characterization,” IEEE Transaction on Medical Imaging, vol. 20, no. 12, pp. 1275–1284, 2001. [Google Scholar]
9. S. Kumar and B. Padhyay, “Survey on segmentation methods for locating masses in a mammogram image,” An International Journal of Computer Applications, vol. 9, no. 11, pp. 25–28, 2011. [Google Scholar]
10. Y. Jin Lee, “Mammographic mass detection by adaptive thresholding and region growing,” International Journal of Imaging Systems and Technology, vol. 11, no. 5, pp. 340–346, 2000. [Google Scholar]
11. K. Yuvaraj and U. S. Ragupathy, “Automatic mammographic mass segmentation based on region growing technique,” in Proc. ICEBEA, Singapore, pp. 121–128, 2012. [Google Scholar]
12. K. Yuvaraj and U. S. Ragupathy, “Computer aided segmentation and classification of mass in mammographic images using ANFIS,” European Journal of Biomedical Informatics, vol. 9, no. 2, pp. 37–41, 2013. [Google Scholar]
13. A. Oliver, J. Freixenenet, J. Marti, E. Perez, J. Pont et al., “A review of automatic mass detection and segmentation in mammographic images,” Medical Image Analysis, vol. 14, pp. 87–110, 2010. [Google Scholar]
14. A. Mencattini, G. Rabottino, M. Salmeri, R. Lojacono and E. Colini, “Breast mass segmentation in mammographic images by an effective region growing algorithm,” in Int. Conf. on Advanced Concepts for Intelligent Vision Systems, pp. 948–957, 2008. [Google Scholar]
15. S. Maheswaran, S. Nehru and S. Sathesh, “A wearable embedded device for chronic low back patients to track lumbar spine position,” Biomedical Research, vol. 20, pp. 118–S123, 2018. [Google Scholar]
16. S. Maheswaran, S. Sathesh, M. Gayathri, E. D. Bhaarathei and D. Kavin, “Design and development of chemical free green embedded weeder for row based crops,” Journal of Green Engineering, vol. 10, no. 5, pp. 2103–2120, 2020. [Google Scholar]
17. D. Sami, W. Barhoumi, J. Kurek and B. Swiderski, “False-positive reduction in computer-aided mass detection using mammographic texture analysis and classification,” Computer Methods and Programs in Biomedicine, vol. 160, pp. 75–83, 2018. [Google Scholar]
18. C. Chowdhary and D. P. Acharjya, “A hybrid scheme for breast cancer detection using intuitionistic fuzzy rough set technique,” International Journal of Healthcare Information Systems and Informatics, vol. 11, pp. 38–61, 2016. [Google Scholar]
 | This work is licensed under a Creative Commons Attribution 4.0 International License, which permits unrestricted use, distribution, and reproduction in any medium, provided the original work is properly cited. |