DOI:10.32604/csse.2022.019704
| Computer Systems Science & Engineering DOI:10.32604/csse.2022.019704 | |
| Article |
Design Principles-Based Interactive Learning Tool for Solving Nonlinear Equations
1Computer Sciences Department, Faculty of Computing and Information Technology, King Abdulaziz University, Jeddah, Saudi Arabia
2Electrical Engineering Department, Faculty of Engineering at Shoubra, Benha University, Cairo, Egypt
*Corresponding Author: Reem Alnanih. Email: ralnanih@kau.edu.sa
Received: 22 April 2021; Accepted: 01 June 2021
Abstract: Interactive learning tools can facilitate the learning process and increase student engagement, especially tools such as computer programs that are designed for human-computer interaction. Thus, this paper aims to help students learn five different methods for solving nonlinear equations using an interactive learning tool designed with common principles such as feedback, visibility, affordance, consistency, and constraints. It also compares these methods by the number of iterations and time required to display the result. This study helps students learn these methods using interactive learning tools instead of relying on traditional teaching methods. The tool is implemented using the MATLAB app and is evaluated through usability testing with two groups of users that are categorized by their level of experience with root-finding. Users with no knowledge in root-finding confirmed that they understood the root-finding concept when interacting with the designed tool. The positive results of the user evaluation showed that the tool can be recommended to other users.
Keywords: Graphical user interface (GUI); interactive learning tool; design principles; nonlinear equations; experimental design
Learning methods play an important role and receive special attention in our lives. We live in a digital age where we want something efficient, effective, dynamic, quick, and interactive. The term “interactive” appears in two distinct strands of educational research discourse: one regarding pedagogy, and the other regarding new technologies in education. Teaching students by the traditional method can be more difficult to retrieve information and increase student interaction and engagement than the interactive method. Interactivity is the key to having an effective and efficient teaching and learning operation, in which the teacher can attract students’ attention, and students can learn more than with the traditional method [1,2]. With the outbreak of coronavirus in the year 2020, people around the world were faced with major challenges [3]. One of these challenges was to adapt to online teaching and learning opportunities [3]. COVID-19 made clear the importance of having an interactive learning tool to facilitate students' education. For some students, interactive learning online was easy and problem-free [4]. However, some students found it difficult to access technology and digital devices [3].
Numerical analysis is an essential branch of mathematics and computer science that pertains to algorithms that use a numerical approximation in mathematical analysis. More specifically, it includes the study of methods for computing numerical data. These methods create and implement algorithms that solve a mathematical problem by obtaining an accurate numerical approximation to the solution, in addition to finding the error associated with that solution [5]. It has its applications in engineering and sciences [6–8].
In mathematics, some problems have no exact solution or have solutions that are hard to find; hence, the best approximate solution is needed to solve that type of problems using different techniques. Generally, root-finding algorithms are some of the most important algorithms used in various fields, including computer science, chemistry, physics, and engineering [6]. These algorithms find the zero
Usually, these methods are iterative, such that in each iteration, the approximate solution is improved to a more accurate solution recursively [9]. This leads to difficulties in teaching and applying them in the traditional way. Especially in some cases where complex equations are used, which results in many calculations that are difficult and time-consuming to perform manually and explain the concept of converging to students. Furthermore, it is ineffective to teach this algorithm in the traditional way because it is difficult to use different types and a sufficient number of examples within a limited time. Hence, an improved learning tool is needed to teach root-finding algorithms efficiently.
In this study, we design and develop a design principles-based interactive learning tool and use MATLAB to solve nonlinear equations. These methods include the bisection method [10], Newton’s method [11], secant method [11], hybrid method [6], and improved hybrid method [12].
Our contribution with this study is to design a tool, based on design principles, to compare solutions from these methods in an interactive way. The solution for a particular function displayed by all implemented methods and compare them in terms of several attribute measures, such as the time taken to complete each method and the number of iterations required to find the final solution. This tool helps students to learn several methods for solving nonlinear equations by engaging with an interactive learning tool.
The rest of this paper is organized as follows: Section 2 describes related work. Section 3 illustrates the implemented tool for all five methods, defines the design principles, and explains how it apply to the interface tool. Sections 4 and 5 present the user evaluation and discuss the tool’s results. Finally, Section 6 concludes the entire study and presents future work.
Interactive learning tools can facilitate the learning process and increase student engagement. Learning methods play an important role and receive special attention in our lives [1,13]. In this section, many proposed interactive learning tools from different areas are discussed.
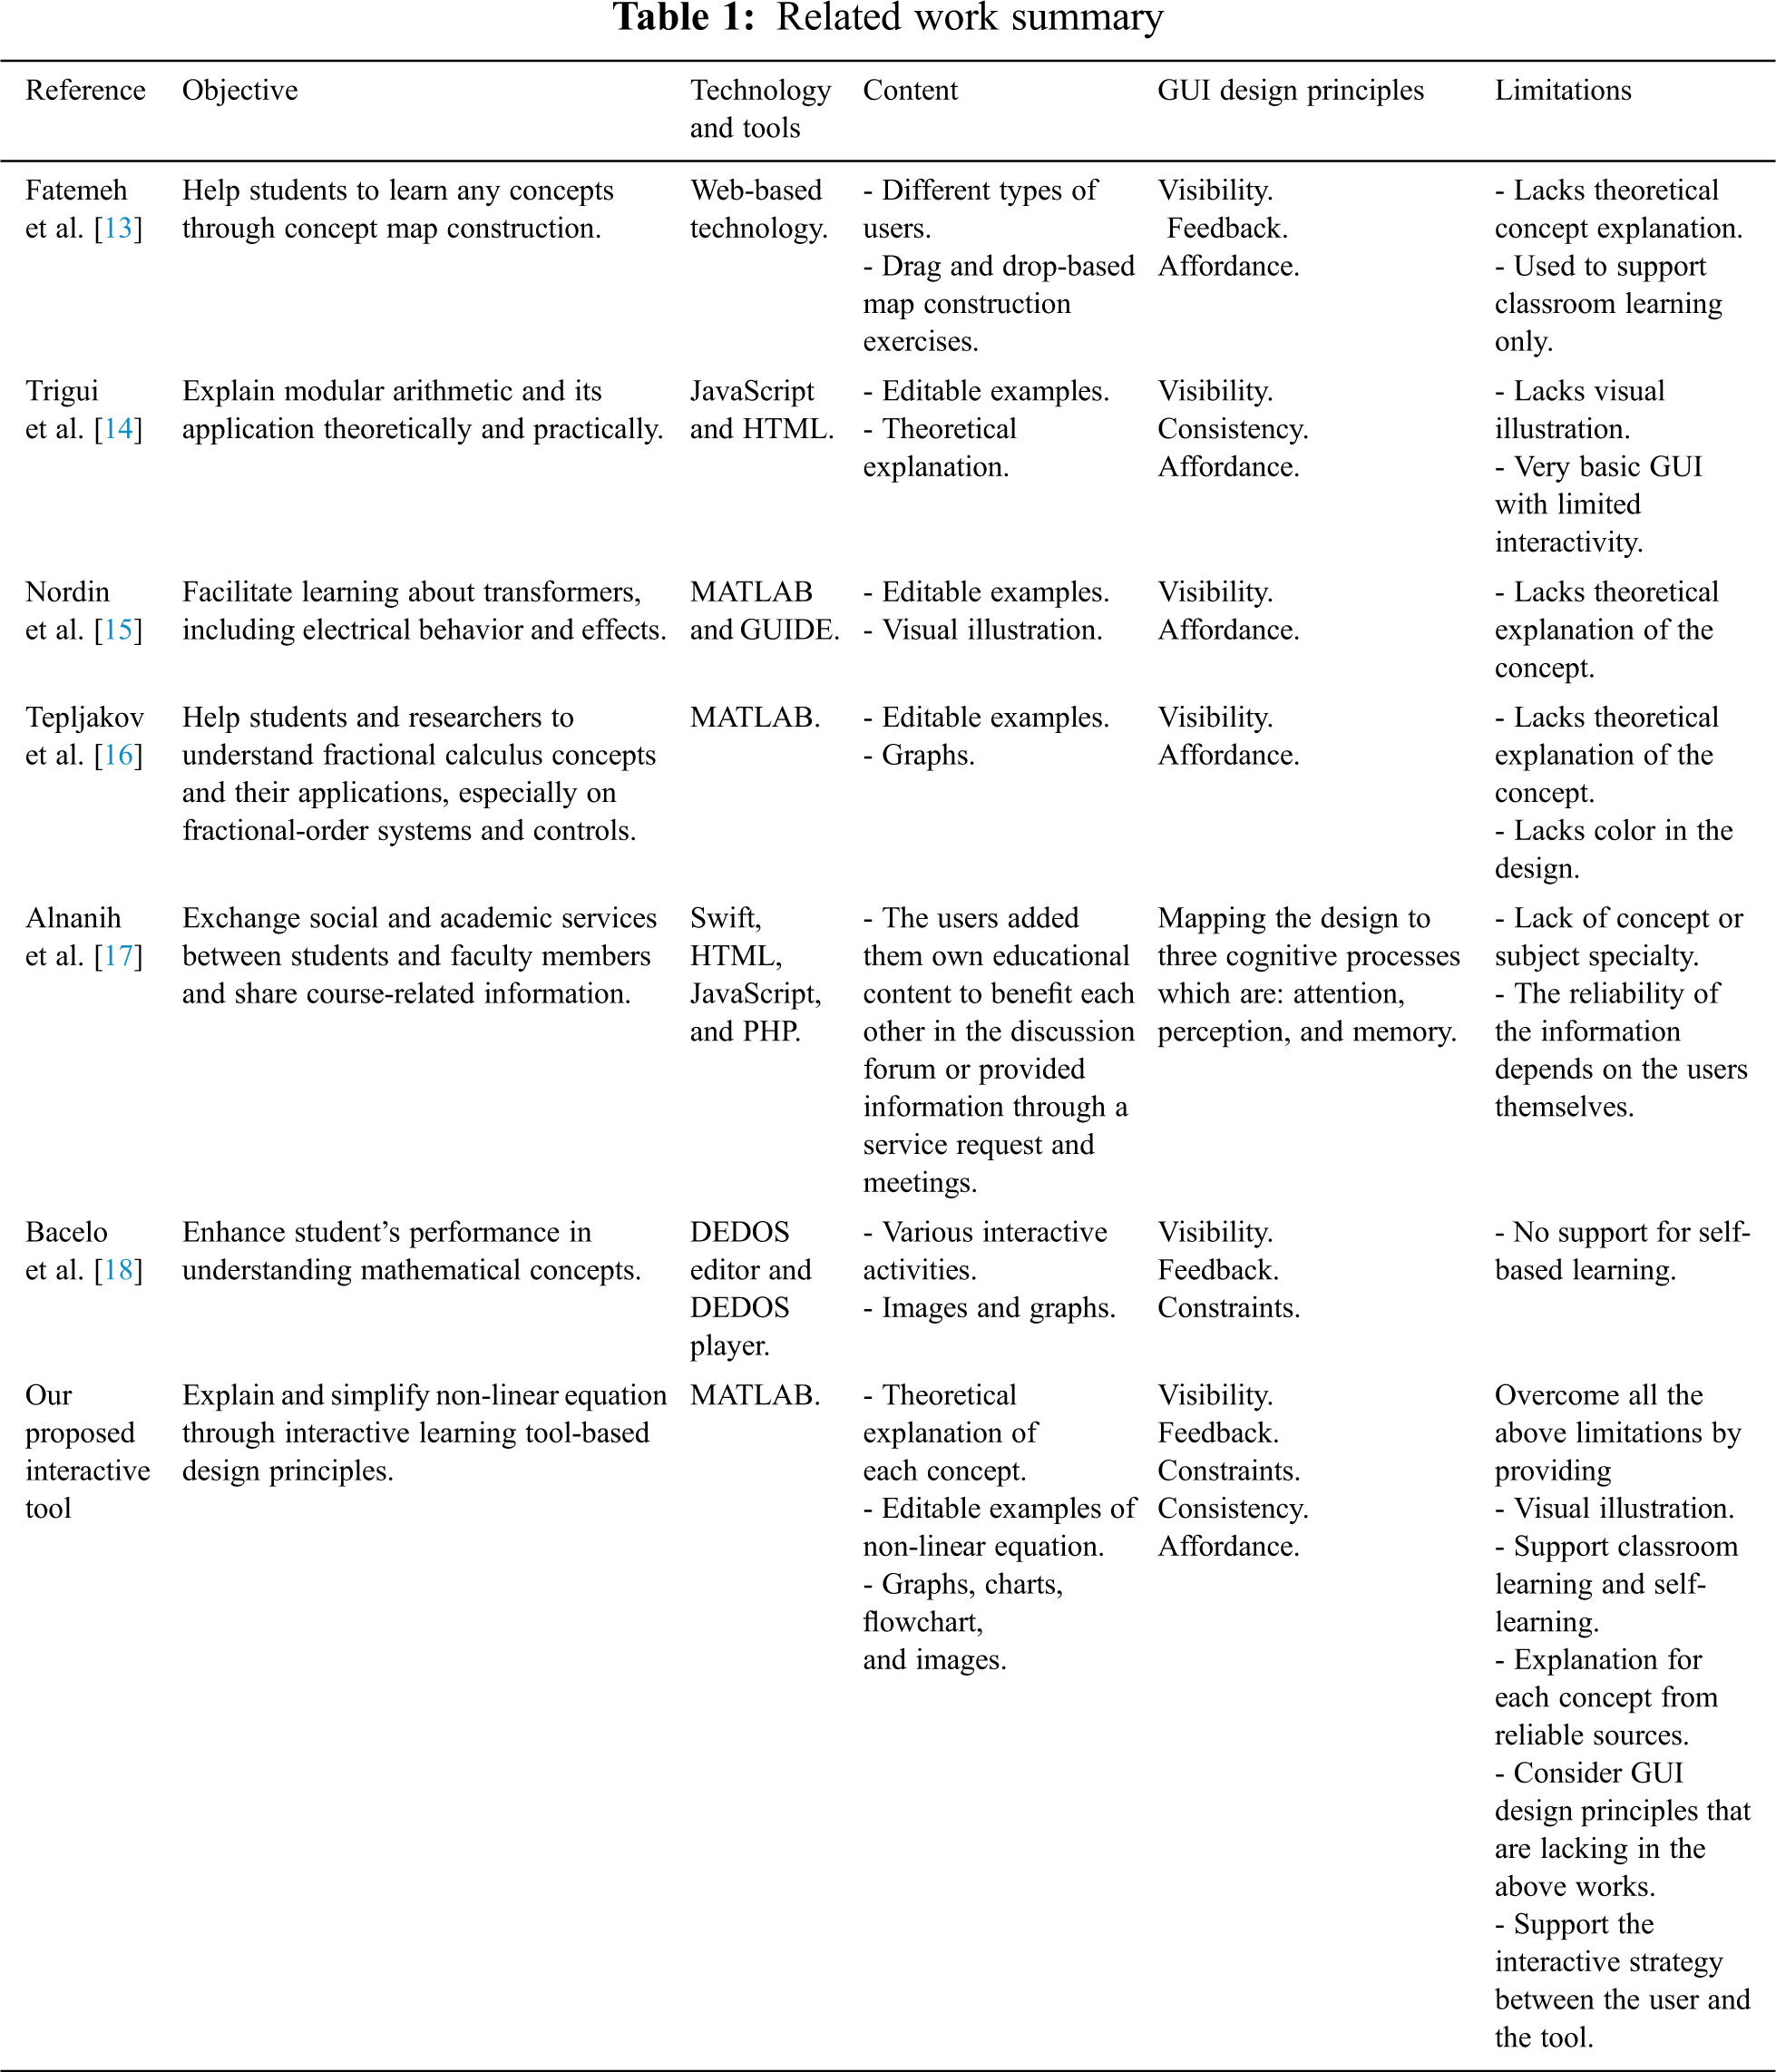
Fatemeh et al. [13] designed and implemented a computer-based interactive learning tool that helps students learn concepts through concept map construction. The tool has three types of users: admin, student, and teacher. The admin can add and delete users and concept maps. The teacher constructs a full concept map as a reference for the tool to check the students’ work. A student is asked to build the map by dragging and dropping, and by linking phrases. His actions and work are checked simultaneously, while the teacher receives a report about the students’ mistakes to clarify the related concepts. In fact, the tool has a high level of interactivity by manipulating the maps and the immediate feedback. However, it lacks a theoretical explanation and is only used the in classroom.
Trigui et al. [14] presented an interactive learning tool in the domain of mathematics learning. The objective of their tool was to show the main application of modular arithmetic in a brief interactive environment. The tool is an HTML and JavaScript-based learning tool. It contains several theoretical and practical sections related to modular arithmetic, including integers, divisibility, modular arithmetic, and Euler. Also, they include applications of modular arithmetic with a focus on cryptography. Each section contains a brief explanation, some related examples, and functions. Moreover, the application provides several functions that aim to provide more interactivity to the user. For instance, the sieve of Eratosthenes checks if a user’s input number is a prime number, and factorization finds the decomposition of a positive integer number entered by the user. The Euclidean algorithm finds the greatest common divisor of two integers entered by the user, along with the solution steps and the modular arithmetic calculator section. Even though the learning tools include rich content, it has quite a basic GUI with limited interactivity and lacks visual illustration. It involves a text area to user input and a button to show the result in another text area.
Nordin et al. [15], the authors proposed an interactive learning tool designed for electrical engineering students to enhance their interest in and understanding of transformers. The goal of this tool is to facilitate learning about transformer electrical behavior and observing the effect of parameter variation. The tool is designed using MATLAB and GUIDE. It is a button-based program that contains three sections: transformer performance, open circuit test, and short circuit test. Each section has its own interface, and with each interface the user can manipulate parameters to calculate results and display related plots. However, it lacks a theoretical explanation of the concept. The tool was tested by twenty electrical engineering students, and their positive feedback shows that this tool is quite useful for teaching the specified concept.
Tepljakov et al. [16] proposed a MATLAB-based teaching tool for fractional-order systems and controls. The goal of their study was to build a simple and effective teaching tool to help researchers and students understand the concepts of fractional calculus and its applications, especially for FOS and control design. The tool can be used in the classroom and in self-learning. However, it lacks any theoretical explanation of the concept and colors in the design.
Alnanih et al. [17] developed a mobile application that allows students and faculty members to exchange social and academic services and share course-related information. The authors adopted an agile methodology called Mobile-D to develop the app. Also, they used the persona as data collection to develop a better understanding of the target user. The authors carried out usability testing and used specific human-computer interaction principles to achieve a better user experience. The disadvantage of this application is that the reliability of the information depends on the users themselves and it contains general topics, rather than being specialized in a specific field.
Bacelo et al. [18] designed two interactive learning experiences for learning mathematical concepts in primary schools. They applied different protocols in each one: the turn-taking protocol and the consensus protocol. The interactive tool used in both experiences was the DEDOS-Player multi-touch surface, which was used along with designed educational projects. It involves different interactive activities, such as multiple-choice activities, pair-matching activities, and additional activities that use DEDOS-Editor. Although each experiment includes variant activities that promote knowledge acquisition during daily student classes, it is not designed to be used for self-based learning. It is only used in conjunction with school classes. The results of both experiments showed that the students highly enjoyed learning using this technology. The students gained good learning results as well as many other skills such as collaboration, communication, and teamwork.
In general, we can conclude that interactive learning tools target complex and challenging topics. Teachers often face problems in explaining mathematics and engineering concepts to students [19]. Adopting interactive tools supports the learning process by making the information clear, creative, and enjoyable.
Tab. 1 summarizes the most prominent differences between the work mentioned above and our proposed tool in terms of objective, technology, content, design principles, and limitations.
3 Designing and Developing Design Principles-Based Tool
This section is divided into two parts. First, it describes the main design of the tool interface, which is designed with consideration for the separation of concern that related to the design principles to the software [20]. In addition to presenting a list of design principles that have been considered in designing the tool’s interfaces. Second, it describes the implementation of the five methods for solving nonlinear equations with a flowchart and interfaces.
3.1 The Proposed Design Principles-Based Interactive Tool
Our proposed tool-based design principles [21] that 1) help the user to learn the five methods for solving nonlinear equations, 2) explain the algorithms in steps and show every step in detail in the panel, labels, tables, and graphic illustrations.
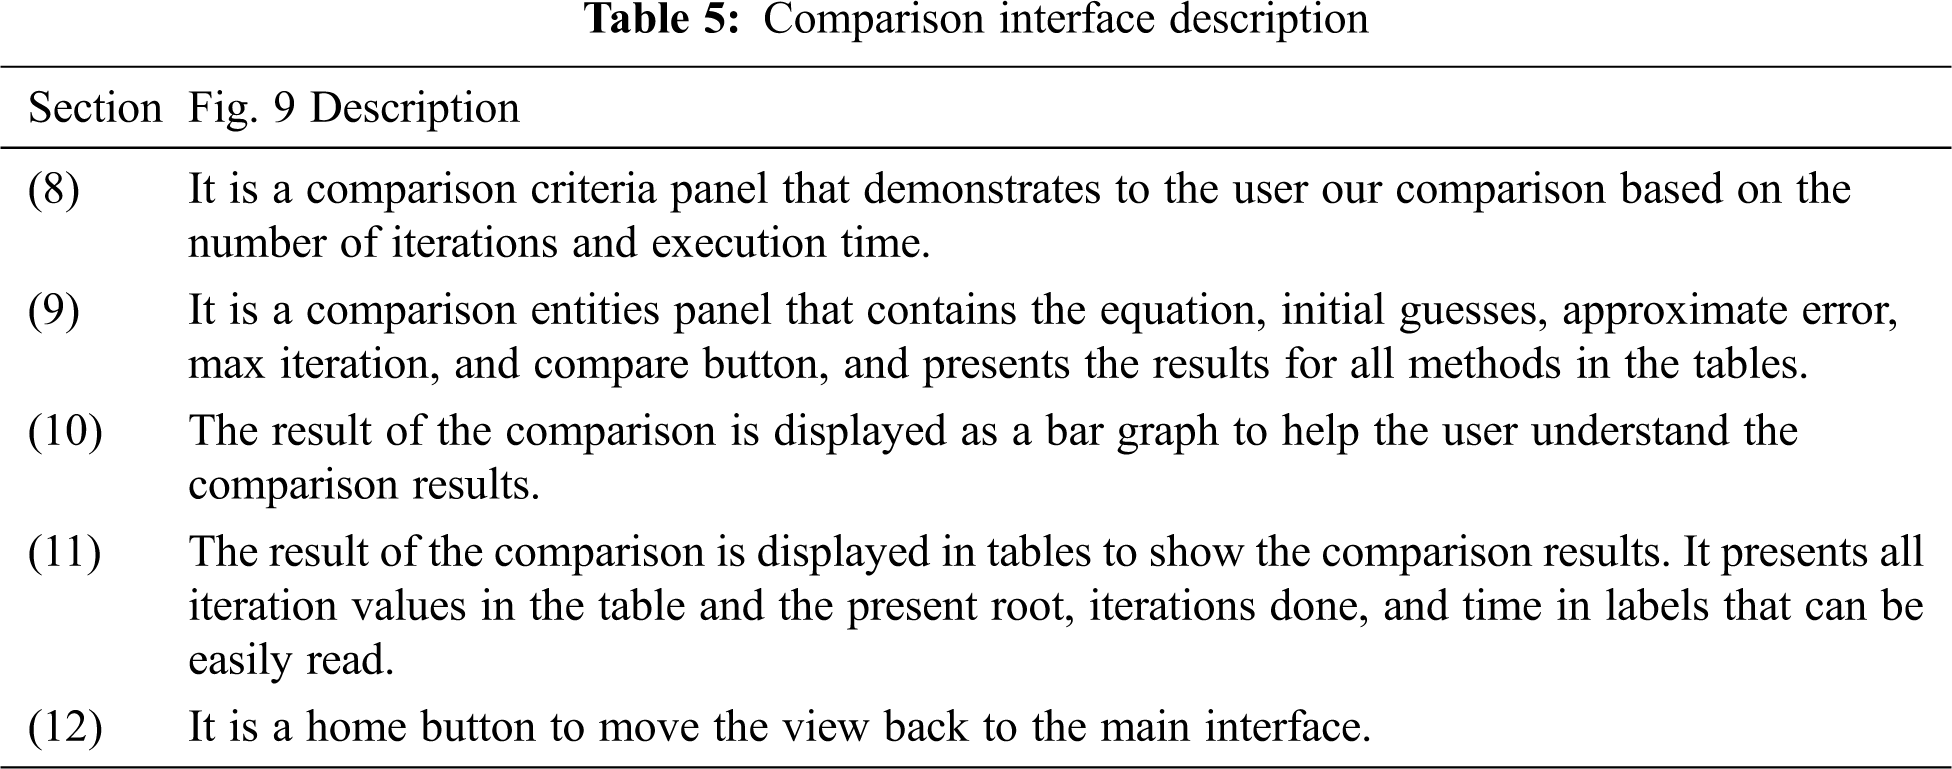
Our tool’s main interface contains two panels: one for solving nonlinear equations and one for comparing the methods, as shown in Fig. 1. Tab. 2 describes the interface in Fig. 1.
The objective for the design and development of the tool is to learn difficult concepts easily and interactively. The tool was created by learning through practice rather than following instructions. Each task requires one to two clicks to achieve. Buttons can be enabled and disabled to restricts users and guide them, as we can see when we compare the buttons in Section 6, Fig. 4 with the buttons in Section 7 in the same figure. With each iteration, the value of the root is linked to the plot of the function and the current value of the root. This linking simplifies the concept of convergence for users and visualizes it [22].
Tab. 3 shows the design principles that are applied in our tool and are referenced to [22].
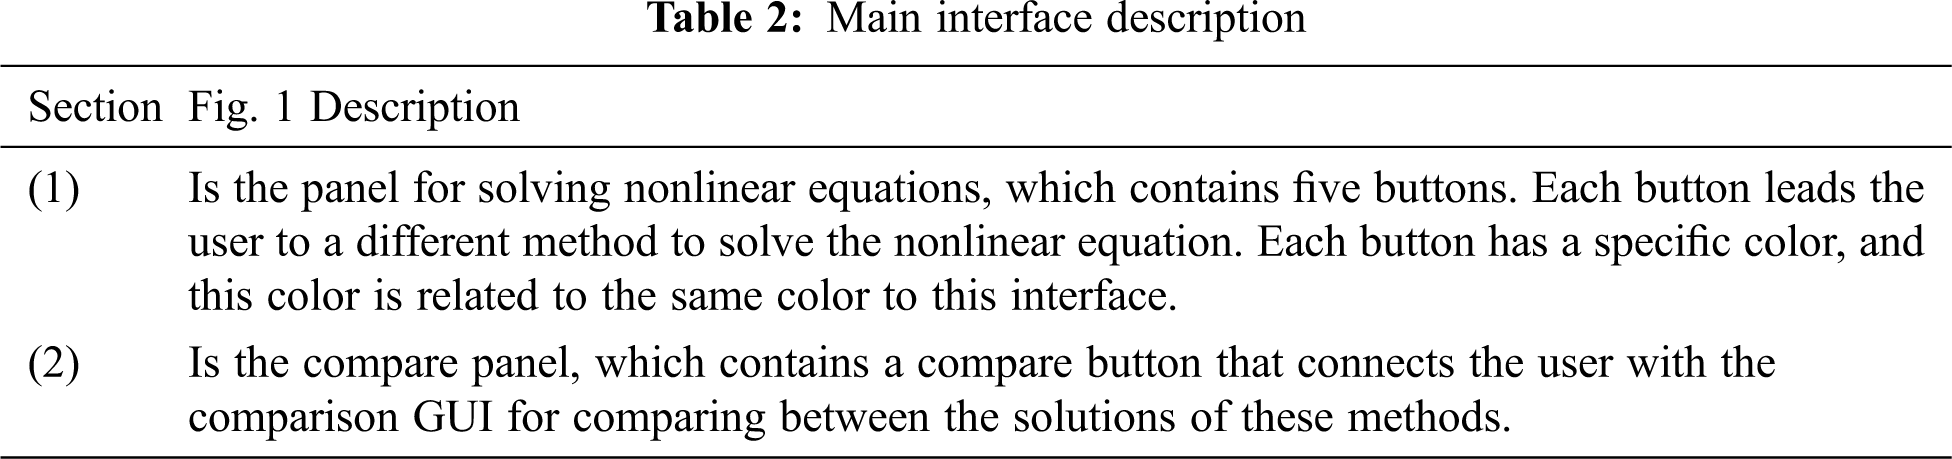
Figure 1: Main interface
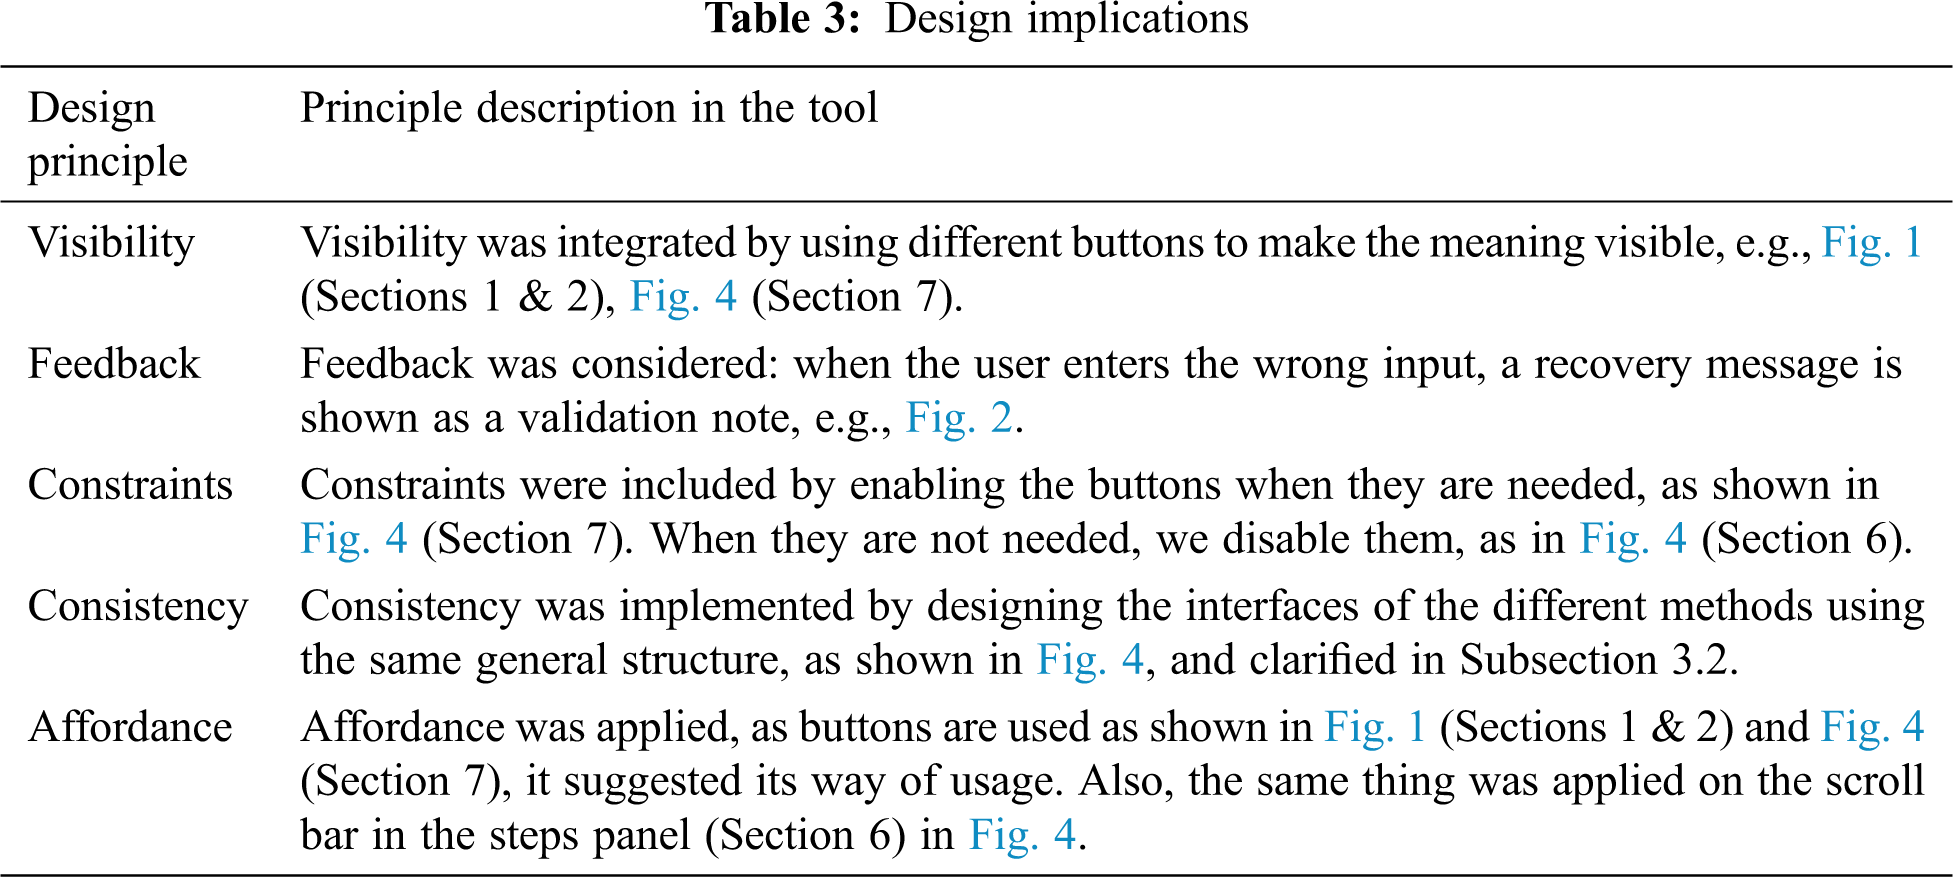
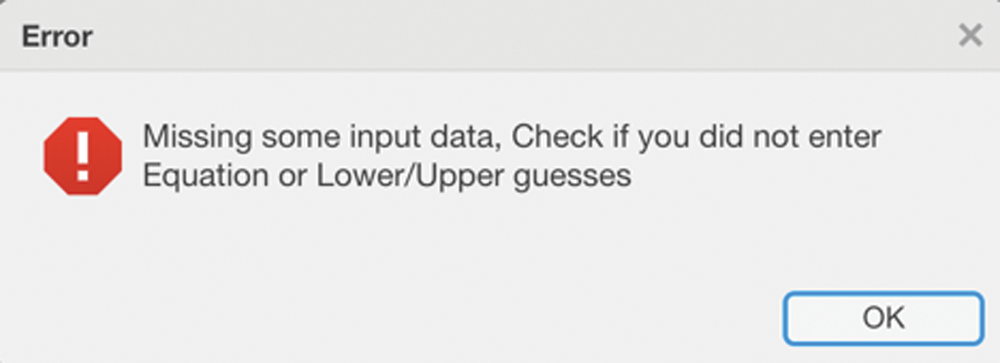
Figure 2: Sample of the validation messages
3.2 Nonlinear Equation Methods Interfaces
This section describes the flowchart and interfaces of the tool that was implemented for the five methods for solving nonlinear equations. This section also describes the comparison interface, which compares the methods using several measures, such as the time required to complete each method and the number of iterations required to find the final solution. The tool was implemented on a Mojave i5 Intel Core computer running macOS using MATLAB ver. 9.7.0.1261785 (R2019b), 64-bit. Fig. 4 shows the interface of the bisection method. Because the methods interfaces have the same structure, we consider the bisection interface as an example. As a result, we omit the description of the other method interfaces.
The bisection method is used to find the roots of a polynomial equation. It splits and subdivides the interval in which the root of the equation exists. The principle behind this method is the intermediate theorem for continuous functions. It works by narrowing the gap between the positive and negative intervals until it closes in on the correct answer. This method narrows the gap by taking the average of the positive and negative intervals. It is simple, although it is relatively slow [10].
Fig. 3 [23] shows the flowchart of the bisection method and the steps as follows: 1) Defining two variables
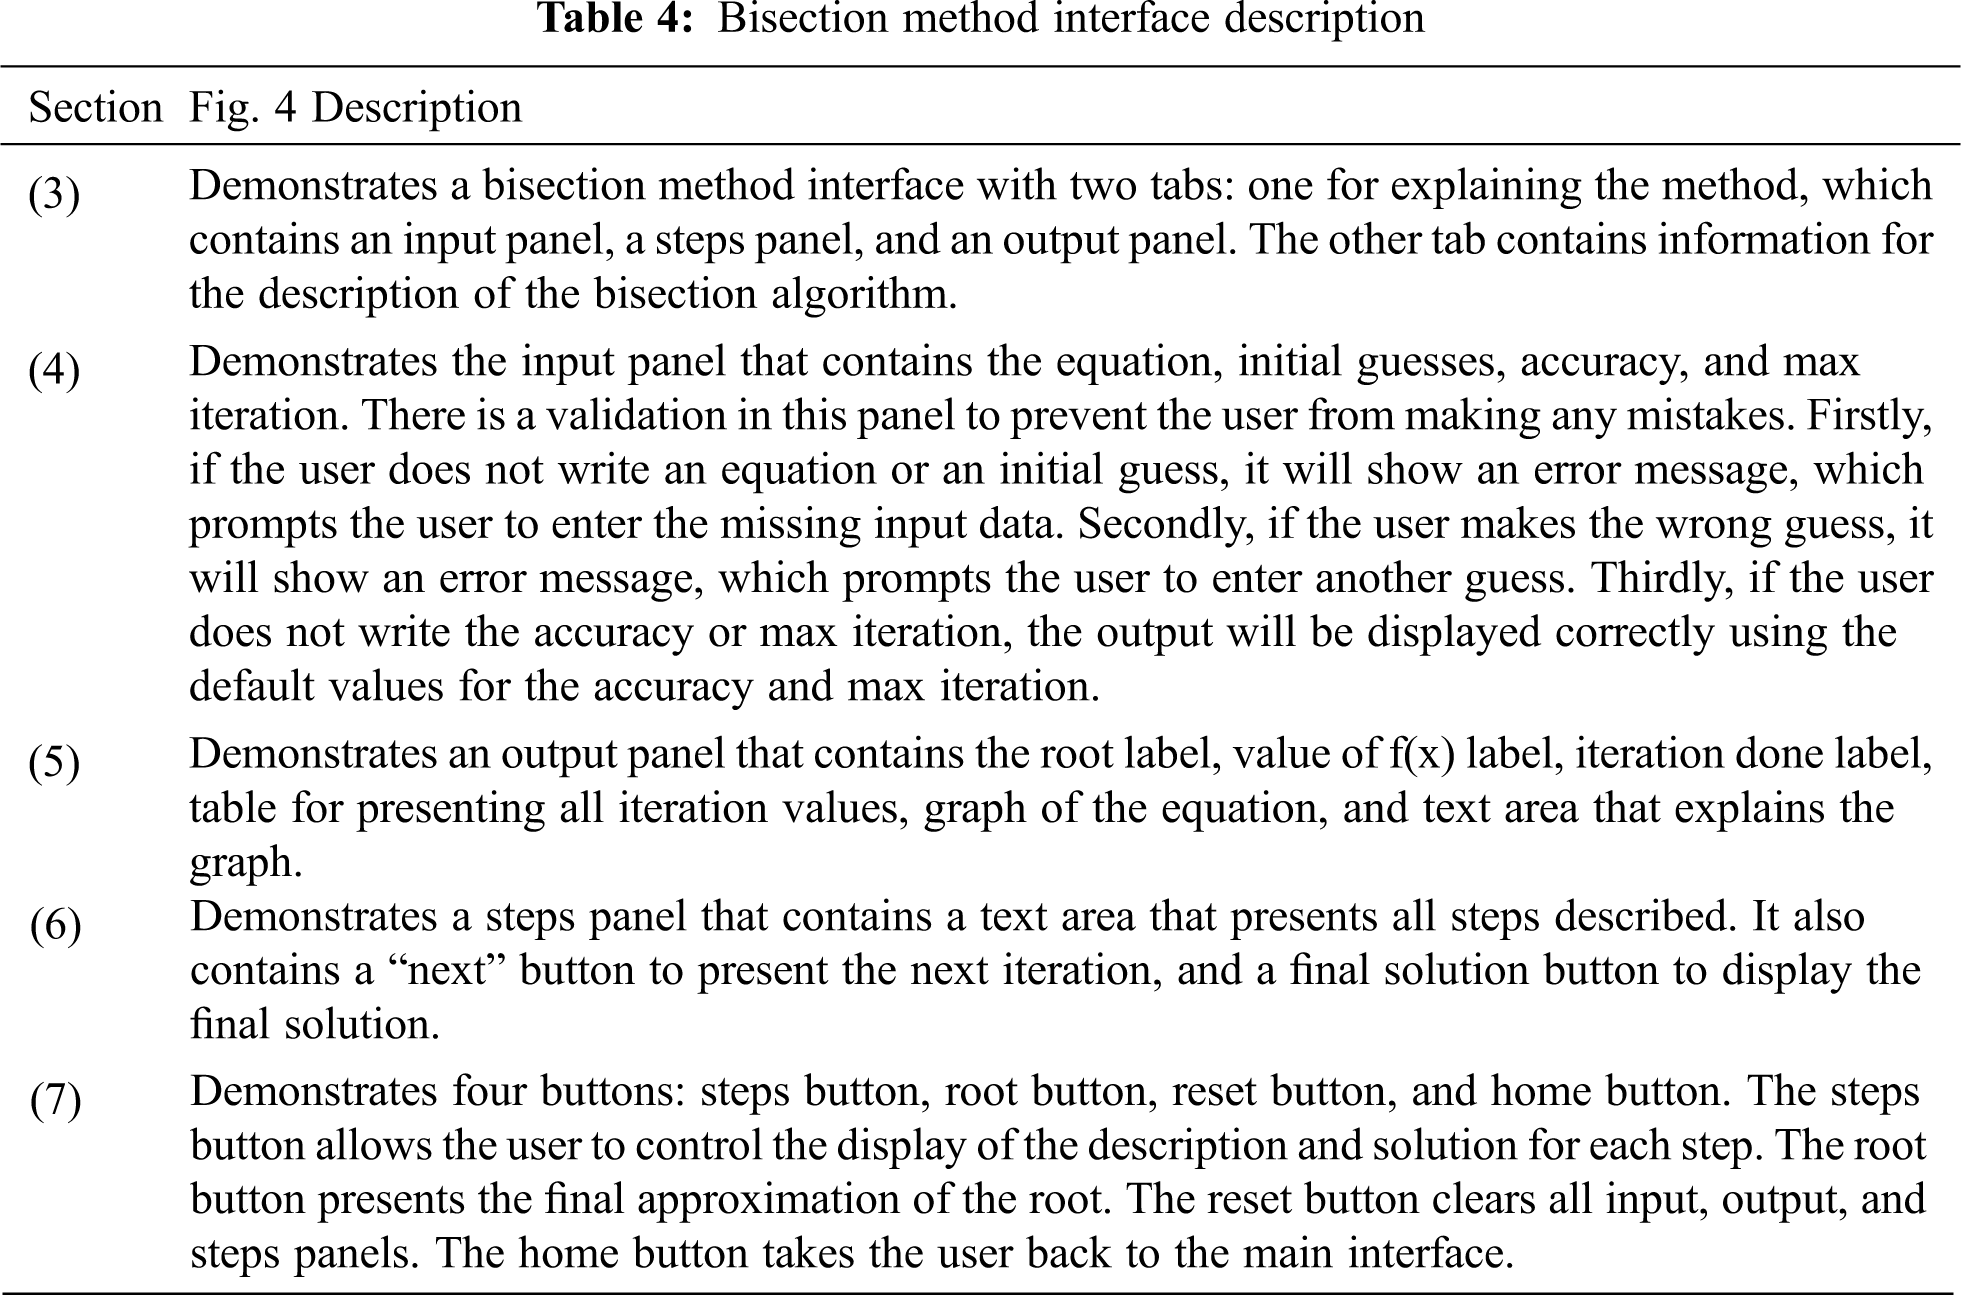
Tab. 4 describes the interface of the bisection method as shown in Fig. 4. The interface supports the help features by providing a description of the algorithm.
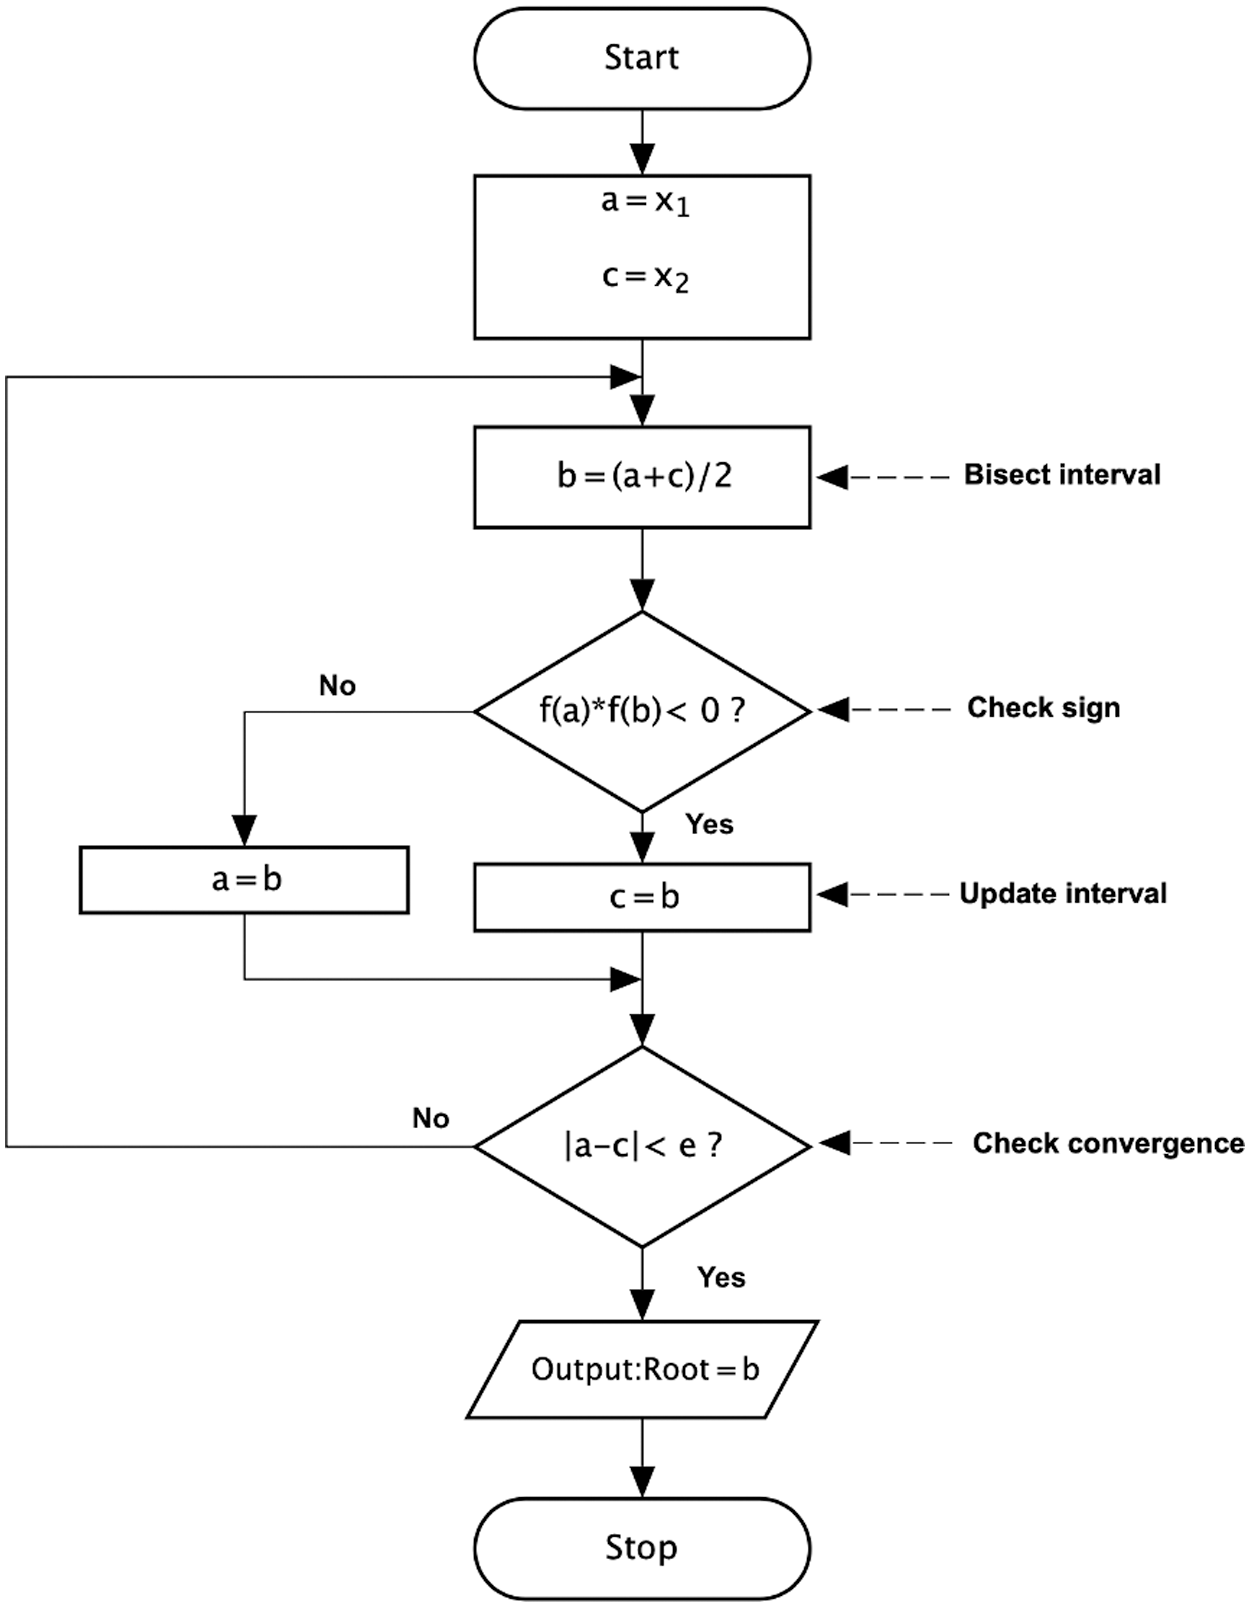
Figure 3: Flowchart of Bisection method [23]
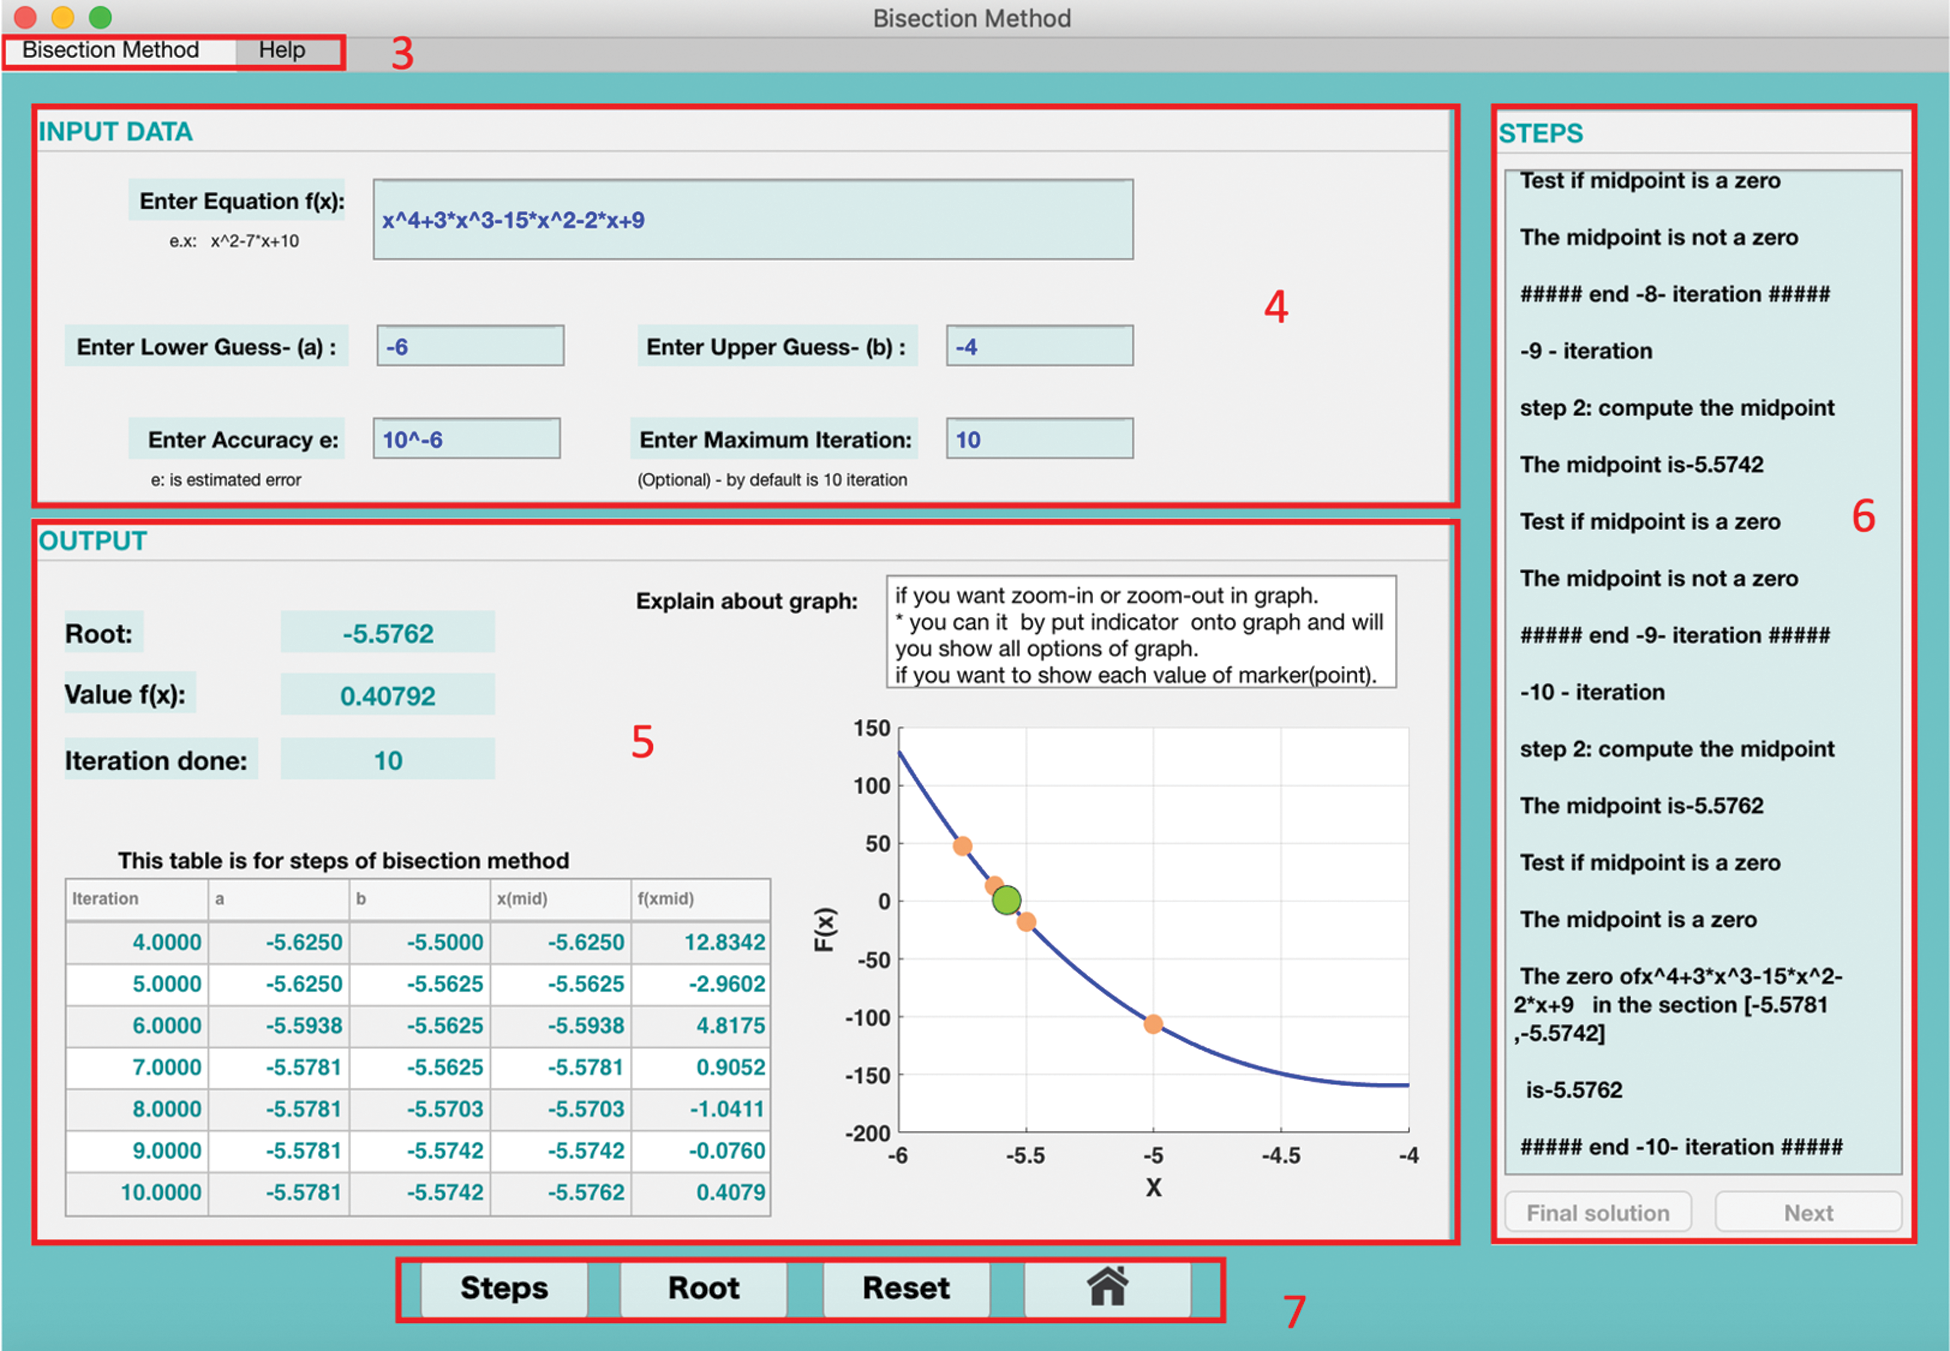
Figure 4: Bisection method interface
This method begins with a single estimated initial guess. It then takes the intersection of the tangent with the x-axis as the next approximation of the root. This method repeats this until either the value of the function or the approximated error is near zero [11].
The steps of Newton’s method as follows: 1) Begins with defining the function
The secant method is a root-finding algorithm that uses a succession of roots of secant lines to better approximate the root of a function
The steps of the secant method as follows: 1) Defines the function
This method is hybrid method of the bisection method and the Newton–Raphson method. It takes a first approximation by applying the bisection method twice, and it completes the correct approximation by using the Newton–Raphson method [6].
The steps of the hybrid method as follows: 1) Requires the given function
The improved hybrid method is a method for solving nonlinear equations. It is an improvement of the hybrid method. The improved hybrid method combines the bisection method with Newton’s method, and it is “suitable for functions which are not applicable to the hybrid method” [12].
The steps of improved hybrid method as follows: 1) Defines the function
The comparison interface in our program compares the solutions of these five methods in terms of the number of iterations and execution time with bar graphs and tables, as shown in Fig. 5. Tab. 5 describes the elements in the comparison interface, as shown in Fig. 5.
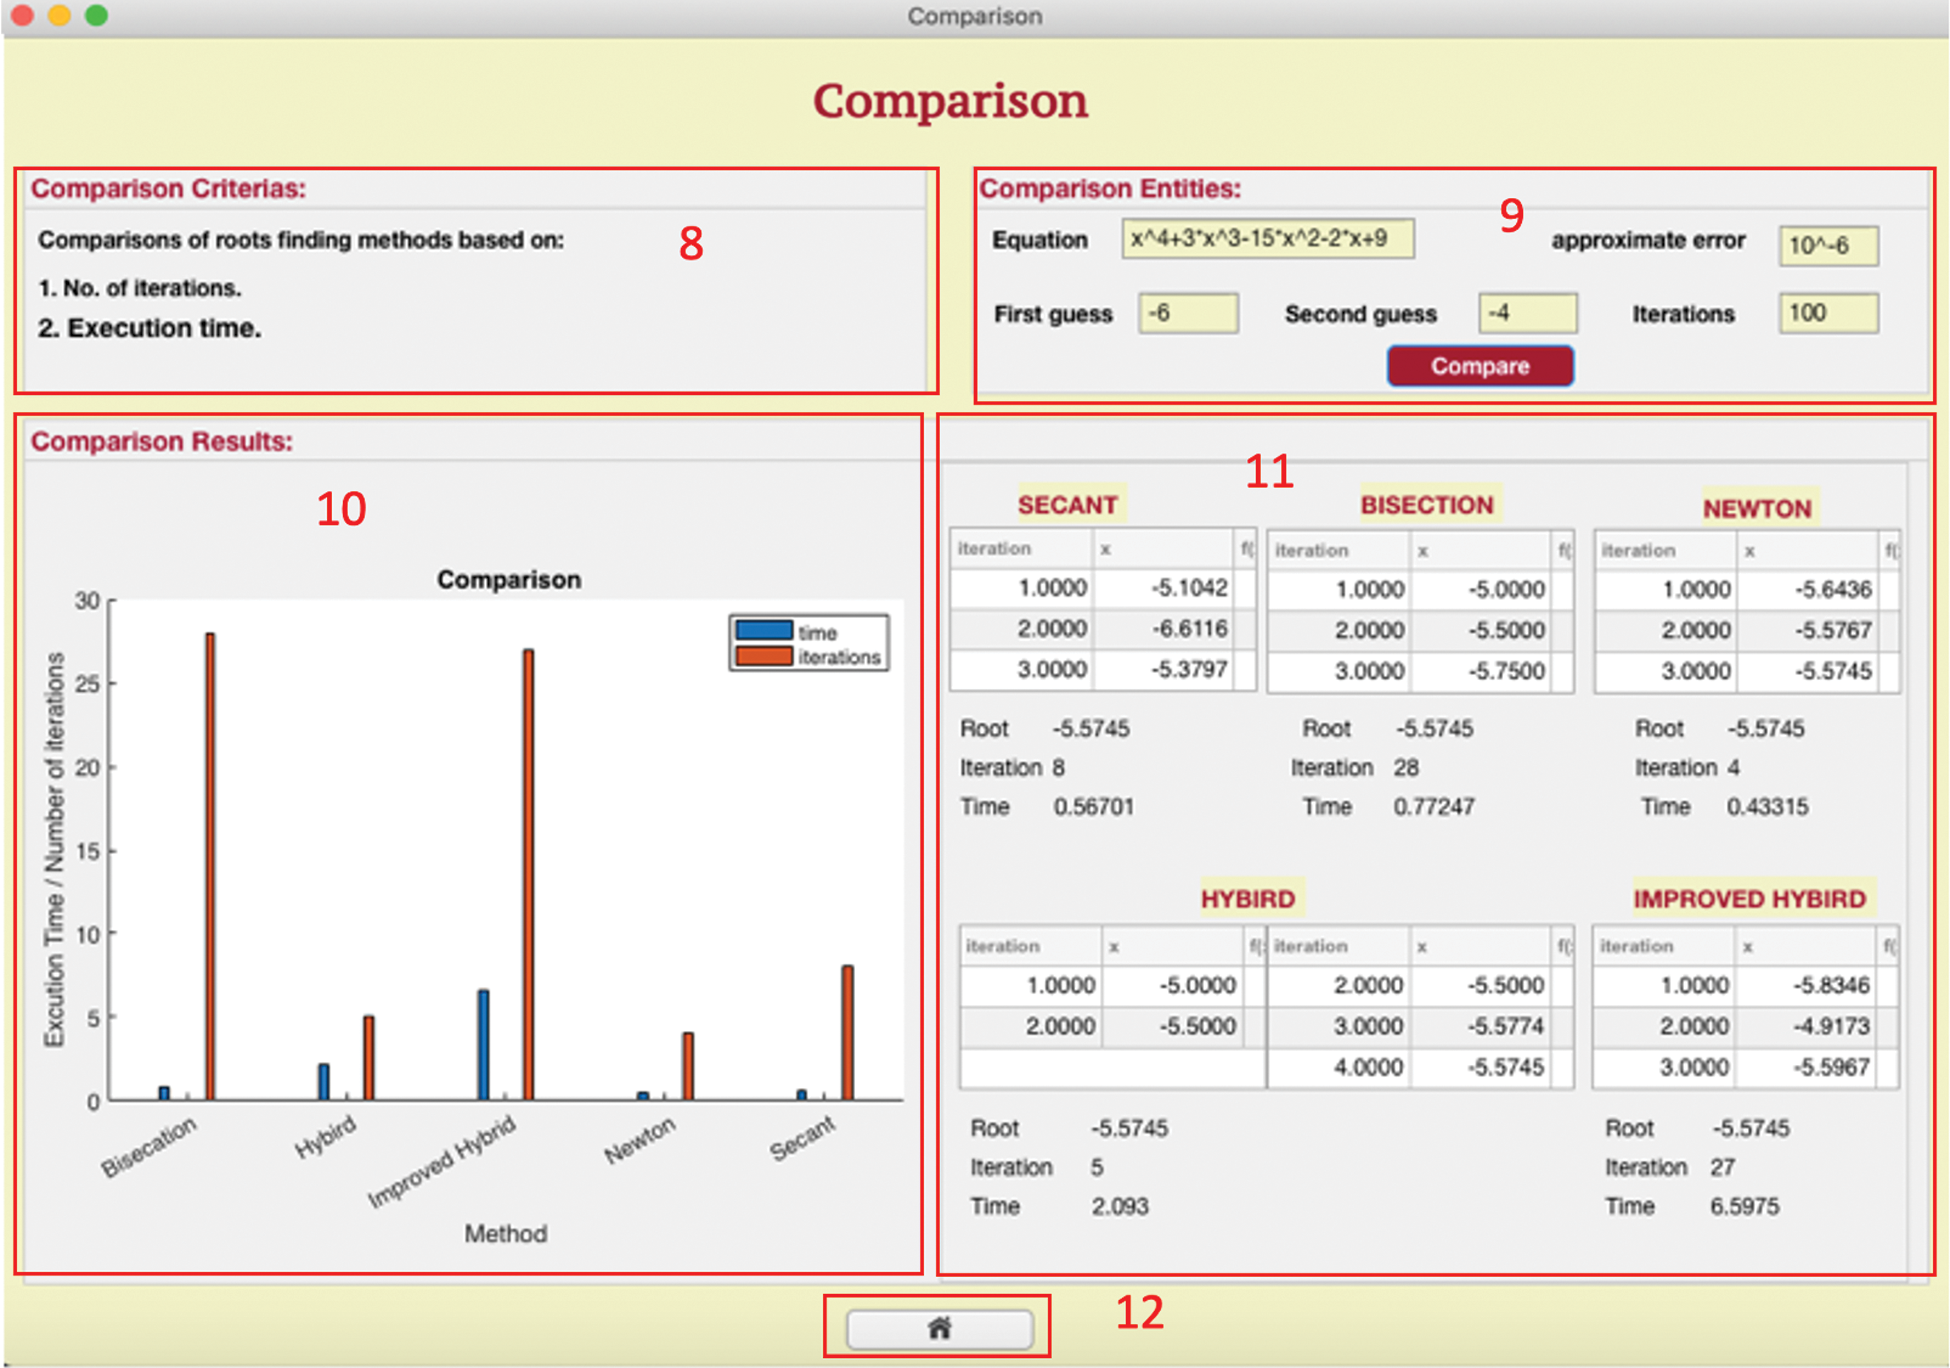
Figure 5: Comparison interface
Usability testing is used to improve product usability by involving real users in the test [24]. To evaluate the tool’s influence, the development team designed and conducted an experiment using observation of the participants, recording the users’ comments, and distributing questionnaires to capture their opinion of using the proposed tool. The results of the usability testing were analyzed and summarized. The testing covered both objective and subjective measures. Objective measures are also known as performance measures, and can be taken using different aspects, such as the time required to complete a specific task [25]. The subjective measures can be defined as measures of the users’ expectations and their perception toward a specific product [26]. In [27], objective measures were defined as measuring the ability of a user to perform a specific number of tasks in an environment that is controlled. However, the subjective measures are measure by asking the user about his personal opinion of the experience. Generally, we can recap by saying the following: objective measure concern user performance. The measurement is done by measuring certain attributes, such as the time required to complete the task, the number of correct actions, and the number of incorrect actions. Subjective measures concern asking a set of questions in the post-test questionnaire. However, the pre-test questionnaire reflects the users profile, whereas the post-test reflects their knowledge toward using the root-finding tool, and their level of satisfaction with using the tool.
Participation in this experiment involved two types of users, novice and experienced, to enable us to obtain different opinions and feedback from using the tool. In this study, our participants consisted of 10 users, mainly from the faculty of computing and information technology, at King Abdulaziz University. The ten participants were divided into two groups. Five participants who had enough knowledge of the root-finding concept were considered as Group1: Expert. The other participants, who did not have any previous experience or knowledge using the root-finding concept, were considered Group2: Novice.
Before the usability testing was conducted, a preliminary study with a pilot test was done by three expert users from technical and knowledge perspectives, who were different from the participants in Group 1. The pilot test helped the researcher to test the approach and evaluate the feasibility, time, and performance measures of the study. The average time of each task for all three users was recorded, as shown in Tab. 6. Accordingly, the comparison results are specified as excellent—equal to or below the expert results, acceptable, and unacceptable, as shown in Tabs. 7 and 8.


Furthermore, all feedback and comments obtained from the pilot test were considered in the design and applied (more information about feedback in Section 5).
Participants were informed of the purpose of the study, and then they were given a consent form before the experimental test was started. All the participants were asked to complete the following steps:
1. Fill in the pre-test questionnaire that defined their profile. The user profile questionnaire comprised three parts: general information, computer experience, and interactive learning tool experience.
2. Complete a list of three tasks, as shown in Tab. 9.
3. Fill in the post-test questionnaire to evaluate the tasks using the tool and to determine their level of satisfaction.
4.3.1 Pretest Questionnaire Result
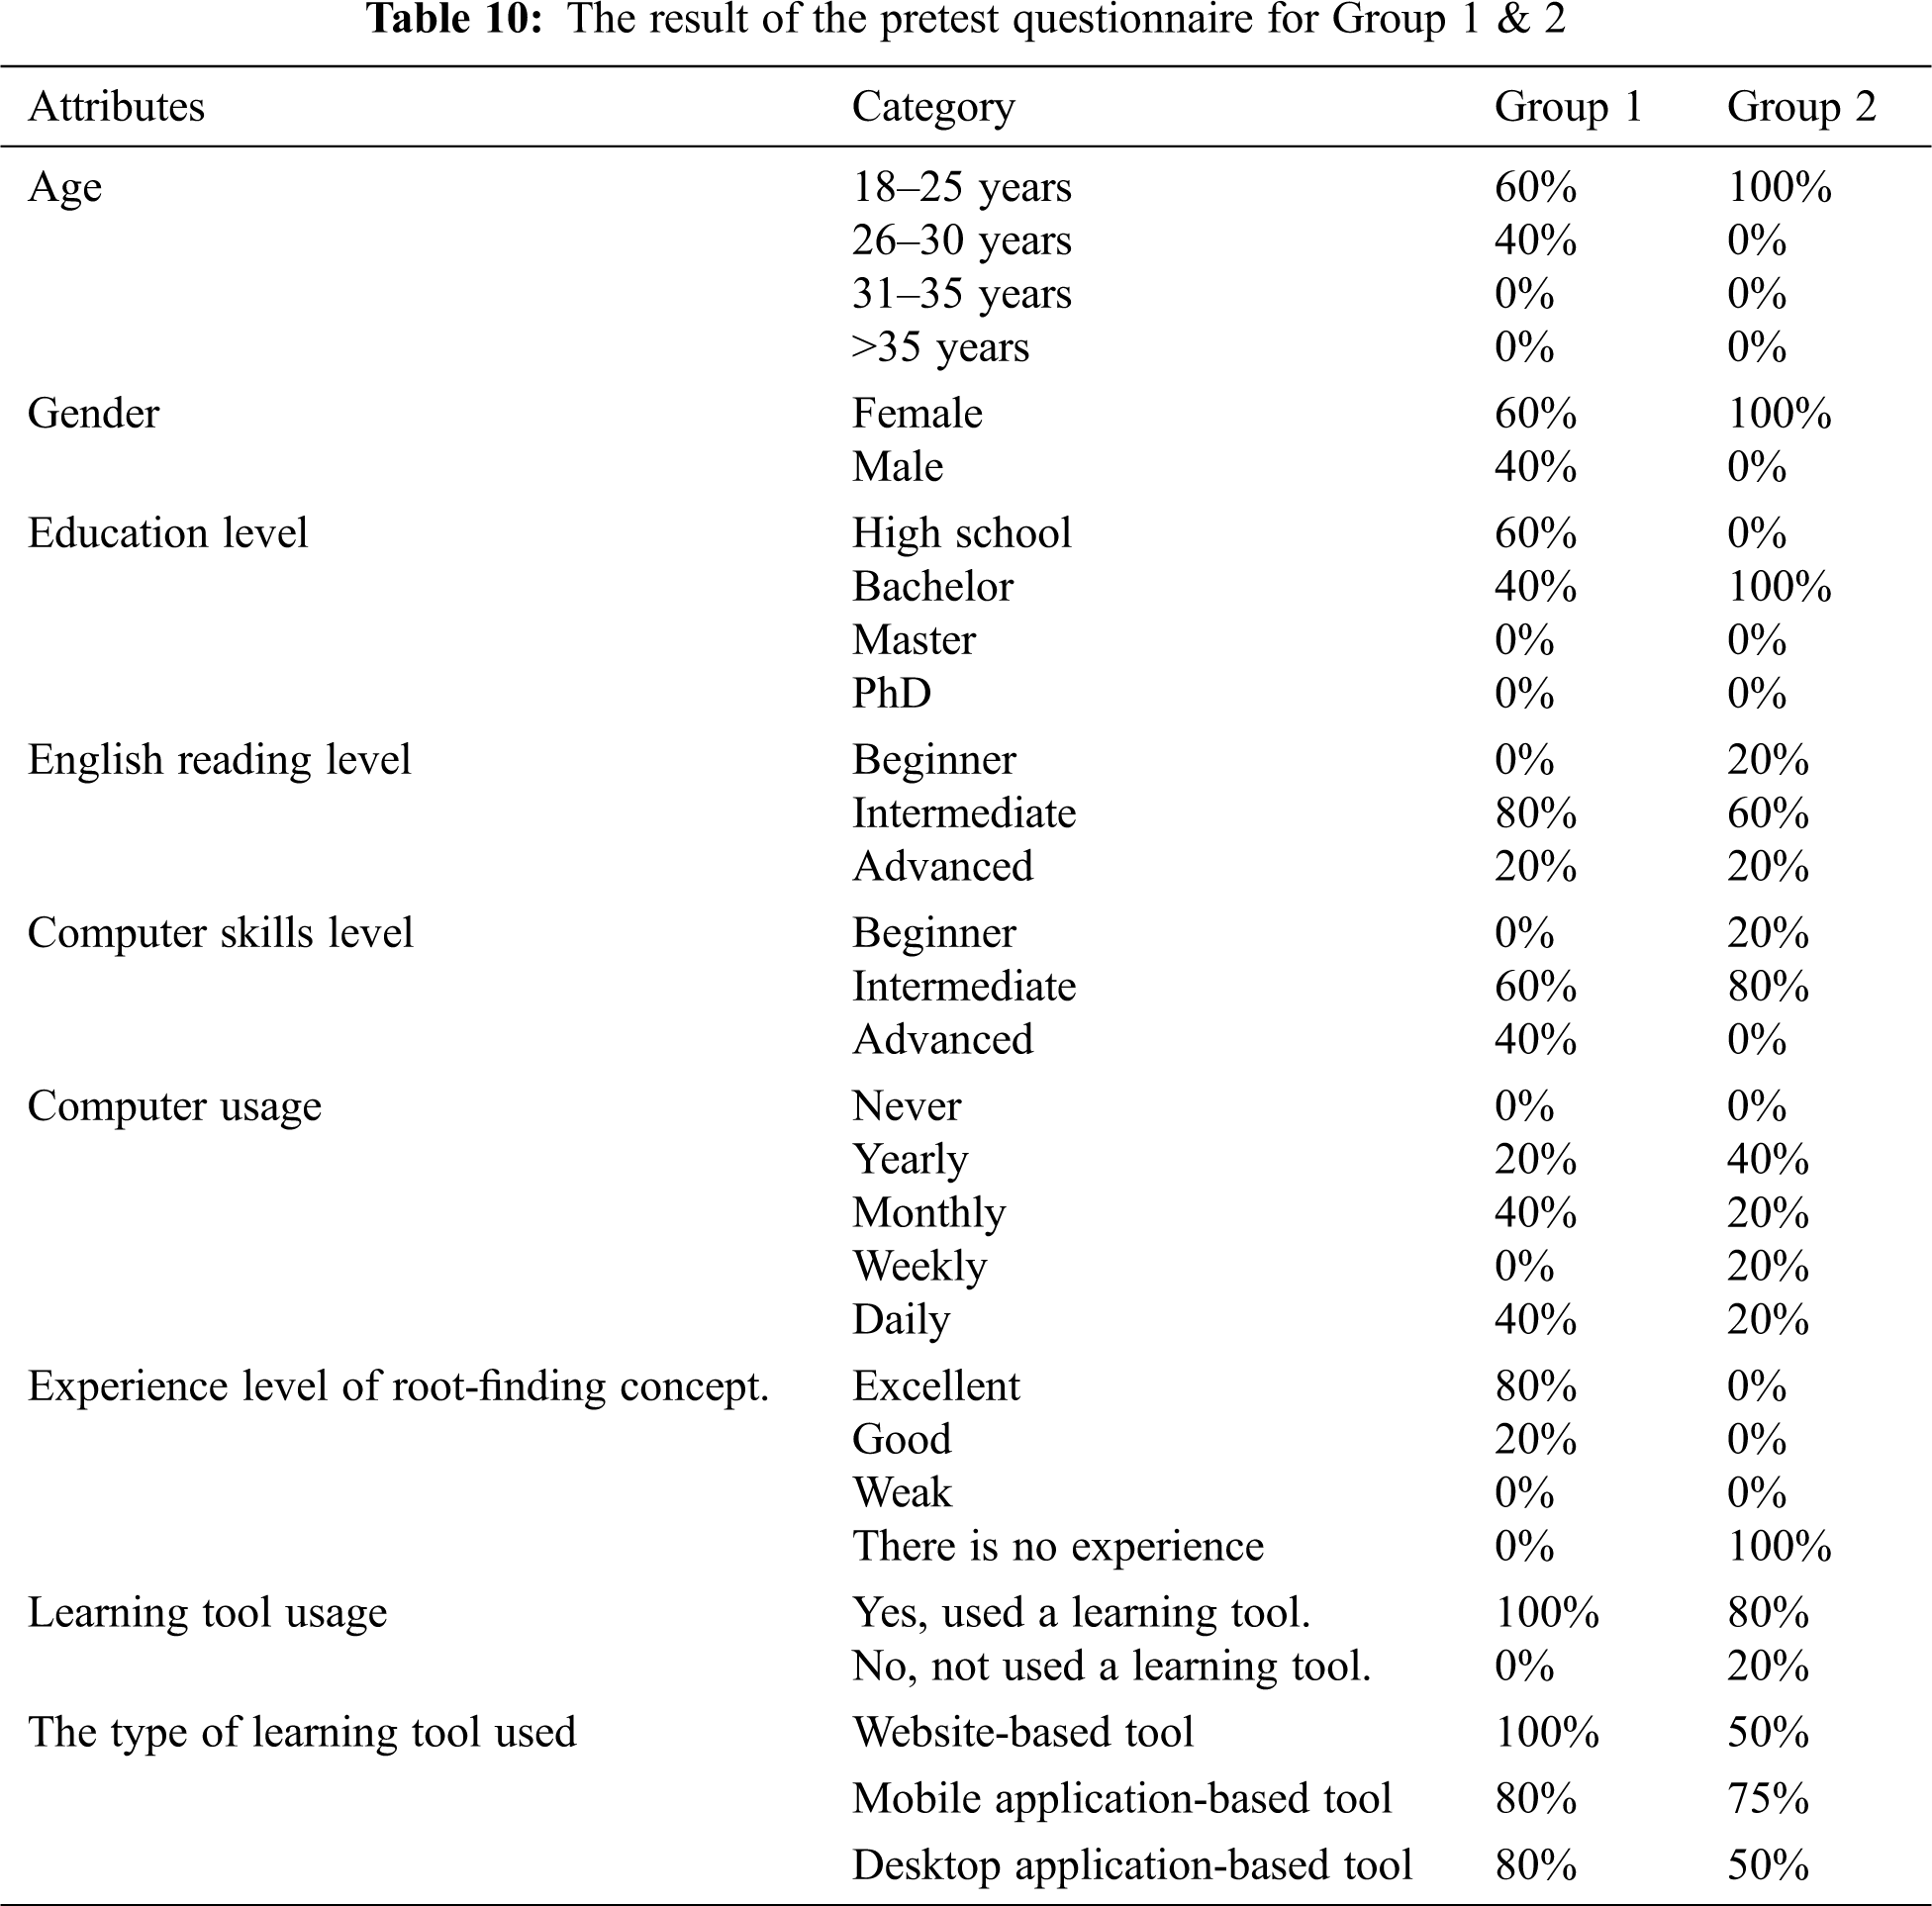
The result of the pre-test questionnaire for Group 1 (Expert) is shown in Tab. 10. The results are as follows: 60% are between the ages of 18 and 25 years, while the remaining are between 26 and 30; 60% are female and 40% are male; 60% of the users completed high school as the highest education, while 40% have a bachelor’s degree. Most of the users are at an intermediate level of English reading (specified by 80%) while 20% are at an advanced level. In terms of computer skills, 60% are at the intermediate level, while 40% are at an advanced level. On a Likert scale [28] containing questions with 5 levels, labeled as 5: daily and 1: never, the users were asked to specify the frequency of their computer usage. 40% chose daily, 40% chose monthly, and 20% chose yearly. Most of the users have experience with the root-finding concept. All users have experience with an interactive learning tool. All users have used a website-based tool, and 80% of them have used both desktop and mobile application-based tools.
For Group 2 (Novice), Tab. 10 shows the results of the questionnaire. The results are as follows: all of the users are between the ages of 18 and 25 years. All of the users are female. All of the users are students with a bachelor’s degree. Most of the users are at an intermediate level in English reading, which was reported by 60% of respondents, while 20% are at the beginner level and 20% at the advanced level. With respect to computer skills level, 80% are at the intermediate level and 20% are at the beginner level.
In response to a Likert scale question about the frequency of their computer usage, 20% chose daily, 20% chose weekly, 20% chose monthly, while 40% chose yearly. None of the users have experience with the root-finding concept. All users except one have experience with an interactive learning tool. 50% of the users have used a website-based tool, 75% of them have used a mobile application-based tool, and 50% of the users have used a desktop application-based tool.

4.3.2 Performance Measurement Result
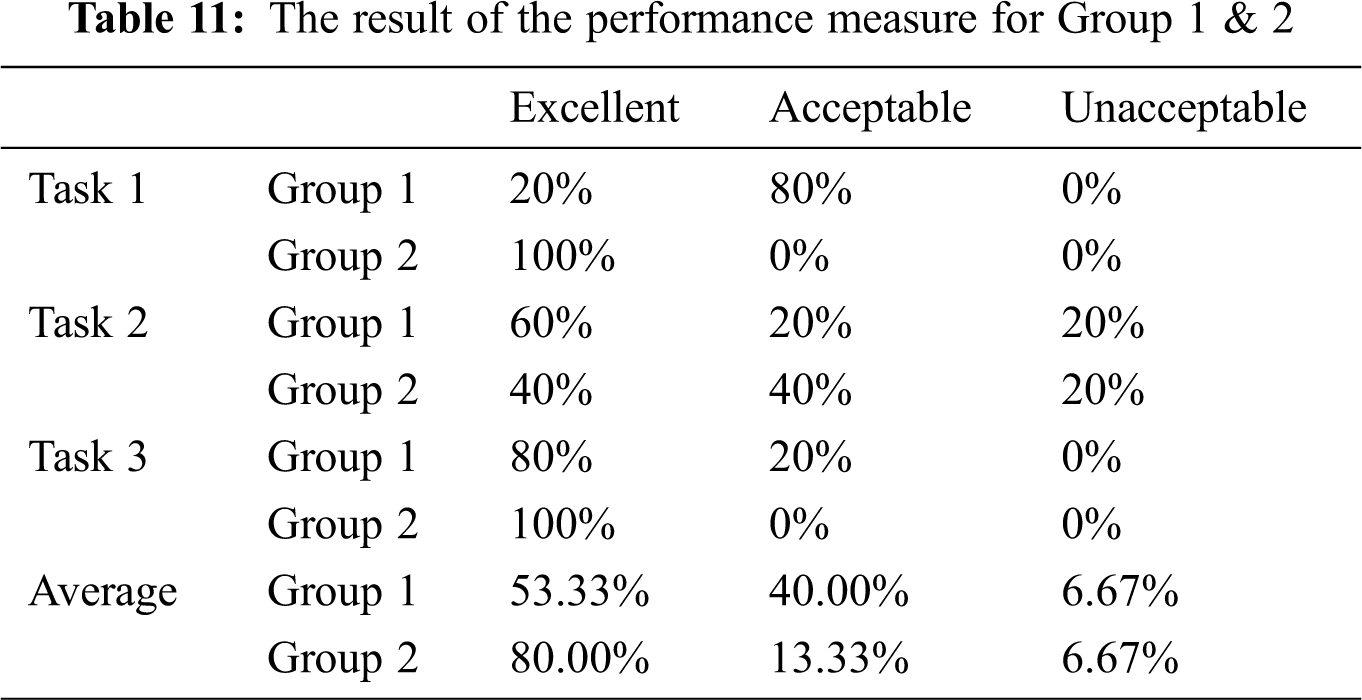
The results of the performance measurement are shown in Tab. 11 and in Fig. 6 for Groups 1 and 2. In Group 1, all users in tasks 1 and 3 received excellent and acceptable results. 20% of them received excellent, and 80% received acceptable results in task 1. In task 3, 80% of them received excellent and 20% of them received acceptable results. In task 2, 60% of users received excellent, 20% received acceptable, and 20% received unacceptable results due to misunderstanding the task scenario.
In Group 2, all users received excellent results in tasks 1 and 3. In task 2, 40% of users received excellent and acceptable results in an equal ratio, and 20% of them received unacceptable results due to misunderstanding the task scenario.
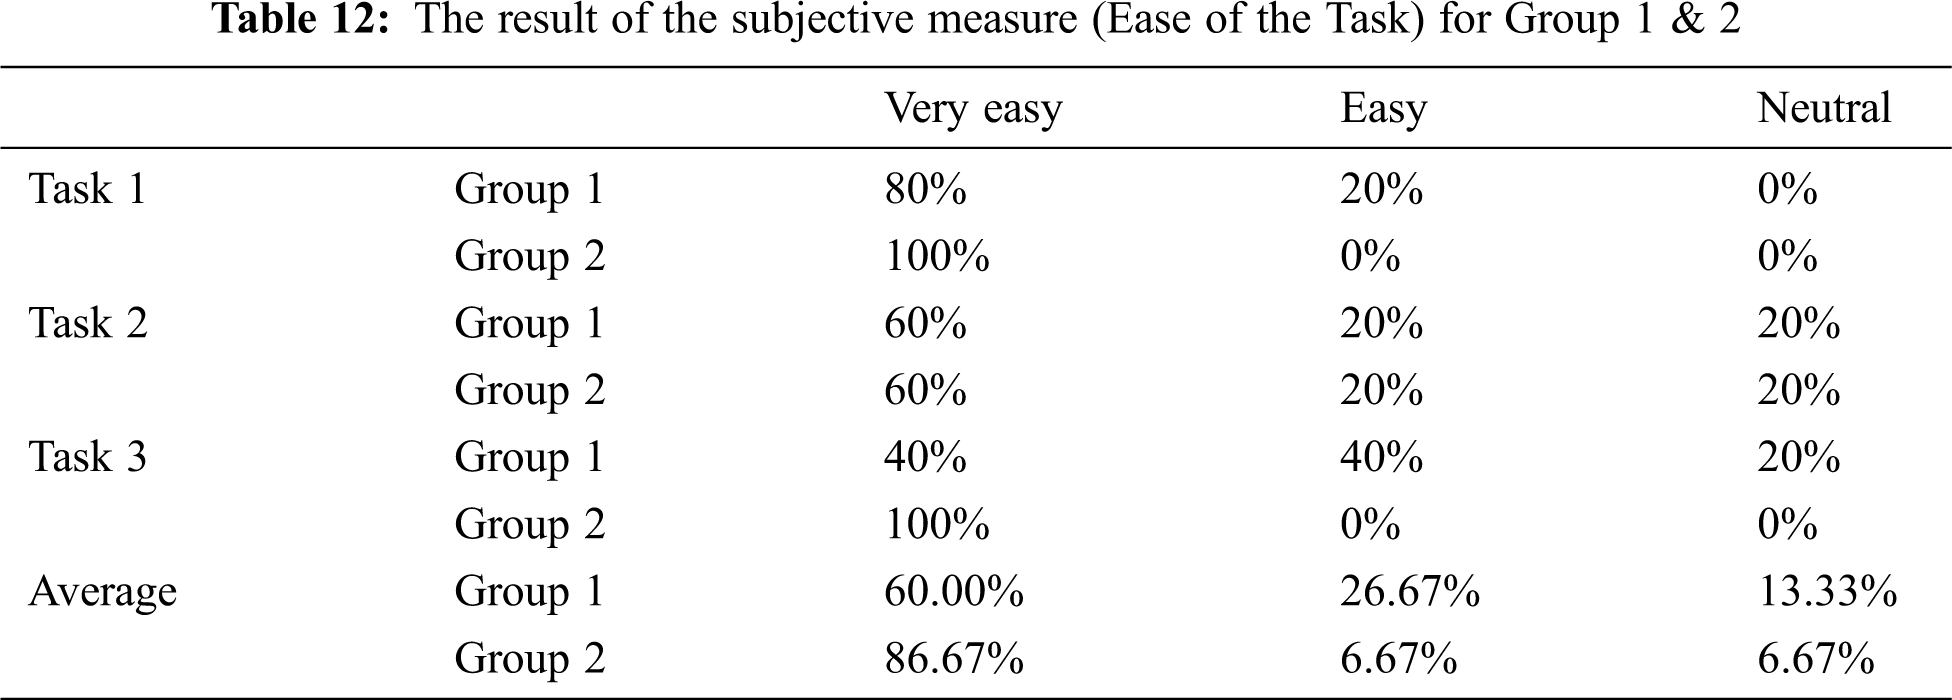
The subjective measurement that reflects the usability of the proposed tool was specified by measuring the ease of each task and the user satisfaction with using the tool. The results are shown in Tabs. 12 and 13 and Figs. 7 and 8 for Groups 1 and 2. For the ease of the task, the choices were very easy, easy, neutral, difficult, and very difficult. Satisfaction was measured using five questions. All questions used a Likert scale [28] with five values: strongly agree, agree, neutral, disagree, and strongly disagree [29]. The results for the ease of the task showed that the users in Groups 1 & 2 confirmed that most of the tasks were very easy and easy. However, 20% of the users in both groups considered task 2 to be neutral due to misunderstanding the task scenario.
In this section, we discuss the user’s feedback in the pilot test (Section 4.2 Pilot Test). We also discuss the results of Groups 1 and 2.
In the pilot test, some of the users wrote their feedback. The first important comment was that the comparison interface should show a feedback message when the “compare” button is clicked, because this task requires a long calculation time and avoids doing wrong actions and then leads to users frustration. For example, the message could say, “Please wait until the calculation is finished” or something similar. This feedback has been implemented in the comparison interface, as shown in Fig. 9.
The other comments were considered, and the interfaces were edited accordingly, as shown in Figs. 10 and 11. Fig. 10 shows the revision of the position of the secant method button, which was moved to the same level as the bisection and Newton’s methods. Fig. 11 shows the comparison interface after the tables and the plot position were swapped. This revision made this interface consistent with the method interfaces.
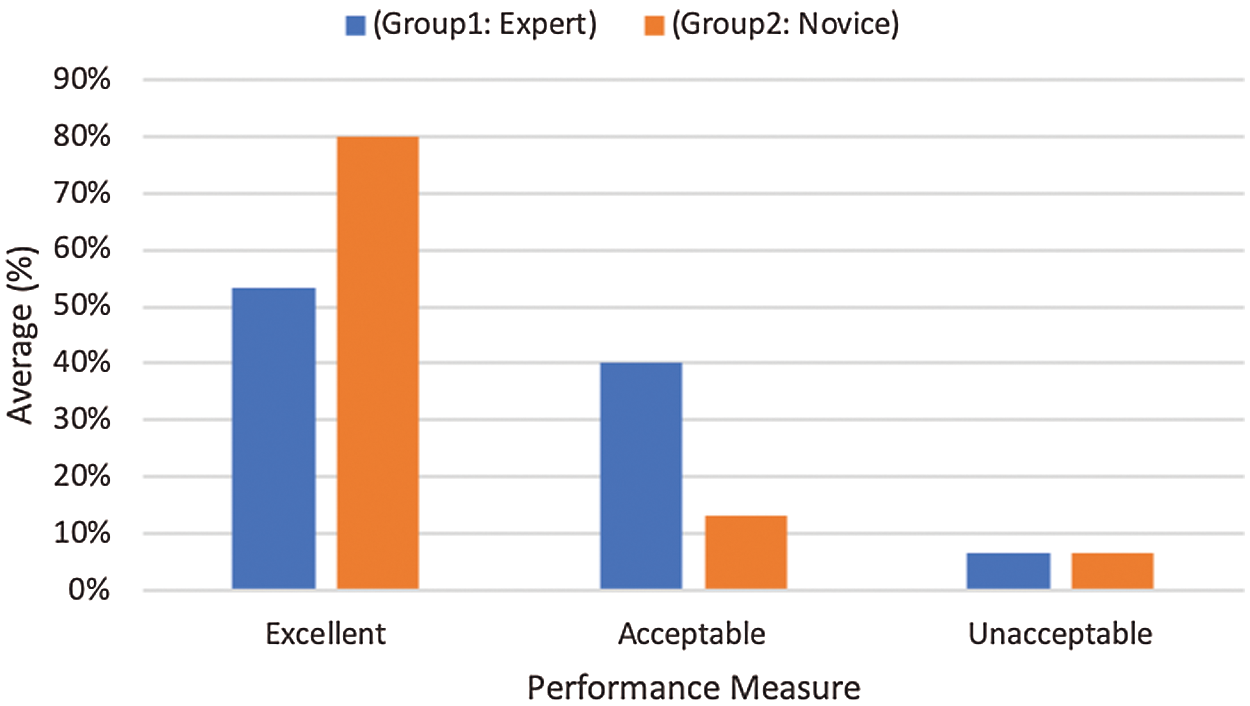
Figure 6: The result of the performance measure for Group 1 & 2
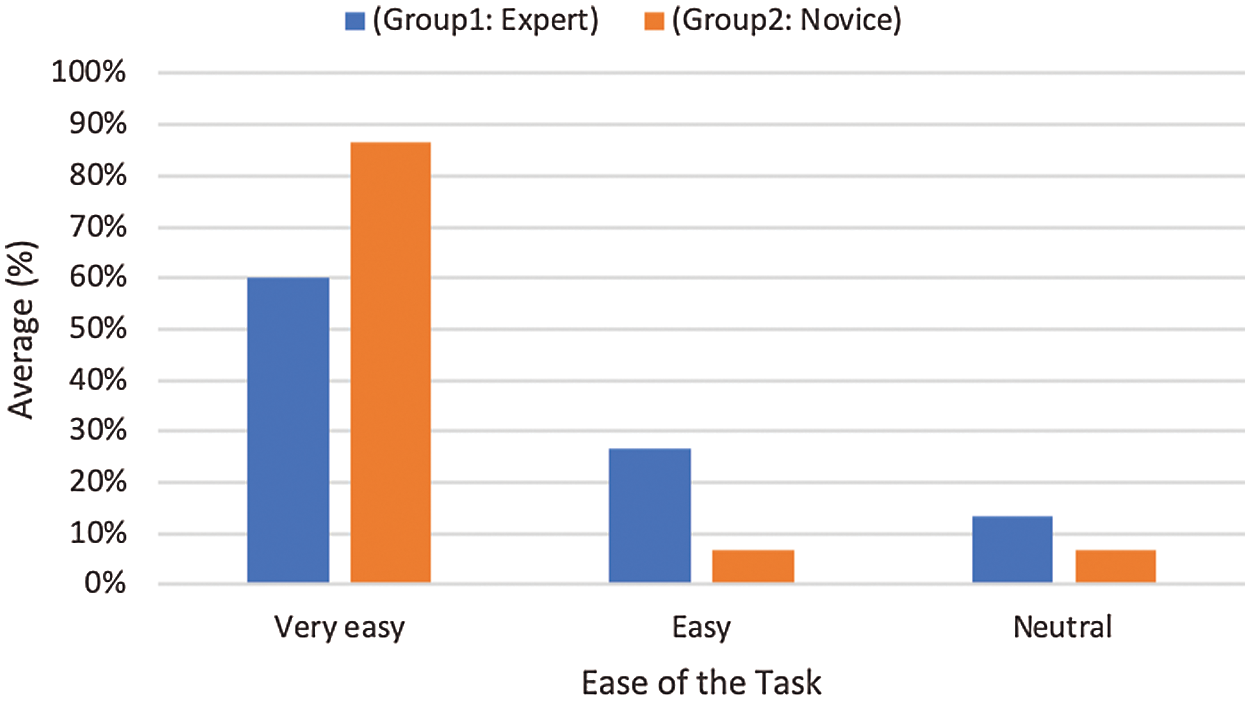
Figure 7: The result of the subjective measure (Ease of the Task) for Group 1 & 2
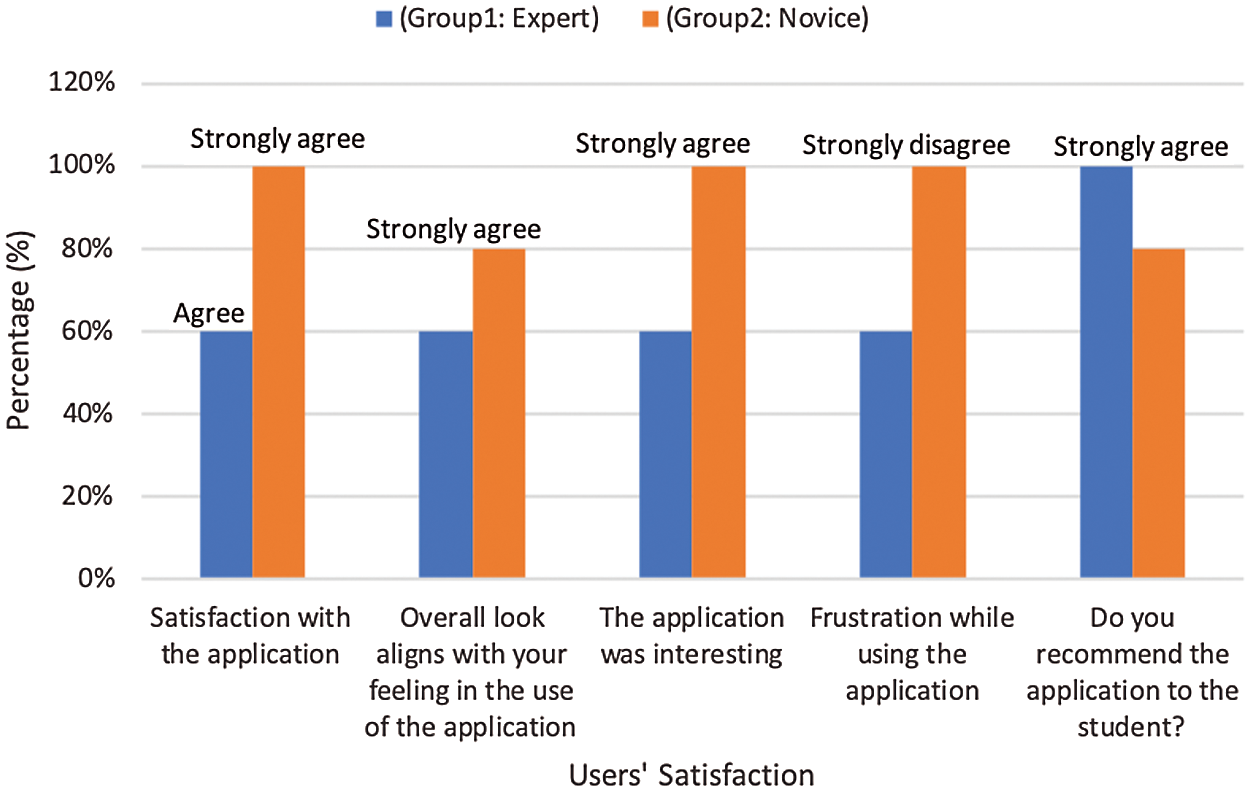
Figure 8: The result of the subjective measure (Users’ Satisfaction) for Group 1 & 2
From Tab. 13 and Fig. 8, the results of Groups 1 and 2 show that all users were satisfied with the application, where 100% of the users chose strongly agree or agree. In contrast, the measure for frustration while using the app shows 100% of the users chose disagree or strongly disagree. Therefore, all results in both groups supported each other and showed that the users were satisfied. All users found the tool interesting. The measure for alignment of feeling with the tool’s look shows that 100% of users agreed, where they chose either agree or strongly agree. As mentioned in Tab. 13 and Fig. 8, 100% of the users agreed about tool recommendation, where they chose either strongly agree or agree. Fig. 8 indicates that Group 2 is low in this aspect, but Fig. 8 shows the highest percentage in each aspect for Groups 1 and 2, where 80% of the users chose strongly agree and 20% chose agree in Group 2.
The users in Group 2 said that the tool helped them understand the bisection method through usability testing. This indicates that the tool achieved its goal by helping users who did not have knowledge about the concept of root-finding to understand it and some of its methods.
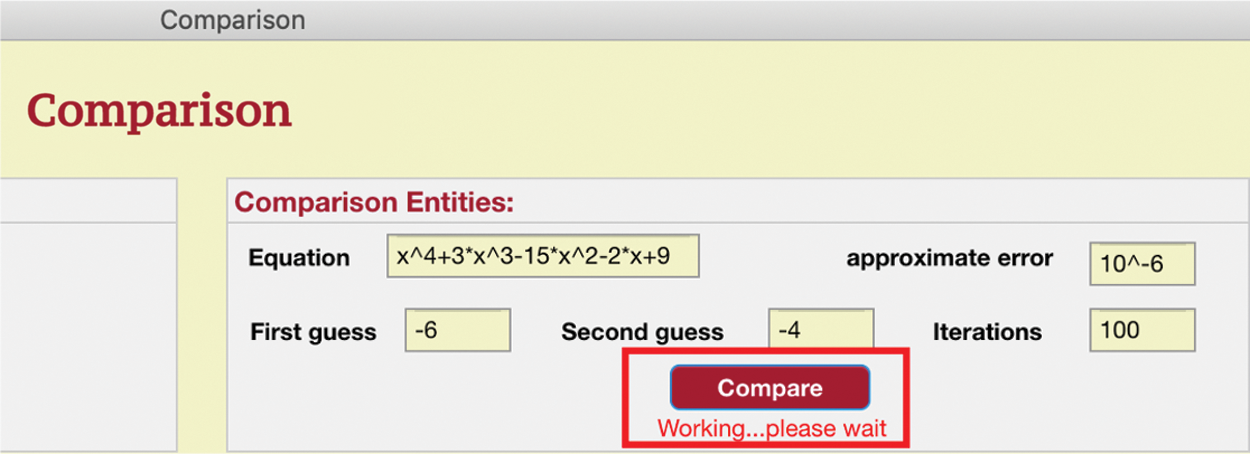
Figure 9: Feedback in comparison interface
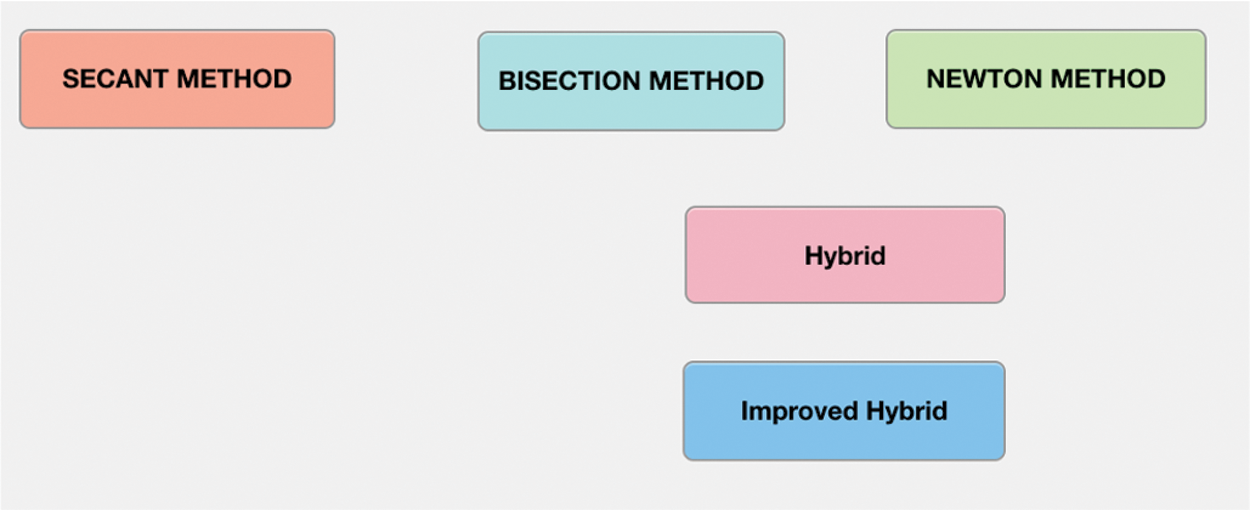
Figure 10: Alignment of Secant method button
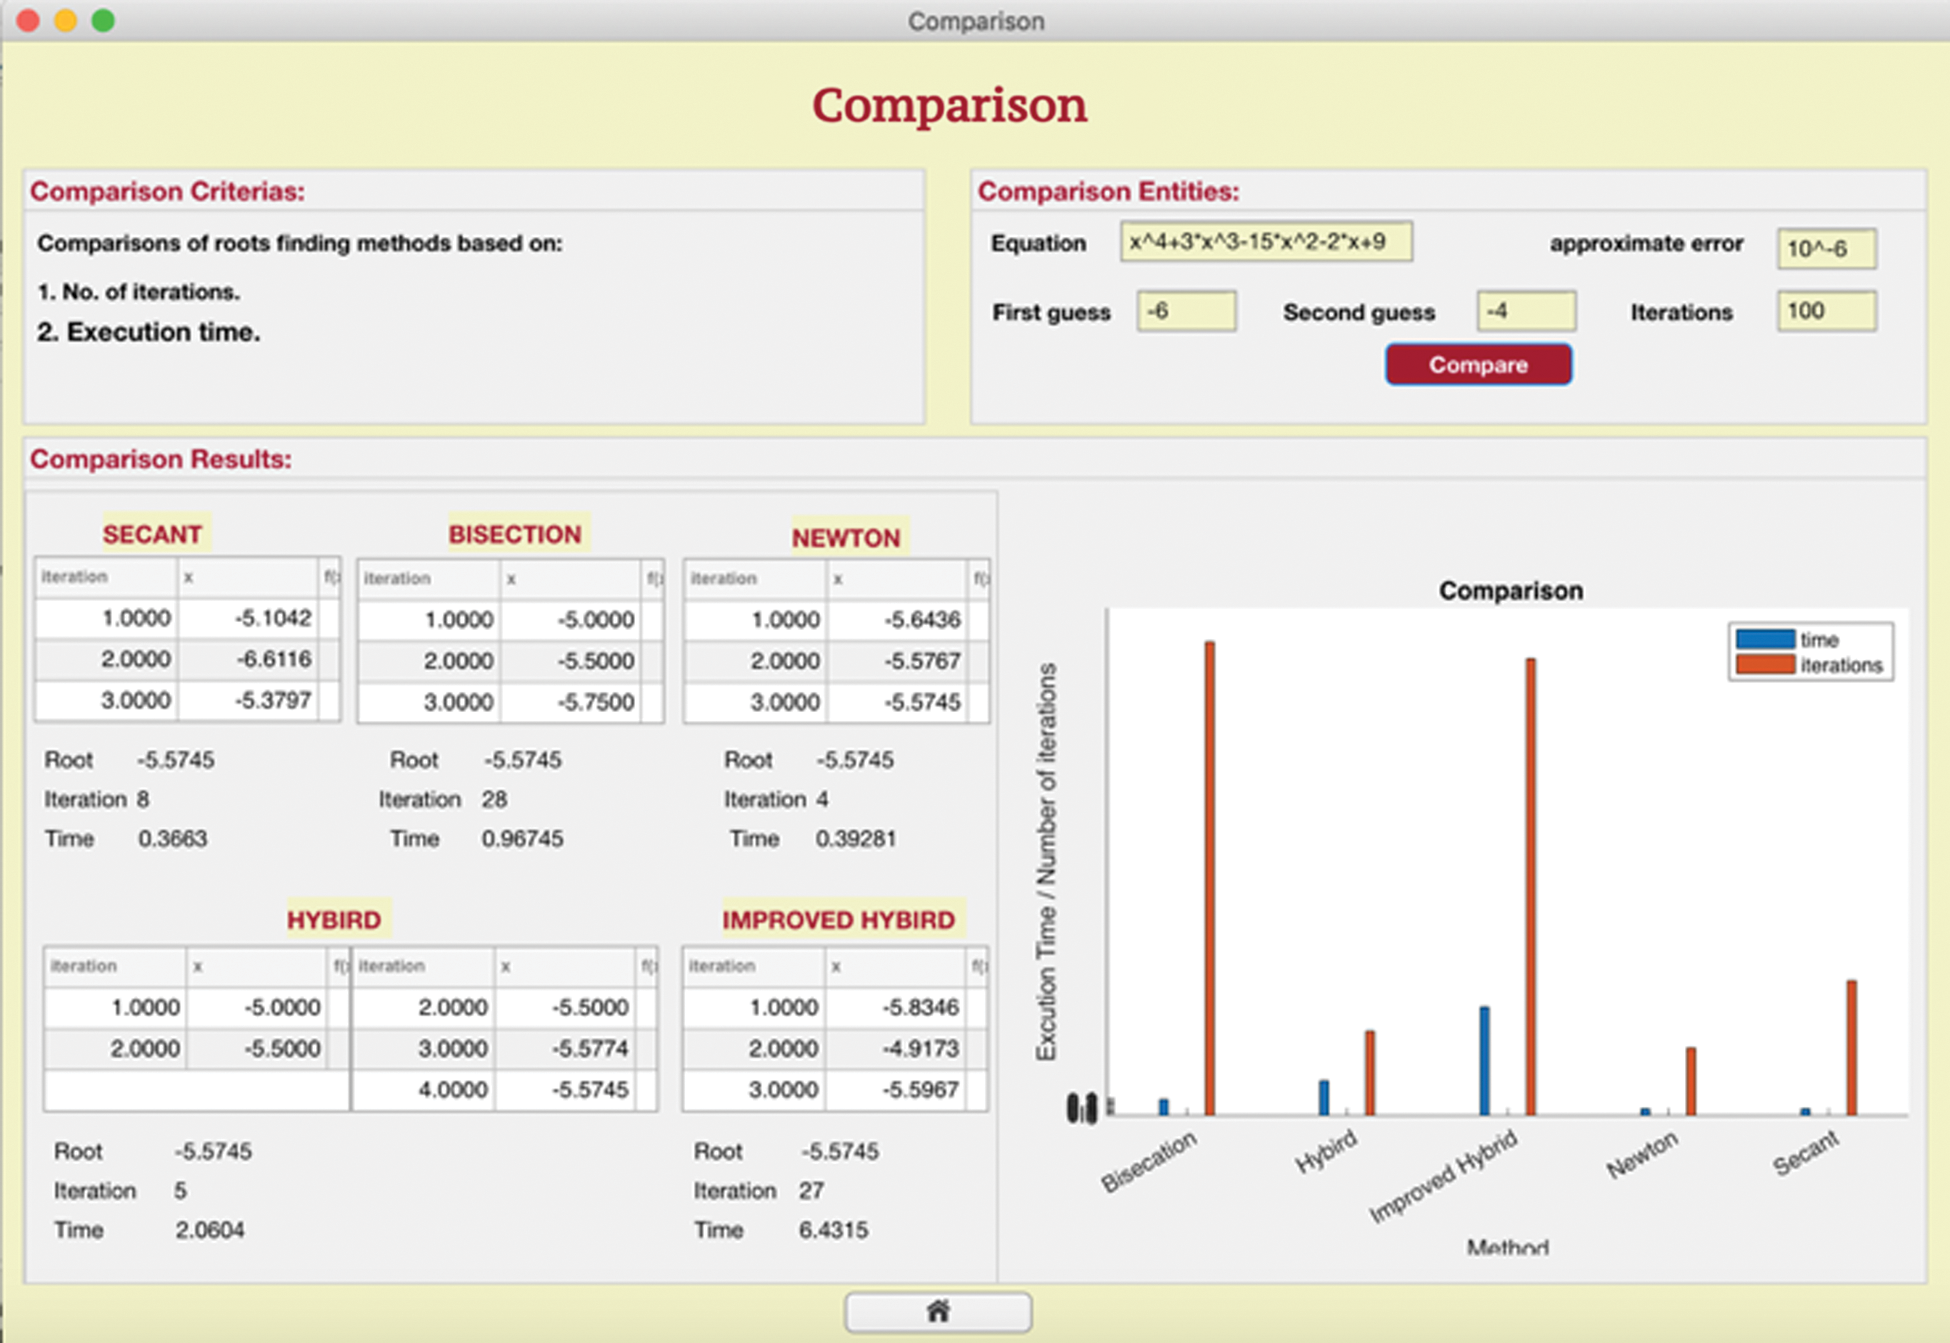
Figure 11: The swap between table and plot positions-Comparison interface

In this work, we implemented a learning program that explained five methods—the bisection method, Newton’s method, the secant method, the hybrid method, and the improved hybrid method—that can be used to solve nonlinear equations. Also, it compares the methods by the number of iterations and execution time. The tool was designed considering design principles such as feedback, visibility, affordance, consistency, and constraints, and was implemented using MATLAB app designers to provide both the graphical user interface and the underlying source code for the mathematical calculations.
The tool was evaluated with two groups of users, the first group (experienced users) represented users with knowledge in root-finding. However, the second group (novice users) represented novice users. The effect on the results of the design principles used to design the tool’s interfaces was positive. We applied common design principles to make the tool effective and efficient. The effect of these principles was as follows:
1. Applying the feedback principle assisted in avoiding mistakes during the use of the tool.
2. Applying the visibility principle helped to make the meaning visible.
3. Applying the affordance principle helped to prevent misleading affordances.
4. Applying the consistency principle helped the tool become usable and learnable.
5. Applying the constraints principle also assisted in reducing error and focus on the specific task.
Ultimately, the positive results of the user evaluation showed that the tool was recommended to other users. Also, the second group confirmed that they understood the concept when they used the tool. Thus, this study achieved its goal to help students learn these methods using an interactive learning tool.
Our future direction will develop the tool with different software to become the tool available free to all users. Since the software MATLAB is not free and then is not available to all. Furthermore, it will expand the tool to include a wide range of complex mathematical equations that need to be simplified using such tools. Moreover, adding more interactive elements, such as games and animation, will make a significant difference in learning.
Acknowledgement: The authors gratefully acknowledge the participants in the experiment test for their time and effective feedback.
Funding Statement: The authors received no specific funding for this study.
Conflicts of Interest: The authors declare that they have no conflicts of interest to report regarding the present study.
1. S. Pradono, M. S. Astriani and J. Moniaga, “A method for interactive learning,” CommIT (Communication and Information Technology) Journal, vol. 7, no. 2, pp. 46–48, 2013. [Google Scholar]
2. S. Chu and G. M. M. Ramírez, “Interactive learning for graphic design foundations,” E-Learning and Digital Media, vol. 9, no. 4, pp. 345–355, 2012. [Google Scholar]
3. E. Moderator, “Covid-19 is reviving the need to explore online teaching and learning opportunities,” Available: https://epale.ec.europa.eu/en/blog/covid-19-reviving-need-explore-online-teaching-and-learning-opportunities, May 2020, Accessed on 2020-06-02. [Google Scholar]
4. ITU. International Telecommunication Union, “Covid-19: How students view the sudden shift to online learning,” Available: https://news.itu.int/covid-19-how-students-view-the-sudden-shift-to-online-learning/,April 2020, Accessed on 2020-06-02. [Google Scholar]
5. Bostelm, “Numerical analysis,” Available: http://encyclopediaofmath.org/index.php?title=Numerical_analysis&oldid=36393,April 2015, Accessed on 2020-02-03. [Google Scholar]
6. A. A. H. Altaee, H. K. Hoomod and K. A. Hussein, “A new approach to find roots of nonlinear equations by hybrid algorithm to bisection and newton-raphson algorithms,” Iraqi Journal for Information Technology, vol. 7, pp. 75–82, 2015. [Google Scholar]
7. O. S. Solaiman and I. Hashim, “Optimal eighth-order solver for nonlinear equations with applications in chemical engineering,” Intelligent Automation & Soft Computing, vol. 27, no. 2, pp. 379–390, 2021. [Google Scholar]
8. M. Shacham, “Numerical solution of constrained non-linear algebraic equations,” International Journal for Numerical Methods in Engineering, vol. 23, no. 8, pp. 1455–1481, 1986. [Google Scholar]
9. C. Führer and A. Sopasakis, “Numerical methods,” 2016. [Online]. Available: http://www.maths.lth.se/na/courses/FMN050/media/material/lec12016.pdf,Accessed on 2020-02-03. [Google Scholar]
10. Byju’s. The Learning App, “Bisection method,” Available: https://byjus.com/maths/bisection-method/, August 2019, Accessed on 2019-10-07. [Google Scholar]
11. C. F. Gerald and P. O. Wheatley, Applied Numerical Analysis. New Delhi: Pearson Education India, 2014. [Google Scholar]
12. J. Kim, T. Noh, W. Oh, S. Park and N. Hahm, “An improved hybrid algorithm to bisection method and newton-raphson method,” Applied Mathematical Sciences, vol. 11, no. 56, pp. 2789–2797, 2017. [Google Scholar]
13. H. Fatemeh, K. Ahmad and D. M. Mohammad, “ICMAP: An interactive tool for concept map generation to facilitate learning process,” Procedia Computer Science, vol. 3, pp. 524–529, 2011. [Google Scholar]
14. M. S. Trigui and D. M. Alghazzawi, “Interactive tools for mathematics learning related to the cryptography,” in 2011 3rd Int. Congress on Engineering Education (ICEED), Kuala Lumpur, Malaysia, IEEE, pp. 155–158, 2011. [Google Scholar]
15. A. H. M. Nordin, R. F. Mustapa, M. E. Mahadan, N. H. Ahmad and N. Dahlan, “Transformer interactive learning tool based on matlab simulink and gui,” in 2017 IEEE 9th Int. Conf. on Engineering Education (ICEEDKanazawa, Japan, IEEE, pp. 42–47, 2017. [Google Scholar]
16. A. Tepljakov, E. Petlenkov, E. A. Gonzalez and I. Petras, “Design of a matlab-based teaching tool in introductory fractional-order systems and controls,” in 2017 IEEE Frontiers in Education Conf. (FIEIndianapolis, IN, USA, IEEE, pp. 1–5, 2017. [Google Scholar]
17. R. Alnanih, N. Bahatheg, M. Alamri and R. Algizani, “Mobile-d approach-based persona for designing user interface,” International Journal of Advanced Trends in Computer Science and Engineering, vol. 8, no. 5, pp. 2597–2607, 2019. [Google Scholar]
18. A. Bacelo, D. Roldan-Alvarez and E. Martín, “Turns vs. consensus: Learning mathematics in multi-touch surfaces,” International Journal of Human-Computer Studies, vol. 140, no. 4, pp. 1–14, 2020. [Google Scholar]
19. R. Halverson, M. Wolfenstein, C. C. Williams and C. Rockman, “Remembering math: The design of digital learning objects to spark professional learning,” E-Learning and Digital Media, vol. 6, no. 1, pp. 97–118, 2009. [Google Scholar]
20. D. Kung, Object-Oriented Software Engineering: An Agile Unified Methodology. London: McGraw-Hill Higher Education, 2013. [Google Scholar]
21. R. Alnanih and O. Ormandjieva, “Mapping HCI principles to design quality of mobile user interfaces in healthcare applications,” Procedia Computer Science, vol. 94, pp. 75–82, 2016. [Google Scholar]
22. J. Preece, Y. Rogers and H. Sharp, Interaction Design: Beyond Human-Computer Interaction, 4th ed., Hoboken, NJ: Wiley, 2015. [Google Scholar]
23. T. Soni, “Algorithm and flowchart for bisection method,” Available: https://www.codingalpha.com/bisection-method-flowchart-algorithm/,June 2017, Accessed on 2019-12-18. [Google Scholar]
24. C. Hass, “A practical guide to usability testing,” in Consumer Informatics and Digital Health. Cham: Springer, pp. 107–124, 2019. [Google Scholar]
25. M. J. Roberts, H. Gray and J. Lesnik, “Preference versus performance: Investigating the dissociation between objective measures and subjective ratings of usability for schematic metro maps and intuitive theories of design,” International Journal of Human-Computer Studies, vol. 98, pp. 109–128, 2017. [Google Scholar]
26. P. Kortum and F. L. Oswald, “The impact of personality on the subjective assessment of usability,” International Journal of Human-Computer Interaction, vol. 34, no. 2, pp. 177–186, 2017. [Google Scholar]
27. CFX. Cognitive FX, “Objective and subjective measurements in our research,” Available: https://www.cognitivefxusa.com/blog/objective-and-subjective-measurements-in-our-research,July 2017, Accessed on 2020-07-25. [Google Scholar]
28. S. McLeod, “Likert scale definition, examples and analysis,” 2019. [Online]. Available: https://www.simplypsychology.org/likert-scale.html,Accessed on 2020-02-11. [Google Scholar]
29. E. Zaneldin, W. Ahmed and B. El-Ariss, “Video-basede-learning for an undergraduate engineering course,” E-Learning and Digital Media, vol. 16, no. 6, pp. 475–496, 2019. [Google Scholar]
 | This work is licensed under a Creative Commons Attribution 4.0 International License, which permits unrestricted use, distribution, and reproduction in any medium, provided the original work is properly cited. |