DOI:10.32604/csse.2022.017750
| Computer Systems Science & Engineering DOI:10.32604/csse.2022.017750 | |
| Article |
Correlation Analysis between Economic Growth and Environmental Quality
1Huzhou Vocational & Technical College, Huzhou, 313000, China
2International Business Machines Corporation (IBM), New York, NY, USA
*Corresponding Author: Na Li. Email: linaxinxin11@163.com
Received: 09 February 2021; Accepted: 10 May 2021
Abstract: With the rapid development of the economy, China’s environment has been damaged severely, which has attracted much attention from scholars and the local government. The concept of green development has been an underlying trend since 2012, and it is of great significance to explore the relationship between economic growth and environmental quality. Huzhou is a prefecture-level city under the jurisdiction of Zhejiang Province, and it is one of the 27 cities in the central area of the Yangtze River Delta. In recent years, this city develops well not only in economic development but also in maintaining a green environment. In the paper, the back propagation neural network is used to evaluate the local environmental quality. Meanwhile, the panel model is exploited to analyze the relationship between economic growth and environmental quality. All the data presented in the paper range from the year 2008 to 2018. Theoretical analysis indicates that the evaluation value of environmental quality, the emissions of industrial SO2, and waste water exhibit an inverted U-shaped relationship with economic growth. As for the regression results, the inflection point of income in the environmental Kuznets curve of the model which takes the evaluation value of the environmental quality as a dependent variable is higher than that of the model which takes the SO2 emission as an independent variable. The research result would help the local government to take appropriate countermeasures to improve the environment and economy.
Keywords: Economic growth; environmental quality; BP neural network; environmental Kuznets curve
With the rapid development of the economy, China’s environment has been greatly damaged since its reform and opening to the world. Every autumn and winter, there are some fog and haze days in most areas in China. A harsh environment has affected people’s lives. While they enjoy the dividend from the rapid development of the economy, they have to suffer a lot from environmental deterioration. The frequent environmental problems have attracted more and more attention from scholars and the local government.
How to keep the balance between the environment and the economy? President Xi Jinping, who is the general secretary of the Communist Party of China (CPC), said in the 19th CPC National Congress that China should deal well with the relationship between economic growth and ecological environment protection, and the economy should never develop at the cost of destroying the environment. Huzhou, a prefecture-level city under the jurisdiction of Zhejiang Province and one of the 27 cities in the central area of the Yangtze River Delta, has turned lucid water and lush mountain into invaluable assets. Association analysis between economic growth and environmental quality will facilitate a more coordinated development, and help policymakers to make suitable policies and programs, as well as provide a reference for other cities to develop the green economy with high quality.
In this paper, the Back Propagation (BP) neural network is employed to evaluate the environmental quality in Huzhou City, and then the panel model is exploited to analyze the relationship between economic growth and environmental quality. Based on the empirical results, an Environmental Kuznets curve is drawn to explore the inflection point. The rest of this paper is organized as follows. Section 2 introduces the related work. Section 3 analyzes the association between economic growth and environmental quality. In Section 4, the panel model is used to show the association. Finally, the conclusion is given in Section 5.
Scholars have been studying the relationship between economy and environment since the end of the last century. They find that an inverted U-shaped relationship exists between economy and environment, i.e., in the early stage of economic development, the environment becomes worse with the development in the economy; whereas, when the economy develops to a certain stage, the environment is improved with the development in economy. This inverted U-shaped relationship is called Environmental Kuznets curve by scholars.
Scholars around the world have made some attempts, such as input-output model [1–3], system dynamics model [4–6], Kuznets curve [7–11], ridge regression model [12–15], Vertical Auto-regression model [16–19], and computable general equilibrium assessment [20–25]. One of the most widely used methods is the Kuznets curve, which reflects the inverted U-shape between economy and environment. Li Zhou believed that the discharges of three wastes (i.e., waste gas, waste water, and industrial residue) in eastern and western China didn’t reach the turning point [26–28]. Taking industrial emissions and discharged pollutants as environmental quality indicators, and based on the large amount of data collected from 1981 to 2004, Li Rui’e concluded that the pollutant like industrial SO2 possessed an obvious characteristic of Environmental Kuznets Curve (EKC), and the income turning point was lower than that of the developed countries [29–32]. Li Bing studied the influence of the air pollution Kuznets curve by constructing a generalized matrix model and employing the panel data ranging from 2000 to 2011. He found that air pollution was featured with an inverted U-shaped Kuznets Curve. Other factors such as energy efficiency, industrial structure, urbanization, demographic structure, and the opening to the outside would also affect air pollution [33–35].
BP (Back Propagation) neural network, proposed by Rumelhart and McClelland in 1986, is a theory that imitates the biological processing model to realize intelligent processing of information. It is a multi-layer feed-forward neural network that is composed of layers of input, hidden, and output. Signals are transmitted forward while errors are propagated backward. The BP network does not require any mapped functions in advance. Expected output can be obtained by training with a large number of samples. Neuron activation values transmit from the input layer to the output layer through the middle hidden layers, and errors are computed and then propagated backward from the output layer to the input layer. The expected output is finally obtained by continuously modifying the weight and threshold in the network.
Since the 1980s, BP neural network has been widely applied to fields such as pattern recognition, intelligent robot, and automatic control [36,37]. In recent years, scholars in China have expanded the application of BP neural networks to the economic field. Zhang Jingxin researched on prediction of stock price fluctuation by the financial index [38,39]. Xiao [40] investigated the performance evaluation of suppliers for telecommunication operating enterprises. Wang Jun explored the risk evaluation of the internet credit platform. Liu [41] researched financial risk evaluation of internet listed companies. Li et al. [42] investigated the impact of international competitiveness of China’s Trade on producer services.
To sum up, scholars would draw different conclusions with different methods. But there is little corresponding research on one city by using BP neural network and panel model. The corresponding study in Huzhou city would provide a practical evaluation of the relationship between economic growth and environmental quality.
3 Association Analysis between Economic Growth and Environmental Quality Based on BP Neural Network
An area’s economy is closely related to its eco-environment, which is a complex artificial ecosystem composed of society, economy, and environment. To conduct an overall and accurate quantitative analysis of the eco-environment in Huzhou city, the paper chooses the BP neural network and the data that relates to the local natural environment.
3.1 Construction of Evaluation Model
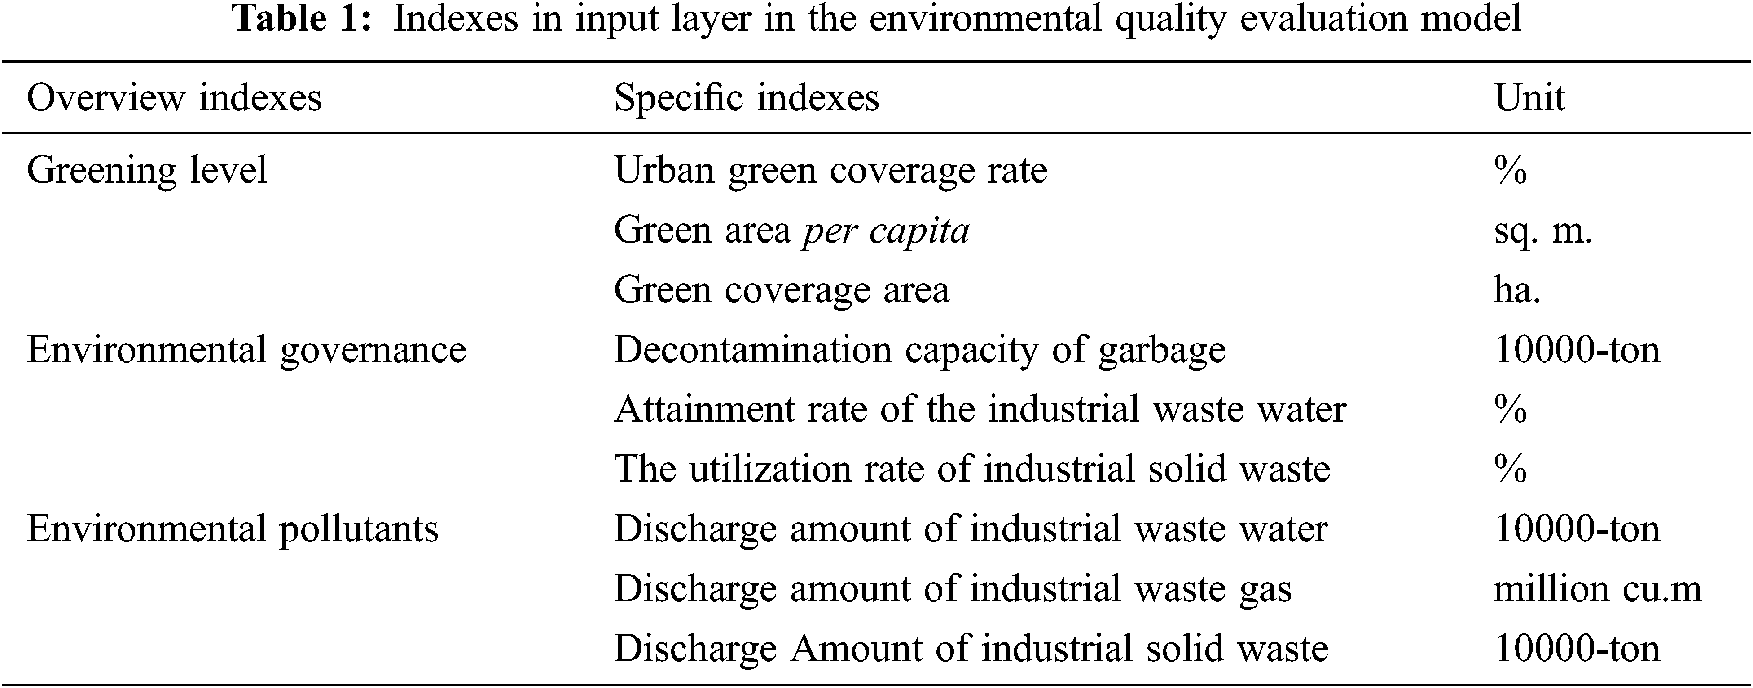
In this paper, the neurons in all layers are composed of quantifiable indexes. Those in the input layers are represented by a greening level which is measured by urban green coverage rate (%), green area per capita (sq.m), and green coverage area (ha.), environmental governance which is measured by decontamination capacity of garbage (10000-ton), attainment rate of industrial waste water (%), the utilization rate of industrial solid waste (%), and environmental pollutants which is measured by discharges of industrial waste water (10000-ton), waste gas (million cu.m), and solid waste (10000-ton). The specific indexes in the input layer are listed in Tab. 1.
The number of neurons in the hidden layer is initially determined by an empirical formula shown in Eq. (1). The training won’t finish until an optimal fitting is obtained.
where q, m, and n represent the number of neurons in the hidden, input, and output layer respectively, and α can be any arbitrary integer ranging from 1 to 10.
The neurons in the output layer are represented by the evaluation value. The environmental quality evaluation model based on BP neural network is illustrated in Fig. 1.
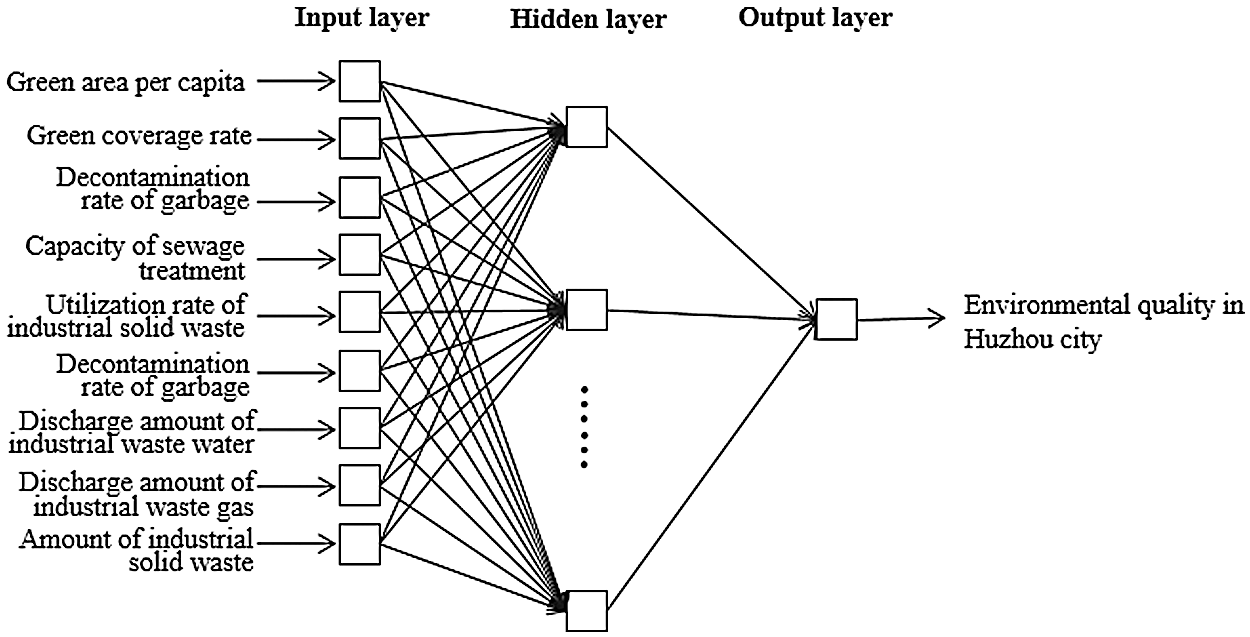
Figure 1: Model for evaluating the environmental quality
3.2.1 Choosing and Processing Data
Based on the statistical yearbook of Huzhou, the indexes including greening level, environmental governance, and environmental pollutants ranging from 2008 to 2018 are selected as original samples. Since any difference in unit and dimension can cause problems such as a longer training time, a reduction in convergence and stability, and small numbers in the output being swallowed by big ones, standardized processing which is needed to transform the original samples into dimensionless values that range from 0 to 1. This process is shown in Eq. (2).
where xn and xmax represent the index and the maximum one, respectively.
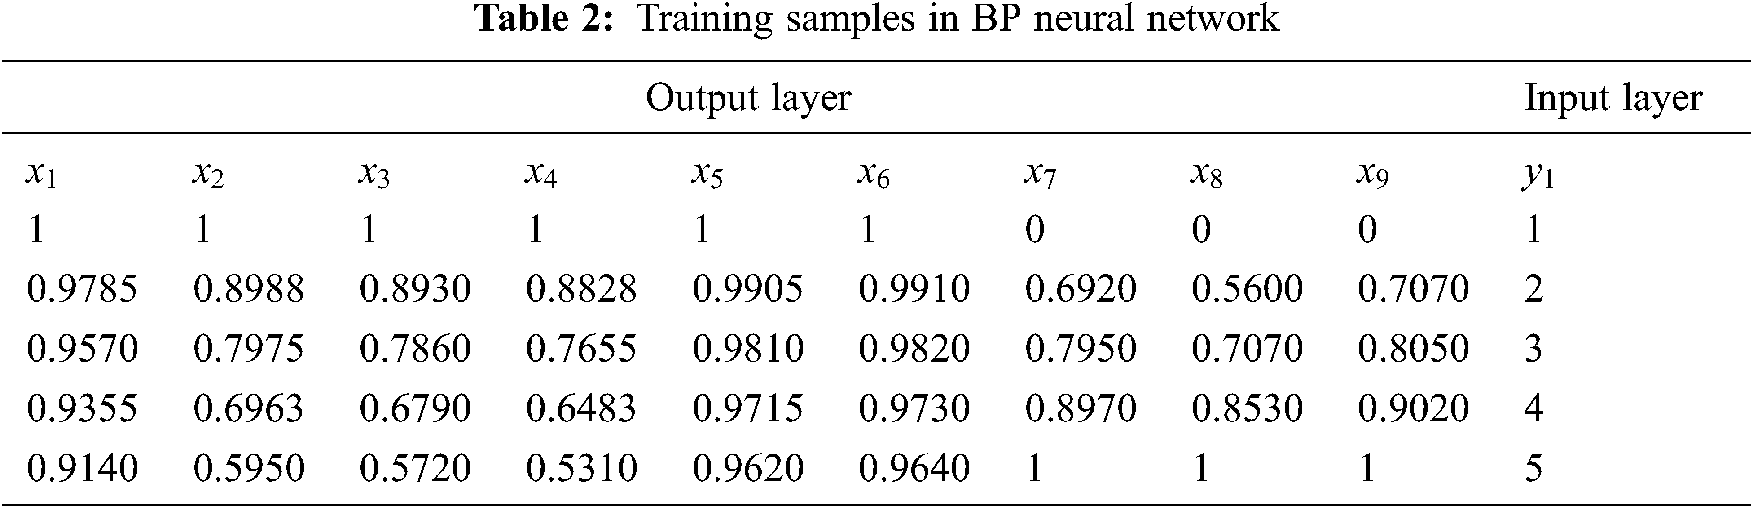
Then, a linear interpolation is used to choose an interval between the maximum and the minimum samples. Based on this, the environmental quality in Huzhou city is divided into five levels, where level 1 indicates the highest level and level 5 indicates the lowest one. The training samples are shown in Tab. 2.
3.2.2 Designing BP Network and Training
According to the above model, nine neurons are in the input layer and one in the output layer. After simulation training, a better result is obtained with four neurons in the hidden layer, which is shown in Fig. 2. It is a three-layer neural network with a dimension of 9 × 4 × 1.
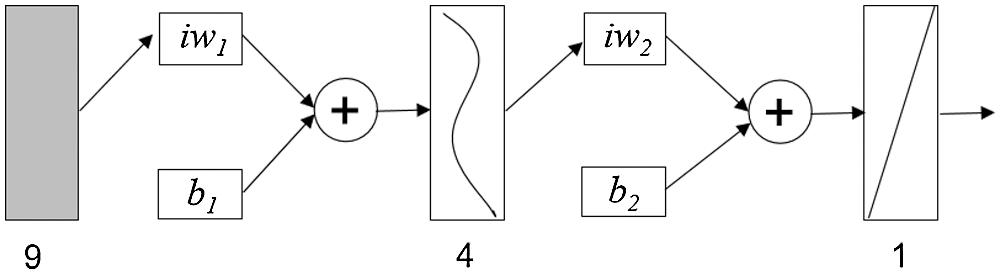
Figure 2: BP neural network (9 × 4 × 1)
The normalized samples are trained by BP neural network with the MATLAB software. Tansig (an S-type tangent function) and Purelin (a linear activation one) are selected as transfer functions in the hidden and output layers, respectively. The training parameters are set as follows. The learning rate is set to 0.05, and training time is set to 300. Besides, the target error is set to 0.00001. The training won’t terminate until the error sum of squares reaches a minimum. Here, the training lasts thirty-three times.
The predictive and actual values of the nine groups of samples are shown in Fig. 3. We can draw a conclusion that they are overlapped completely, which indicates that the model achieves high accuracy and strong generalization ability.
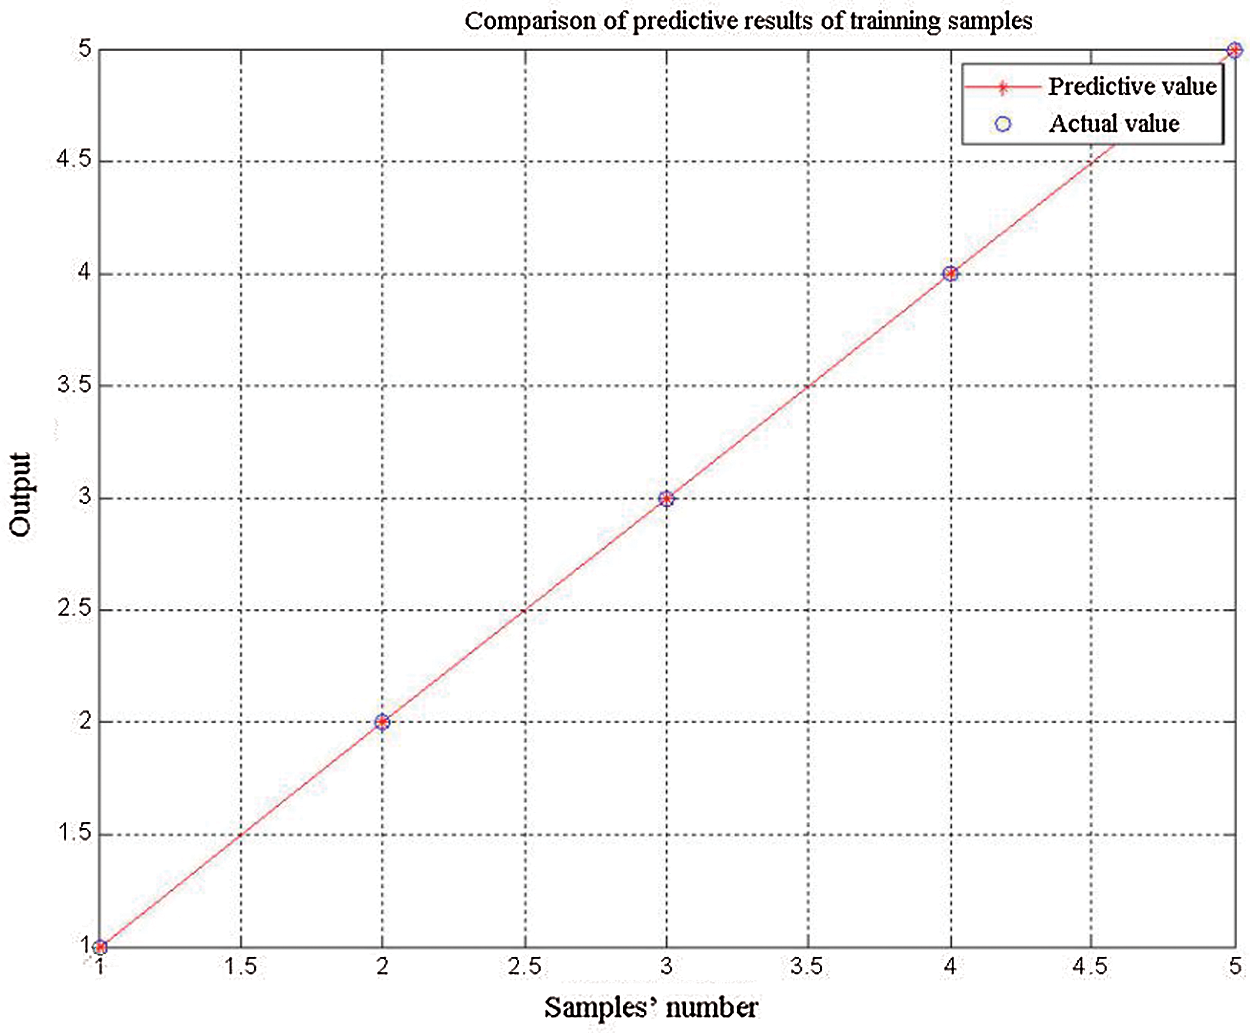
Figure 3: Actual and predictive values of environmental quality in Huzhou city
3.2.3 Analysis on Simulation of BP Network
To get the evaluation value of the environmental quality over the eleven years in Huzhou city which covers three counties (Anji, Deqing, and Changxing) and two districts (Wuxing and Nanxun), a simulation experiment is conducted by using the trained BP network. When the standardized data is input into the trained BP network, a result can be obtained and it is listed in Tab. 3.
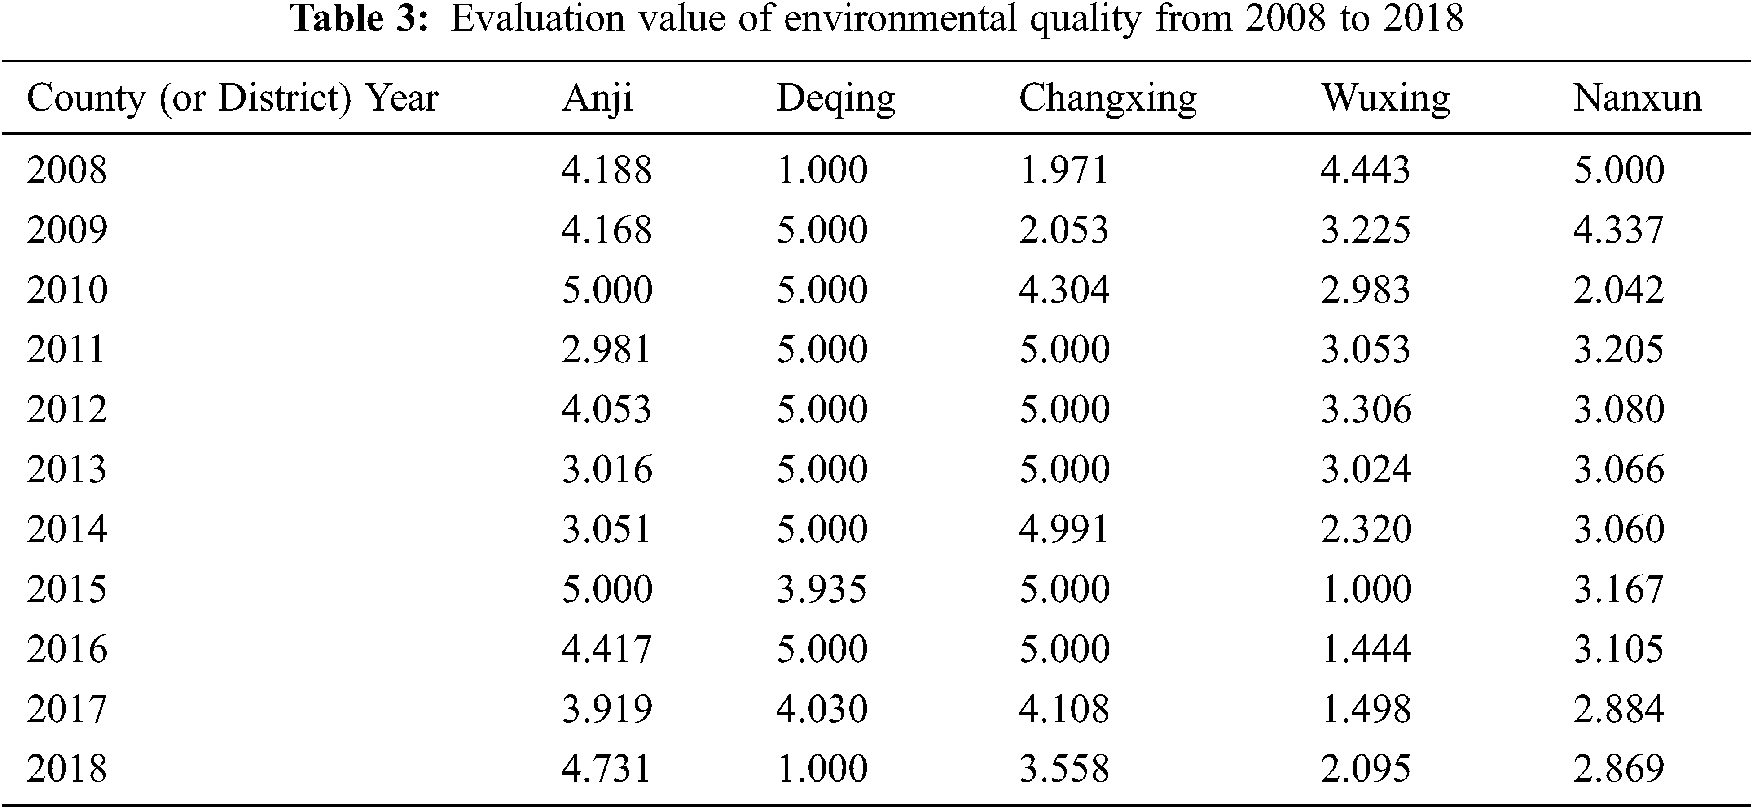
3.3 Analysis of Evaluation Result
According to Tab. 3, the average value of environmental quality is 3.631. This relatively high value doesn’t indicate a good environment, because pollutants are mainly from the economic centers. Both the large emissions and the high concentration lead to a poor environment.
There is a significant difference in the environment of these three counties and two districts. In recent years, the change of the environmental evaluation becomes smaller and smaller in advanced districts like Wuxing and Nanxun. In other words, the local environment depends highly on its economy, the more advanced the economy, the better the environmental infrastructures.
Based on ArcGIS, a software used to analyze geographic information systems, the evaluation values in 2008, 2011, 2014, and 2018 are marked on the map, as shown in Fig. 4. It can be observed that the environments of Wuxing and Nanxun become better and better, while those in Deqing and Anji tend to be improved though they are below the average.
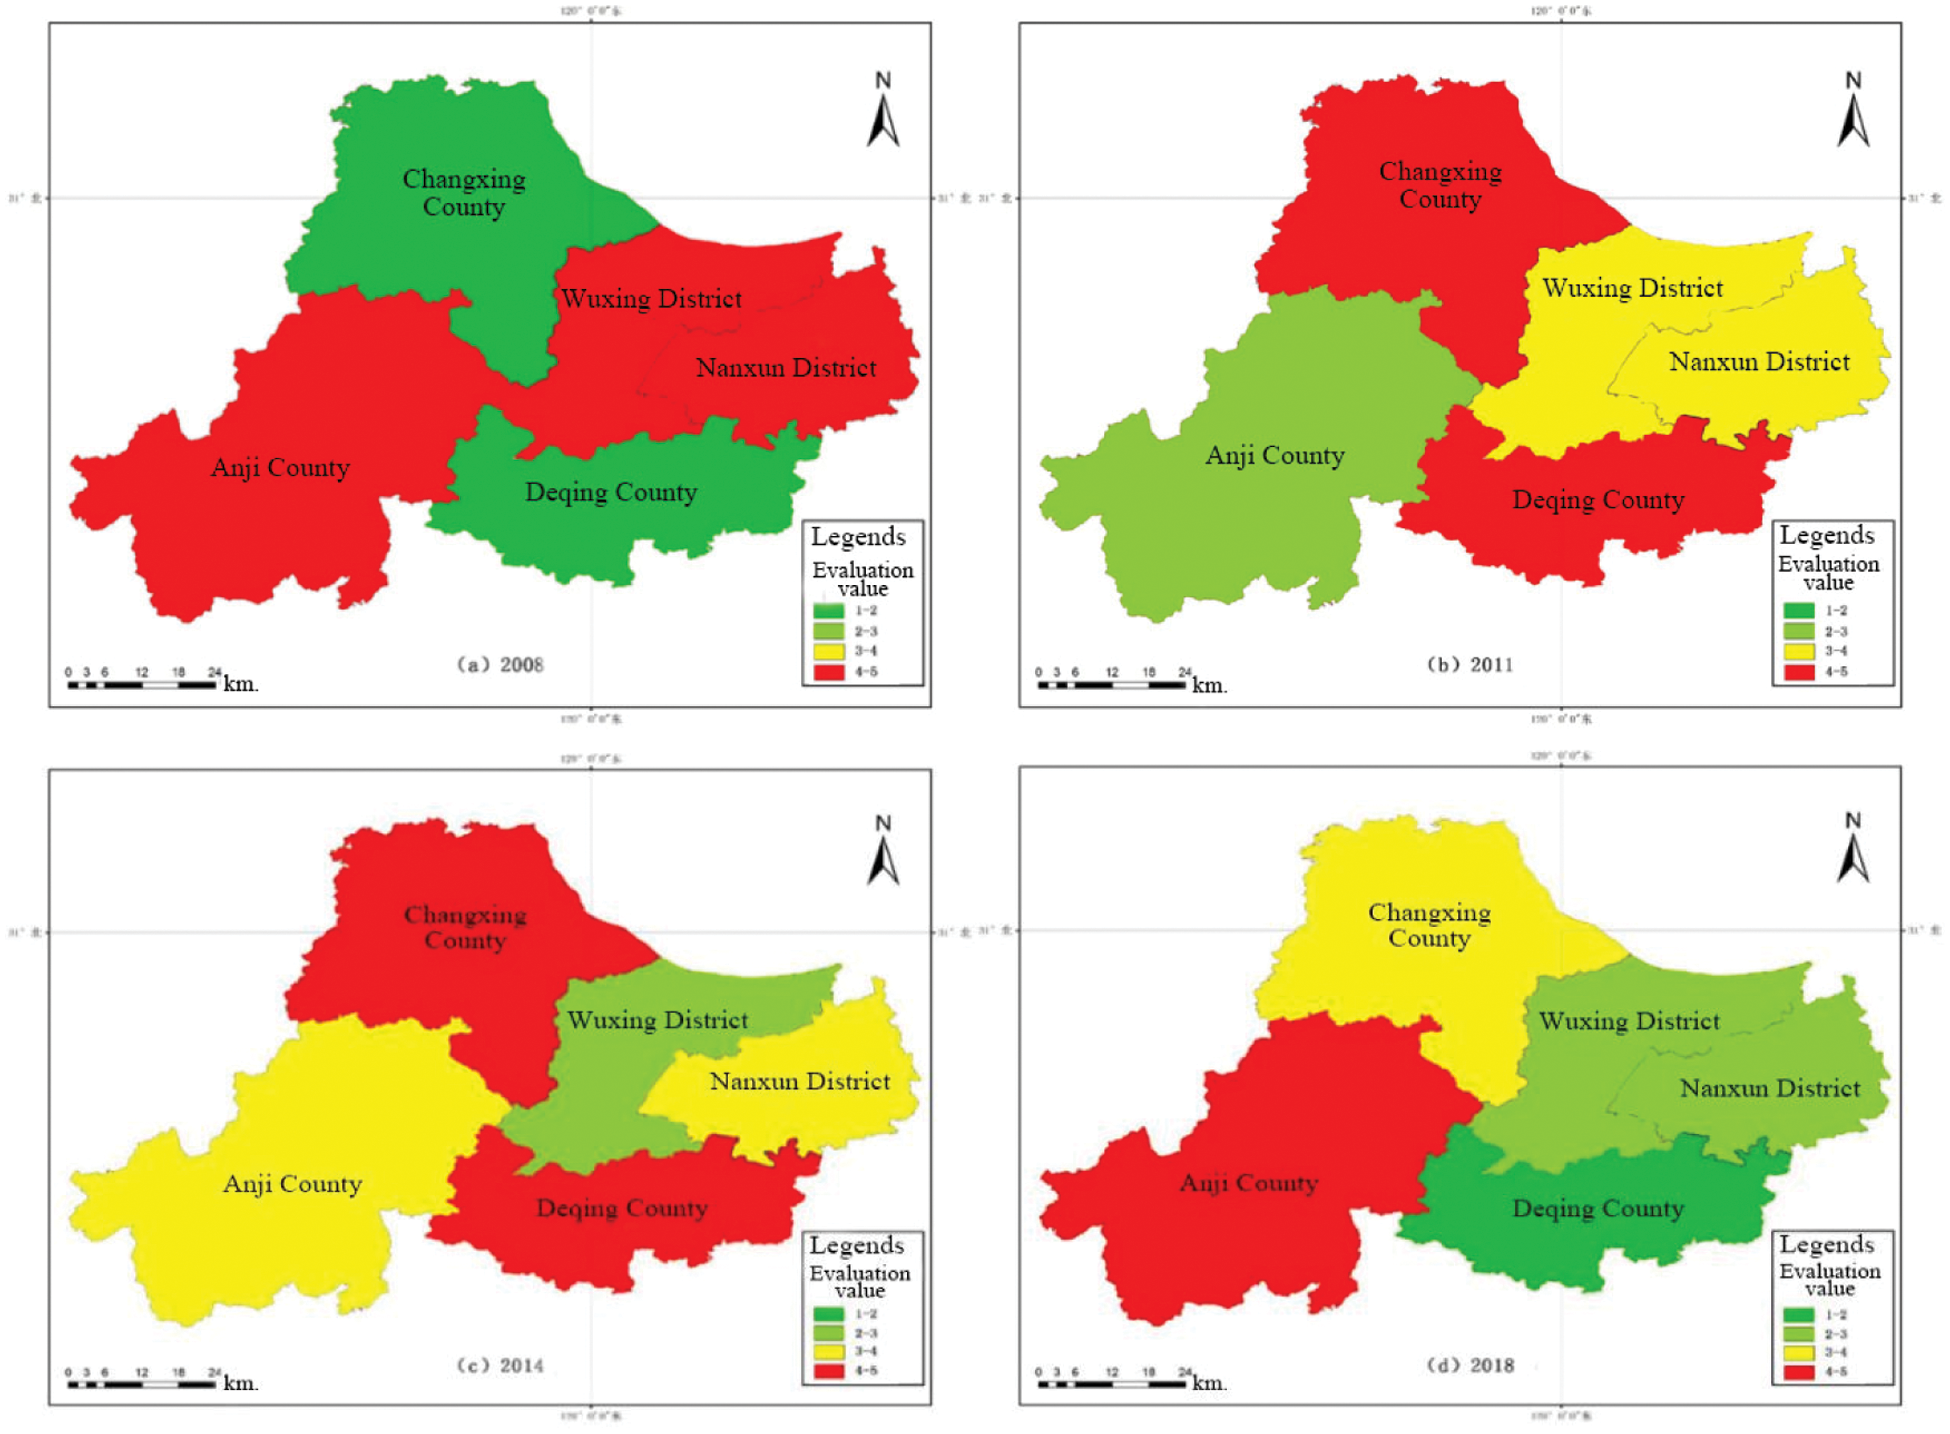
Figure 4: Evaluation value of the environments of the three counties and two districts in Huzhou City
There are two kinds of econometric models, one is based on time series data analysis, and the other is based on panel data analysis.
(1) The EKC model based on time series data analysis
The most representative relationship is a quadratic polynomial function shown in Eq. (3). It is a simplified measurement and commonly used.
where
(2) The model based on panel data analysis
Proposed by Bandyopadhyay and Shafik in 1992, the model further expands the scope of discussion based on the combination of the quadratic and cubic functions and the influence factors beyond GDP. The primary expression is shown as follows:
where
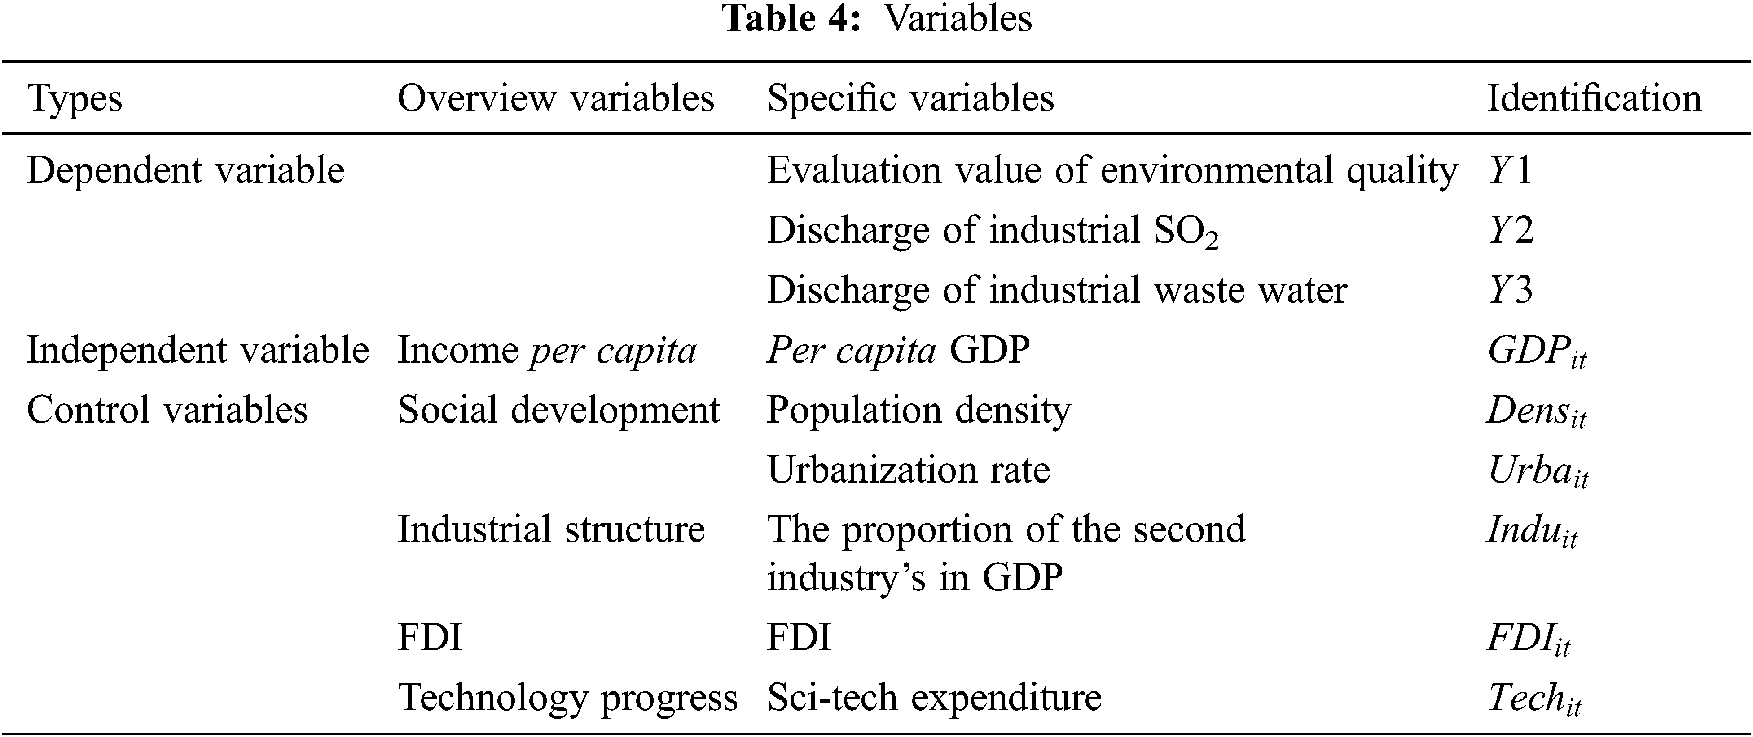
According to the EKC model, the regression accuracy can be assured with environmental quality as a dependent variable, income per capita as an independent variable, and social development, industrial structure, and FDI as control variables.
Comprehensiveness, comparability, and availability are taken into account for choosing data, which is mainly obtained from the statistical yearbook of Huzhou and the statistical bulletin of each county and district. The specific indexes are listed in Tab. 4.
An empirical analysis is performed by using Stata, a software for statistics and data science. The stability of the variables has to be tested first to avoid pseudo regression because there is a space dimension covering five regions, a time dimension covering eleven years, and six variables composed of one independent variable and five control ones. Two variable intercept models (the random utility model and the fixed-effect model) are used for regression because the individual members affect each other. Meanwhile, the Housman test is exploited to determine which model is to be used. If the Housman test is passed, then the fixed-effect model is adopted; otherwise, the random utility model is used.
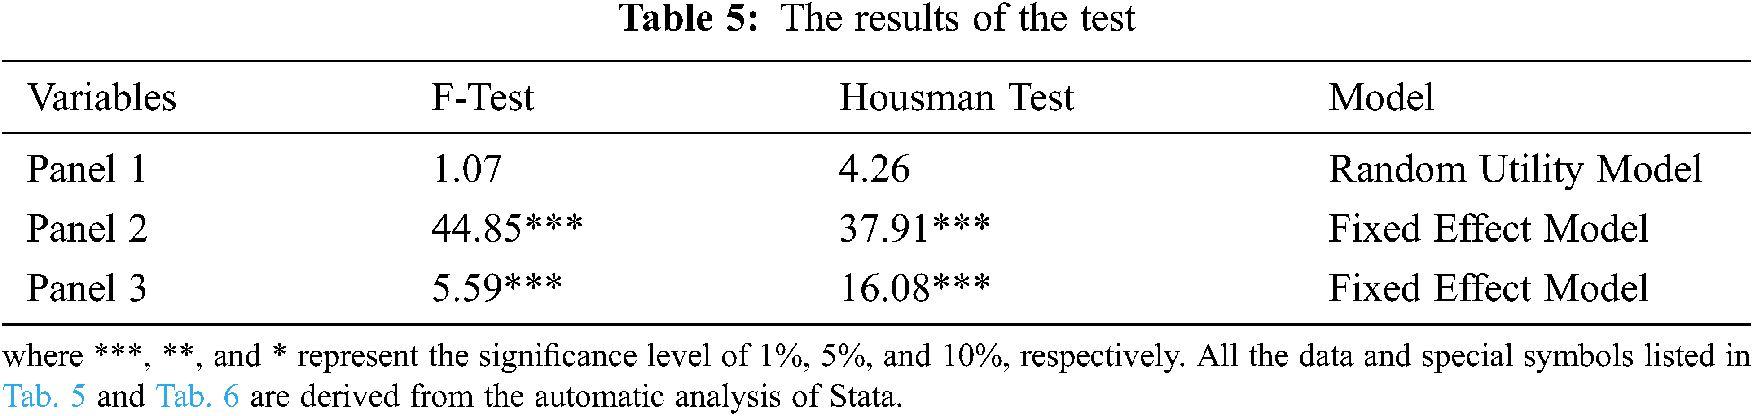
4.3.1 Stationary-Test and Housman-Test
All variables have to undergo a stationary test and pass it first. Then Housman test is conducted on these three models respectively. The testing results are listed in Tab. 5, which indicates that the random utility model is adopted in Panel 1 which represents the evaluation value of environmental quality, and the fixed-effect model is adopted in Panel 2 and 3 which represents the discharges of industrial SO2 and waste water respectively.
4.3.2 Panel Regression Analysis
The regression results are obtained by making empirical analysis on the three panels, as shown in Tab. 6.
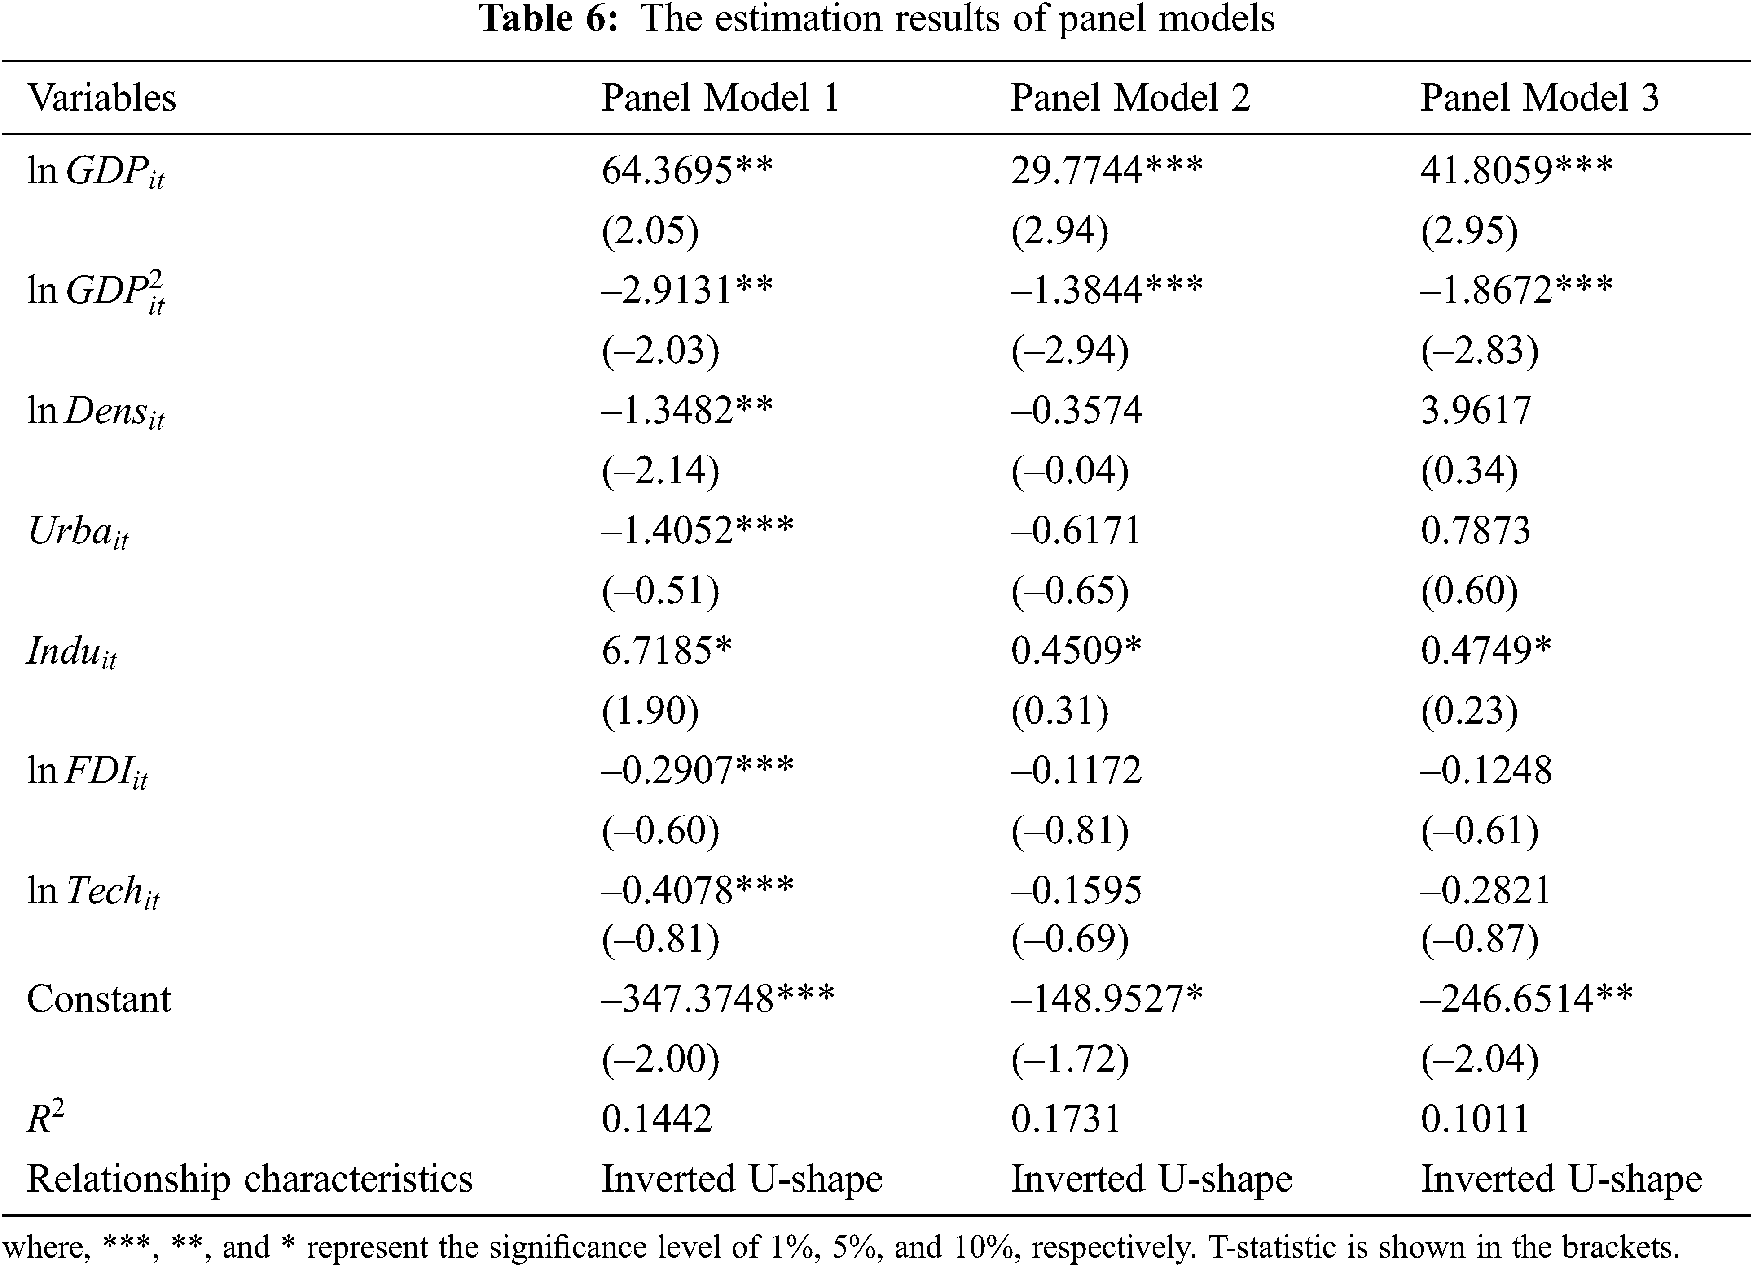
(1) Evaluation value of environmental quality and per capita GDP
The regression of Panel Model 1 is calculated through Eq. (5).
According to the regression result, a conclusion can be drawn that there is an inverted U-shaped relationship between the evaluation value of environmental quality and per capita GDP. The calculation of the result’s coefficient indicates that the inflection point is CNY 62943.95. When the income per capita exceeds the coefficient, the environment becomes better with the rising in income. The peak income (CNY 63719) appeared in 2012.
There are four groups of negative relationships between the evaluation value and: (1) the population density. The larger the population, the better the environment. It is mainly because of the enhanced awareness of environmental protection, and people prefer to residence in a better environment. (2) the urbanization rate. The higher the rate, the smaller the evaluation value, and the better the environment. In recent years, the idea of “Lucid water and lush mountains are invaluable assets” has prevailed in Huzhou, and the environment of this city becomes better and better with the continuous improvement in infrastructure, living conditions, and urban environment. (3) FDI. The higher the FDI, the better the environment. In the past years, the city has mainly focused on the third industry that produces no pollutants. The development of tourism can improve the environment. (4) the progress in technology. The more the expenditure on science and technology, the better the environment. The progress can not only reduce energy consumption and pollutants but also improve the energy efficiency and the control level of pollution.
However, there is a positive relationship between the evaluation value and the industrial structure. The proportion of the second industry in GDP has a negative effect on the environment because heavy industry with high pollution belongs to the second industry. The higher the proportion of the second industry, the more environmental pollution.
(2) Emission of industrial SO2 and per capita GDP
The regression of Panel Model 2 is calculated by Eq. (6).
According to the regression result, a conclusion can be drawn that most variables in Panel Model 2 are not as significant as those in Panel Model 1, and there is an inverted U-shaped relationship between the industrial SO2 emission and the rise of income per capita. CNY 46770.13 is the inflection point of the industrial SO2 emission, which is smaller than that of the evaluation value. When the income per capita exceeds the inflection point, the emission of industrial SO2 decreases with the rising income. The income per capita in Huzhou was CNY 42547 in 2009, and CNY 50146 in 2010. The peak emission emerged between the years 2009 and 2010.
There are also four groups of negative relationships between the SO2 emission and: (1) the population density. Generally, the greater the population density, the larger the SO2 emission. However, this convention does not hold for in Huzhou. On the contrary, the regions with higher population density have a better environment, and the SO2 emission is lowered because of the protection performed by the local government. (2) the urbanization rate. The larger the rate, the less the SO2 emission. Under the guidance of “Lucid water and lush mountains are invaluable assets”, the environment becomes better and better, and more support is provided by the local government. (3) FDI. The higher the FDI, the less the emission. Because FDI focuses mainly on the third industry, most of which is the service industry without emitting SO2 into the atmosphere. (4) the progress in technology. Effective protection works better with the support of advanced technology and equipment. The progress in technology can greatly reduce the emission of SO2.
However, there is also a positive relationship between the SO2 emission and the industrial structure. The proportion of the second industry in GDP adversely affects the environment of Huzhou. It is consistent with the traditional experience, which indicates that the emission increases with the second industry with heavy pollution.
(3) Discharge of industrial waste water and per capita GDP
The regression of Panel Model 3 is calculated through Eq. (7).
According to the regression result, a conclusion can be drawn that there is an inverted U-shaped relationship between the income per capita and the discharge of waste water. CNY 72692.97 is the inflection point. When the income per capita exceeds the inflection point, the discharge decreases with the rising income. The GDP per capita in Huzhou reached CNY 69213 in 2013, and CNY 74334 in 2014. The peak emission appeared between the years 2013 and 2014.
There are three groups of positive relationships between the discharge of waste water and: (1) the population density. The greater the population density, the larger the discharge. It is consistent with the traditional experience, which indicates that pollution becomes more serious with the increasing demand in consumption and the promoted production. (2) the urbanization rate. An increased urbanization rate results in a rise in industrial enterprises, and thus more industrial water and waste water. (3) the industrial structure. The proportion of the second industry in GDP has a negative influence on the environment. It is consistent with the traditional experience, which indicates that the discharge increases with the proportion of the second industry.
However, there are two groups of negative relationships between the discharge of waste water and: (1) FDI. The discharge is reduced with the increase of FDI. It is consistent with the traditional experience, which indicates that the emission increases with the proportion of the second industry. (2) the progress in technology. Effective protection can works better with the support of advanced technology and equipment.
4.3.3 Comprehensive Analysis on Panel Regression
Based on the regressions calculated above, Fig. 5 shows the fitting curves between per capita GDP and the evaluation value of environmental quality, the SO2 emission, and the waste water, respectively. The inflection points of the three inverted U-shaped curves are CNY 62943.95, CNY 46770.13, and CNY 72692.97, respectively. The curves show obviously that the environment in Huzhou is improved when the income per capita exceeds the inflection points.
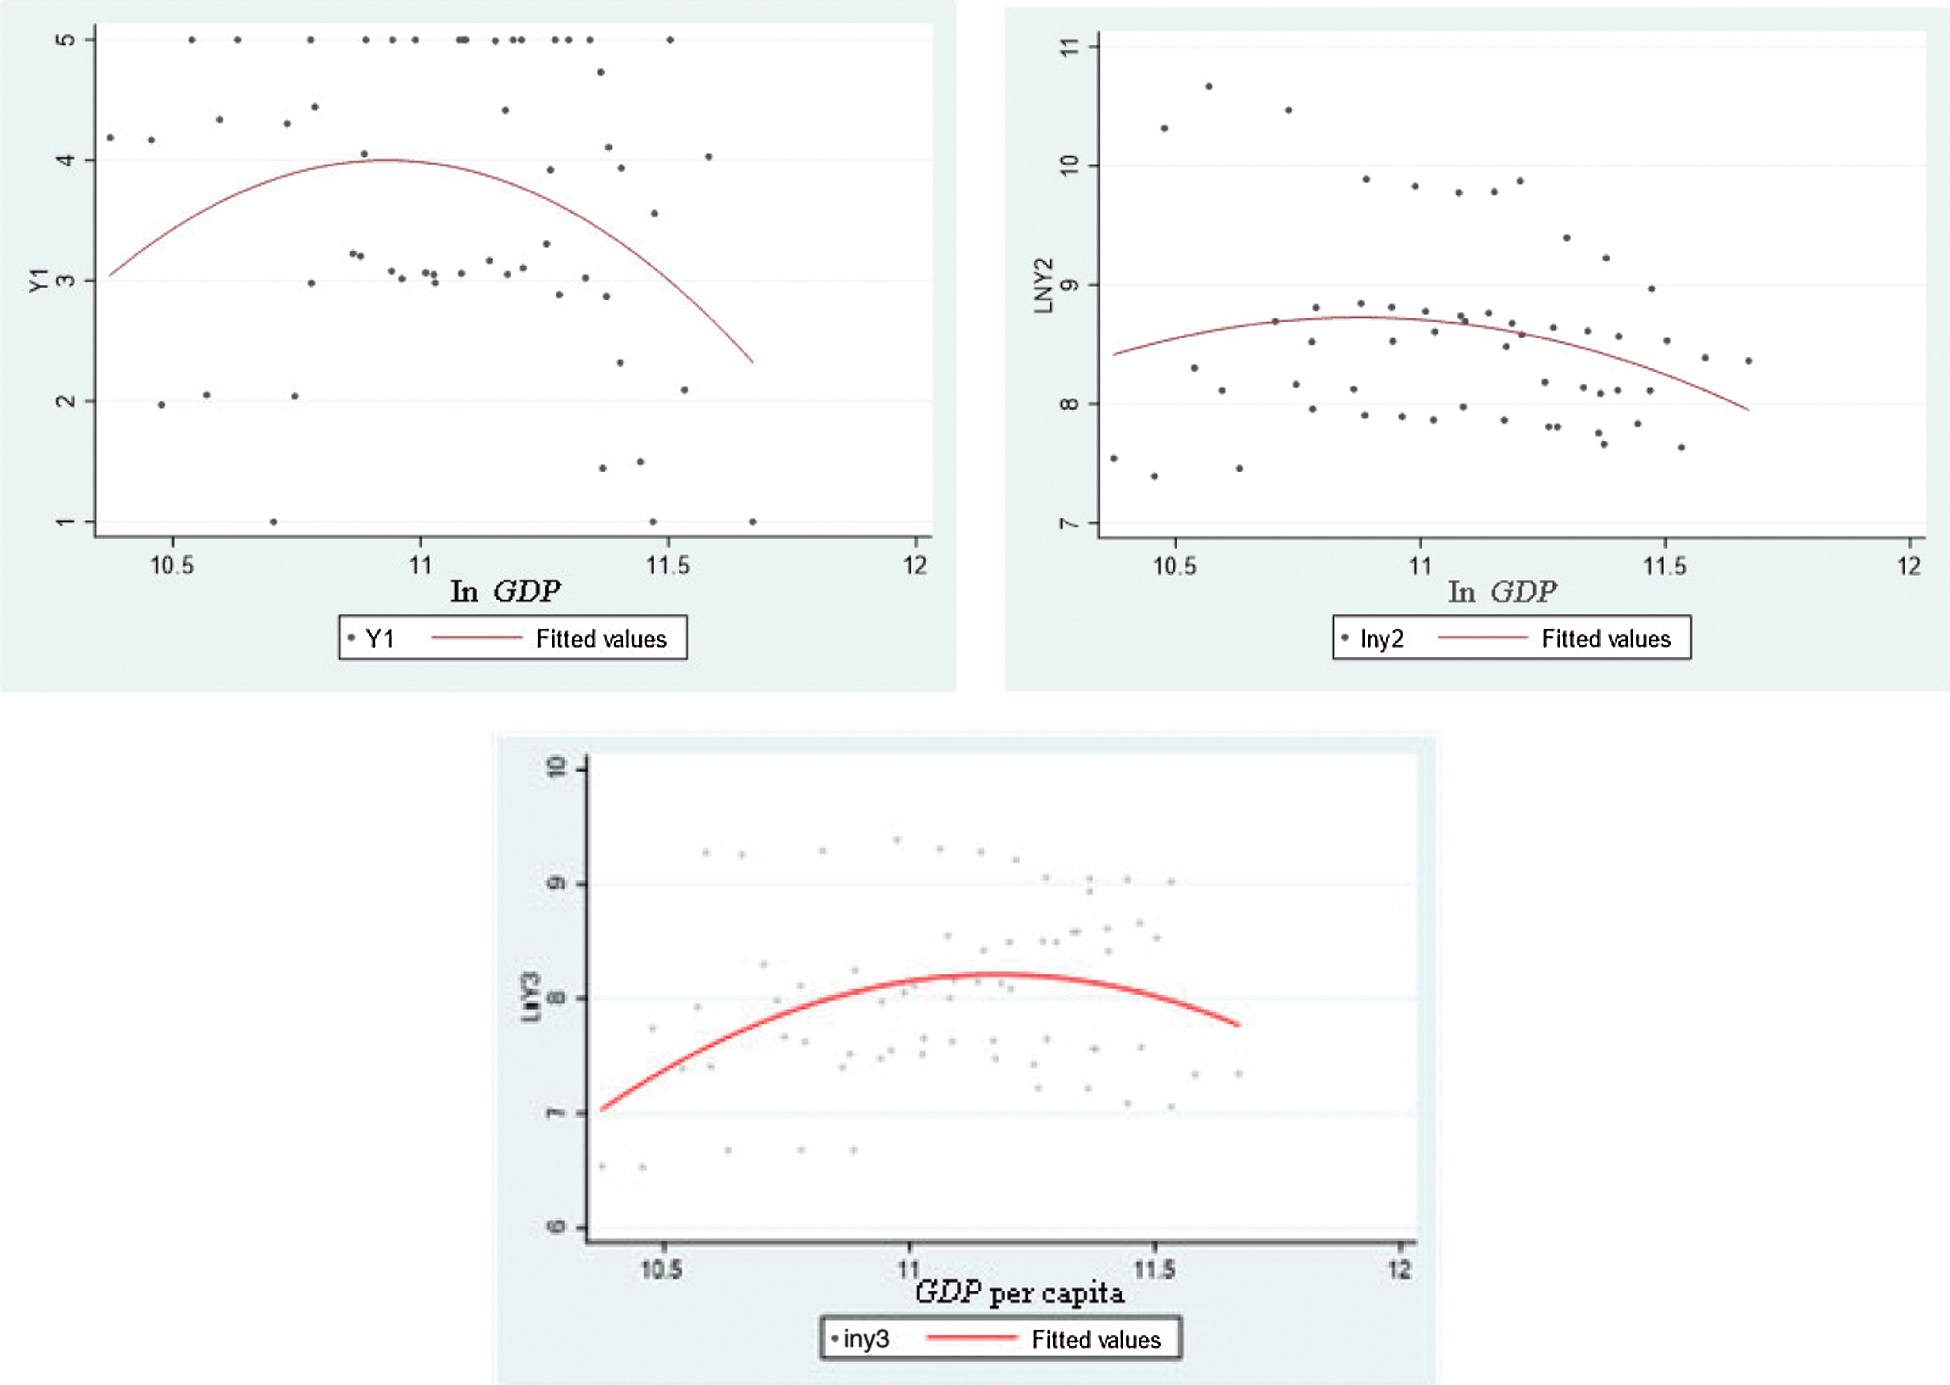
Figure 5: The relationships between environmental quality and economic growth
There is a significant and positive relationship between the proportion of the second industry and the environmental indexes. The pollution is mainly caused by the second industry, such as mining, manufacturing, power supply, gas, water supply, and construction. In this industry, a large amount of energy is consumed, and lots of waste gas, waste water, and solid waste are produced.
There are two groups of negative relationships between the environmental indexes and: (1) the progress in technology. The progress in science and technology can solve the current and potential problems in the environment, which helps to improve the environment greatly in the long term. (2) FDI. In the era of the new normal, Huzhou’s industrial structure is upgraded constantly. FDI focuses mainly on the third industry or high-end manufacturing with high technology and low pollution, which contributes to an enhanced environment.
The urbanization rate correlates positively to the SO2 emission but negatively to the discharge of waste water. It is because of people’s cognitive differences in pollutants. SO2 has been considered harmful and controlled effectively for a long time, while the waste water hasn’t received much attention from the local government until rich nutrition emerges in it.
There is a significant difference in space and time dimensions of environmental quality. In the space dimension, the environmental quality relates closely to the economic growth; in the time dimension, the average value of environmental quality was 3.32 in 2008 and fluctuated from 3.7 to 3.8 in the year between 2010 and 2012, and even decreased steadily in the next few years. Meanwhile, an inverted U-shaped relationship exists between economic growth and evaluation value, SO2 emission, and discharge of industrial waste water. The inflection point of income in the environmental Kuznets curve in the model which takes the evaluation value of the environmental quality as a dependent variable (CNY 62943.95) is higher than that of the model which takes SO2 emission as an independent variable (CNY 46770.13). The empirical results indicate that the pollutants are mainly caused by the second industry. For every percentage increase of the proportion of the second industry in GDP, the SO2 emission will increase by 0.451% and the waste water by 0.475%.
Future improvements of this study lies in the accurate data. Also, more samples are needed because the limitation of choosing samples can lead to a subjective bias in the empirical results.
Acknowledgement: We appreciate the linguistic assistance provided by TopEdit (www.topeditsci.com) during the preparation of this manuscript.
Funding Statement: This work is supported by the project of Philosophy and Social Science Planning in Huzhou city (No. 20hzghy079). Na Li received the grant, and the URL to the sponsor’s website is http://www.hzskw.net/. This work is supported by the project of School-enterprise Cooperation of Visiting engineers in Colleges and Universities in Zhejiang (No. FG 2020164). Baiqing Zhou received the grant, and the URL to sponsor’s websites is http://szpx.zjnu.edu.cn/2020/1225%20/c2150a342005/page.psp. This work is also supported by the project of the soft science research program of Zhejiang (No. 2021C35007). Duan Lu received the grant, and the URL to the sponsor’s website is http://kjt.zj.gov.cn/art/2020/11/30/.
Conflicts of Interest: We declare that we have no conflicts of interest to report regarding the present study.
1. J. Roca and M. Serrano, “Income growth and atmospheric pollution in Spain: An input-output approach,” Ecological Economics, vol. 63, no. 01, pp. 230–242, 2007. [Google Scholar]
2. Y. Ren, J. Qi, Y. Cheng, J. Wang and O. Asama, “Digital continuity guarantee approach of electronic record based on data quality theory,” Computers Materials & Continua, vol. 63, no. 3, pp. 1471–1483, 2020. [Google Scholar]
3. J. Wang, W. Chen, L. Wang, Y. Ren and R. S. Sherratt, “Blockchain-based data storage mechanism for industrial Internet of Things,” Intelligent Automation & Soft Computing, vol. 26, no. 5, pp. 1157–1172, 2020. [Google Scholar]
4. D. Guan, W. Gao and H. Fukahori, “Modeling the relationship between economic growth, resource consumption and environment pollution by system dynamics model,” Journal of Architecture& Planning, vol. 75, no. 75, pp. 165–174, 2010. [Google Scholar]
5. C. Ge, Z. Liu, J. Xia and L. Fang, “Revocable identity-based broadcast proxy re-encryption for data sharing in clouds,” IEEE Transactions on Dependable and Secure Computing, vol. 19, no. 3, pp. 1–12, 2019. [Google Scholar]
6. T. Li, Y. Ren and J. Xia, “Blockchain queuing model with non-preemptive limited-priority,” Intelligent Automation & Soft Computing, vol. 26, no. 5, pp. 1111–1122, 2020. [Google Scholar]
7. A. Leitao, “Corruption and the environmental Kuznets curve: Empirical evidence for sulfur,” Ecological Economics, vol. 69, no. 11, pp. 2191–2201, 2010. [Google Scholar]
8. L. Xiang, W. Wu, X. Li and C. Yang, “A linguistic steganography based on word indexing compression and candidate selection,” Multimedia Tools and Applications, vol. 77, no. 5, pp. 28969–28989, 2018. [Google Scholar]
9. Y. Ren, J. Qi, Y. Liu, J. Wang and G. Kim, “Integrity verification mechanism of sensor data based on bilinear map accumulator,” ACM Transactions on Internet Technology, vol. 21, no. 1, pp. 1–19, 2021. [Google Scholar]
10. L. Fang, C. Yin, L. Zhou, Y. Li, C. Su et al., “A physiological and behavioral feature authentication scheme for medical cloud based on fuzzy-rough core vector machine,” Information Sciences, vol. 507, pp. 143–160, 2020. [Google Scholar]
11. Y. Zhang, P. Bolin, J. Li and G. Alun, “The relationship analysis between Chinese industrial water use and economic growth based on the Kuznets curve,” Resources Science, vol. 39, no. 6, pp. 1117–1126, 2017. [Google Scholar]
12. H. Dai, T. Sun, L. Bai and K. Zhang, “A research on the impact of environmental pollution on regional economic development—Based on cointegration analysis and ridge regression analysis,” East China Economic Management, vol. 29, no. 1, pp. 62–67, 2015. [Google Scholar]
13. Y. Mao, J. Zhang, H. Qi and L. Wang, “DNN-MVL: DNN-multi-view-learning-based recover block missing data in a dam safety monitoring system,” Sensors, vol. 19, no. 13, pp. 1–22, 2019. [Google Scholar]
14. Y. Zhou, X. Zhao, S. Liu, X. Long and W. Luo, “A time-aware searchable encryption scheme for EHRs,” Digital Communications and Networks, vol. 5, no. 3, pp. 170–175, 2019. [Google Scholar]
15. C. P. Ge, W. Susilo, J. Baek, Z. Liu, J. Xia et al., “Revocable attribute-based encryption with data integrity in clouds,” IEEE Transactions on Dependable and Secure Computing, vol. 21, no. 3, pp. 1–12, 2021. [Google Scholar]
16. H. Yang and L. Zhang, “An empirical study of the impact of evolution of industrial structure and urbanization on air quality in Beijing-Tianjin-Hebei Region,” China Population, Resources and Environment, vol. 28, no. 6, pp. 111–119, 2018. [Google Scholar]
17. J. Xu, L. Wei, A. Wang, Y. Zhang, F. Zhou et al., “Dynamic fully homomorphic encryption-based Merkle tree for lightweight streaming authenticated data structures,” Journal of Network and Computer Applications, vol. 107, no. 8, pp. 113–124, 2018. [Google Scholar]
18. Y. Ren, Y. Leng, J. Qi, K. S. Pradip, J. Wang et al., “Multiple cloud storage mechanism based on blockchain in smart homes,” Future Generation Computer Systems, vol. 115, pp. 304–313, 2021. [Google Scholar]
19. C. Ge, W. Susilo, Z. Liu, J. Xia and P. Szalachowski, “Secure keyword search and data sharing mechanism for cloud computing,” IEEE Transactions on Dependable and Secure Computing, vol. 20, no. 8, pp. 1–12, 2020. [Google Scholar]
20. S. Dessus and M. Bussolo, “Is there a trade-off between trade liberalization and pollution abatement: A computable general equilibrium assessment applied to Costa Rica,” Journal of Policy Modeling, vol. 20, no. 1, pp. 11–31, 1998. [Google Scholar]
21. C. Wang, J. Chen and J. Zou, “Impact assessment of CO2 mitigation on China economy based on a CGE model,” Tsinghua Univ (Sci & Tech), vol. 45, no. 12, pp. 1621–1624, 2005. [Google Scholar]
22. Y. Zhou, X. Long, L. Chen and Z. Yang, “Conditional privacy-preserving authentication and key agreement scheme for roaming services in VANETs,” Journal of Information Security and Applications, vol. 47, no. 8, pp. 295–301, 2019. [Google Scholar]
23. J. Y. Ren, Y. Leng, Y. Cheng and J. Wang, “Secure data storage based on blockchain and coding in edge computing,” Mathematical Biosciences and Engineering, vol. 16, no. 4, pp. 1874–1892, 2019. [Google Scholar]
24. S. Zeng, Y. Mu, M. He and Y. Chen, “New approach for privacy-aware location-based service communications,” Wireless Personal Communications, vol. 101, no. 2, pp. 1057–1073, 2018. [Google Scholar]
25. L. Fang, Y. Li, X. Yun, Z. Wen, S. Ji et al., “THP: A novel authentication scheme to prevent multiple attacks in SDN-based IoT network,” IEEE Internet of Things Journal, vol. 7, no. 7, pp. 5745–5759, 2020. [Google Scholar]
26. L. Zhou and X. Bao, “Estimation of Kuznets curve of China’s environment,” Science & Technology Review, vol. 20, no. 4, pp. 57–58, 2002. [Google Scholar]
27. Y. Chang, S. Zhang, G. Wan, L. Yan, Y. Zhang et al., “Practical two-way QKD-based quantum private query with better performance in user privacy,” International Journal of Theoretical Physics, vol. 58, no. 7, pp. 2069–2080, 2019. [Google Scholar]
28. Y. Ren, F. Zhu, K. S. Pradip, J. Wang, T. Wang et al., “Data query mechanism based on hash computing power of blockchain in Internet of Things,” Sensors, vol. 20, no. 1, pp. 1–22, 2020. [Google Scholar]
29. R. Li and H. Zhang, “An empirical analysis on the regional discrepancy and tendency of EFC in China,” Journal of Xi’an Jiaotong University (Social Sciences), vol. 28, no. 29, pp. 35–43, 2008. [Google Scholar]
30. W. Wan, J. Chen and S. Zhang, “A cluster correlation power analysis against double blinding exponentiation,” Journal of Information Security and Applications, vol. 48, no. 10, pp. 1–8, 2019. [Google Scholar]
31. G. Xu, X. Li, L. Jiao, W. Wang, A. Liu et al., “BAGKD: A batch authentication and group key distribution protocol for VANETs,” IEEE Communications Magazine, vol. 58, no. 7, pp. 35–41, 2020. [Google Scholar]
32. Z. Jing, C. Gu, Y. Li, M. Zhang, G. Xu et al., “Security analysis of indistinguishable obfuscation for internet of medical things applications,” Computer Communications, vol. 161, no. 7, pp. 202–211, 2020. [Google Scholar]
33. B. Li and T. Li, “An empirical study of the environmental Kuznets curve for China’s air pollution by GMM model and threshold effect with dynamic panel data,” On Economic Problems, vol. 14, no. 4, pp. 17–22, 2014. [Google Scholar]
34. J. Wang, Y. Gao, W. Liu, A. K. Sangaiah and H. Kim, “An intelligent data gathering schema with data fusion supported for mobile sink in wireless sensor networks,” International Journal of Distributed Sensor Networks, vol. 15, no. 3, pp. 1–9, 2019. [Google Scholar]
35. J. Y. Ren, Y. Liu, S. Ji, A. K. Sangaiah and J. Wang, “Incentive mechanism of data storage based on blockchain for wireless sensor networks,” Mobile Information Systems, vol. 2018, no. 8, pp. 1–10, 2018. [Google Scholar]
36. D. Liu and M. Ye, “Review of research on recurrent neural network and its applications,” Journal of Chinese Computer System, vol. 41, no. 10, pp. 2024–2027, 2020. [Google Scholar]
37. Y. Tian, Z. Wang, J. Xiong and J. Ma, “A blockchain-based secure key management scheme with trustworthiness in DWSNs,” IEEE Transactions on Industrial Informatics, vol. 16, no. 9, pp. 6193–6202, 2020. [Google Scholar]
38. J. Zhang, “Reseach on prediction of stock price fluctuation by financial index- Based on PCA-BP neural network,” Ph.D. dissertation. Chongqing University of Technology and Business, China, 2019. [Google Scholar]
39. Y. Ren, K. Zhu, Y. Gao, J. Xia, S. Zhou et al., “Long-term preservation of electronic record based on digital continuity in smart cities,” Computers Materials & Continua, vol. 66, no. 3, pp. 3271–3287, 2021. [Google Scholar]
40. J. Xiao, “Research on the performance evaluation of supplier for telecom operating enterprises based on BP neural network,” Ph.D. dissertation. Beijing University of Posts and Telecommunications, China, 2019. [Google Scholar]
41. Y. Liu, “Research on financial risk evaluation of internet listed companies based on BP neural network,” Ph.D. dissertation. Jiangsu University, China, 2019. [Google Scholar]
42. N. Li and W. Wei, “Research on the impact of international competitiveness of China’s trade in producer Services-empirical analysis based on BP neural network,” Science & Technology and Economy, vol. 33, no. 4, pp. 106–110, 2020. [Google Scholar]
 | This work is licensed under a Creative Commons Attribution 4.0 International License, which permits unrestricted use, distribution, and reproduction in any medium, provided the original work is properly cited. |