DOI:10.32604/csse.2022.019366
| Computer Systems Science & Engineering DOI:10.32604/csse.2022.019366 | |
| Article |
Detection of Fuel Adulteration Using Wave Optical with Machine Learning Algorithms
1Department of Instrumentation and Control Engineering, Sri Krishna College of Technology, Coimbatore, 641105, Tamilnadu, India
2Department of Physics, University College of Engineering, Nagercoil, 629004, Tamilnadu, India
*Corresponding Author: S. Dilip Kumar. Email: sdilipkumarresearch@gmail.com
Received: 11 April 2021; Accepted: 08 June 2021
Abstract: Fuel is a very important factor and has considerable influence on the air quality in the environment, which is the heart of the world. The increase of vehicles in lived-in areas results in greater emission of carbon particles in the environment. Adulterated fuel causes more contaminated particles to mix with breathing air and becomes the main source of dangerous pollution. Adulteration is the mixing of foreign substances in fuel, which damages vehicles and causes more health problems in living beings such as humans, birds, aquatic life, and even water resources by emitting high levels of hydrocarbons, nitrogen oxides, and carbon monoxide. Most frequent blending liquids are lubricants and kerosene in the petrol, and its adulteration is a considerable problem that adds to environmental pollution. This study focuses on detecting the adulteration in petrol using sensors and machine learning algorithms. A modified evanescent wave optical fiber sensor with discrete wavelet transform is proposed for classification of adulterated data from the samples. Furthermore, support vector machine classifier is used for accurate categorization. The sensor is first tested with fuel and numerical data is classified based on machine learning algorithms. Finally, the result is evaluated with less error and high accuracy of 99.9%, which is higher than all existing techniques.
Keywords: Petrol; adulteration; discrete wavelet transform; modified evanescent wave optical fiber; SVM classifier
Detection of fuel adulteration is tedious because the contaminated solvents have similar chemicals as with pure fuel. The reason for adulteration is the price variation of these fuels. Comparatively, gasoline has a higher price than petrol, which in turn is higher than kerosene. Adulterated fuels that spread in the market leads to vehicle problems and health hazards. In the last four years, among the 4380 cases on fuel adulteration, 33 retail banks have been permanently closed. Adulterated petrol with kerosene or diesel produces high dangerous levels of hydrocarbons (HC), nitrogen oxides (NOx), and carbon monoxide (CO) that create health problems in society.
The pollutant produced from petrol adulteration leads to cancer. Greenhouse gases increase due to automobile emissions, the main reason of which is fuel adulteration. Given its low cost, kerosene solvent is used to mix with petrol and diesel [1]. Such adulteration leads to reduced engine performance and also affects other physical components of automobiles. In addition, adulteration of kerosene with petrol and diesel causes an increase in sulphur. The shortage of kerosene for poor people forces them to use wood by cutting down trees, which also leads to increasing air pollution. Fuel adulteration is divided into gasoline and diesel. Solvents such as toluene or xylene are added to gasoline. High quantity of this adulterant increases the HC, CO, and NOx emissions [2]. Hence, fuel adulteration directly and indirectly causes many issues to automobiles, humans, and society. Prevention of this fuel adulteration requires good mathematical modelling techniques. In this study, the objectives are to:
• Prove that petroleum fuels are targets for adulteration, which affects the automobile engine performance, the environment, and humans
• Develop statistical, analytical, and data mining model to prevent fuel adulteration
• Prevent fuel adulteration at the distribution point through essential monitoring of fuel quality
• To develop a portable, efficient, fast, and robust fuel adulteration especially for petrol adulteration with the formation of optical sensor, feature extraction, and classification techniques.
Contribution of Proposed System
• Prevent petrol adulteration at the distribution point by consequent monitoring of fuel quality. The monitoring equipment must be portable, efficient, fast and robust.
• Machine learning classifier is used for separating adulterated petrol using voltage value and refractive index (RI).
• The accuracy of classification and performance is increased by using Discrete Wave Transform (DWT) with Support Vector Machine (SVM).
Fuel adulteration can be prevented by developing a simple, portable, and effective sensor with data mining algorithms. With this in mind, a review of relevant literature is carried out. Barra et al. [3] proposed to discriminate gasoline adulteration with diesel using Fourier transform infrared spectroscopy, which is associated with chemo metric tools with the concentration on Principal Component Analysis (PCA) and Partial Least Squares Regression (PLSR). For the experiment, 100 mixtures are taken and Fourier-transform infrared fingerprints are noted for all the data samples. The purpose of PCA and PLSR is to check outliers and detect gasoline adulteration. PLSR with infrared can identify adulteration with an accuracy of 98% and a minimum error of 0.63.
The concentration of the sensor medium is directly proportional to the Biswas et al. [4] proposed two schemes to measure the solvent concentration with respect to response through intensity reflection. First, the cladding of the sensor is varied using fossil fuels with the evanescent field. Second, the analyte is measured using the displacement scheme. The sensitivity of both cases are computed, evaluated, and compared. The evanescent setup performs better than the displacement.
Boruah et al. [5] reported an ecofriendly and effective colorimetric method for adulteration. With the consideration of the arsenic sample, a color change from yellow to blue indicates the combination of PEG nanoparticles. The absorption measured using UV-Vis and the result of detection of sensing unit is 1 ppb and better linearity as ~0.99.
Mendes et al. [6] used distillation curves with PCA and PLS Discriminant Analysis (DA) to propose the efficient sensitivity model for gasoline adulteration and obtained a 97% accuracy. PLS–DA has low error, detects the adulterant as fast as other methods, and is applied on the distillation curves for analysis and process speedup. Ganesan et al. (2019) proposed a thermal image processing-based fuel adulteration using Gray level co-occurrence matrix to detect the adulterated fuel of the input data sample with an accuracy of 98%.
Mabood et al. [7] proposed a fiber optic surface plasmon resonance to detect petrol adulteration using RI measurement and wavelength in SPR curve in the sensing probe. For optical fiber, mathematical simulation is performed to improve the sensor parameters using the SPR principle. The coating of the sensor fiber is moved to form the core circumference. The results obtain high accuracy and fast online detection of petrol adulteration.
Padmakarrao et al. [8] developed an optical sensor-based PIC microcontroller to detect petrol adulteration. A sensor light illuminates depending on the level of adulteration in the fuel. Vempatapu et al. [9] proposed the physic chemical, chromatographic, and spectroscopic techniques to detect gasoline adulteration. In addition, various properties of physic chemical have been measured. A clear review on gasoline adulteration and monitoring is provided.
Pathak et al. [10] used the finite element method to detect the various concentrations of the kerosene in petrol. The theoretical analysis is consistent with experimental results. The good sensor has high sensitivity, simplicity, robustness, and fast response time. Dilipkumar et al. [11] proposed a robust optical sensor for fuel adulteration using lightweight optical fiber sensor. Results show high performance, low attenuation, and environment friendly setup. Distilled curve with PCA and SVM is used as a data mining technique for detection of fuel adulteration.
3 Proposed Methodology (Modified Evanescent Wave Optical Sensor + DWT + SVM)
Fuel adulteration—such as petrol with kerosene, gasoline with diesel, diesel with kerosene—in the automobile industry leads to increased consequent illness on public health. Fuel adulteration is also difficult to detect because its combinations differ in structure. Mixing kerosene with petrol is also an indirect cause of air pollution. Prevention of adulteration at the distribution point itself is highly essential, and requires a consequent monitoring of fuel quality. Such monitoring equipment must be portable, efficient, fast, and robust. In this study, we develop a portable petrol adulteration detection system based on evanescent wave light weight optical fiber sensor due to its high performance with low attenuation. The distilled curve with DWT is used for feature extraction. Once the features are extracted, a standard SVM is used for classification to predict the correct adulterated petrol. Fig. 1 shows the overall architecture of the proposed system.
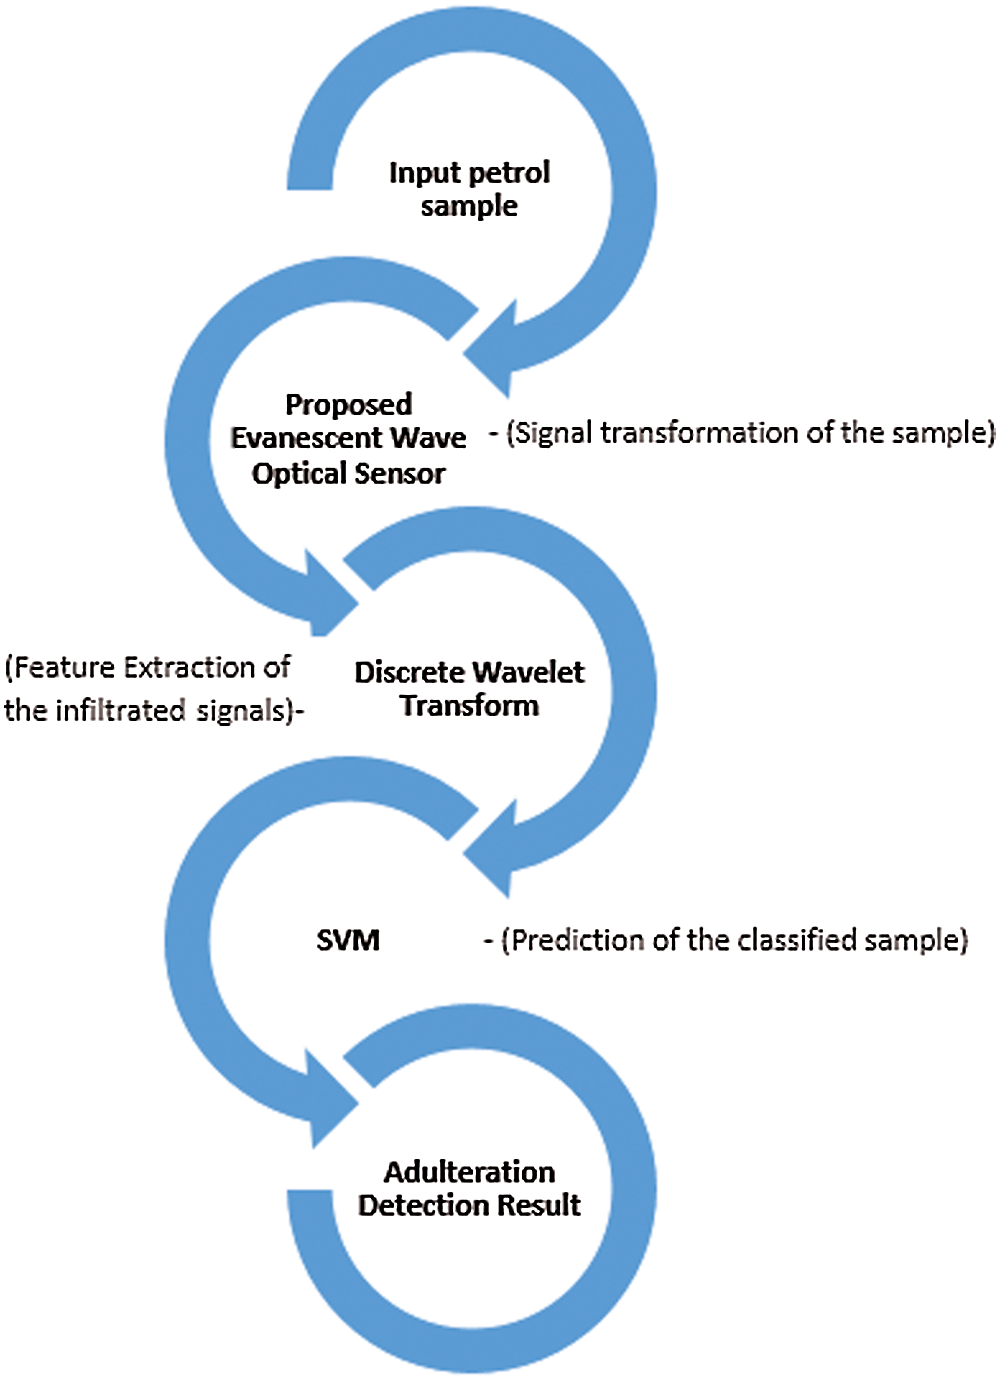
Figure 1: Overview of the proposed architecture
The input petrol sample is fed into the proposed evanescent wave optical fiber sensor to measure the solvent concentration through intensity examination. The infiltrated signals are given as input to the feature extraction algorithm then embed in the signal to reduce loss. The reduced features of the sample is then passed on to SVM, a well-known machine learning classifier algorithm for better prediction. In this proposed system, the extracted data are classified with SVM to distinguish the adulterated petrol from pure ones.
3.1 Modified Evanescent Wave Optical Fiber Sensor
Optical sensors for fuel adulteration have developed in the past decade and are used in this study. To enhance the sensitivity, we change the optical sensor structure with compact and robust evanescent wave structure. The RI is the base to detect adulteration. RI is directionally proportional to the device concentration. The measurement of solvent contribution to the fuel is carried out through intensity examination and the result is classified through SVM.
To detect the solvent in petrol adulteration, we use the modified intensity sensor based on evanescent wave. The cladding of the optical fiber sensor is replaced with the multimode fiber with absorbing fluid. Fig. 2 shows the proposed modified evanescent wave optical sensor, which is less breakable and has rapid response time.
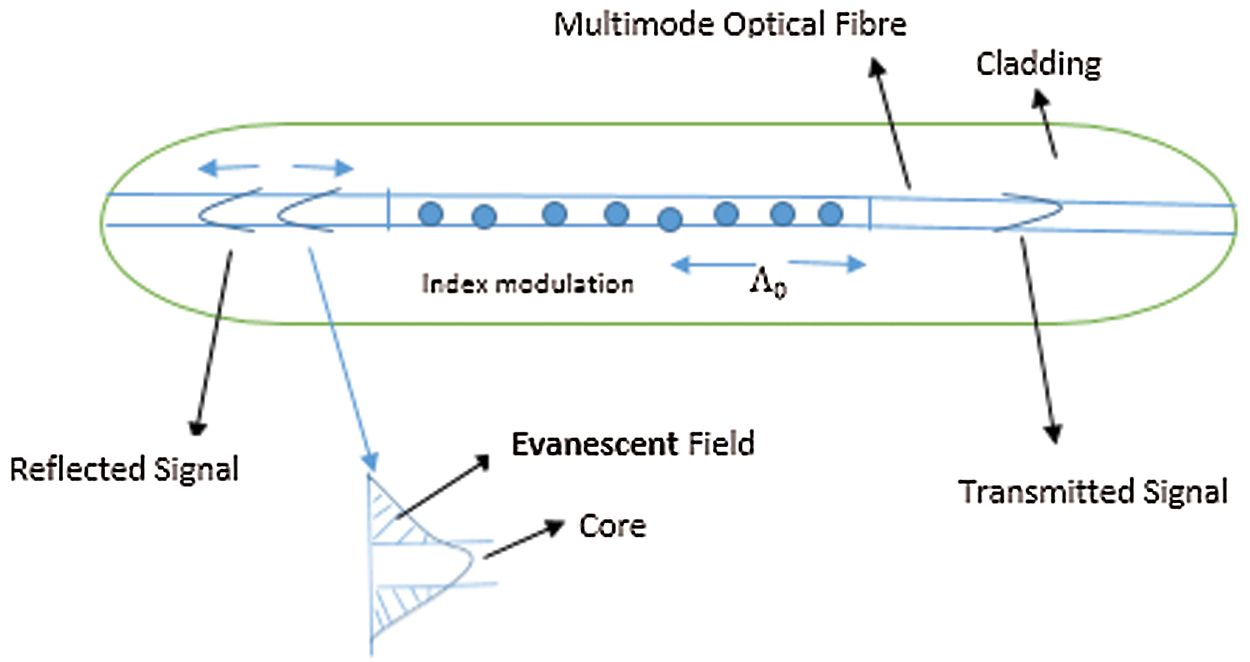
Figure 2: Evanescent wave optical fiber sensor for fuel adulteration
The light signal of the optical fibers is communicated to each other using the long thin glass organized element. Optical fiber consists of core layer, buffer coating (outer layer), and cladding. The core is the center part of the fiber, which is made up of tiny glass where the light travels. The core layer is surrounded by the cladding that replicates and transmits the light back to the core. Here, the evanescent field is applied. The outer layer is a plastic coating that protects the sensor form external damages. If
where L = length of the unclad portion and
where n in vacuum value is 1. If the speed of the light changes, then the wavelength also changes as
The radius of the fiber core is r and RIs for both mediums are n1 and n2, then the evanescent parameters are
where
The overall absorption coefficient v and sensitivity is calculated using Eqs. (5) and (6).
In this study, we use two sensors for emitting and receiving fiber and the concentration of the absorption coefficient varies in the medium. In a refracted ray, the largest angle incidence is called critical angle. The input sample signals are entered in one end of the sensor fiber and exit from the other end. Fig. 3 shows the fuel adulteration detection using this modified evanescence wave optical fiber sensor.
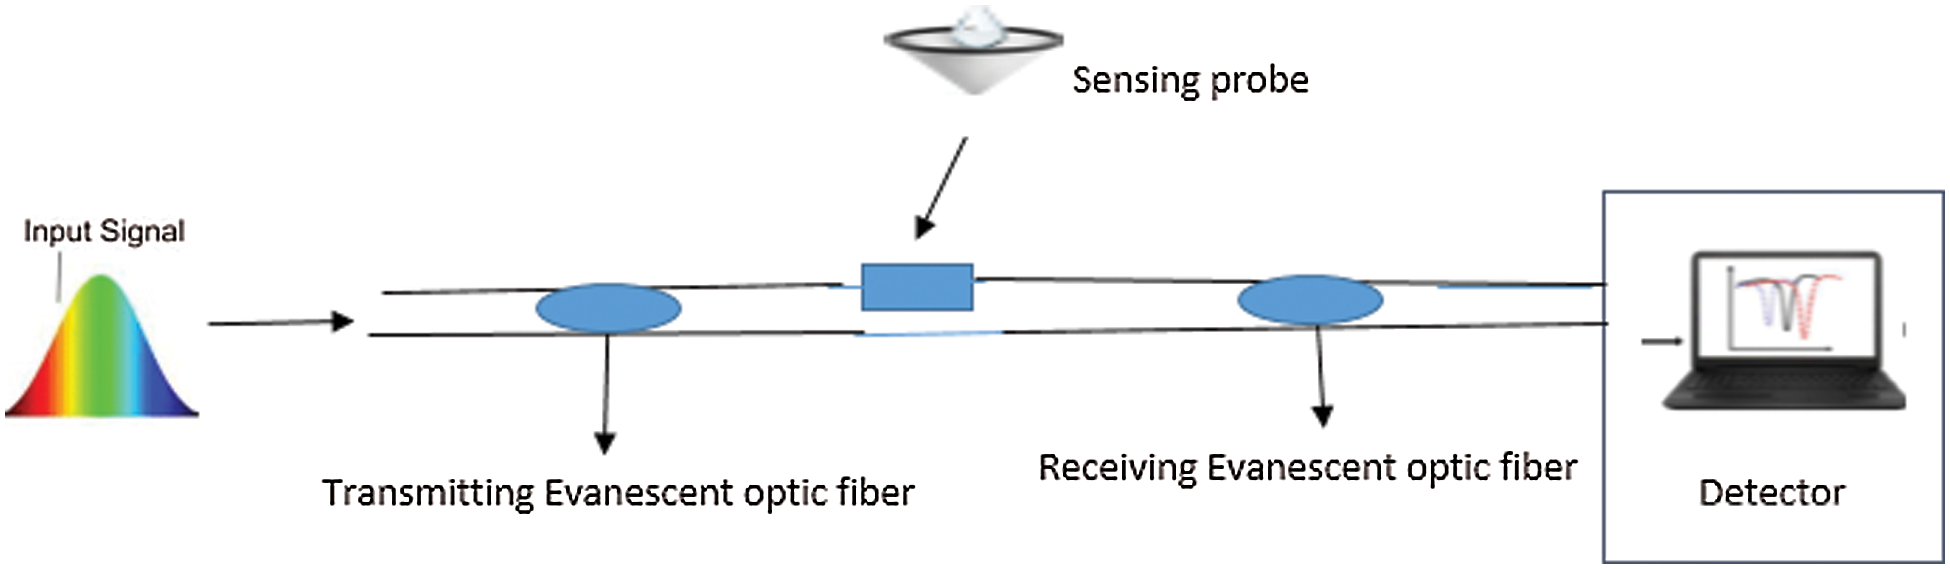
Figure 3: Setup of portable fuel adulteration with proposed sensor
The proposed setup for fuel adulteration has two multimode evanescent wave optical sensors separated by a constant spacing. One sensor acts as emitting fiber and the other is a receiving one. The RIs of the core and cladding are 1.483 and 1.412, respectively. The emitting and receiving fibers have core and cladding diameters of 120/200 µm. A laser with wavelength of 645.8 nm is used as an input light source. The output transmitted signal is based upon the optimum overlap of emitting and receiving fibers, space between two fibers, and RIs of the medium.
The proposed sensor transfers light from one mode to another that brings the interaction between the evanescent waves and core. The reflected light is captured and transmitted as voltage readings that are then passed on to further processing, such as feature extraction and classification which leads to the detection of solvent in the original solution.
3.2 Discrete Wavelet Transform (DWT)
The transmitted signal from the proposed sensor is used as input in the feature extraction stage. Extracted features minimize the loss that are embedded in the infiltrated signal. This step is needed to minimize the complexity, reduce the cost of data processing, and to compress the larger data. Various feature extraction algorithms are used for signal processing, such as time frequency distribution, eigenvector methods, Fast Fourier transform, and wavelet. In pattern recognition, prediction, and classification, Wavelet transform (WT) plays an important role to change many input data points into few parameters that represents as signal. WT also represents the signal time frequency, and can be classified as continuous and discrete [12]. DWT is an analysis tool that is mainly used in signal processing, image analysis, and classification algorithms [13]. This tool is the multi-scale feature extraction technique where every scale represents the thickness of the transmitted infiltrated signal from the sensor.
The proposed method reorders the transmitted signal with the threshold to the DWT wavelet coefficient [14]. Applying the inverse function of the transformed signal and the approximate value of the original signal is calculated. With the same approximation value, the feature selection algorithm is applied to those extracted by DWT. Wave coefficients are given priority ranking inside the window. The features with highest priority are considered for selection of that particular window. The same process is repeated for all windows in the transmitted signals. The highest priority features are stored for classification [15].
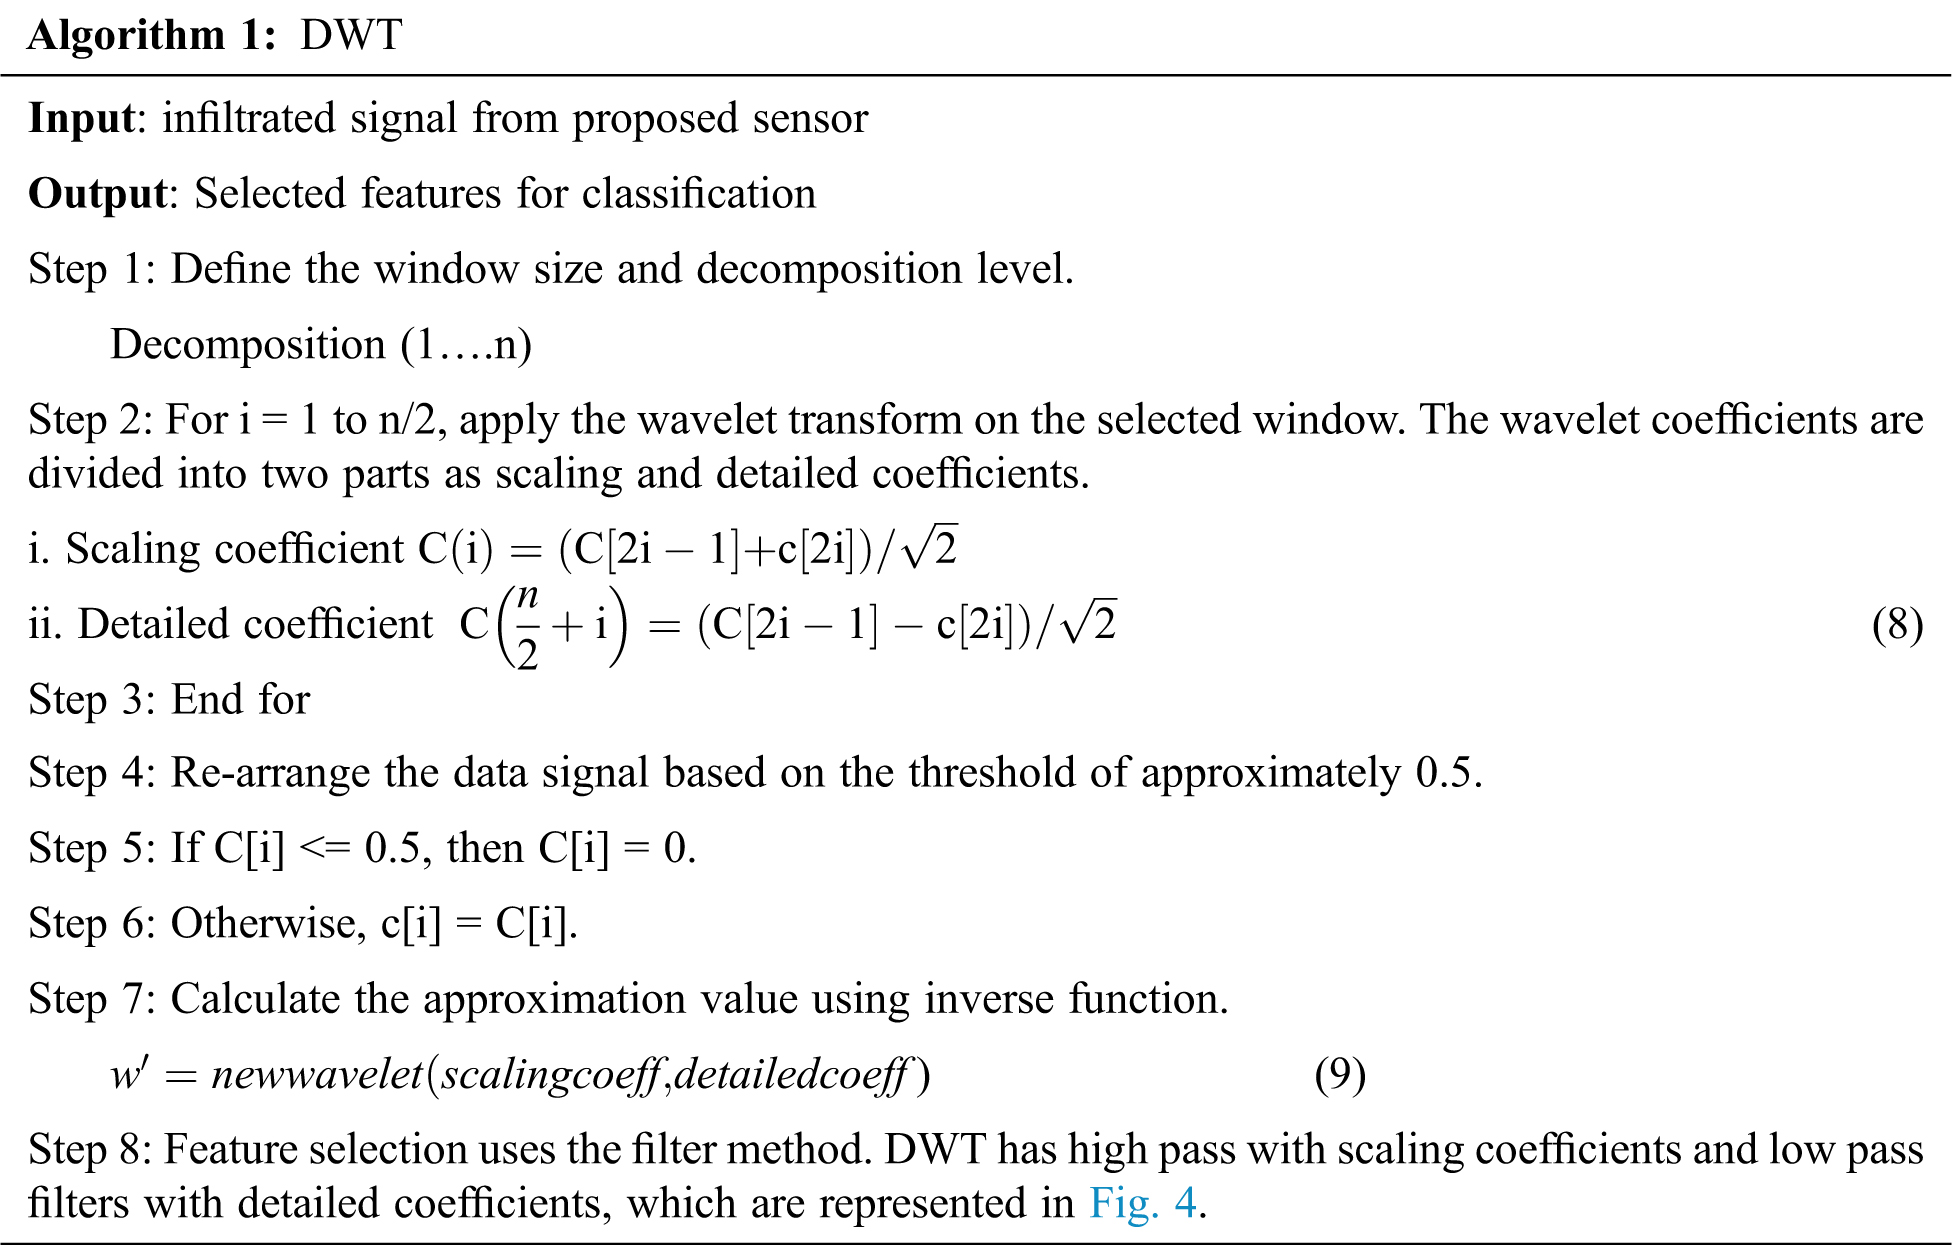
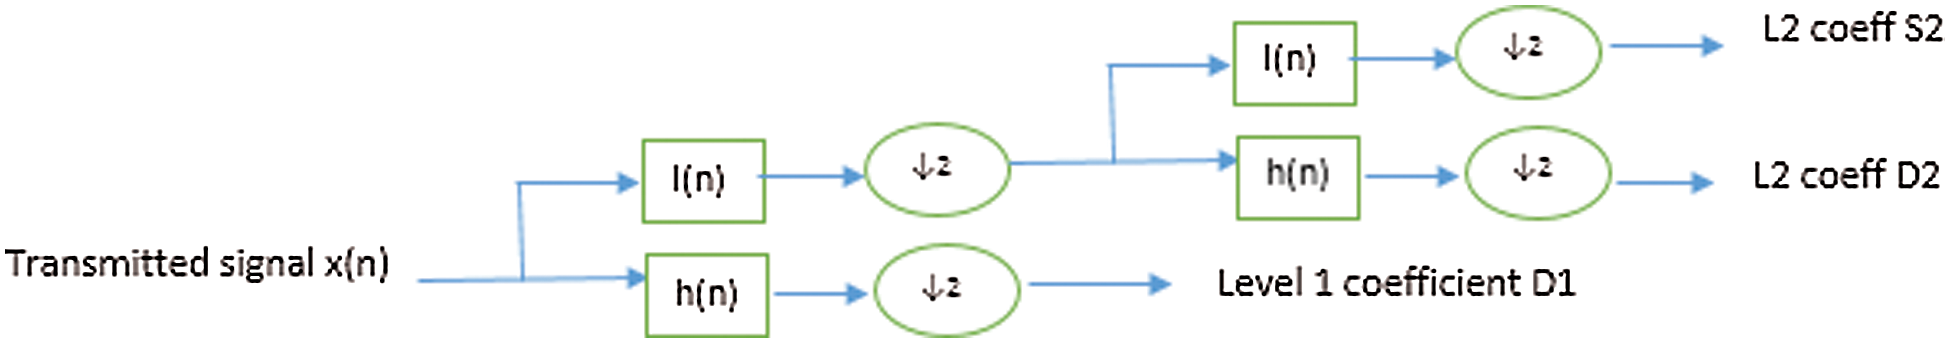
Figure 4: Wavelet filters on extracted signals
Fig. 5 shows the layout of the sample fuel data transmitted signal with their discrete wavelet transformation. The original signal with the two coefficients such as scaling and detailed coefficients are also represented in the figure.
3.3 Classification Based on SVM
The main objective of the classification is to distinguish the adulterated fuel from the pure ones. A good classification algorithm provides the prediction with high accuracy. In this study, SVM is used as a classifier to detect the fuel adulteration. SVM is a high accuracy classification algorithm that is useful to solve both linear and nonlinear problems. A supervised learning algorithm, SVM uses a set of linear functions to form the support vectors that is the core of classification. SVM prediction is also based on the type of kernel function used. In this study, radial basis function is used to support SVM to achieve better performance [11]. The SVM algorithm is represented simply as
where
b-bias
K-kernel function represented as
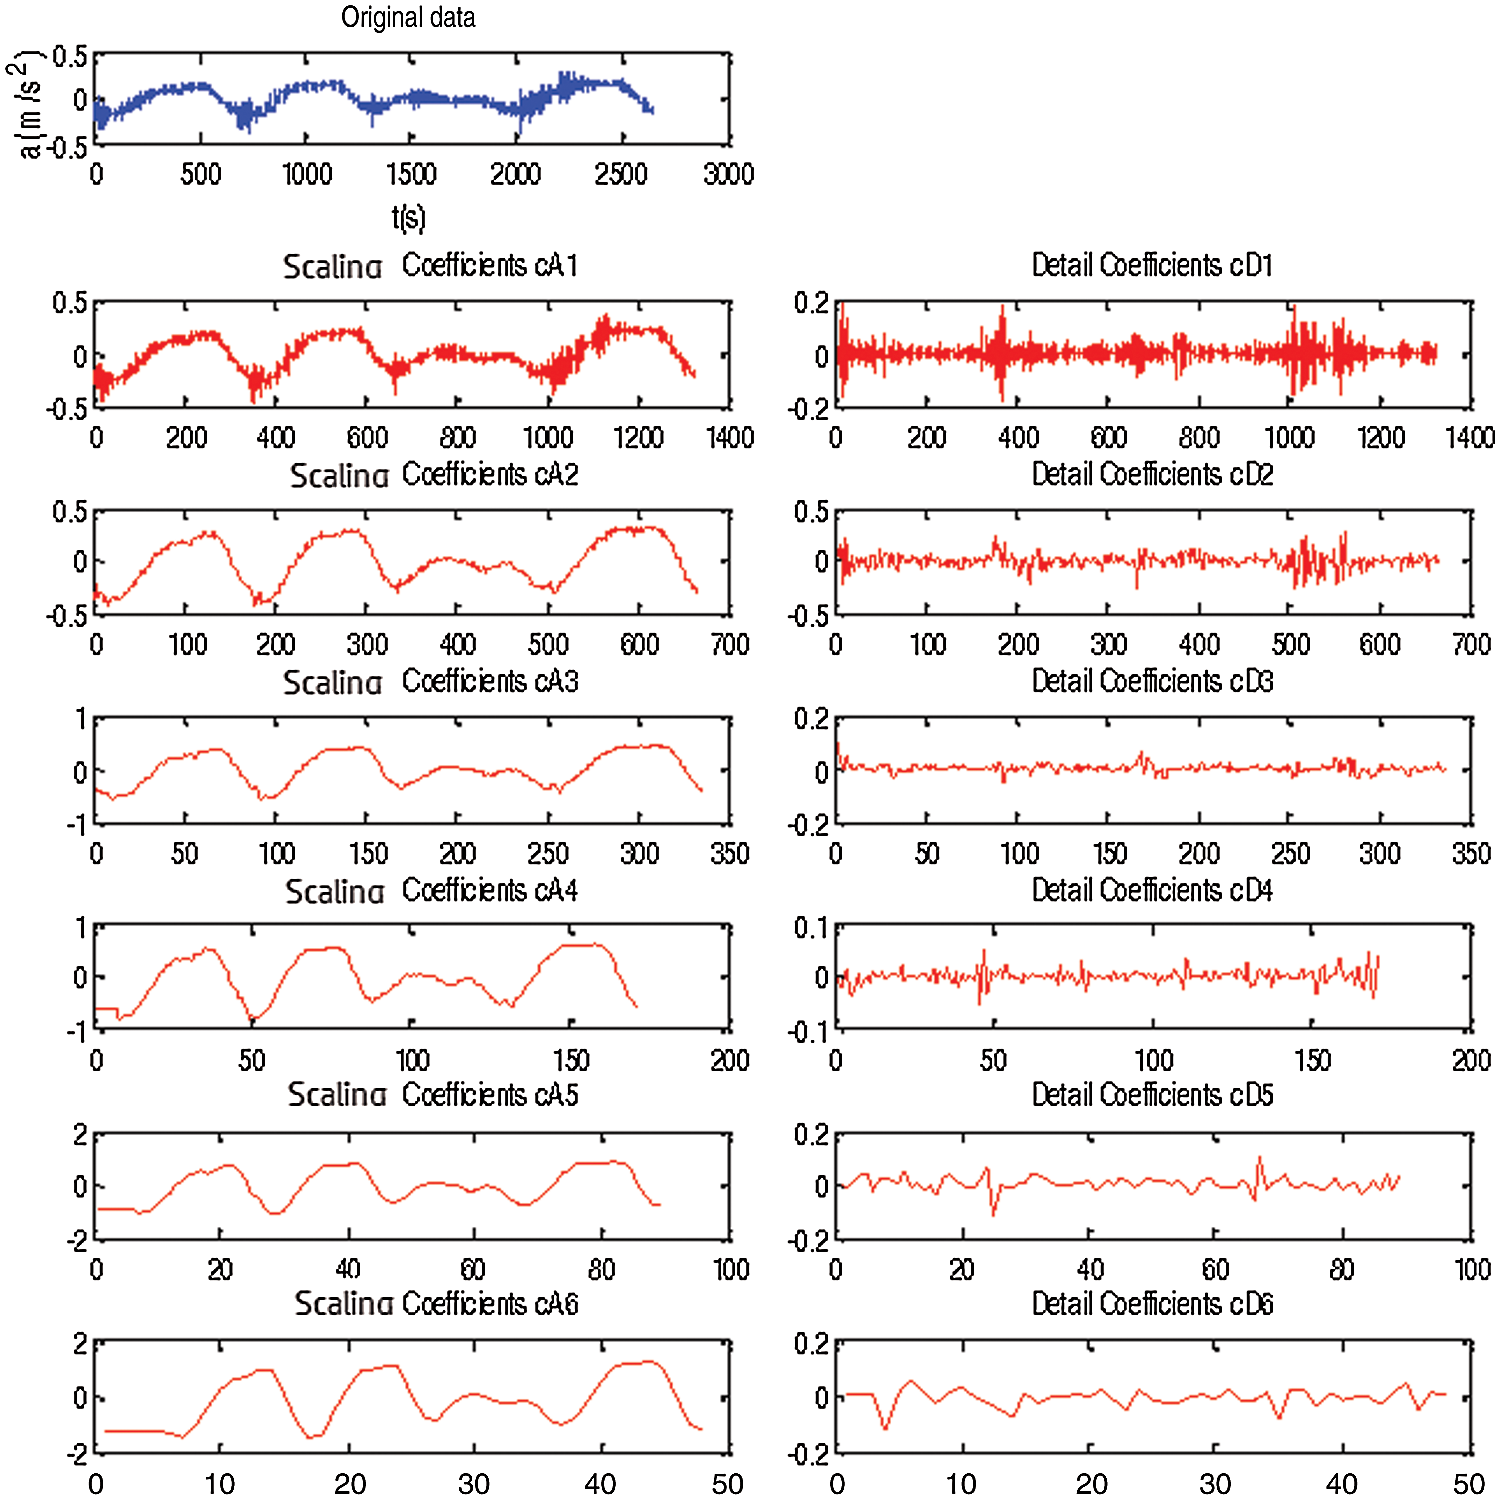
Figure 5: Sample DWT on transmitted signal
where
The data signals extracted from the DWT are given as input to the SVM as training pairs. The input data signal fall in either one of the two classes (−1 or +1) based on the amount of adulterant solvent in the pure petrol, and is classified based on the linear separator in the SVM hyperplane. The margin is increased to decrease the weight vectors of the input feature. The algorithm with Lagrange multipliers creates the weight related to the support vectors to sufficiently predict the boundary level. The output of the algorithm is each feature weight vectors and their linear combination of the test data, which help to predict the sample adulteration class. SVM effetiveness is based on the parameters used, such as kernel function and margin. Proper selection of the parameter values leads to good accuracy classificaton results.
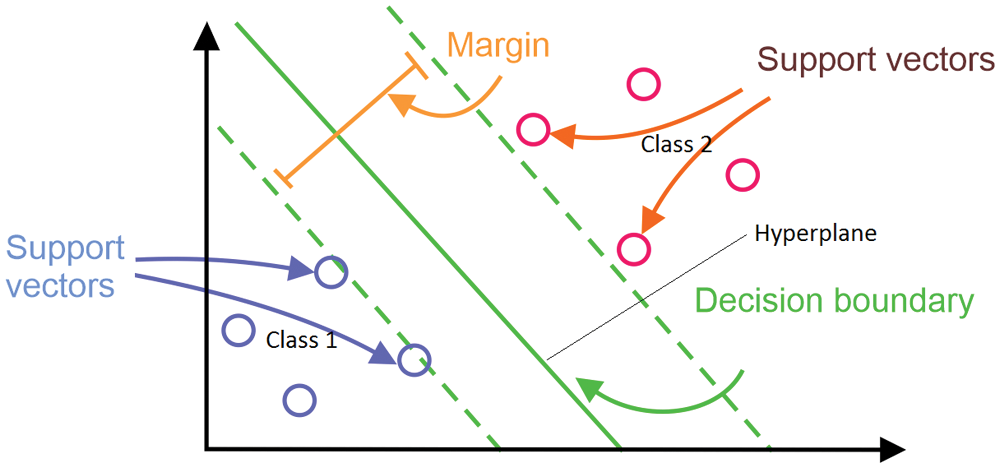
Figure 6: Linear separable hyper plane with classes using SVM
3.4 Work Flow of the Proposed Work
Fig. 7 shows the workflow of the proposed detection for fuel adulteration. The data sample is given as input to the evanescent wave optical sensor probe. The input signal are then reflected in the core with eavenescent field. This study uses two sensors, one for transmitting and another for receiving. The proposed setup sends the light source from one mode to another that leads to the commmunication between the core and evanescent wave. The RI of the core and cladding are calculated. The transmitted voltage readings are then passed on to feature extraction using DWT. The scaling and detailed coefficient values are calculated and the high and low pass filters are applied on the coefficients to obtain the transformed signal for classification. The SVM then classifies the transformed voltage readings into either classes as adulterated or unadulterated fuel.
Detecting the adulteration solvent added to pure fuel is a primary and essential task that benefits humans and society. This proposed system is a mathematical modelling and portable fuel adulteration technique using evanescent wave optical sensor to transmit the raw data sample as signals. Subsequently, DWT is used to transform the signal to high dimensional space for feature extraction and selection, then classification by SVM. This proposed mathematical model is implemented using sklearn in Python programming. A total of 50 samples that consist of both adulterated and unadulterated fuel are used for evaluation. Among the sample data, 35 are taken for training and 15 are for testing.
For experimental analysis, 100 samples that consist of both adulterated and unadulterated samples with solvents are used, where 80 are taken for training and 20 for testing.
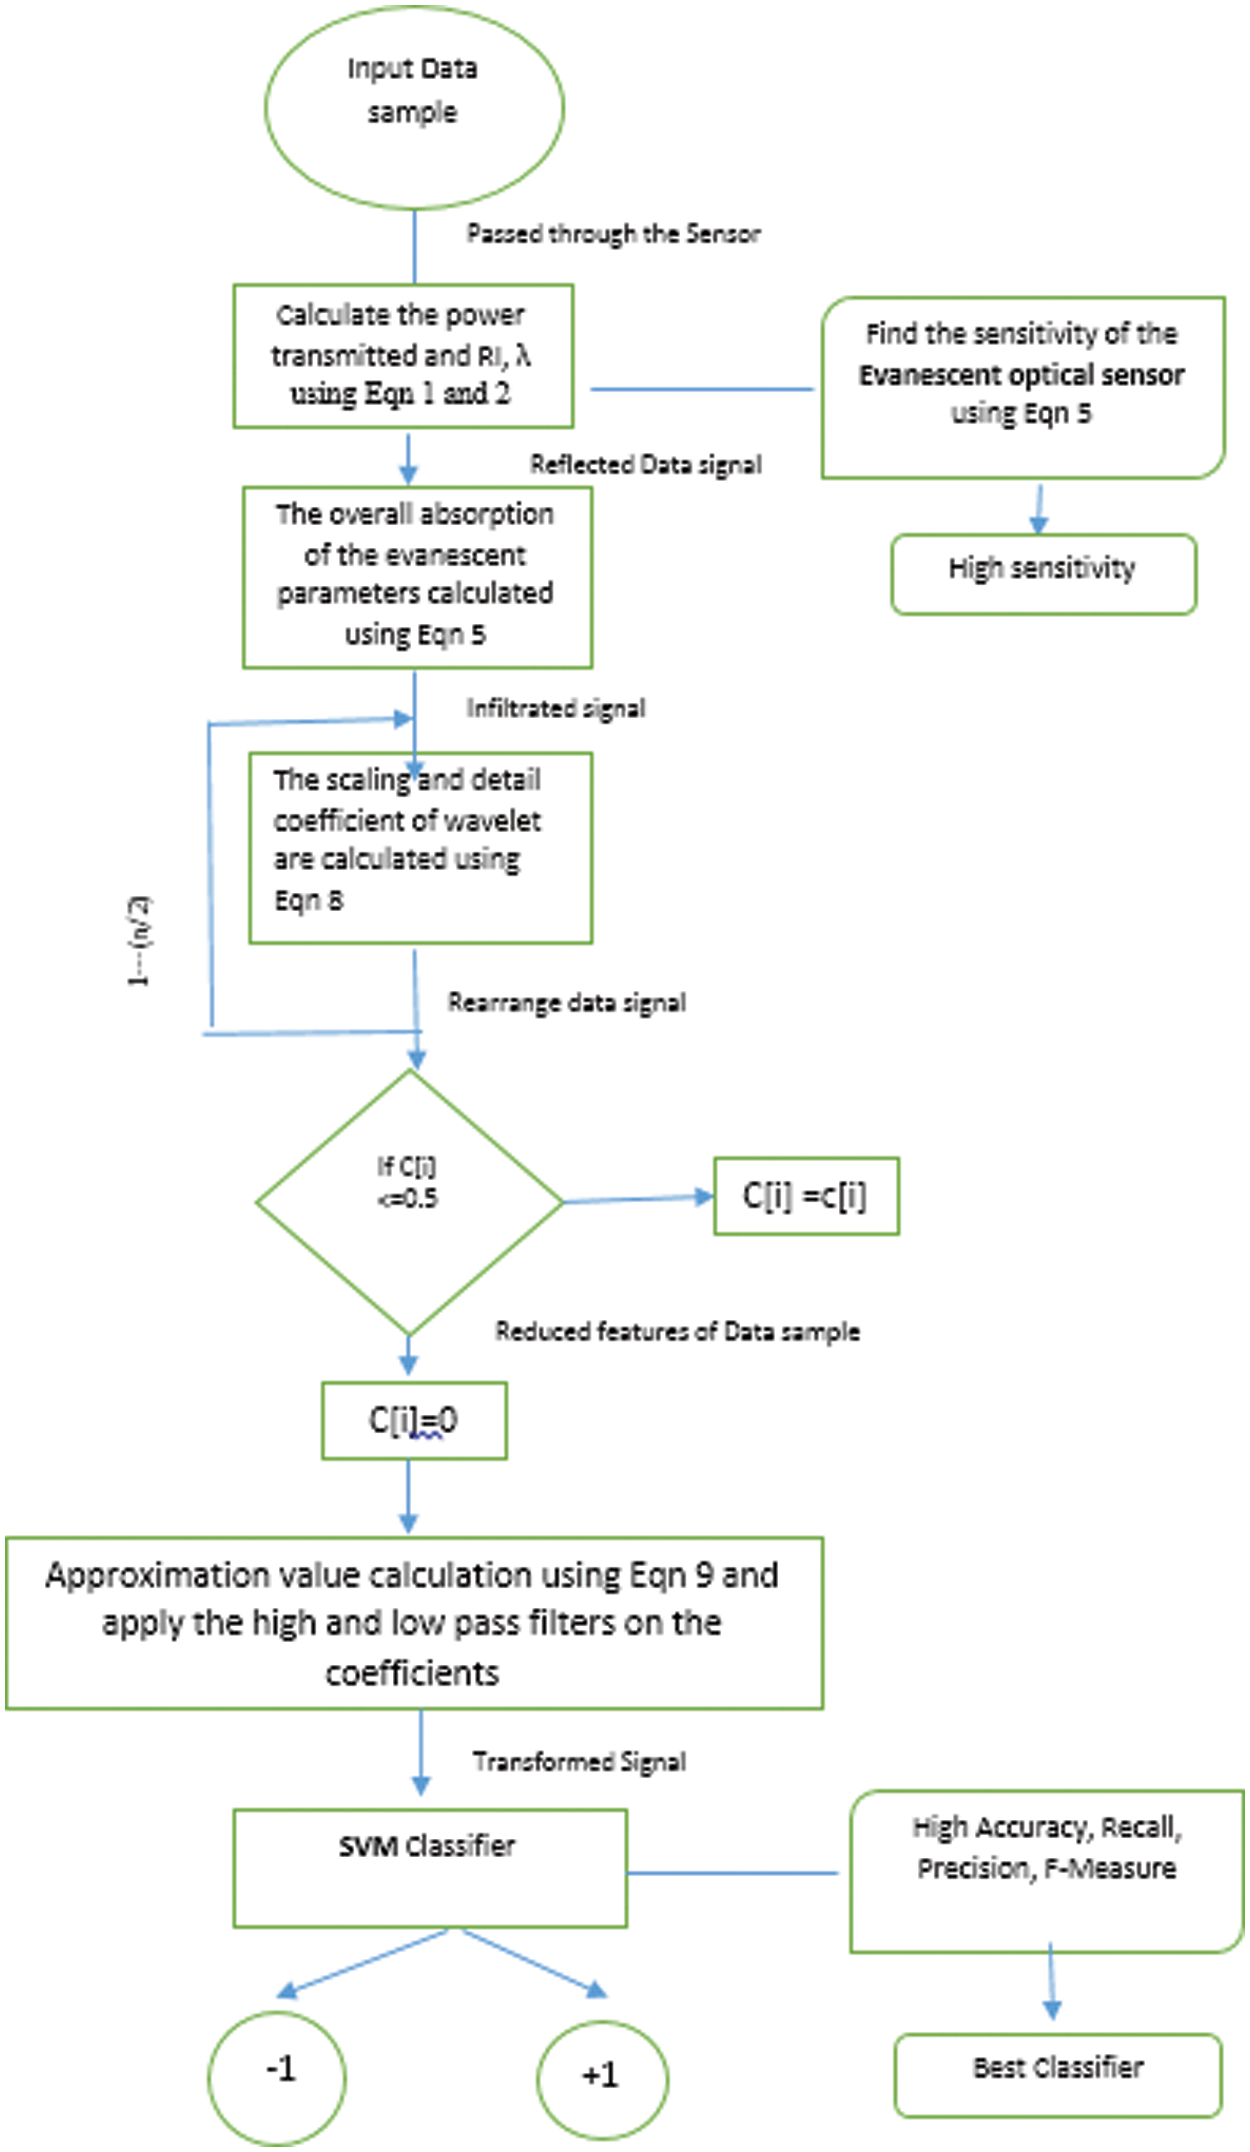
Figure 7: Workflow of the proposed fuel adulteration detection
The cladding used in this sensor have RI rather than a core and this proposed setup works as a light wave transmitter on the core with reflection. The evanescent wave also uses the core point. The output light power of the sensor is recorded using Eq. (12) [11],
where
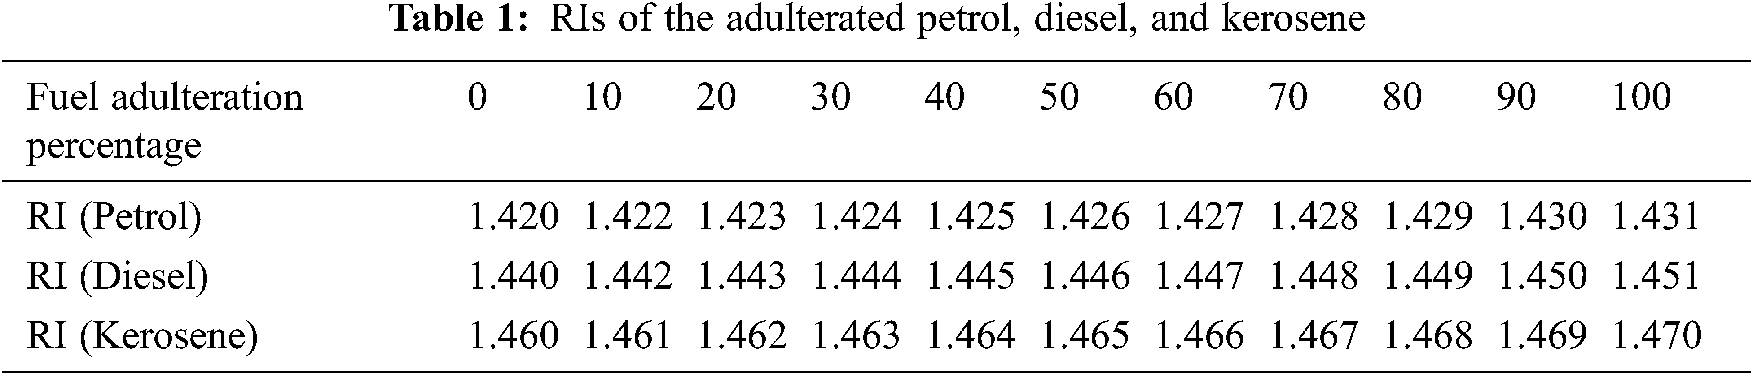
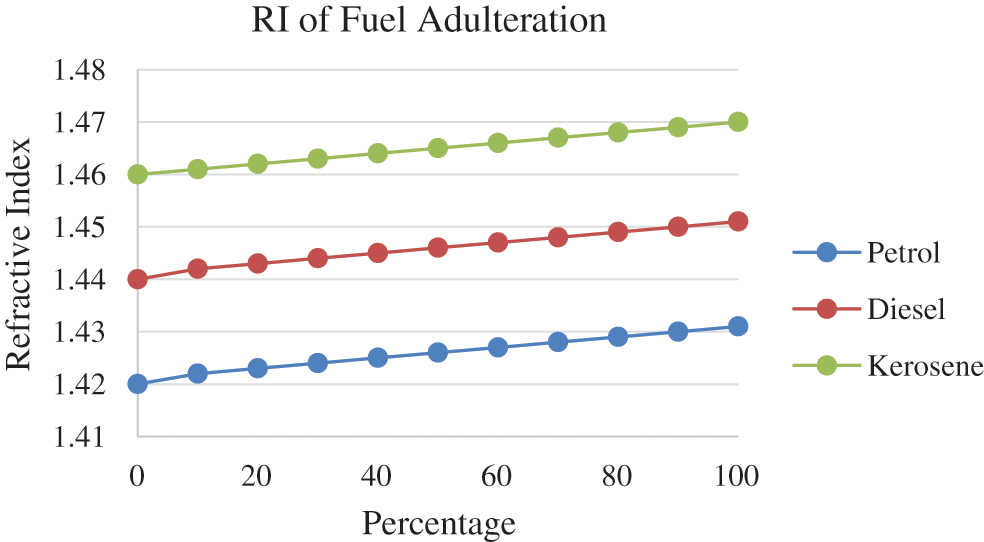
Figure 8: Adulterated fuel RI
Here, the RI 1.420 is pure petrol, 1.440 is pure diesel, and 1.460 is the pure kerosene. The proposed modified evanescent wave optical sensor is suitable for fuel adulteration especially for petrol with good response time and high sensitivity of 21,270.32 nm/RIU. The high sensitivity sensor for predicting the fuel adulteration is compared with the existing sensors. With this high sensitivity, the signal is then transmitted to DWT for transformation. To prove the effectiveness of DWT, we calculate the standard error minimization technique such as
The SVM factors are the basis to distinguish the adulterated fuel from the unadulterated one. Tab. 2 shows the SVM factors from the transformed signal by DWT for the 35 training data.
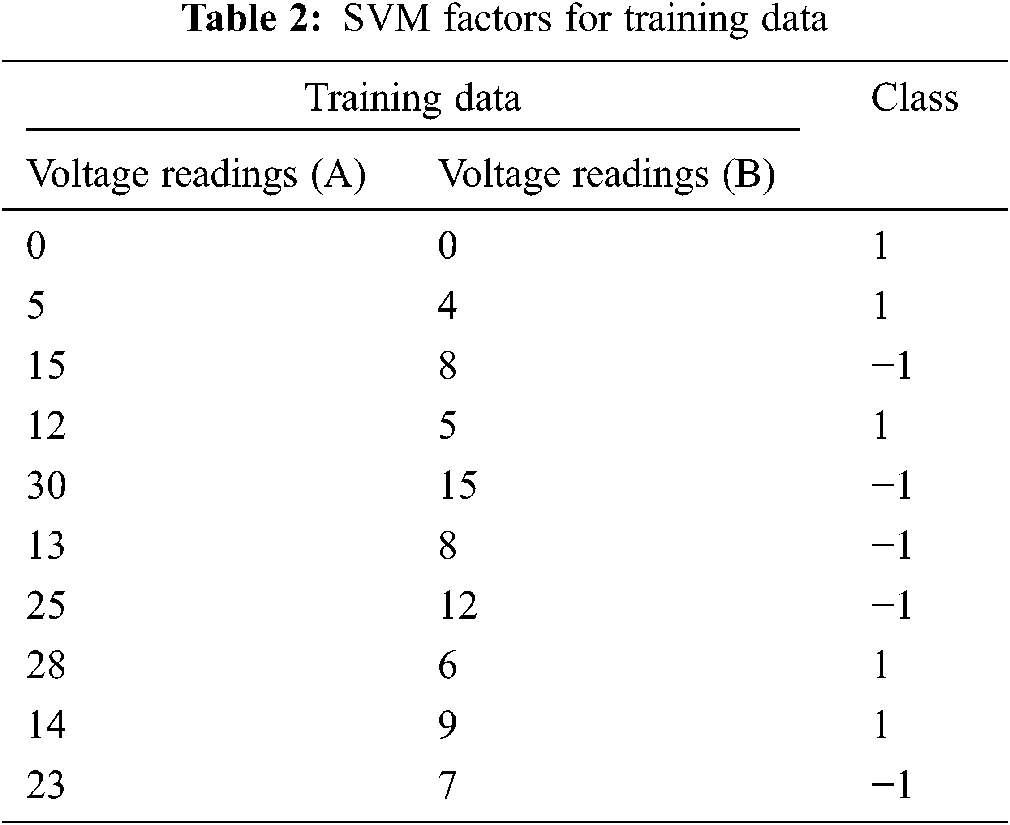
As a result of the training phase, weight vector and the parameters are calculated using Eq. (13).
The final SVM classification is performed using Eq. (14).
Tab. 3 shows the testing data SVM factors.
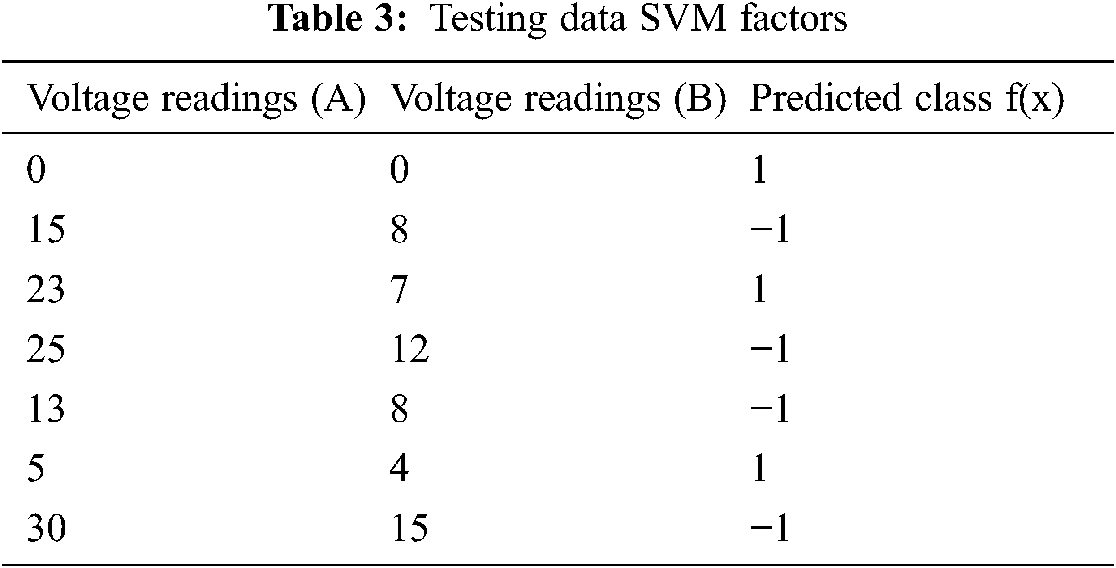
Comparison of Tabs. 2 and 3, training and testing phases, the data sample voltage of the points (23, 7) is treated as unadulterated fuel compared with the training data that belongs to class −1. This data point lies nearer to the margin. Such misclassification can be corrected by finetuning the parameters, after which the propsoed algorithm obtains 99.9% accuracy in terms of detecting fuel adulteration.
For evaluation, 200 ml petrol is used. The adulteration varies from 50, 100, and 150 ml of diesel and kerosene. The proposed sensor box radius is 3.8 cm. The distance between the sensor is 9 cm. The proposed sensor distinguishes the fuel intensity of the light that is reflected at the boundary with variations over the original mixture. The testing evaluation is performed by changing the concentration of solvents such as of diesel and kerosene. The concentration of these contaminants varies in the combination of adulteration of petrol with diesel, petrol with kerosene, or petrol with kerosene and diesel. Each fuel has their own level of parameters. Tab. 4 shows the sample preparation with the corresponding voltage reading using the proposed sensor. Fig. 9 shows the proposed sensor for petrol adulteration and the concentration of adulterated fuels.
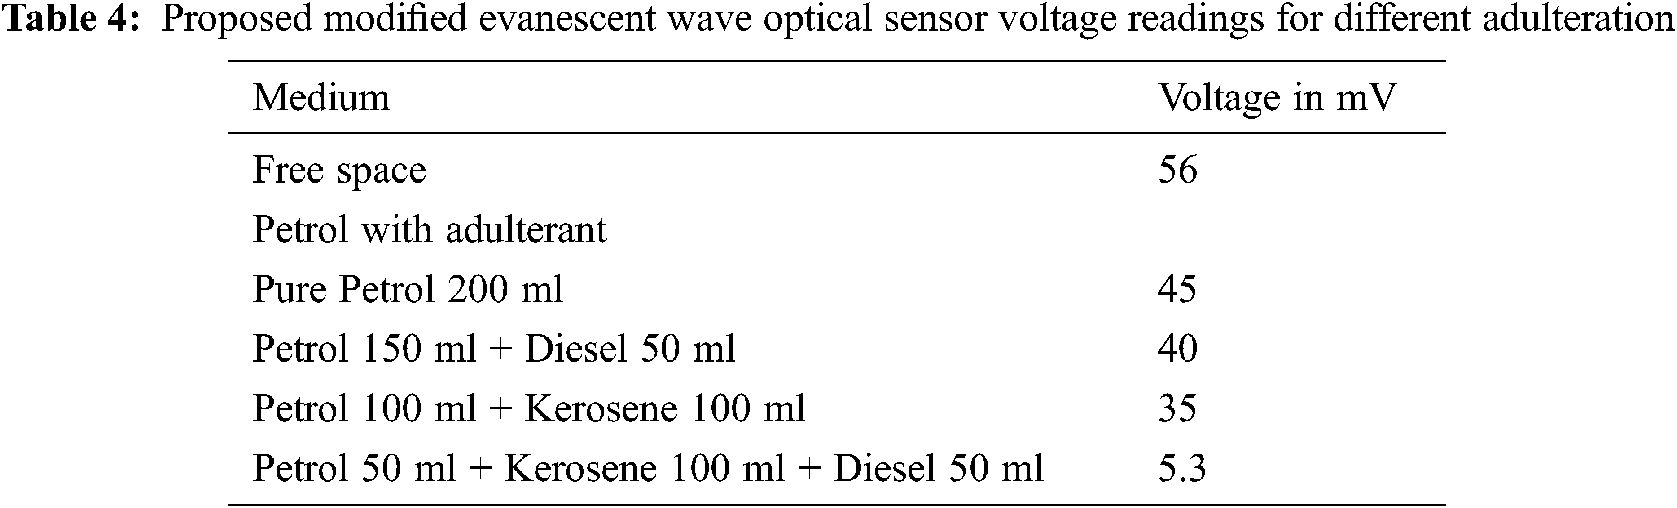
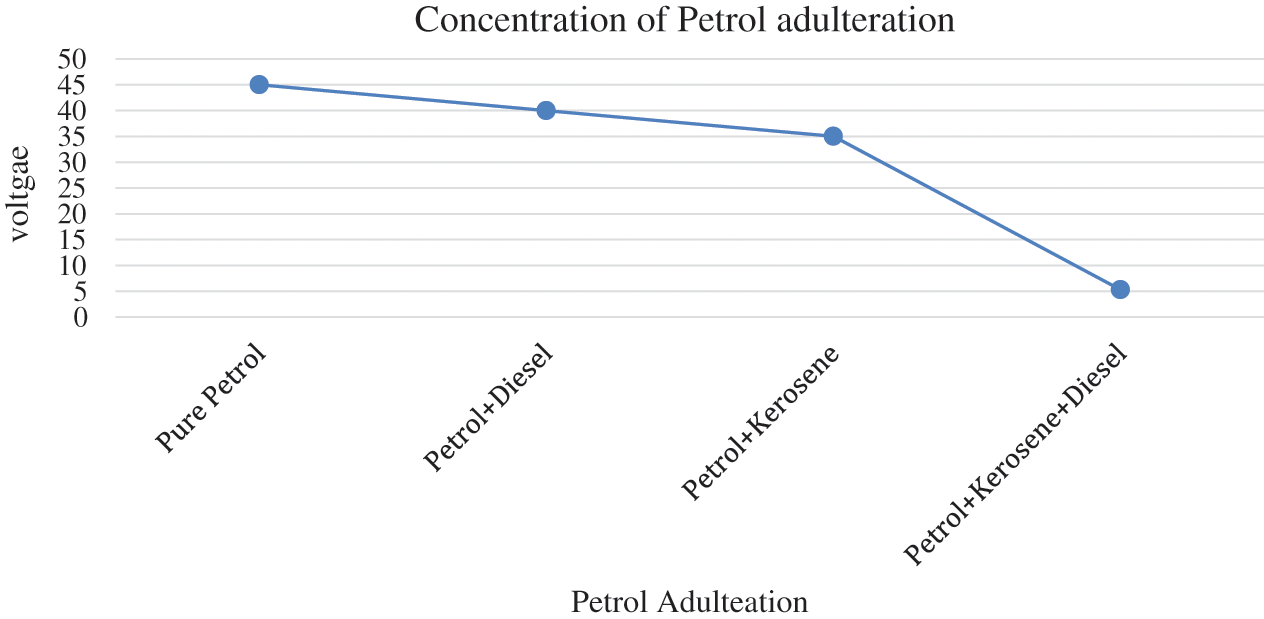
Figure 9: Adulterated fuels concentration on petrol
The proposed structure of the petrol adulteration with modified evanescent optical sensor has varying concentration of kerosene in the petrol from 0% to 75% and diesel from 0% to 25%. The same process is repeated multiple times to ensure the accuracy of the fuel concentration readings. The SVM distinguishes the adulterated petrol with kerosene and diesel from the unadulterated pure petrol with high accuracy. To prove the effectiveness of the classification algorithm, we calculate standard metrics such as Accuracy, Precision, Sensitivity, Specificity, Recall, and F measure. Fig. 10 shows the classification accuracy.
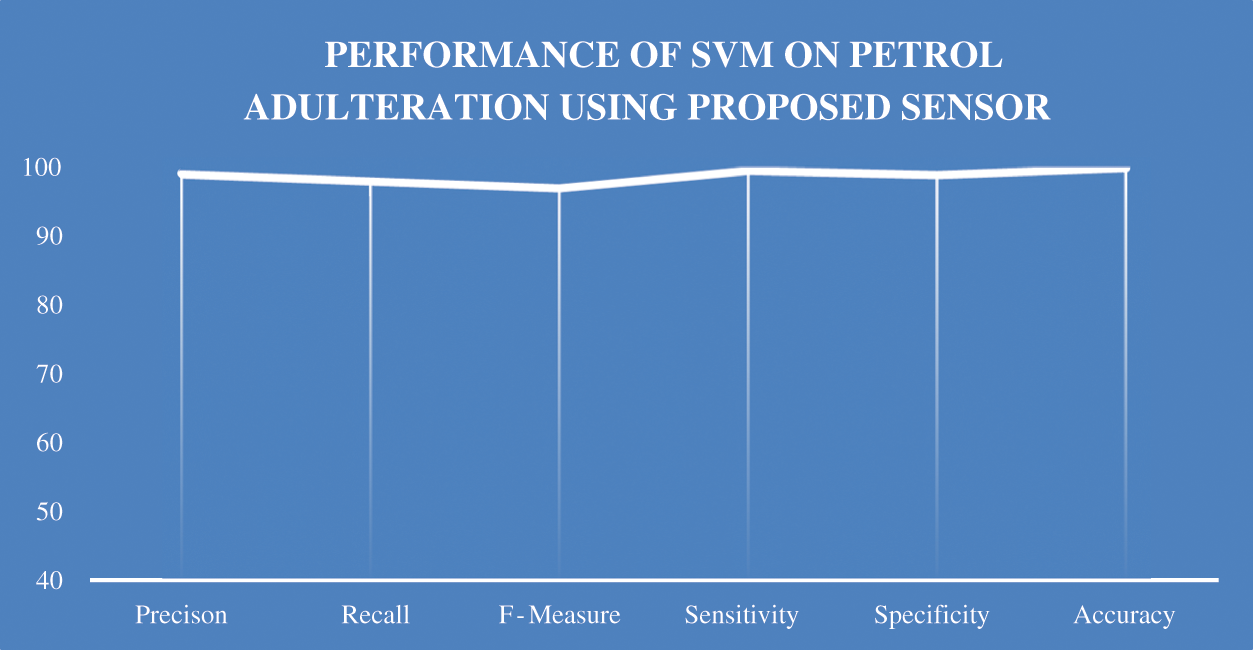
Figure 10: Overall performance accuracy of the petrol adulteration
With this proposed modified evanescent wave optical fiber sensor, the detection of petrol adulteration obtains 99.9% of accuracy on classifying the correct samples as unadulterated from the adulterated. For the experiment, we use petrol adulteration with diesel and kerosene. The concentration of the adulterated solvents is predicted with high accuracy by using the receiving sensor of the proposed work. The evanescent field in the core leads to the proper transmitted signal of the input for further processing. Among the various feature extraction techniques, DWT performs better in signal processing. The correct voltage readings are extracted for classification with low error. Hence, the proposed setup is robust, secure, portable, non-flammable, and rapid in response time. This setup can be much useful in automotive and chemical industries for better prediction of fuel adulteration.
The main motivation of this study is due to recent findings from the United Nations that nine out of 10 people in the world inhale polluted air. This fact results in health problems worldwide, which leads to approximately 7 million deaths due to pollution. As per the World Health Organization, 12.5% of deaths in India are due to air pollution. Among the world’s 10 most polluted countries, India ranks 9th. Considering the condition of poor air and increased vehicle movement among the population, the BS VI stage fuel is introduced in 2020 to help improve the air quality. Our mission in detecting fuel adulteration is very important for the people’s survival. This study detects the adulteration using Modified Evanescent Wave Optical Fiber that is highly accurate compared with other sensors in mixture detection. Then, the output is fed to machine learning algorithms for accurate classification of adulteration. Here, DWT is used with SVM classifier to distinguish the adulterated data from training data sets. The result shows a 99.9% accuracy in detecting petrol adulteration. In future, we can implement highly sensitive sensors in vehicles to detect the pollution level in smart vehicles, which in turn can help the environment through the proper detection and control of fuel adulteration.
Funding Statement: The authors received no specific funding for this study.
Conflicts of Interest: The authors declare that they have no conflicts of interest to report regarding the present study.
1. V. J. Felix, P. A. Udaykiran and K. Ganesan, “Fuel adulteration detection system,” Indian Journal of Science and Technology, vol. 8, pp. 90–95, 2015. [Google Scholar]
2. B. Vimal, R. Krishna and N. Manic, “Review on the detection of adulteration in fuels through computational techniques,” in Proc ICMPC, Hydrabad, India, pp. 1723–1729, 2017. [Google Scholar]
3. I. Barra, M. A. Mansouri, M. Bousrabat, Y. Cherrah, A. Bouklouze et al., “Discrimination and quantification of moroccan gasoline adulteration with diesel using fourier transform infrared spectroscopy and chemometric tools,” Journal of AOAC International, vol. 102, no. 3, pp. 966–970, 2019. [Google Scholar]
4. R. Biswas and M. Pradhan, “A comparative analysis of all fiber optic sensors for detection of adulteration in fossil fuels,” Opticaland Quantum Electronics, vol. 52, no. 62, pp. 1–10, 2020. [Google Scholar]
5. B. S. Boruah, N. K. Daimari and R. Biswas, “Functionalized silver nanoparticles as an effective medium towards trace determination of arsenic (III) in aqueous solution,” Results in Physics, vol. 12, pp. 2061–2065, 2019. [Google Scholar]
6. G. Mendes and J. S. B. Paulo, “Detection and quantification of adulterants in gasoline using distillation curves and multivariate methods,” Fuel, vol. 112, pp. 163–171, 2013. [Google Scholar]
7. F. Mabood, S. A. Gilani, M. Al-Broumi, S. Alameri, M. M. O. Al Nabhani et al., “Detection and estimation of super premium 95 gasoline adulteration with premium 91 gasoline using new NIR spectroscopy combined with multivariate methods,” Fuel, vol. 197, pp. 388–396, 2017. [Google Scholar]
8. V. Padmakarrao and A. Patil, “Detection of fuel adulteration in real time using optical fiber sensor and peripheral interface controller,” Optics and Photonics, vol. 11, no. 2, pp. 95–102, 2017. [Google Scholar]
9. B. P. Vempatapu and P. K. Kanaujia, “Monitoring petroleum fuel adulteration: A review of analytical methods,” TrAC Trends in Analytical Chemistry, vol. 92, pp. 1–11, 2017. [Google Scholar]
10. A. K. Pathak, R. K. Gangwar, P. Priyadarshini and V. K. Singh, “A robust optical fiber sensor for the detection of petrol adulteration,” Optik (Stuttg), vol. 149, pp. 43–48, 2017. [Google Scholar]
11. S. Dilipkumar and T. V. Sivasubramonia Pillai, “Estimating fuel adulteration in automobiles using robust optical fiber sensors,” Microprocessors and Microsystems, vol. 79, pp. 103289, 2020. [Google Scholar]
12. D. Cvetkovic, E. D. Ubeyli and I. Cosic, “Wavelet transform feature extraction from human PPG, ECG, and EEG signal responses to ELF PEMF exposures: A pilot study,” Digital Signal Processing, vol. 18, no. 5, pp. 861–874, 2008. [Google Scholar]
13. M. R. N. Kousarrizi, A. A. Ghanbari, M. Teshnehlab, M. Aliyari and A. Gharaviri, “Feature extraction and classification of EEG signals using wavelet transform, SVM and artificial neural networks for brain computer interfaces,” in Proc. IJCBS, Shanghai, China, pp. 352–355, 2009. [Google Scholar]
14. J. Bennet, C. A. Ganaprakasam and A. Kannan, “A discrete wavelet-based feature extraction and hybrid classification technique for microarray data analysis,” Scientific World, vol. 2014, pp. 1–10, 2014. [Google Scholar]
15. R. Ganesan and K. Somasundaram, “Petrol quality analysis for different level of adulteration using thermal imaging and GLCM features,” ARPN Journal of Engineering and Applied Sciences, vol. 14, no. 5, pp. 1043–1050, 2019. [Google Scholar]
 | This work is licensed under a Creative Commons Attribution 4.0 International License, which permits unrestricted use, distribution, and reproduction in any medium, provided the original work is properly cited. |