DOI:10.32604/csse.2022.020185
| Computer Systems Science & Engineering DOI:10.32604/csse.2022.020185 | |
| Article |
Classification of Foot Pressure Images Using Machine Learning Algorithm
1Department of Electronics and Communication Engineering, SNS College of Engineering, Coimbatore, 641107, Tamil Nadu, India
2Department of Biomedical Engineering, PSG College of Technology, Coimbatore, 641004, Tamil Nadu, India
3Department of Electronics and Communication Engineering, Sri Shakthi Institute of Engineering and Technology, Coimbatore, 641062, Tamil Nadu, India
*Corresponding Author: P. Ramya. Email: ramyarajjuly@yahoo.com
Received: 13 May 2021; Accepted: 21 June 2021
Abstract: Arthritis is an acute systemic disease of a joint accompanied by pain. In developed countries, it mainly causes disability among people over 50 years of age. Rheumatoid Arthritis is a type of arthritis that occurs commonly among elders. The incidence of arthritis is higher in females than in males. There is no permanent diagnosis method for arthritis, but if it was identified in the early stages based on the foot pressure, it can be diagnosed before attaining the critical stage of Rheumatoid Arthritis. The analysis and study of arthritis patients were done using design thinking methodology. Design thinking is a problem-solving methodology that is used to find a solution for the identification of the early stage of arthritis. This process consists of five stages follows Empathy, Define, Ideate, Prototype, and Testing. To define the problem statement, the Empathy was done with the arthritis patients to know the difficulties faced by them. This paper proposes a measurement technique of early measurement of arthritis using a non-invasive technique. It helps us to detect arthritis using a foot pressure pad that was designed with piezoresistive material and the feature classification was done using Weka.
Keywords: Piezoresistive material; velostat; carbon loaded piezo resistive film; machine learning algorithm; SVM; MLP classification; design thinking
Arthritis insinuates pain in the joints. Rheumatoid Arthritis (RA) is one of the major reasons for joint pain. It occurs among the elderly and it occurs three times higher in females than in males. As per the report of the world health organization, Arthritis affects more than 180 million people in India. Arthritis was caused by problems in the immune system which results in chronic pain, inability to do regular activities. The joints get worse over time and cause permanent changes in the joints. The most common symptoms of arthritis are joint pain, swelling, and stiffness. It can cause permanent changes in the joints and it is usually visible in radiography (x-rays) and Magnetic Resonance Imaging (MRI) scans. As of now, there is no permanent cure for arthritis as the muscles lose the Synovial liquid. This liquid maintains the smoothness of the joint movements and performs joint actions. There is no permanent solution to generate the synovial liquid [1].
Arthritis can be identified in the earlier stage some interventions can be done to slow down the permanent joint changes. In the proposed method, based on the design thinking approach the empathy was done with the arthritis patients to know the difficulties faced by them in earlier stages. After defining the problem statement, in the ideation part, five different algorithms were proposed using Machine learning to classify the foot pressure images using a piezoresistive-based pressure pad. In this approach, velostat film is used in the pressure pad design and gives a better piezoresistive performance. Based on the classification accuracy & computation time 5 different algorithms were selected for classification. By using five various algorithms the features of images are classified and the algorithm with high efficiency was identified and the confusion matrix was generated. The limitations of knee diagnosis are it needs some special lab setup to do the analysis this encourages towards this research work. To overcome these limitations this foot pressure pad was developed using Velostat material. The main objective of detecting early stage of arthritis may achieved by designed foot pressure pad using machine learning algorithm.
The subjects with Rheumatoid arthritis can encounter severe distress, joint resoluteness, and expansion of various joints. Conclusion of Rheumatoid Arthritis, in the beginning, was the difficult recommendation because the related clinical highlights are expansive and the beginning is by and largely unobtrusive. Synovitis is a critical quality of Rheumatoid arthritis and is straightforwardly connected to different changes to the hidden joint functioning [2]. The contrasts between the solid synovial and an aggravated synovial are prominently obvious from histological examination. The principal concern in Rheumatoid arthritis concludes that RA doesn't have a specific demonstrative element [3], besides the long slack among contamination and side effects, and examination is a result of late reference [4]. Premature discovery of Rheumatoid arthritis and initiation of fiery treatment during the beginning phase of the illness can diminish illness improvement and, in a couple of patients, even brief medicine-free decrease [5]. At the point first, the individual has joint tortures, it may form the outset firm for an expert to express that an individual has Rheumatoid arthritis. This is because there are various purposes behind joint tortures. No test is available to decide early Rheumatoid arthritis to have 100% exactness. All things being equal, the assurance of RA depends on the issue's set of experiences, physical tests, radiography, and research results. The American College of Rheumatology (ACR) has recommended measures of the portrayal of Rheumatoid arthritis (the implied “ACR 1987 modified models”).
Non-invasive imaging advances, for example, MRI, radiography, ultrasound, what's more, warm imaging that is utilized for the analysis of RA. Patients may endure without clear joint growth at the beginning phases of the illness, which radiography neglects to show. Concerning attractive reverberation imaging, that recognizes exacerbation and joint growing, in any case, are expensive and not reasonable for repetitive use. Ultrasound indicated more unmistakable steadfastness and affect situating of synovitis and spread as to undeniable assessment [6]. Ultimately, infrared is identified as warm imaging and this method utilizes a thermographic camera to catch imperceptible infrared thermal images that are changed over to typical images which are obvious to the natural eye. Numerous diverse warm imaging frameworks have been tried over years. Clinical thermographs were accessible since they were committed. Few investigations focus on the use of IR or heat map imaging to analyze Rheumatoid Arthritis [7].
Several classification methods were used for analyzing the data which is acquired from the electronic medical records [8] and sensing unit (thermographic camera [9], wearable sensor, etc,). Some classification methods like Support Vector Machines (SVM) [10] with linear kernel, Naïve Bayes [11], Logistic Regression [12], Multilayer perceptron [13], SVM with the polynomial kernel, SVM with Pearson universal kernel, and SVM with Gaussian kernel all are implemented in Weka. Ho Sharon [14] in 2018 describes that the SVM base classifier has enhanced categorization precision over others and with random forest classifier Adaboost slightly outperformed other models for the rheumatoid arthritis dataset. Followed by Adaboost and Random subspace the bagging algorithm has the highest accuracy at 82.5% and the lowest is 80%. As it has a high sensitivity it can correctly diagnose Rheumatoid Arthritis patients.The bagging algorithm with the SVM algorithm was identified as the weak learner which has the highest sensitivity or recalls 82.5% and which can correctly diagnose Rheumatoid Arthritis for an arthritis patient. This method proposes various methods of classification in a Machine learning algorithm and produced 100% accuracy in the classification of images.
3.1 Pressure Sensor Characterization
3.1.1 Pressure Sensor Matrix Assembly
The hindfoot and toe are the most dominant sites of pressure. In this regarding maximum research carried out, and the sensors were placed only there just because of their economic. The data retrieved from those sensors are very scarce and are not sufficient enough to showcase foot abnormalities. Understanding the shortcomings, researchers started working with fabric-based pressure sensors and incremented the number of sensors used to six and above. The six sensors are specifically placed on peculiar sites at the heel and metatarsal areas of the foot. The pressure point in the foot areas has been concluded as the site of placement of sensors only after the experiment proving that they are the high-pressure areas during normal activities. The technique of using sensors at a specific site gives low accuracy in detecting foot abnormalities because it can miss some valuable information from the area of the foot without a sensor. Thus, to obtain comprehensive information from the foot, more sensors must be used. This paved the way to design a sensing pad with 256 sensors for two feet. So that the data of pressure pad from our foot won't be missed out.
In this paper, a pressure pad was developed to measure the foot pressure and this is the prototype design as per the fourth stage of the design thinking process. It was intended using materials like Piezoresistive sensing film, copper foil thickness of 0.07 mm, and laminating material. The piezo restive material is otherwise known as “Velostat”. The Velostat material was made using the melt casting method [15] therefore it is flexible and durable. The copper foil (conducting layer) used in the design is fully covered by lamination sheet. This arrangement is preventing the copper foil from reacting directly with air. So, no separate protective measures required to protect the copper foil from the oxidation.
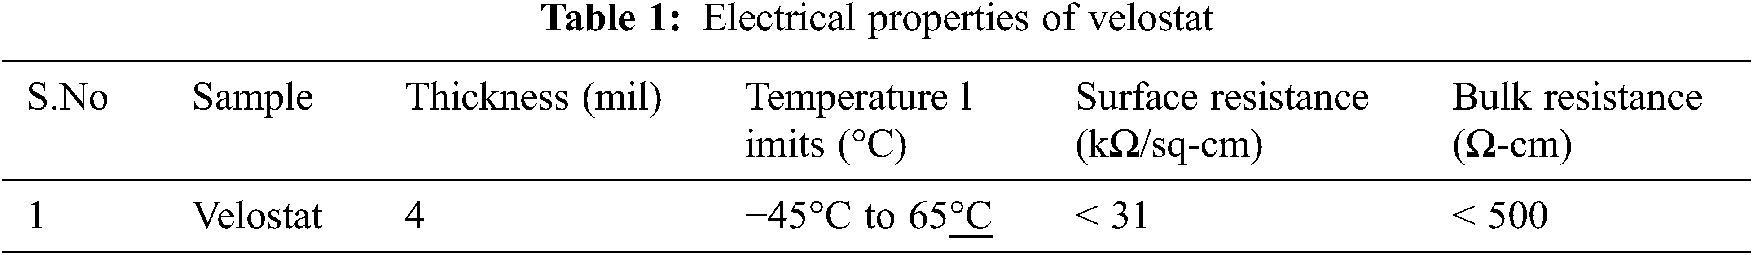
Velostat is made of a polyolefin material impregnated with carbon fillers. Uniformly distributed highly concentrated conductive fillers make a tightly bonded polymer matrix. This polymer matrix structure ensures the continuity in conducting network and forms a velostat as an electrical semiconductor. Bulk resistance is one of the important electrical properties of conductive polymer sheets. Bulk resistance is changed by applying either flexing or pressure, due to this resistance response it is used to make inexpensive pressure sensors, therefore it is convenient for making the sensor more flexible. Also, it is less expensive and flexible with 28 cm × 28 cm and 0.1 mm thickness. The temperature limit of the conductive material is between −45°C to 65°C. Surface resistivity of the film is <31,000 ohms/sq.cm. The electrical properties of velostat are given in Tab. 1. The pressure sensor sheet was designed with 30 cm × 30 cm and thickness 0.1 mm. Conductivity between the pressure sensors was ensured with the copper foil because it has very high conductivity when compared to aluminum foil. Aluminum foil is readily available and inexpensive, copper foil is predominant in terms of soldering facility and less in resistivity. Therefore, copper foil is selected for the proposed work. The copper foil was so arranged with a gap of 1 cm between each other with each sensor having 7 mm × 7 mm thickness and arranged with a horizontal gap of 7 mm. The sensing nodes were arranged based on the above parameters and their characterization was tested and calibrated. The pictorial representation of pressure pad design is depicted in Fig. 1a and Fig. 1b.
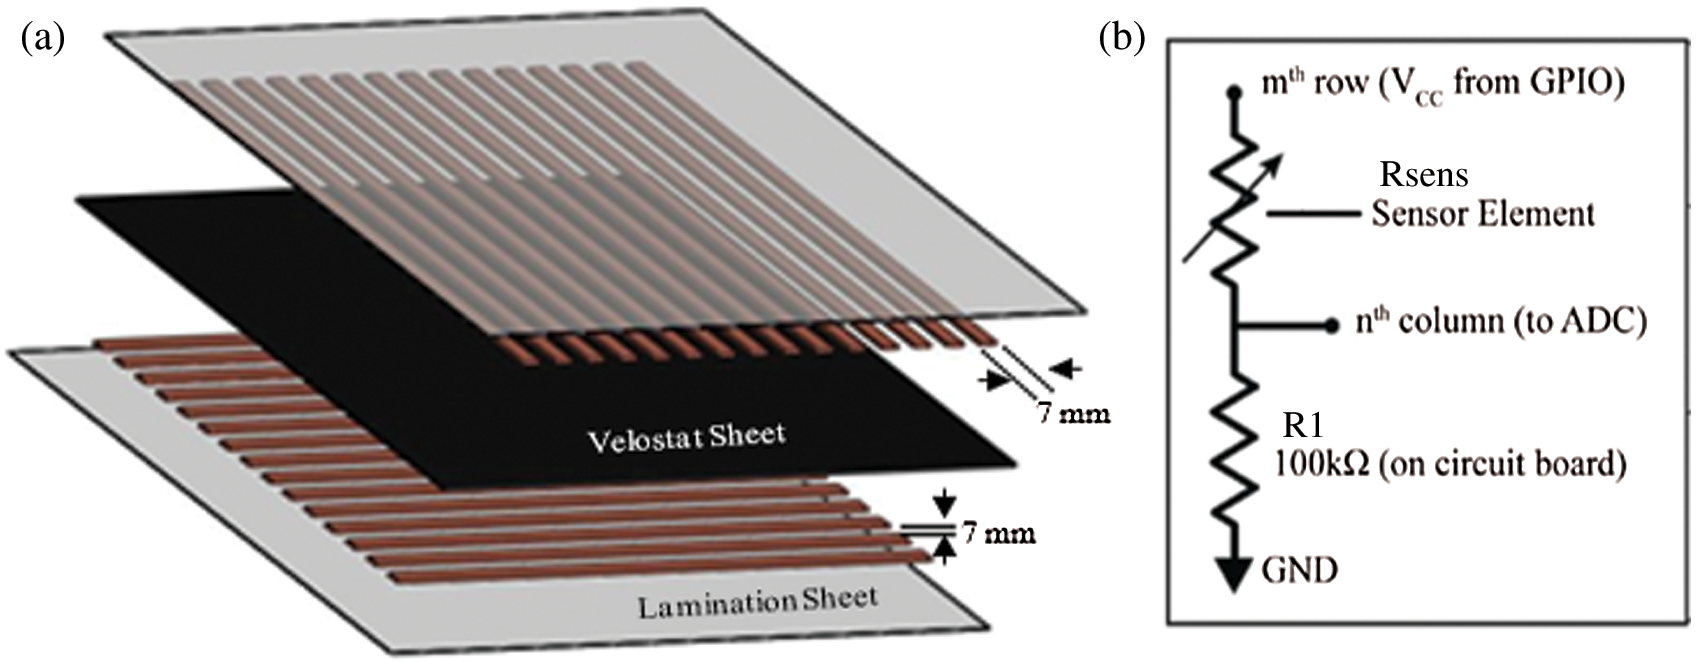
Figure 1: (a): Assembly setup (b): Sensing driver circuit
3.1.2 Displacement vs. Resistance vs. Load Response of Pressure Sensor
A shade of the pressure and size of the pressure sensor plays an important role in arranging sensing points. A tailor-made experimental setup [16] is shown in Fig. 2 is used to analyze a resistance response and load response. The experiment would able to exert varying pressure on the sensor. The applied pressure on the sensor changes the conductive network pore formation. The change in the conductive network distance is may lead to a change in the conductive nature of the sensor. Two samples of a circle, square-shaped are involved in the experiment. It has assessed the load response of the sensor samples. By rotating the ratchet the linear displacement on the sensor is achieved. Fixing of the linear displacement range is determined by the thickness and elasticity of the velostat sheet. The electrical conductivity as well as piezoresistance of the velostat is affected due to pore formations in the velostat. Lesser pore formation in polymer composites ensures the better piezoresistance, at the same time pores give elasticity effects and provide a better compressive behavior. A velostat sheet with thickness of 0.1 mm is taken into account at half its thickness. Even though velostat has good cyclic compressive behavior, so that the conductive polymer sheet is not damaged when subjected to compressive testing. The maximum attainment of displacement is considered as half of the sensor sheet thickness 0.05 mm. The applied linear displacement is exerting pressure on the sensor which is placed in the experimental setup. The known value of applied pressure is evenly distributed on the sensor and the change in resistance is acquired. The pressure value concerning displacement and the resistance value for the displacement are noticed for the analysis.
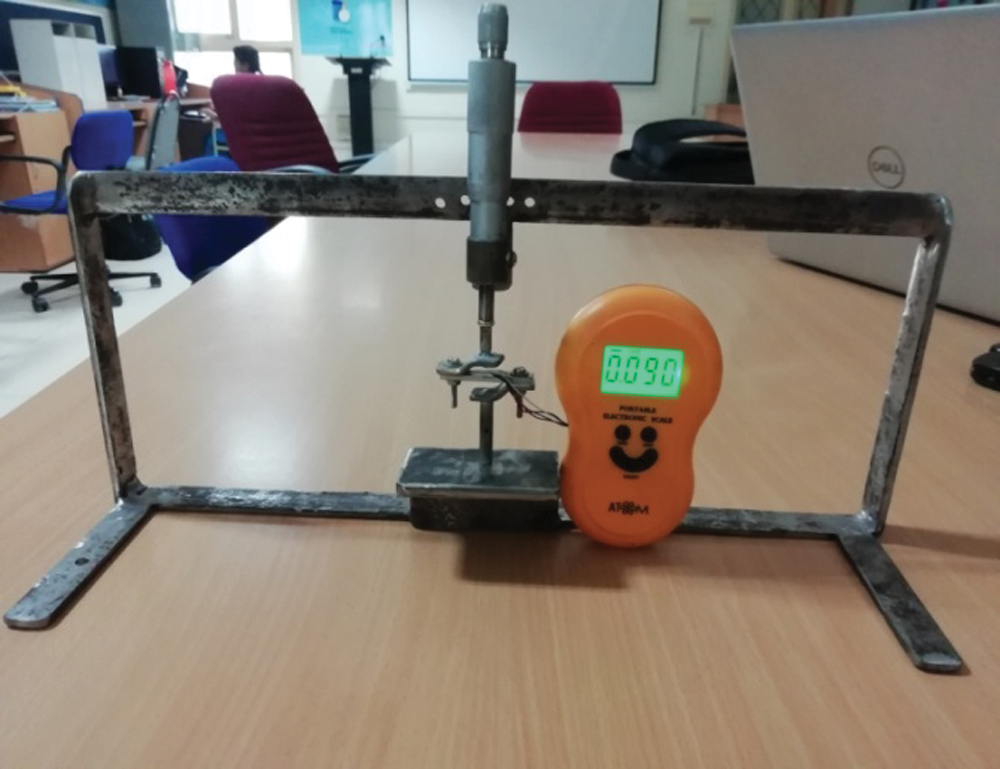
Figure 2: Experimental setup
3.2 Foot Pressure Data Acquisition
For the scanning of a particular sensing point in the 16x16 matrix, there are two 16:1 multiplexer is used. One is for control the row and the other hand controls the column. The entire 256 sensors were located, acquired, and transfer to the respective pressure data for further processing. Sensor location is identified using scanning technique, in this method initially single row is enabled and the individual column is scanned after that it is repeated for entire row. The pressure applied by the foot of the human has been considered. The load of the human body plays a major role while measuring the pressure distribution of the foot. The abrasion of the bone joint gives the pressure distribution of the foot. The 16x16 pressure values are converted as a heat map image for easy observation.
3.3 Classification of Foot Pressure Data
Machine learning is about learning of computer algorithm for improving it automatically through experience. Feature extraction and classification are done using open-source software orange. Initially, images are embedding from the dataset using Google's inception v3 deep neural network model. It is trained on the ImageNet dataset. Embedding is nothing but images represented with a vector of numbers. In image embedding, images are loaded in the server, and vector representations are computed. Then it is locally downloaded for the further classification process. The machine learning process consists of supervised learning, unsupervised learning, semi-supervised learning, etc., for image classification. This classification can be done for training data and also for test data. In the proposed work after extracting the vector representation of heat map images, it was used for the machine learning algorithm. Before the training the dataset is divided into training data, testing data. To avoid overfitting error, here cross-validation sampling method is used. In this sampling method, 10-folds is considered for split the data. Cross-validation splits the data into a given number of folds. The algorithm is tested by holding out samples from one fold at a time and the model is induced from other folds and samples from the held-out fold are classified. It is repeated for all the folds, which is given earlier in the number of folds. The foot pressure images are classified by using various classifier algorithms.
4.1 Displacement vs. Resistance vs. Load
The resistance, load response related to displacement is measured with appropriate measuring instruments. Here, resistance was measured by using a fluke-115 digital multimeter, and the load pressure value was measured by using a digital scale. The measured data of two different shape circles (redius = 12 mm) and square (side = 21.3 mm) is plotted. This essential study is used to select the suitable shape of the sensing area.
Fig. 3a. clearly states that the resistance response and load response are almost similar for both circle shape as well as a square shape. So the sensor shape is not influenced by the performance. In matrix pressure pad design sensing area of the sensor is very one of the important parameters. It also decides the space between the sensors. The experiment discussed in Section 1 is repeated for different sizes of three square-shaped sensors. The resistance response of those three sizes is depicted in Fig. 3b. From the graphical representation of resistance responses, it is clearly stated that the size of the sensing area does not affect the sensor performance. And the calibrated pressure sensor sensitivity ranges from 0.213 to 25.24.
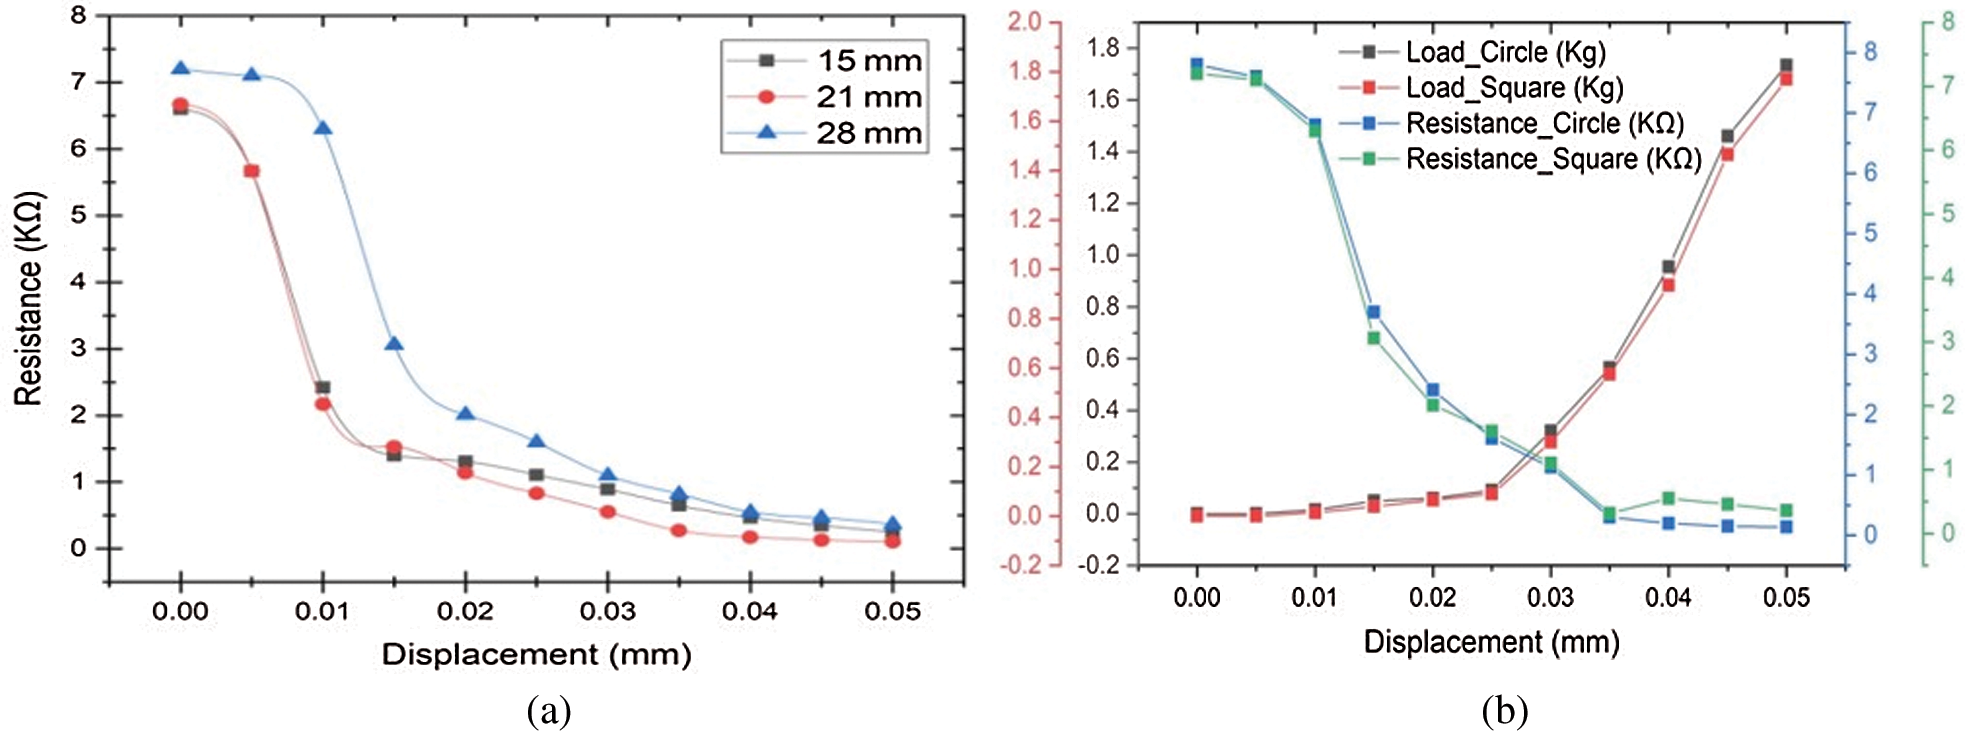
Figure 3: (a): Resitance, load response of two different shape of sensor (b): Graphical representation of resistance response
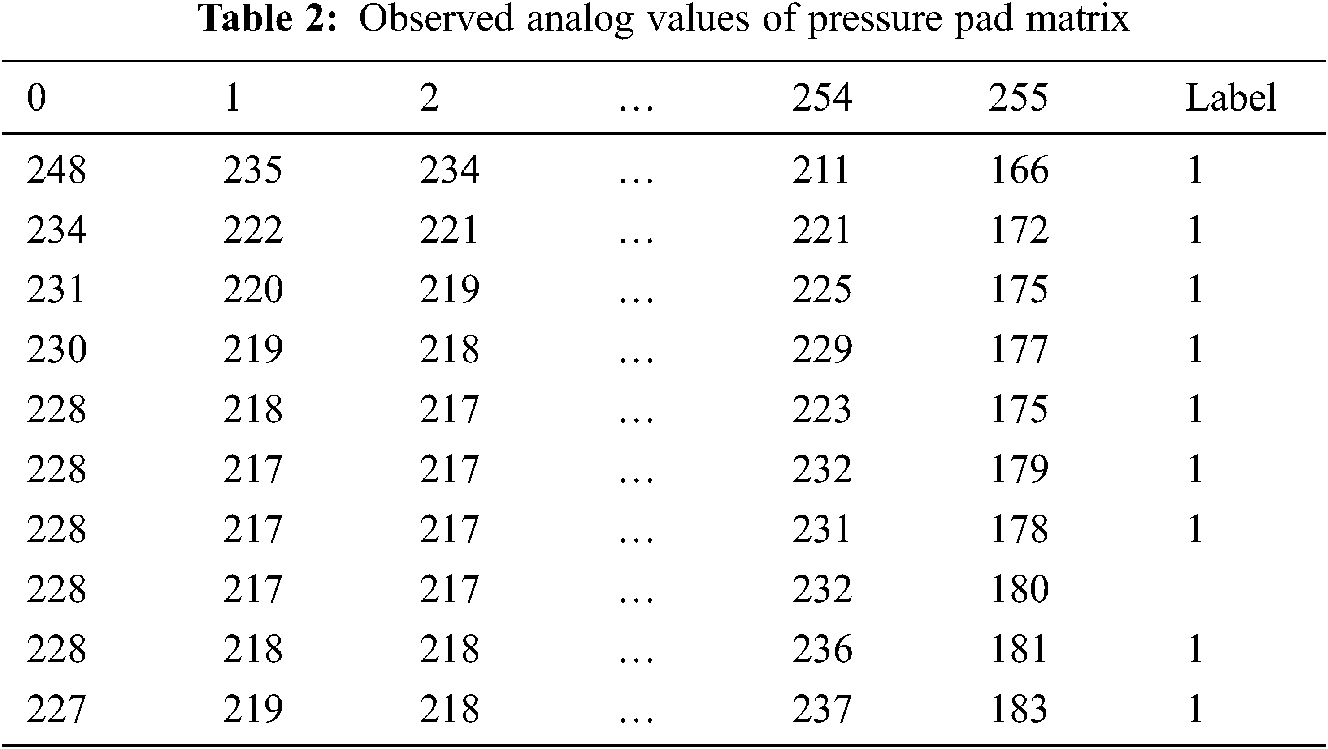
The calibrated matrix pressure pad was used to obtain the signals or pressure data from the pressure applied by the subject in the form of an analog. The observed analog values are extracted in the form of a table as shown in Tab. 2. The foot size may vary with each other even though the sensor detects the pressure applied on it and transfers the signal into a system. The observed analog values are converted into heat map images using the jet colormap algorithm. In this work, the structure of pressure exerted by the foot has been considering into account and the threshold value of foot pressure in this work has not been taken. Although the weight of the human body has an impact when measuring the pressure distribution of the foot, the pressure distribution in the foot depends on the wear and tear of the bone joint. In this Section 10 volunteers (without knee pain) and 6 knee pain patients total of 16 members were involved, and collect the samples from individual subjects. 5 trials were conducted and, in each trial, 10 samples were collected. Dataset totally consists of 800 images and it is used to knee pain detection.
For signal acquisition the basic circuit is shown in Fig. 1b. In this circuit, equivalent electrical properties of the piezoresistive sensor using velostat consider as Rsens. however, to improve the ground stability one end of resistor R1 (100 ohm) connected series with Rsens, and another is connected with ground. The pressure exerted by the foot causes changes in the resistance value of Rsens. The changes in resistance Rsens, affect the circuit balance condition, and it leads to a change in the junction J1 voltage. The voltage difference at the junction J1 between R1 and Rsens is taped and given to the inbuilt 10 bit ADC analog channel of the ATMEGA 328. The acquired 256 sensor pressure data is used to convert a heat map image. Gaussian interpolation, the jet color map is used for heat map creation. Finally, the 256-pressure data where the pressure applied on the surface of the matrix pressure pad was converted as a heat map image and it is depicted in Fig. 4.
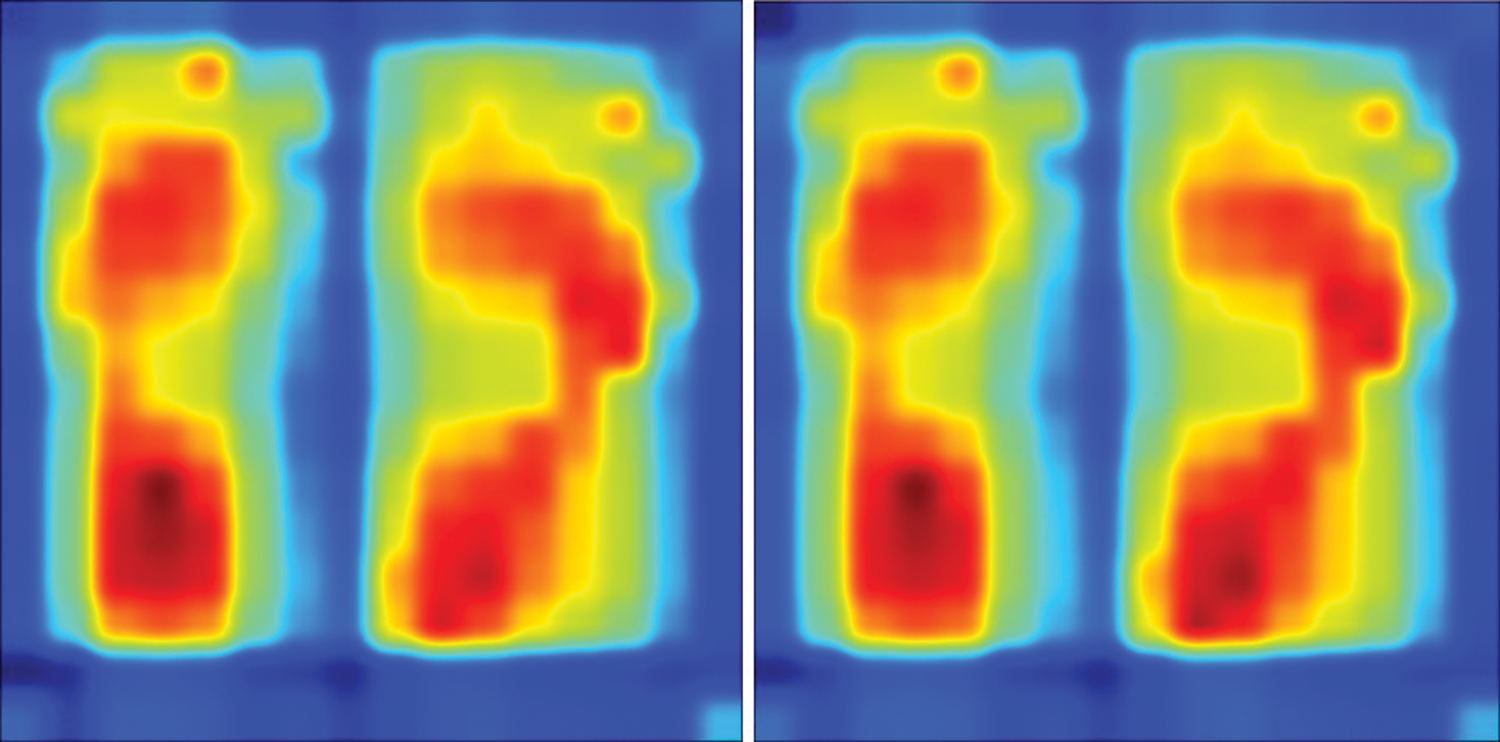
Figure 4: Heat map images of the subject
From the Fig. 4, the applied jet color map algorithm scales the pressure values and assigns the color for the scaled values. For this, the maximum pressure value gets a red color, and the minimum value is assigned by blue color. This converted heat map foot pressure image is used for further processing like image classification.
4.3 Classification Using Machine Learning Algorithm
Image embedding is done by Google's inception v3 deep neural network algorithm and it will represent as 2048 number of vectors. These 2048 number vector values consider as features and used to train the classifier module. In this proposed work different classifier algorithms such as Random Forest (RF), Decision Tree (DT), Multi-Layer Perceptron (MLP), Support Vector Machine (SVM), and Naïve Bayes classifier were used for the analysis of the classification performance. For classification, two target classes can be selected as pain and no pain. The classifier performance comparison is done using the evaluation result. The evaluation result consists of the area under the Receiver Operating Characteristic (ROC) Curve, classification Accuracy, Precision, F1 score, and Recall. The evaluation result of the mentioned classifiers is shown in Tab. 3
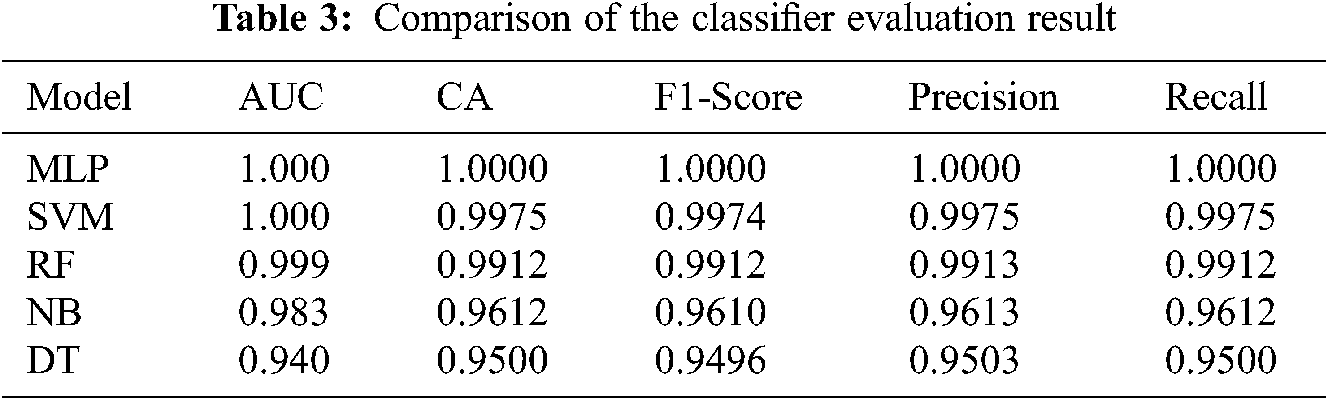
The Machine Learning (ML) algorithms were trained with 800 instances and the comparison shows that the MLP algorithm gives a greater percentage on correctly classified instances. From Tab. 2, the ML models generate the cross-validation results, and also it gives the correctly classified instances with high accuracy. When compared to all the methods, the MLP classifier gives the high correctly classified instances with 100% classification accuracy.
The generated confusion matrix for all the classification was given below in Figs. 5a–5e.
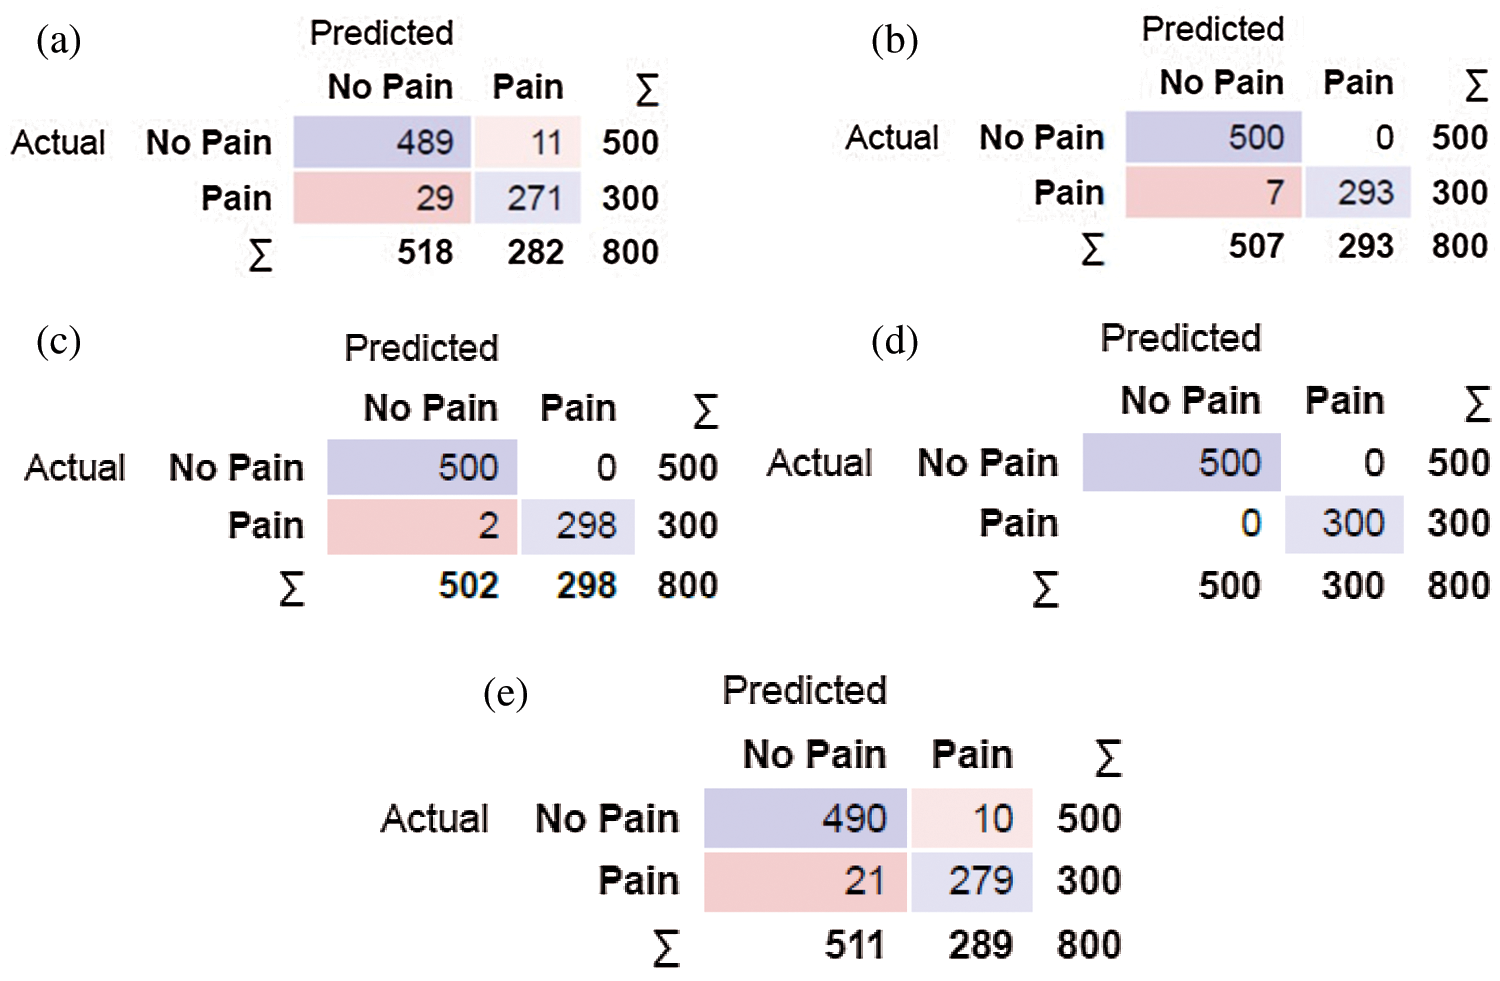
Figure 5: (a): Confusion matrix of RF (b): Confusion matrix of random tree (c): Confusion matrix of SVM (d): Confusion matrix of neural network (e): Confusion matrix of naïve bayes
Fig. 5a shows the confusion matrix of classification done using a random forest algorithm. The predicted values and actual values are classified based on the pain and no pain values. This can be explained in another way like the value 293 denotes that it classified 293 True Positive Values and 7 denote that it classified 7 False Positive Values. Similarly, it classified 0 False Negative Values and 500 True Negative Values. The Random Forest algorithm classifies all the 800 instances and the confusion matrix was generated with False Positive, False Negative, True Positive, and True Negative values.
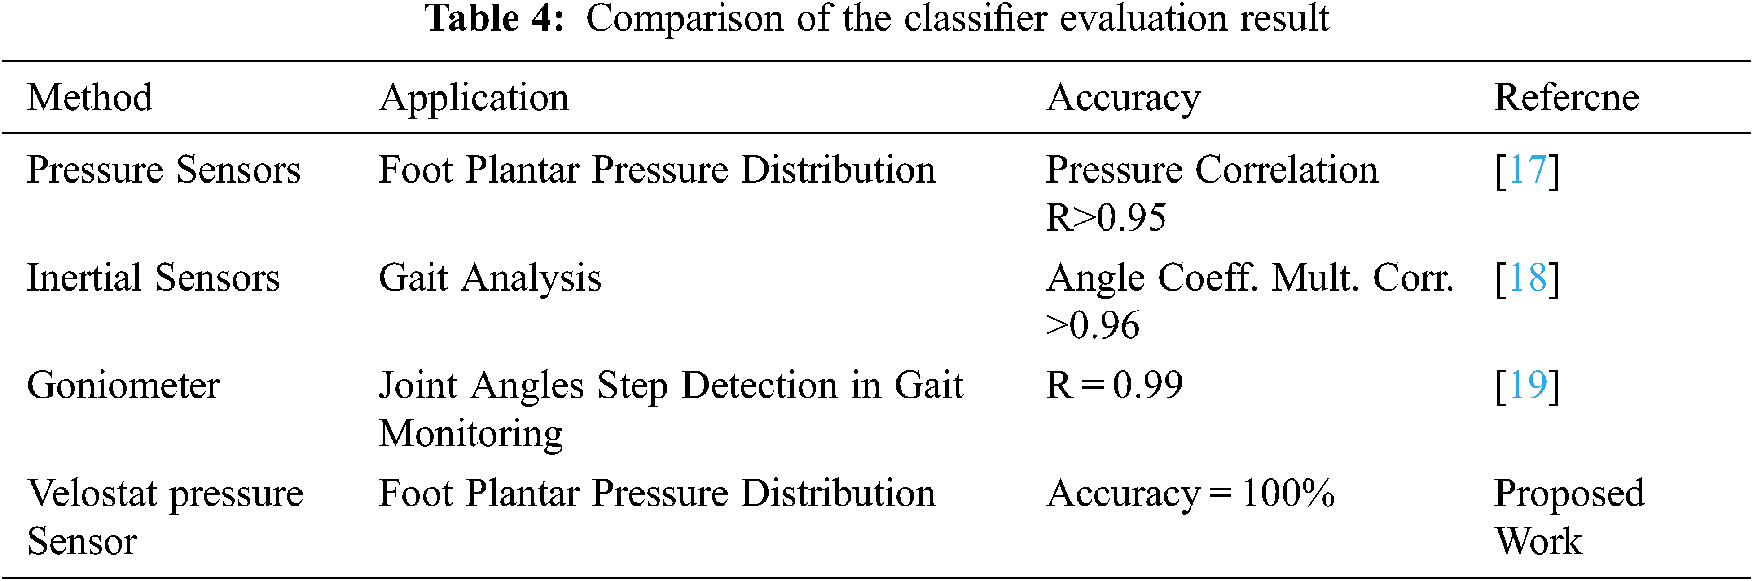
Similarly, Fig. 5b–5e also generated a confusion matrix with False Positive, False Negative, True Positive, and True Negative values as shown in the table above. When compared to other classifiers MLP classification algorithm gives higher efficiency and which is most suitable for the proposed system. The proposed work accuracy result is compared with some existing gold references for the improvement purpose which is listed in Tab. 4.
In the proposed system, a matrix pressure pad was designed using piezoresistive material. Based on the size of the sensors the pressure pad was designed in the form of 16x16 matrixes which consists of 256 sensors. The pressure applied on the pad by the subject is successfully converted in the form of heat map images. The static pressure images were classified by five different classifiers, among the 5 classifier algorithms multi-level perceptron algorithm is given 100% accuracy, and SVM is given 99.7% classification accuracy. From this, it is concluded that the MLP is the most suitable algorithm for the proposed work. In the future using of Deep Learning algorithm may achieve instant classification and the data acquisition can be done in wireless mode also the number of sensing points can be increased.
Funding Statement: The authors received no specific funding for this study.
Conflicts of Interest: The authors declare that they have no conflicts of interest to report regarding the present study.
1. T. Yang, H. Zhu, X. Gao, Y. Zhang, Y. Hui et al., “Grading of metacarpophalangeal rheumatoid arthritis on ultrasound images using machine learning algorithms,” IEEE Access, vol. 8, pp. 67137–67146, 2020. [Google Scholar]
2. L. D. Montejo, J. Jia, H. K. Kim, U. J. Netz, S. Blaschke et al., “Computer-aided diagnosis of rheumatoid arthritis with optical tomography, part 1: Feature extraction,” Journal of Biomedical Optics, vol. 18, no. 7, pp. 76001, 2013. [Google Scholar]
3. P. Emery and D. P. Symmons, “What is early rheumatoid arthritis?: Definition and diagnosis,” Bailliere's Clinical Rheumatology, vol. 11, no. 1, pp. 13–26, 1997. [Google Scholar]
4. K. W. Chan, D. T. Felson, R. A. Yood and A. M. Walker “The lag time between onset of symptoms and diagnosis of rheumatoid arthritis,” Arthritis Rheum, vol. 37, no. 6, pp. 814–20, 1994. [Google Scholar]
5. M. Frize, C. Adea, P. Payeur, G. Di Primio, J. Karsh et al., “Detection of rheumatoid arthritis using infrared imaging,” Medical Imaging, 2011: Image Processing, vol. 7962, pp. 1–11, 2011. [Google Scholar]
6. S. J. Spalding, C. K. Kwoh, R. Boudreau, J. Enama, J. Lunich et al., “Three-dimensional and thermal surface imaging produces reliable measures of joint shape and temperature: A potential tool for quantifying arthritis,” Arthritis Research & Therapy, vol. 10, no. 1, pp. 1–9, 2008. [Google Scholar]
7. Capo, E. Ismail, D. Cardone, E. Celletti, M. Auriemma et al., “Joint functional impairment and thermal alterations in patients with psoriatic arthritis: A thermal imaging study,” MicrovascularResearch, vol. 102, no.1, pp. 86–91, 2015. [Google Scholar]
8. T. Beyer, D. W. Townsend, J. Czernin and L. S. Freudenberg, “The future of hybrid imaging-part 2: PET/CT,” Insights into Imaging, vol. 2, no. 3, pp. 225–234, 2011. [Google Scholar]
9. C. Lin, E. W. Karlson, H. Canhao, T. A. Miller, D. Dligach et al., “Automatic prediction of rheumatoid arthritis disease activity from the electronic medical records,” PLOS One, vol. 8, no. 8, pp. e69932(1–102013. [Google Scholar]
10. John. C. Platt, “Probabilistic outputs for support vector machines and comparisons to regularized likelihood methods,” Advances in Large Margin Classifiers, vol. 10, no. 3, pp. 61–74, 1999. [Google Scholar]
11. G. H. John and P. Langley, “Estimating continuous distributions in Bayesian classifiers,” ArXiv Preprint ArXiv, vol. 1302, no. 4964, pp. 338–345, 2013. [Google Scholar]
12. S. le. Cessie and J. C. van Houwelingen, “Ridge estimators in logistic regression,” Journal of the Royal Statistical Society: Series C, vol. 41, no. 1, pp. 191–201, 1992. [Google Scholar]
13. H. Witten, E. Frank, Mark A. Hall, and Christoper J. Pal, “Data mining: Practical machine learning tools and techniques with java implementations,” ACM Sigmod Record, vol. 31, no. 1, pp. 76–77, 2002. [Google Scholar]
14. B. Turner, S. Williams, D. Taichman, Tom W. J. Huizinga and T. Pincus, “Rheumatoid arthritis,”Annals of Internal Medicine, vol. 153, no. 1, pp. 1–16, 2010. [Google Scholar]
15. Paul J. Brigandi, Jeffrey M. Cogen and Raymond A. Pearson, “Electrically conductive multiphase polymer blend carbon based composites,” Polymer Engineering Science, vol. 54, no. 1, pp. 1–16, 2014. [Google Scholar]
16. P. Ramya, B. Padmapriya and S. Poornachandra, “Foot pressure monitoring using single layer carbon loaded piezoresistive material,” Microprocessors and Microsystems, vol. 79, no. 1, pp. 103263, 2020. [Google Scholar]
17. Razak, A. Hadi, Rezaul K. Begg and Y. Wahab, “Foot plantar pressure measurement system: A review,” Sensors, vol. 12, no. 7, pp. 9884–9912, 2012. [Google Scholar]
18. Ong. S. Hillman, J. Robb, “Reliability and validity of the Edinburgh visual gait score for cerebral palsy when used by inexperienced observers,” Gait & Posture, vol. 28, no. 2, pp. 323–326, 2008. [Google Scholar]
19. G. Domínguez, E. Cardiel, S. Arias and P. Rogeli, “A digital goniometer based on encoders for measuring knee-joint position in an orthosis,” in World Congress on Nature and Biologically Inspired Computing, Fargo, ND, USA, pp. 1–4, 2013. [Google Scholar]
 | This work is licensed under a Creative Commons Attribution 4.0 International License, which permits unrestricted use, distribution, and reproduction in any medium, provided the original work is properly cited. |