DOI:10.32604/csse.2022.020453
| Computer Systems Science & Engineering DOI:10.32604/csse.2022.020453 | |
| Article |
RFID Positioning and Physiological Signals for Remote Medical Care
1Department of Electrical Engineering, National Chin-Yi University of Technology, Taichung, 411030, Taiwan
2Department of Information Technology, Takming University of Science and Technology, Taipei City, 11451, Taiwan
*Corresponding Author: Sung-Jung Hsiao. Email: sungjung@gs.takming.edu.tw
Received: 25 May 2021; Accepted: 03 July 2021
Abstract: The safety of patients and the quality of medical care provided to them are vital for their wellbeing. This study establishes a set of RFID (Radio Frequency Identification)-based systems of patient care based on physiological signals in the pursuit of a remote medical care system. The RFID-based positioning system allows medical staff to continuously observe the patient's health and location. The staff can thus respond to medical emergencies in time and appropriately care for the patient. When the COVID-19 pandemic broke out, the proposed system was used to provide timely information on the location and body temperature of patients who had been screened for the disease. The results of experiments and comparative analyses show that the proposed system is superior to competing systems in use. The use of remote monitoring technology makes user interface easier to provide high-quality medical services to remote areas with sparse populations, and enables better care of the elderly and patients with mobility issues. It can be found from the experiments of this research that the accuracy of the position sensor and the ability of package delivery are the best among the other related studies. The presentation of the graphical interface is also the most cordial among human-computer interaction and the operation is simple and clear.
Keywords: Remote medical care; active RFID; positioning; physiological signal
The use of RFID allows medical staff to keep track of patients at any time. Patients in hospital often need to go to different clinics for various treatments. However, when they enter and exit these clinics, a management mechanism to record the patients’ movements is often not available. The medical staffs usually need to call several clinics to determine the whereabouts of the patient in this case, which might cause them to miss a scheduled treatment or medication. The RFID positioning system proposed passive positioning calculation method in this study allows medical staff to quickly find the patient, and systematically manage and integrate their movements. The system is a service extended through RFID applications. It requires that RFID tags be attached to patients, trend cards in various clinics, and digital devices. When a patient is hospitalized, they wear a wristband with an RFID tag provided at the nursing station. Assuming that the patient requires ultrasound and X-ray examination, the nurse uses a handheld digital device to scan the patient's RFID tag and then scans the movement card. This ties the patient's information to data on the inter-office activity card; it is then sent to the central system through a digital device. Data concerning the patient's movement are thereby registered [1].
When medical staff cannot find a patient, they no longer need to call anywhere to inquire, but need only log in to the system to check the patient's status. The advantage of using RFID to manage the movement of patients is their quick identification and location using a large amount of information. This technology can be applied to various systems to offer a variety of services using only one RFID tag. For example, the patient's movement can be thus managed in the operation room, although the main target of service in this context is the patient's family. The RFID positioning system developed by this UHF-MIMO research institute allows medical staff to quickly check the movements of their patients, which saves them time that they can use to care for other patients [2,3].
Ensuring the safety of patients in hospital and improving the quality of medical care have long been the foci of medical research. In recent years, many applications based on RFID have been developed for medical care. For example, the National General Hospital of Taichung city uses RFID-based active control in the operating room to improve efficiency and reduce errors. In addition to reading and writing the related data, RFID-based devices can be used for location identification. This research combines healthcare with RFID-based positioning. The RFID-based system can use a wireless Wi-Fi module connected to the host to transmit signals and monitor the patient's condition at any time. In case of an emergency, the nursing staff can immediately locate the patient using RFID positioning and reach them in time. This enables the provision of timely and remote treatment and care according to the needs of patients [4].
RFID technology is mainly used for automatic identification, classification, tracking and tracing, statistical analysis, and access control. It has been widely used in hospital management in recent years. The RFID tags in this study can be applied to patients to improve their management and monitor their locational trends. RFID readers can also be used to confirm the identity of nuclear medicine, medicine received, and the administering of drugs to improve the safety of medication. It can be used to manage valuable equipment and property, and to maintain an inventory. When needed, it can warn users of the loss of items [5–7].
Jan et al. [8] proposed a system that can locate the elderly in real time by using information via active RFID tags. Postolache et al. [9] proposed a developmental pervasive sensing and computing system to assess patients’ health, but it lacks clear and timely positioning and calculation capabilities as well as data fusion functions to integrate multiple physiological signals. Liu et al. [10] used a rotating antenna and passive RFID tags to compute the patient's location, but this design is not suitable for use in hospitals. Because passive RFID tags without an autonomous power supply can lead to the loss of packets of data, active tags are used in this study to improve the reliability of data transmission.
Meihuan proposed parameters to glean information from physiological signals of patients. By using a chip containing a processor, complex physiological signals can be fused to obtain important information on the patient. A DSPIC30F4011 chip was used to perform the complex calculations, and yielded promising results [11–13].
Fig. 1 shows that the architecture of the hardware of the proposed system can be divided into four parts: modules to acquire physiological signals, network transmission modules, RFID-based positioning equipment, and equipment to display processing at the data center. In experiments to verify the proposed system, the authors used four RFID readers and three mobile user nodes. The system also provides users with various physiological signals and functions for analysis, including electrocardiogram measurements, oxygen concentration, blood pressure, and body temperature. These signals can be monitored over the long term.
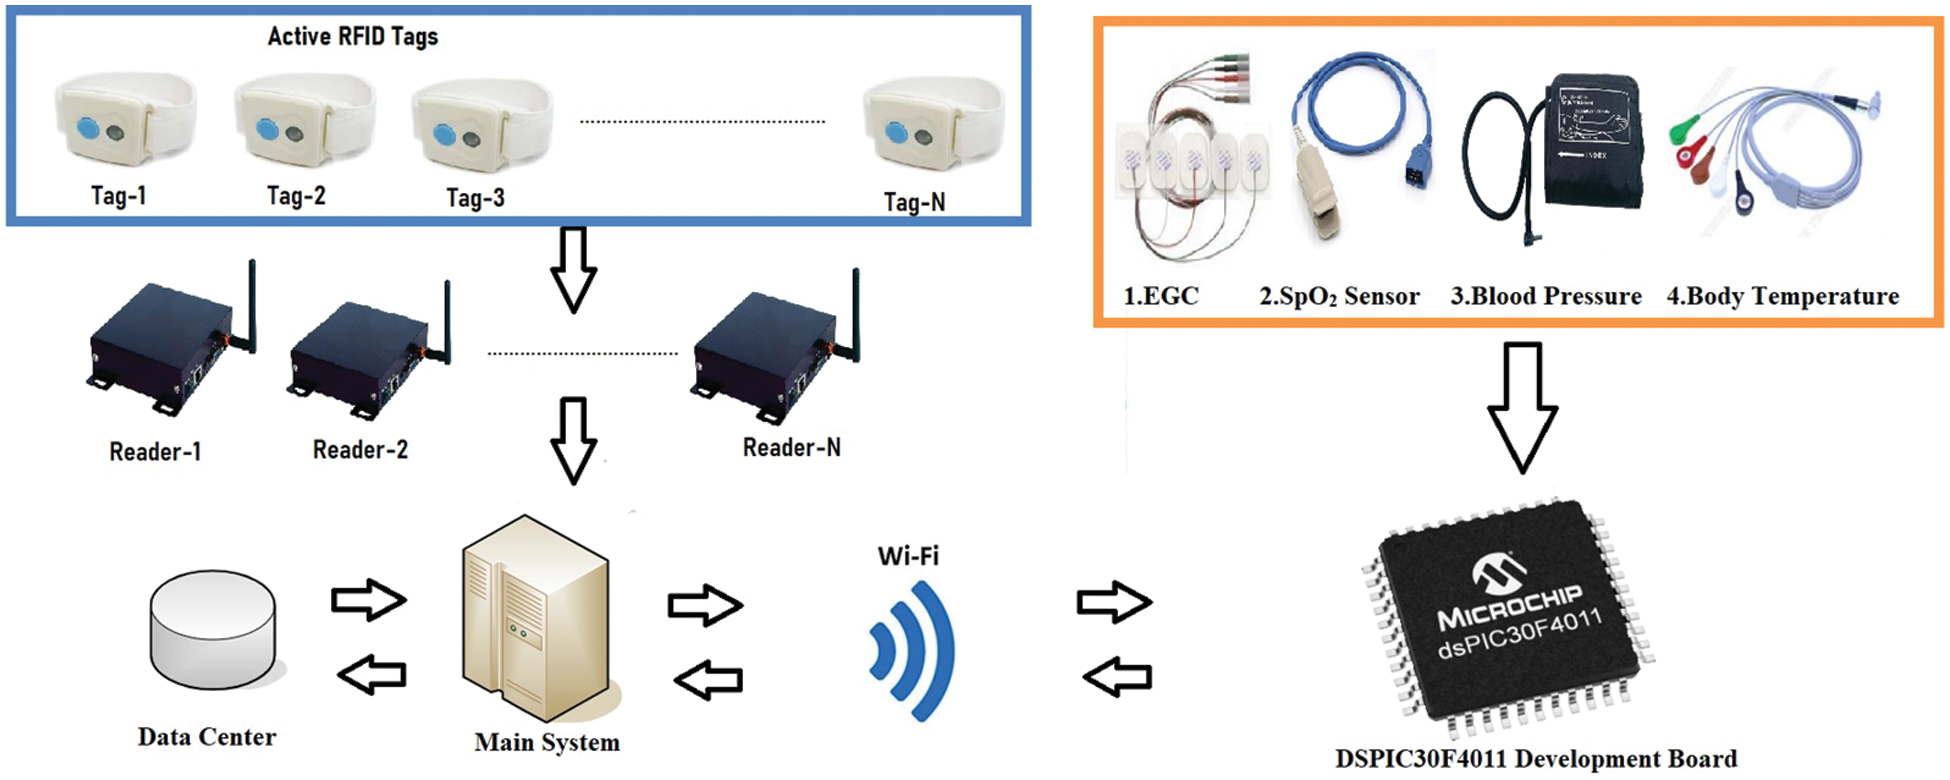
Figure 1: System hardware
Fig. 2 shows the architecture of the active RFID-based system. It sends location signals from the RFID-based active tags of the relevant staff member or patient, and obtains accurate location information through positioning calculations by using multiple adjacent readers. It stores the information in the location tracking database of the data center so that managers can access it on a terminal or a mobile device when needed.
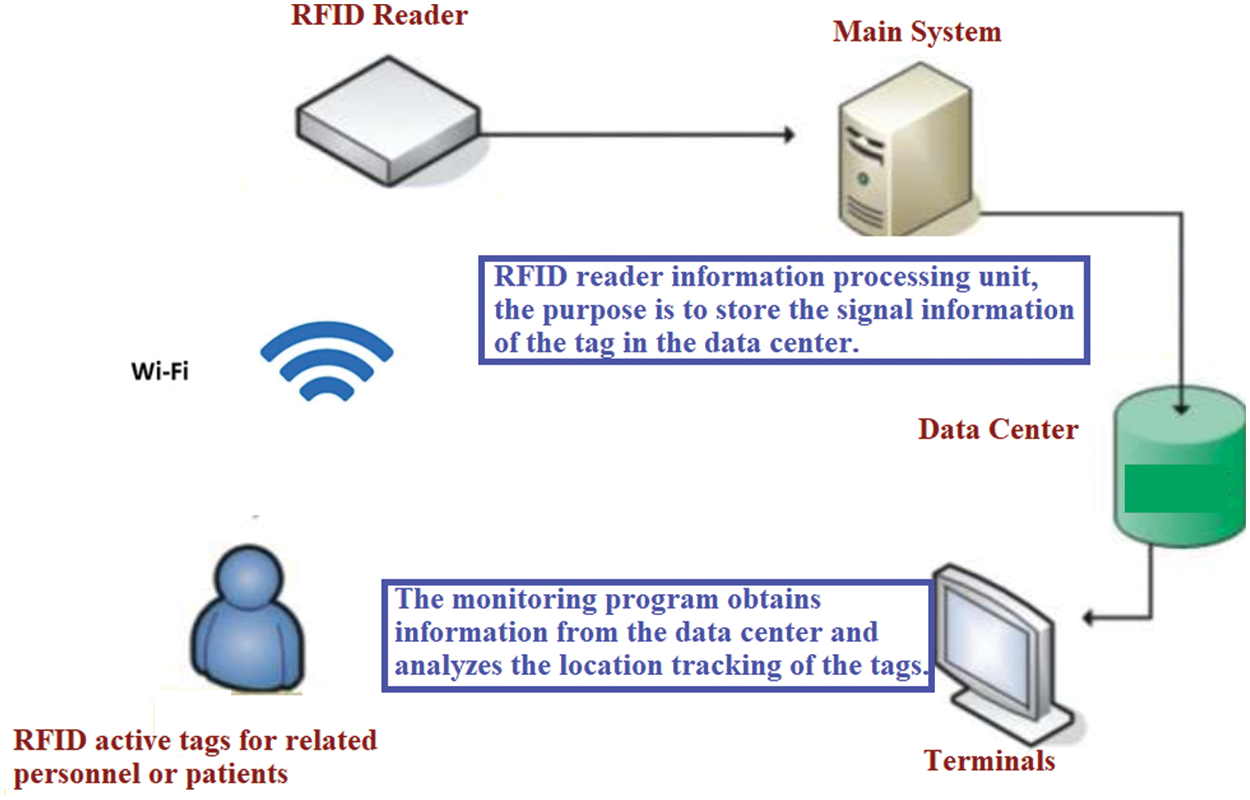
Figure 2: Architecture of active RFID system
The authors use the DSPIC30F4011 chip for information fusion and collection, and to calculate and analyze remote physiological signals. The system generates an early warning to notify the relevant personnel. Fig. 3 shows a model of the chip used in the system. Its development circuit can measure the ECG, respiratory rate, body temperature, blood oxygen saturation, and blood pressure. Physiological signals collected from patients are sent to the main data processing terminal and the terminal display equipment through the Wi-Fi transmission module so that the relevant medical personnel can remotely access the information. The patient's location information is read through a pre-set, fixed RFID reader according to the active RFID tag. The tag is mobile. The system uses the RS-232 signal processing data unit to process the location information, which is then transmitted to the data processing and display equipment. The patient's trajectory and related information from the past can also be checked through the data center and coordinated with previous measurements. Local physiological signals are presented together to allow medical care managers to arrange for the next stage of treatment [14,15].
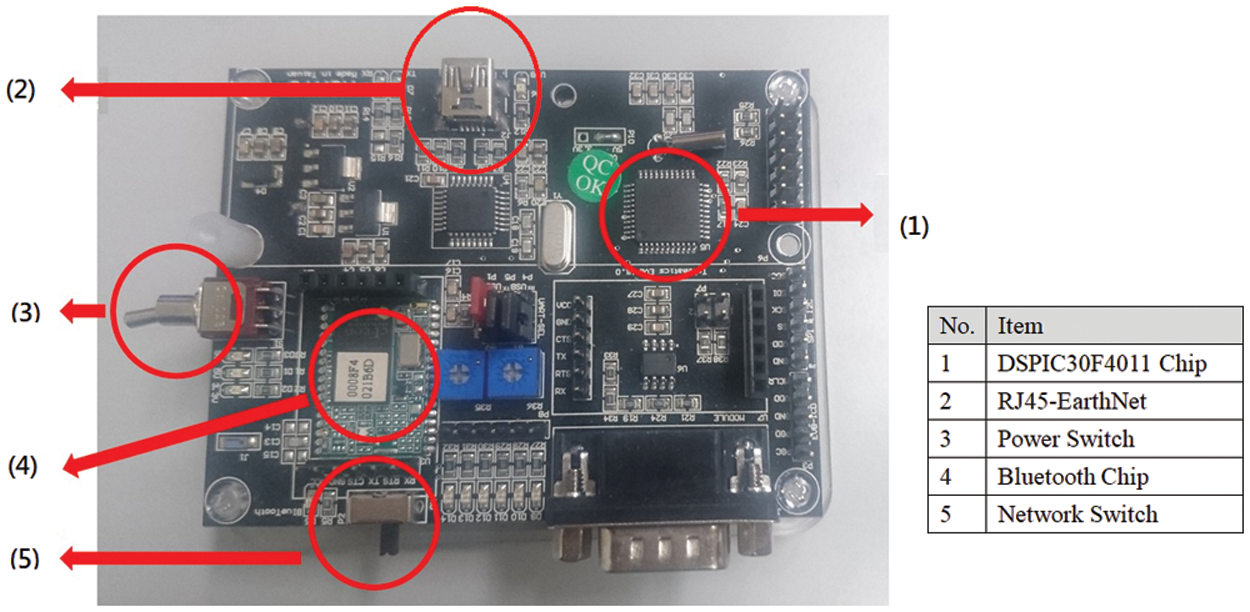
Figure 3: DSPIC30F4011 development board
The remote monitoring interface of the system can read the patient's physiological data and location information at any time and in any place. In case of abnormal information or an emergency, the system can quickly activate the emergency system to connect with the relevant security units and nearby medical personnel.
4 Modules to Collect Physiological Signals
The system provides five modules to remotely collect physiological signals. They include measurement circuit modules for the heart rate, respiratory rate, blood pressure, body temperature, and blood oxygen saturation. The DSPIC30F4011 processor acts as the main control center. The relevant data are sent to the main computer system through the Wi-Fi transmission module and instantly transmitted to the terminal display device. The digital signal processing chip has flexible command settings and operation. It enables the system to easily achieve optimal control, and it has a complete signal control interface. It can also reduce noise and increase the speed of calculation while reducing delays in signal processing [16].
This blood pressure measurement module uses the oscillation method. The instrument is first inflated, and blood flow is then stopped by completely crushing the artery. Then, when the pressure sensor reads a pulse above the venous pulse, the pressure of the instrument is slowly released, and the pulse pressure gradually increases. Experiments have shown that when the pressure in the cuff is equal to the average pressure, the former is at its highest value. The pressure in the cuff then decreases to reduce blockage in the blood vessel, and the ejection force gradually decreases. There is no pulsation until the cuff pressure is lower than the diastolic pressure [17]. The experimental results reported in this study show that pressure in the blood pressure bag is equal to the average pressure of the artery, and its maximum amplitude is the amplitude of swing of center-based oscillation. When the amplitude of vibration is about 50% of its maximum amplitude, the pressure in the cuff is approximately identical to the systolic pressure. If the maximum amplitude returns to the center, pressure in the cuff is equal to the diastolic pressure when the vibrational wave is at about 80% of the maximum amplitude. The waveform generated during the measurement process is shown in Fig. 4.

Figure 4: Waveform of blood pressure
The blood pressure module developed in this research is shown in Figs. 5a and 5b. Maximum amplitudes of 0.4–0.5 V and 0.8–0.9 V were set as the standard ranges of systolic and diastolic blood pressures, respectively. This measurement system is not affected by the heart rate and vascular impedance, and is the most feasible way to simultaneously measure the systolic blood pressure, diastolic blood pressure, and average pressure using a sphygmomanometer without preset conditions. All blood pressure monitors currently on the market use this method for measurement.

Figure 5: (a) Blood pressure arm band (b) Blood Pressure Module
4.2 Body Temperature and Respiration Rate Module
The measurement of body temperature is relatively simple. The lungs are like a variable capacitor. As the inspiratory and expiratory capacitances change, the former increases and the duration of expiration decrease. The rest of the body can be regarded as a resistance for the chest. When a small alternating current is added at a known frequency between points in the chest cavity, changes in the impedance of the lung relative to respiration can be calculated. This principle is called “impedance pneumography,” and Fig. 6a shows a simple transthoracic impedance model between points. RA, RB, and RC represent the resistance of the general human tissue, and RL and CL represent lung impedance [18]. Fig. 6b shows the respiratory rate and body temperature modules. This study used a two-in-one module circuit device to measure them. The results of experiments showed that the error of this measurement module was close to 0.05%, within the allowable range of 0.1% [19].

Figure 6: (a) Wire and electrode patch; (b) body temperature and respiration rate modules
Figs. 7a and 7b shows the heart rate module. The principle of the electrocardiogram is to place electrodes on the patient's skin, record the heart's electrical activity over a period of time, and draw a curve to represent it over time. These electrodes detect minor electrical changes in the skin caused by the electrophysiological pattern of depolarization and repolarization of the myocardium during each heartbeat of the patient. This is a very common device to check for heart disease and arrhythmia.

Figure 7: (a) ECG wire and electrode patch; (b) heart rate module
4.4 Blood Oxygen Saturation Module
Fig. 8 shows the framework for the measurement of blood oxygen saturation. The blood oxygen saturation refers to the ratio of oxygen-saturated hemoglobin to total hemoglobin (unsaturated + saturated) in the blood. The measurement module used in this research combines light-emitting diodes and photosensitive sensors to measure the absorption of red and infrared light in the limbs. The final result is the blood oxygen saturation and the difference in the absorption of deoxyhemoglobin. Figs. 9a and 9b show the SpO2 Sensor and blood oxygen saturation module. The blood oxygen concentration of a normal person is between 96% and 98% [20].

Figure 8: SpO2 sensor

Figure 9: (a) SpO2 sensor; (b) blood oxygen saturation module
Radio frequency identification (RFID) uses electromagnetic fields to automatically identify and track tags attached to objects. The label contains information stored electronically. Passive tags (passive RFID) harvest energy from interrogating radio waves of nearby RFID readers. Active tags (active RFID) have local power sources (such as batteries), and can operate hundreds of meters away from the RFID reader. Unlike a barcode, the tag does not have to be in the reader's line of sight, and can be embedded inside the tracked object [21]. This study uses an active RFID-based wristband and an active RFID reader as a real-time wireless positioning system. In the RFID-based beacon set by the system, a position message can be sent within 0.05 s to relay the patient's exact position in time. The active RFID-based tag and RFID reader used in the research are shown in Figs. 10a and 10b, respectively.

Figure 10: (a) Active RFID wristband; (b) active RFID reader
The received signal strength indicator (RSSI) can be used to measure the distance between the transmitter and the receiver. The RSSI value of the receiver reflects the intensity of RF energy. RF energy is lost when transmitter sends a signal to the receiving end, where the degree of loss is proportional to the distance between the transmitter and the receiver, and the RSSI value is inversely proportional to this distance. A higher RSSI reflects a stronger signal and shorter distance between the transmitter and the receiver. When the RSSI value is negative (for example, −100), the closer the value is to zero, the stronger is the received signal. The relationship between signal strength and distance is shown in Fig. 11 [22].

Figure 11: Relationship between signal strength, and the distance between the transmitter and the receiver
Eq. (1) represents the relationship between the RSSI, and the distance between the transmitter and the receiver:
In Eq. (1), d represents the distance between the transmitter and the receiver, d0 is the reference distance, Pr(d0) is the energy received at the reference distance d0, X(dBm) represents a variable of the Gaussian distribution with an average value of zero, and n is called a signal propagation constant, and reflects the relation with the environment. In practice, Eq. (1) is generally simplified to Eq. (2):
If the reference distance in Eq. (2) is set to 1 m,
In Eq. (3), A is the power consumed when transmitting at signals a distance of 1 m (dBm).
5.3 Round Intersection Positioning
The RSSI is measured by using three active coordinates of the known RFID reader. The distance d between each of the three readers and the RFID tag is calculated using Eq. (3). The coordinates of the point of intersection D are those of the RFID tag, as shown in Fig. 12 [23].
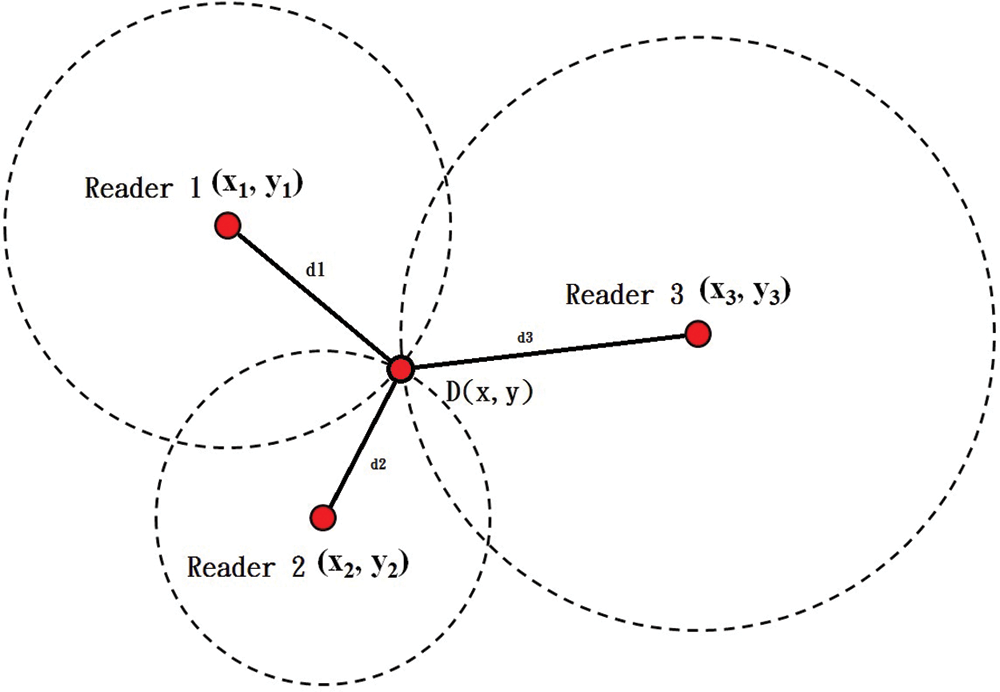
Figure 12: Diagram of round intersection point positioning
The coordinates of D can be calculated using Eq. (4):
The flow of the system is shown in Fig. 13. The flowchart for the program was designed in accordance with the direction of data transmission of the system. Physiological signals were first acquired through the DSPIC30F4001 processor, and the wireless base station was then set-up. (Access point) Information was transmitted to the gateway, and then to the terminal host and the data center for aggregation and display. The patient wore an active RFID tag on a wristband and moved arbitrarily in a specific environment. The system could receive the RSSI of the wristband through the RFID reader to perform round intersection positioning calculations. Finally, the patient's real-time positional information was transmitted to the terminal for aggregation so that remote medical care managers could determine the patient's physiological state and location in real time. The authors used self-adaptive data fusion via a wireless sensors network to remotely monitor the medical care control system. The results of experiments showed that the system can enable the accurate and stable monitoring of the patient [24–26]. It can solve three pressing problems:
• This system is cheap to develop, and does not increase the burden on medical units.
• Because people infected with COVID-19 are asymptomatic, or have mild symptoms, in the initial stage, they do not need treatment in negative pressure wards, and can be quarantined in hotels. In this case, the proposed system can enable medical care and security personnel to monitor them [27].
• This system can measure the blood oxygen concentration of COVID-19 patients at any time. The virus can cause hypoxia in a short period. If this is not detected in time, the patient can die suddenly. The blood oxygen concentration measurement device allows medical staff or security personnel to have access to the patient's blood oxygen level at any time. Once an abnormality is found, it can be dealt with immediately to ensure safety [28].

Figure 13: Flowchart of system
7 Experimental Results and Analysis
The signal collection module used in this research is based on various physiological measurement modules as shown in Fig. 14. The output signal of each electrode pair is called a set of leads. A lead reflects changes in cardiac current at different angles. Fig. 15 shows different ECG leads. Fig. 16 is system GUI for personal medical information. Fig. 17a shows the patient's physiological signal. The system shows that the patient has an irregular heartbeat, which indicates an arrhythmia. Fig. 17b shows that the patient's diastolic and systolic blood pressures were both high, which indicates high blood pressure. This research uses the laboratory as RFID to locate the simulated location in time, and connects with the adjacent Taiwan Chinese Military General Hospital. The active RFID signal was sent from the RFID reader to the data terminal host via RS-232. The information was analyzed and displayed remotely in real time. Once the monitor received the data for the RSSI algorithm and used the circle intersection method for analysis, the patient's coordinates were calculated and displayed on the interface, as shown in Fig. 18.

Figure 14: Health monitoring interface

Figure 15: Waveform of health information and mobile phone display

Figure 16: GUI for personal medical information

Figure 17: Analysis of personal medical information (a) case study of arrhythmia (b) case study of high blood pressure

Figure 18: Experimental results of positioning
We assumed that the coordinates of Reader 1 were (0, 0). One unit was equal to 1 m. Tab. 1 shows the results of several round of experiments, and shows that RFID-based positioning was accurate within 1 m, which is acceptable because such an error does not delay the identification of the patient's location by staff.

Figs. 15–18 show that in case of an emergency, the medical staff could quickly find the patient and aid them. Figs. 19a and 19b show that as the signal dwell time increases, fewer position updates are required. The influence of the number of the sensors on the cost of packet delivery is represented in Figs. 19a and 19b. Fig. 19a shows the ratio of the number of sensor nodes to the accuracy of the system's position calculations. The greater the number of sensors in the system was, the higher the accuracy of its positioning was. The proposed system yielded accuracy at least 20% higher than prevalent system. Fig. 19b shows whether the capacity for packet transmission decreased when more sensors were used. When the number of sensor nodes increased, the capacity of packet transmission was higher than has been reported in past work [29–33].

Figure 19: (a) Accuracy of location vs. number of sensors; (b) pack delivery capacity vs. the number of sensors
This study proposed and verified a system for the provision of remote medical care to patients by monitoring their physiological condition and tracking their movements. In case of an emergency, the remotely located medical care management staff can identify the location of the patient through RFID and assist them in time.
Through the use of multiple IoT technologies, such as indoor and outdoor positioning, sensing devices, system integration, and cloud platforms, the hardware and software systems of many hospitals have become more convenient to use. This also reduces the workload on the nursing staff in elderly care institutions. When the COVID-19 epidemic broke out, we used the proposed system to monitor the location and body temperature of patients who had been screened for the disease. This helped identify abnormalities and locate the patient in a timely and accurate manner while saving time and reducing the risk of infection.
Acknowledgement: This research was supported by the Department of Electrical Engineering at National Chin-Yi University of Technology. The authors would like to thank the National Chin-Yi University of Technology, Takming University of Science and Technology, Taiwan, for supporting this research. We thank Cwauthors (https://www.cwauthors.com) for its linguistic assistance during the preparation of this manuscript.
Funding Statement: The authors received no specific funding for this study.
Conflicts of Interest: The authors declare that they have no conflicts of interest to report regarding the present study.
Availability of data and materials: Data sharing not applicable to this article as no datasets were generated or analyzed during the current study.
1. S. Grebien, F. Galler, D. Neunteufel, U. Mühlmann, S. J. Maier et al., “Experimental evaluation of a UHF-MIMO RFID system for positioning in multipath channels,” in Proc. RFID-TA, Pisa, Italy, pp. 95–100, 2019. [Google Scholar]
2. A. A. N. Shirehjini, A. Yassine and S. Shirmohammadi, “Equipment location in hospitals using RFID-based positioning system,” IEEE Transactions on Information Technology in Biomedicine, vol. 16, no. 6, pp. 1058–1069, 2012. [Google Scholar]
3. S. S. Saab and Z. S. Nakad, “A standalone RFID indoor positioning system using passive tag,” IEEE Transactions on Industrial Electronics, vol. 58, no. 5, pp. 1961–1970, 2011. [Google Scholar]
4. J. H. Cho and M. -W. Cho, “Effective position tracking using B-spline surface equation based on wireless sensor networks and passive UHF-RFID,” IEEE Transactions on Instrumentation and Measurement, vol. 62, no. 9, pp. 2456–2464, 2013. [Google Scholar]
5. D. Zhang, X. Wang, X. Song and D. Zhao, “A novel approach to mapped correlation of ID for RFID anti-collision,” IEEE Transactions on Services Computing, vol. 7, no. 4, pp. 741–748, 2014. [Google Scholar]
6. C. -H. Huang, L. -H. Lee, C. C. Ho, L. -L. Wu and Z. -H. Lai, “Real-time RFID indoor positioning system based on kalman-filter drift removal and heron-bilateration location estimation,” IEEE Transactions on Instrumentation and Measurement, vol. 64, no. 3, pp. 728–739, 2015. [Google Scholar]
7. D. Sobnath, T. Kaduk, I. U. Rehman and O. Isiaq, “Feature selection for UK disabled students’ engagement post higher education: A machine learning approach for a predictive employment model,” IEEE Access, vol. 8, pp. 159530–159541, 2020. [Google Scholar]
8. G. E. Jan, C. -C. Sun, L. -P. Hung, Y. -S. Jan and S. -H. Weng, “Real-time monitor system with RFID localization for seniors,” in Proc. ISCE, Hsinchu, Taiwan, pp. 75–76, 2013. [Google Scholar]
9. O. Postolache, P. S. Girão, E. Pinheiro, M. D. Pereira, R. Madeira et al., “Pervasive sensing and computing for wheelchairs users health assessment,” in Proc. Pbem, Lisbon, Portugal, pp. 1–4, 2011. [Google Scholar]
10. C. Liu, Z. Cheng, Y. Zhang and G. Wang, “An indoor positioning system based on RFID with rotating antenna and passive tags,” in Proc. ICRAE, Shanghai, China, pp. 455–459, 2017. [Google Scholar]
11. Z. Meihuan, “Embedded design of human motion physiological parameter collector,” in Proc. ICPICS, Shenyang, China, pp. 538–541, 2020. [Google Scholar]
12. Y. Hu, S. Nakamura, T. Yamanaka and T. Tanaka, “Physiological signals responses to normal and abnormal brake events in simulated autonomous car,” in Proc. APSIPA ASC, Shenyang, China, pp. 736–740, 2019. [Google Scholar]
13. F. Wei, D. Wu and D. Chen, “An investigation of pilot emotion change detection based on multimodal physiological signals,” in Proc. ICCASIT, Weihai, China, pp. 1029–1034, 2020. [Google Scholar]
14. T. Tuyen, “A smart mobile system for monitoring and assessing sportsman's physiological reserves during training,” in Proc. USBEREIT, Yekaterinburg, Russia, pp. 1–3, 2020. [Google Scholar]
15. O. AlZoubi, B. ALMakhadmeh, S. K. Tawalbeh, M. B. Yassien and I. Hmeidi, “A deep learning approach for classifying emotions from physiological data,” in Proc. ICICS, Irbid, Jordan, pp. 214–219, 2020. [Google Scholar]
16. Z. Liu, L. Wu and W. Fu, “System quality of human physiological signal based medical auxiliary diagnosis,” IEEE Access, vol. 9, pp. 27130–27139, 2021. [Google Scholar]
17. F. D. Cillis, L. Faramondi, F. Inderst, S. Marsella, M. Marzoli et al., "Hybrid indoor positioning system for first responders," IEEE Transactions on Systems, Man, and Cybernetics: Systems, vol. 50, no. 2, pp. 468–479, 2020. [Google Scholar]
18. Y. Li, X. Wu, B. Liao, L. Zhang, S. Huang et al., “Beidou positioning and RFID module integrated peripherals,” in Proc. ISMII, Zhuhai, China, pp. 172–175, 2021. [Google Scholar]
19. C. Occhiuzzi, S. Parrella and G. Marrocco, “Flexible dual chip on-skin RFID sensor for body temperature monitoring,” in Proc. FLEPS, Manchester, UK, pp. 1–4, 2020. [Google Scholar]
20. S. Amendola, V. D. Cecco and G. Marrocco, “Numerical and experimental characterization of wrist-fingers communication link for RFID-based finger augmented devices,” IEEE Transactions on Antennas and Propagation, vol. 67, pp. 531–540, 2019. [Google Scholar]
21. C. Miozzi, S. Nappi, S. Amendola, C. Occhiuzzi and G. Marrocco, “A general-purpose configurable RFID epidermal board with a two-way discrete impedance tuning,” IEEE Antennas and Wireless Propagation Letters, vol. 18, pp. 684–687, 2019. [Google Scholar]
22. S. Amendola, S. Milici and G. Marrocco, “Performance of epidermal RFID dual-loop tag and on-skin retuning,” IEEE Transactions on Antennas and Propagation, vol. 63, pp. 3672–3680, 2015. [Google Scholar]
23. L. Dan, C. Xin, H. Chongwei and J. Liangliang, “Intelligent agriculture greenhouse environment monitoring system based on IoT technology,” in Proc. 2015 Int. Conf. on Intelligent Transportation, Big Data and Smart City, Halong Bay, Vietnam, pp. 487–490, 2015. [Google Scholar]
24. W. -T. Sung, J. -H. Chen and S. -J. Hsiao, “Fish pond culture via fuzzy and self-adaptive data fusion application,” in Proc. SMC, Banff, AB, Canada, pp. 2986–2991, 2017. [Google Scholar]
25. S. -J. Hsiao and W. -T. Sung, “Building a fish–vegetable coexistence system based on a wireless sensor network,” IEEE Accese, vol. 8, pp. 192119–192131, 2020. [Google Scholar]
26. H. d. M. Dantas and C. M. d. Farias, “A data fusion algorithm for clinically relevant anomaly detection in remote health monitoring,” in Proc. ISNCC, Montreal, QC, Canada, pp. 1–8, 2020. [Google Scholar]
27. S. Wu, D. Wu, R. Ye, K. Li, Y. Lu et al., “Pilot study of robot-assisted teleultrasound based on 5G network: A new feasible strategy for early imaging assessment during COVID-19 pandemic,” IEEE Transactions on Ultrasonics, Ferroelectrics, and Frequency Control, vol. 67, no. 11, pp. 2241–2248, 2020. [Google Scholar]
28. F. Al-Turjman and B. Deebak, “Privacy-aware energy-efficient framework using the internet of medical things for COVID-19,” IEEE Internet of Things Magazine, vol. 3, no. 3, pp. 64–68, 2020. [Google Scholar]
29. T. Lassila, L. Y. D. Marco, M. Mitolo, V. Iaia, G. Levedianos et al., “Screening for cognitive impairment by model-assisted cerebral blood flow estimation,” IEEE Transactions on Biomedical Engineering, vol. 65, no. 7, pp. 1654–1661, 2018. [Google Scholar]
30. S. Kumar and A. Jasuja, “Air quality monitoring system based on IoT using raspberry Pi,” in Proc. ICCCA, Greater Noida, India, pp. 1341–1346, 2017. [Google Scholar]
31. S. Kim, K. Kim and Y. Shon, “Information analysis as keyword of integrated IoT and advanced leisure sport,” J. of the Korea Institute of Electronic Communication Sciences, vol. 9, no. 5, pp. 609–616, 2018. [Google Scholar]
32. S. S. Chaudhari and V. Y. Bhole, “Solid waste collection as a service using IoT -solution for smart cities,” in Proc. ICSCET, Mumbai, India, pp. 1–5, 2018. [Google Scholar]
33. G. Bedi, G. K. Venayagamoorthy, R. Singh, R. R. Brooks and K. C. Wang, “Review of internet of things (IoT) in electric power and energy systems,” IEEE Internet of Things Journal, vol. 5, no. 2, pp. 847–870, 2018. [Google Scholar]
 | This work is licensed under a Creative Commons Attribution 4.0 International License, which permits unrestricted use, distribution, and reproduction in any medium, provided the original work is properly cited. |