DOI:10.32604/csse.2022.016387
| Computer Systems Science & Engineering DOI:10.32604/csse.2022.016387 | |
| Article |
Measuring Mental Workload Using ERPs Based on FIR, ICA, and MARA
1Business School, Shenyang University, Shenyang, 110044, China
2School of Economics and Management, Anhui Polytechnic University, Wuhu, 241000, China
3Center for Science Communication and Achievement Transformation, National Natural Science Foundation of China, Beijing, 100085, China
4School of Industrial Engineering, Purdue University, West Lafayette, IN 47906, USA
*Corresponding Author: Yi Ding. Email: emiledy@sina.com
Received: 31 December 2020; Accepted: 20 April 2021
Abstract: Mental workload is considered to be strongly linked to human performance, and the ability to measure it accurately is key for balancing human health and work. In this study, brain signals were elicited by mental arithmetic tasks of varying difficulty to stimulate different levels of mental workload. In addition, a finite impulse response (FIR) filter, independent component analysis (ICA), and multiple artifact rejection algorithms (MARAs) were used to filter event-related potentials (ERPs). Then, the data consisting of ERPs, subjective ratings of mental workload, and task performance, were analyzed through the use of variance and Spearman’s correlation during a simulated computer task. We found that participants responded faster and performed better in the easy task condition, followed by the medium and high-difficulty conditions, which verifies the validity of the ERP filtering. Moreover, larger P2 and P3 waveforms were evoked as the task difficulty increased, and a higher task difficulty elicited a more enhanced N300. Correlation analysis revealed a negative relationship between the amplitude of P3 and the subjective ratings, and a positive relationship between the P3 amplitude and accuracy. The results presented in this paper demonstrate that a combination of FIR, ICA, and MARA methods can filter ERPs in the non-invasive real-time measurement of workload. Additionally, frontocentral P2, N3, and parietal P3 components showed differences between genders. The proposed measurement of mental workload can be useful for real-time identification of mental states and can be applied to human–computer interaction in the future.
Keywords: Mental workload; event-related potentials; finite impulse response filter; independent component analysis; multiple artifact rejection algorithms
Mental workload has become increasingly important due to the intense demand on the brain in complex working environments. Therefore, optimizing it could not be more imperative today [1]. When a system includes a human operator, the variability and reliability of the operator are critical to the system’s performance. The mental workload experienced by the operator impacts his/her performance, which in turn affects the entire system [2]. Excessively high or low levels of a mental workload can negatively impact performance. Therefore, monitoring, predicting, and managing overload/underload is particularly important for a full understanding of its role in human–computer interactions. Furthermore, exploring how to measure it accurately is of primary concern.
Mental workload is multidimensional and determined by the characteristics of the task, the operator, and the environmental context. It is difficult to measure directly and can affect an operator’s performance. Nevertheless, previous research has suggested that it can be inferred from the measurement of physiological processes [3]. Compared to subjective measures and performance measures, physiological indices perform better in terms of sensitivity, diagnostic ability, and non-intrusiveness [4,5].
A wide range of physiological variables associated with mental workload have been investigated in the literature [6]. These physiological signals include brain activity, cardiac activity, electrodermal activity, eye movement, respiration, blood pressure, and skin temperature. Of these, event-related potentials, a well-established non-invasive technique for recording brainwave activity, may better account for the specific processing requirements of complex tasks compared to other measures [7,8]. In this study, we investigated a method to measure workload specifically based on ERPs. First, a simulated computer task was designed based on mental arithmetic tasks to elicit different levels of mental workload, and an electroencephalogram (EEG) cap was prepared to record brain signals. Second, data from the experiment were processed using the EEGLAB toolbox in MATLAB. We also took advantage of the finite impulse response (FIR) filter, independent component analysis (ICA), and multiple artifact rejection algorithms (MARAs) to filter the ERPs. Third, we conducted an analysis of variance (ANOVA) and Spearman’s rank correlation coefficient to assess the results based on task difficulty. Violation of sphericity was handled with a Greenhouse–Geisser correction. Finally, the filtered ERPs were used to indicate mental workload.
Many researchers have attempted to measure and model mental workload. Currently, mental workload measurement methods can be divided into three categories: those methods employing the operator’s performance, those based on subjective experiences, and those considering physiological responses. Methods using subjective ratings are the most commonly used because they are inexpensive, easy to conduct, and include the subjective workload assessment [9] and NASA task load index (NASA-TLX) [10]. However, these methods have some limitations due to social desirability and are not suitable for continuous monitoring of workload. Social desirability is a common phenomenon in subjective surveys. It refers to a participant answering not according to the condition, but based on what they think is socially acceptable or desirable. Meanwhile, in performance-based methods, the subject needs to be engaged in only one task. Their major restriction is the difficulty of assessing mental workload in near-real time [11].
Even though there is no agreement on what mental workload is, there is a certain consensus in conceptualizing mental workload as the number of resources invested by an operator with limited attentional capacity. Mental workload encompasses multiple dimensions, and a subjective experienced physiological processing state. Some physiological measures, such as ERPs, are natural workload metrics for the physiological activity required by tasks. Furthermore, these measures can overcome the limitations mentioned above. The physiological indices are obtained by recording a person’s brain activity, cardiac activity, electrodermal activity, eye movement, respiration activity, and blood pressure. More information about physiological indices used for measuring mental workload can be seen in literature reviews. We note here that no universal solution for measuring mental workload using physiological indicators has been found, and no single method stands out.
ERPs seem to be the most promising measure to date, and they can complement the information provided by subjective and performance indicators. Beginning with the seminal work, numerous studies have been conducted to investigate the assessment of mental workload by employing ERPs. P300 (with a latency between 300 ms and 800 ms) has been the most extensively explored ERP component concerning resource allocation and mental workload. ERP studies have shown that the amplitude of P300 at parietal sites can discriminate tasks, and is reduced in high-workload conditions compared to low-workload conditions [12–14]. Other ERP components may also be sensitive to mental workload. Solís‑Marcos and Kircher found that N1 latency increased in the high and adjustable workload conditions, and the N1 amplitude was greater in low-speed conditions [7]. In the study conducted by Allison and Polich, aparticipants were asked to view and play three levels of a game (easy, moderate, and hard) [15]. The authors reported larger P2, N2, and P3 amplitudes during the viewing condition than during playing conditions, and a decrease in N2 amplitude during the hard condition relative to the medium condition. Miller, Rietschel, McDonald, and Hatfield also found similar results: N1, P2, P3, and late positive potential (LPP) component amplitudes were inversely related to task difficulty [13]. However, studies on mental arithmetic showed that used early (P100, P200) and late (P300, N300) ERP components to measure mental workload obtained inconsistent results [16]. Other studies about mental arithmetic investigated the cognitive differences when applying various arithmetic operations. Hohnsbein pointed out that time pressure and attention affect P300 [17], while Falkenstein found a larger P300 for severe time pressure than for moderate time pressure [18]. Time pressure is one component of mental workload, and mental workload should increase under severe time pressure. However, inconsistent results were found in previous studies. There are many repetitive jobs with some extent of time pressure, and we need to monitor the worker’s mental workload directly in real-time to prevent mental exhaustion from reaching “redline.” All of the above research brings us to the key research question: Because mental workload is so important, is there a method of filtering ERPs that specifically illustrates mental workload so as to make mental workload measurable?
3 System Model and Design Goal
In this section, we propose a system model and illustrate our design goals.
To address the above question, three simulated computer tasks were designed to elicit different levels of mental workload. First, subjects were introduced to the experiment, and an EEG cap was prepared to record brain signals. After the experiment, subjective ratings of mental workload were obtained. Brain signals were processed using EEGLAB. The system model is illustrated in Fig. 1.
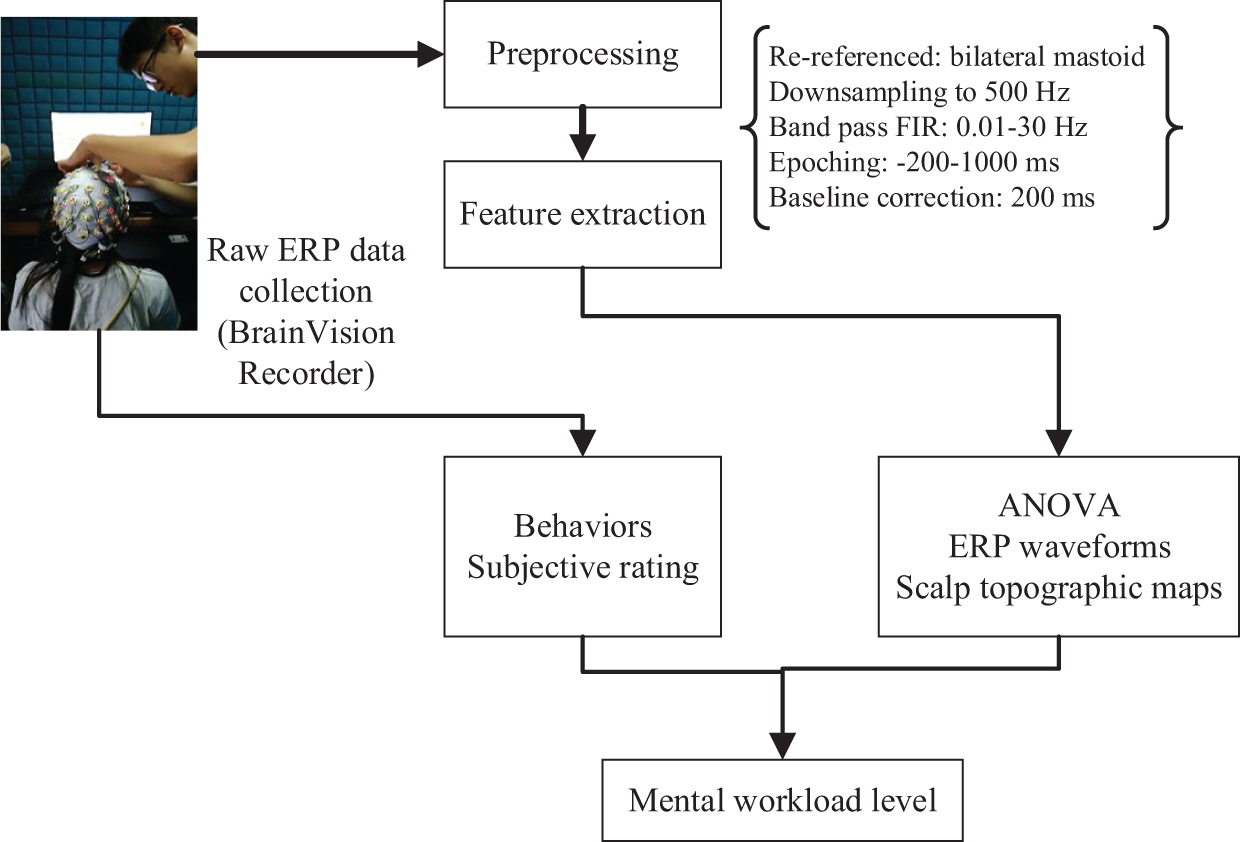
Figure 1: Recording and analysis of brain signals
The purpose of this study was to investigate the measurement of ERPs that reflect mental workload. A combined method of FIR, ICA, and MARA was applied to extract and clean the ERPs. A schematic workflow for high-pass filtering of raw EEG data was performed prior to ICA decomposition. IC filters were applied to the unfiltered raw data prior to classification by MARA.
ICA and MARA: To reject artifacts, we used ICA [19,20] and MARA [21] to clean the EEG signals. Given EEG signals,
Here,
where
MARA is a heuristic that can rapidly and objectively solve the binary classification problem “reject vs. accept.” When confronted with mixed components, MARA makes a conservative decision and retains mixed components in the data.
FIR: High-pass filtering can facilitate the ICA estimation by increasing the independence between sources because gradually changing trends are not very independent [22]. Furthermore, standard ICA assumptions such as a limited number of sources are at best approximately met in practice. Filtering guides the ICA decomposition toward extracting the components that explain the activity we are interested in, and may help us to better satisfy ICA’s stationarity assumption. The low-frequency parts of an EEG signal contain a large portion of its variance, and it is this variance that we are typically not very interested in. Therefore, it is often beneficial to remove these low-frequency components.
SNR: Single-subject ERPs were used to derive the grand average waveforms for display and analysis. Because suitable artifact processing has the potential to decrease single-trial noise around the average ERP response, for each artifact removal variant, we assessed this effect by computing the signal-to-noise ratio (SNR). Given
where
Subjective difference exploration: In previous studies, gender affected the subjective estimate of mental workload and other information processes [23]. It was found that female subjects rated effort and frustration significantly higher, and their performance was significantly lower than that of their male counterparts. Furthermore, in ERP studies, researchers found that females exhibited larger amplitudes of P2, N2, and P3 [24,25]. Therefore, whether gender affects ERP responses is also explored in this study.
This experiment aimed to investigate the measurement of mental workload in computer work through EEG recordings. Open-source GPower 3.1 software was used to calculate the sample size. To obtain a large effect size of 0.3, a minimum sample size of 22 was required in the experiment when Cohen’s d = 0.5, α = 0.05, and β = 0.8 (as recommended by Caine [26]). Twenty-five healthy right-handed individuals with normal or corrected vision were recruited as participants (12 males and 13 females, aged 19–24 years, mean age of 21.6, SD = 1.26).
Three types of mental arithmetic operations were designed to elicit varying levels of mental workload. This method has been applied in many studies that employed simulated mental arithmetic tasks [27]. At the easy level, participants were required to complete mental arithmetic tasks consisting of three numbers (i.e., a+b+c) in 15 minutes. Each mental arithmetic operation lasted for six seconds and was randomly generated. Participants were asked to respond by clicking the right mouse button as soon as possible if the answer was between 10 and 20; otherwise, they were asked to click the left mouse button (if they did not respond, the stimulus was replaced by a fixation screen). In the medium-level task, participants were required to complete mental arithmetic tasks consisting of five numbers (i.e., a+b-c+d-e) in 15 minutes. Each mental arithmetic operation lasted for six seconds and was randomly generated. Participants were asked to respond by clicking the right mouse button as soon as possible if the answer was between −5 and 5; otherwise, they were asked to click the left mouse button. For the hard task, participants were required to complete mental arithmetic tasks consisting of seven numbers (i.e., a+b-c+d-e+f-g) in 15 minutes. The mental arithmetic operations were randomly generated and lasted for six seconds. Participants were asked to respond by clicking the right mouse button as soon as possible if the answer was between −4 and 6; otherwise, they were asked to click the left mouse button. The tasks were programmed and presented using E-Prime 2.0 Professional behavioral research software. Three tasks with different levels of mental demand can form six experimental groups. The 25 participants were randomly assigned to the six groups. Prior to the formal experiment, participants were required to practice the task for three minutes; familiarity with the tasks was not guaranteed by judging the participants’ accuracy during this practice stage.
Electrical brain signals were recorded continuously from 64 Ag/AgCl ring scalp electrodes distributed according to the 10–20 international system (Fp1, Fp2, AFz, AF3, AF4, AF7, AF8, Fz, F1, F2, F3, F4, F5, F6, F7, F8, FCz, FC1, FC2, FC3, FC4, FC5, FC6, FT7, FT8, FT9, FT10, Cz, C1, C2, C3, C4, C5, C6, T7, T8, CPz, CP1, CP2, CP3, CP4, CP5, CP6, TP7, TP8, TP9, TP10, Pz, P1, P2, P3, P4, P5, P6, P7, P8, POz, PO3, PO4, PO7, PO8, Oz, O1, and O2), mounted in an elastic cap (Brain Products GmbH actiCAP, Germany). Vertical and horizontal electro-oculographic (EOG) activity was recorded with additional electrodes located 1.5 cm above and below the left eye and 1.5 cm outside the outer canthi of both eyes. All electrodes were referenced to the FCz site with a common ground (GND site). The brain signals were amplified by an actiCHamp amplifier (Brain Products GmbH) and digitally stored using Brain Vision Recorder software (Brain Products GmbH). The impedance levels of all electrodes were set below 5 kΩ. The brain signals were recorded at 1000 Hz and filtered with a 0.05 to 70 Hz bandpass filter.
All stimuli were presented on an Acer P229HQL monitor with 1920 × 1080 resolution. The experiment was controlled by E-Prime 2.0. The experimental program and materials can be downloaded from https://pan.baidu.com/s/1N59vdIT0JlkYdNPwP4yo3w. Participants sat approximately 60 cm from the screen, without a chinrest, in a quiet room with normal light. The environmental conditions were controlled with a soft light (300 ± 5 lx) to eliminate the impact of visibility on task performance. The microclimatic environment was set at a comfortable level, with a temperature of 24 ± 0.2°C and a relative humidity of 36.0% ± 2%. Physiological indicators in relation to mental workload measurement or prediction are sensitive to temperature, humidity, age, gender, time of day, and season. Accordingly, subjects participated in the experiment under similar environmental conditions to reduce the impact of the environment as much as possible. Once the environmental conditions were confirmed, each subject put on an elastic cap to record their brain signals.
Three tasks were designed to impose different mental workloads on participants and explore the relationship between mental workload, task performance, and brain activity. Participants were asked to complete the three tasks in a random sequence. After the first task was finished, the participants were trained to use the NASA-TLX scale, which was used to collect subjective ratings of perceived mental workload. After 10 minutes of rest, participants moved on to the next task. After each task, the participants rated their mental workload with NASA-TLX on a scale from 0 (low) to 20 (high). Finally, the scores were translated to a 0–100 scale for ease of interpretation. The experimental procedure is shown in Fig. 2.
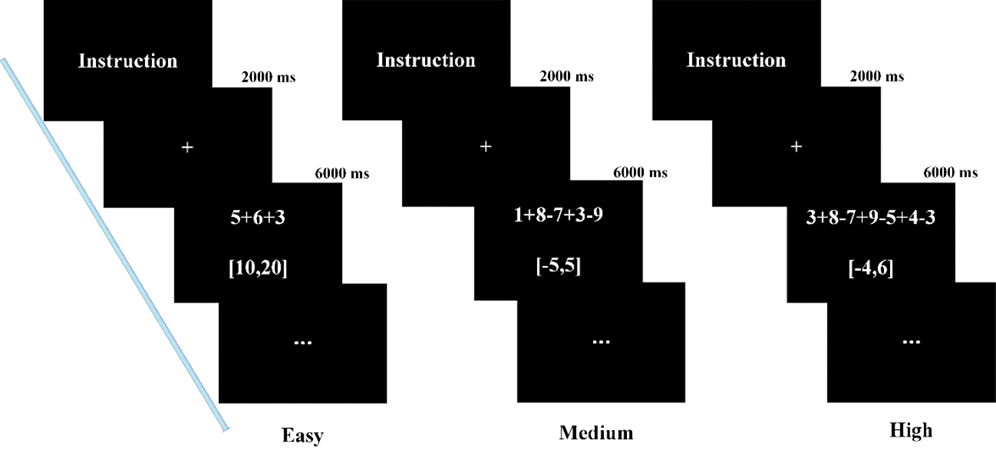
Figure 2: Experimental procedure
4.4 Subjective Statistical Analysis
A paired-sample t-test was used to determine the differences in subjective ratings and task performance. Then, 3 × 4 (condition × electrode) repeated measure within-subject ANOVAs were used to examine the effects of changes in the levels of mental demands (easy, medium, and hard) on the mean amplitude of each ERP component. Violation of sphericity was handled with a Greenhouse–Geisser correction, and the effect size (eta squared, η2) was reported for all ANOVAs. Data analysis was carried out using SPSS version 24.0 (IBM Corp.). Spearman’s rank correlation coefficient analysis was calculated to identify the relationships between the different measures of mental workload. Statistical significance for all tests was set at p < 0.05. Outliers were deleted using boxplots [28,29]. Raw brain signal data and materials for the three tasks can be downloaded from https://pan.baidu.com/s/1N59vdIT0JlkYdNPwP4yo3w.
EEG signals were computed by using EEG epochs ranging from 200 ms before stimulus onset to 1000 ms after stimulus onset. Each epoch was baseline-corrected using the signal that occurred 200 ms before the onset of the stimulus. A standard procedure to subtract part of the vertical EOG (VEOG) and horizontal EOG (HEOG) from each recorded EEG electrode
where
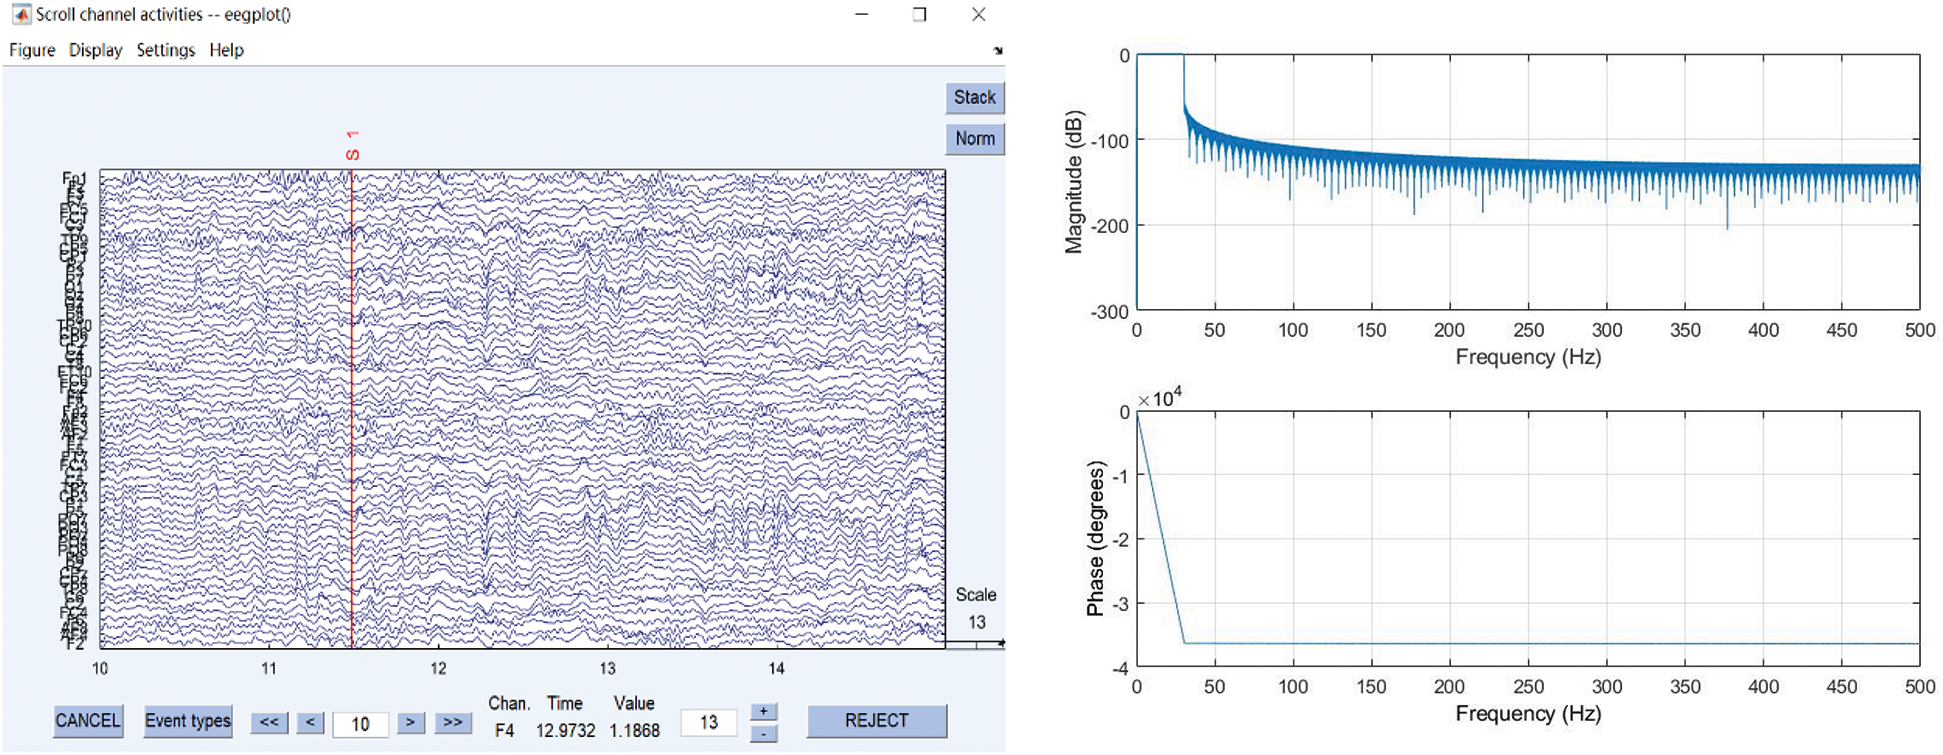
Figure 3: ERPs after FIR
The grand average ERPs with several artifact removal methods are depicted in Fig. 4. The influence of high-pass filtering on the ICA and MARA decomposition is reflected in the shape of the ERPs [30]. Peak amplitudes were slightly attenuated when the ICA was trained on 30-Hz high-pass-filtered data.
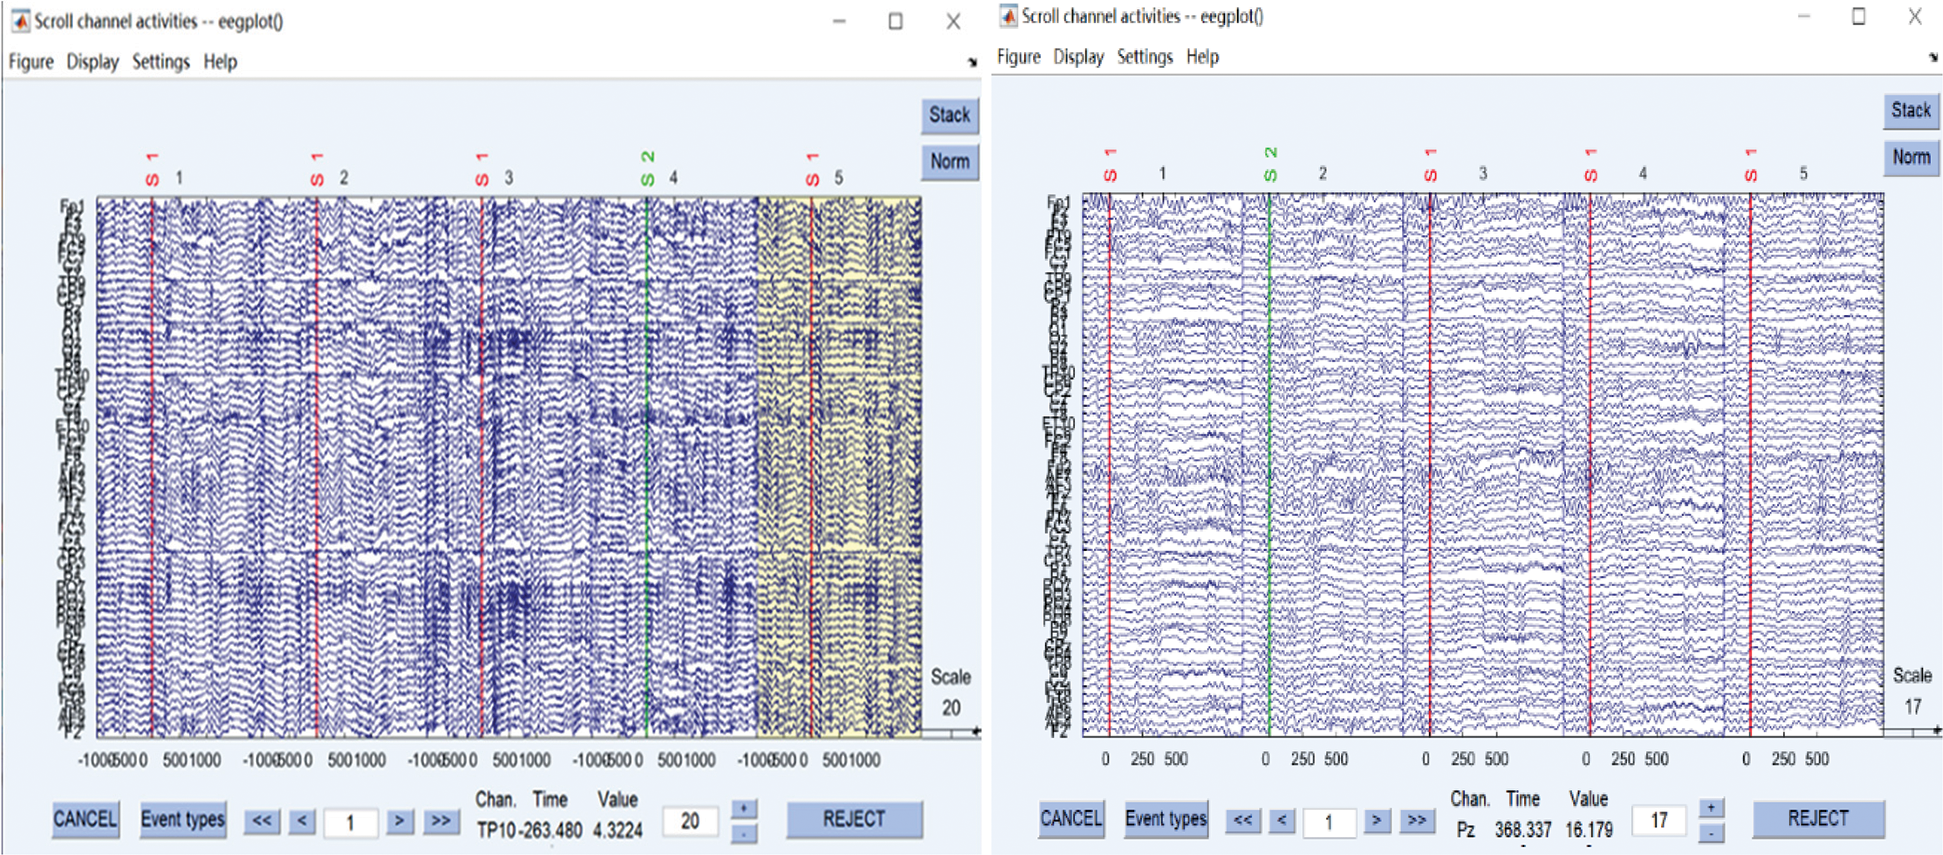
Figure 4: ERPs before ICA and MARA (left) and after ICA and MARA (right)
The accuracy of responses (ACC) and response time (RT; i.e., the time from stimulus presentation to the participant’s click on the mouse) were also collected during the experiments. The accuracies on easy, medium, and hard tasks were 0.98 (SD = 0.02), 0.75 (SD = 0.15), and 0.60 (SD = 0.10), respectively. The response times for easy, medium, and hard tasks were 1.75 s (SD = 0.42), 3.90 s (SD = 0.57), and 4.56 s (SD = 0.51), respectively. Subjects had the highest accuracy and fastest response in the easy task, and had higher accuracy and a faster response in the medium-difficulty task than in the hard task. Moreover, for the ACC, there was a significant difference between males (medium: mean = 0.82, SD = 0.11; high: mean = 0.64, SD = 0.11) and females (medium: mean = 0.68, SD = 0.15; hard: mean = 0.56, SD = 0.09) in the medium-difficulty tasks (t [23] = 2.78, p = 0.01) and hard tasks (t [23] = 2.08, p = 0.05), but there was no significant difference in RT. Raw behavioral performance data can be downloaded from https://pan.baidu.com/s/1N59vdIT0JlkYdNPwP4yo3w.
The NASA-TLX, which includes six dimensions, was used to collect participants’ subjective responses in order to assess mental workload. The subjective ratings (SR) of mental workload were 34.59 (SD = 13.74), 60.63 (SD = 17.16), and 82.49 (SD = 11.93) for the easy, medium, and hard tasks, respectively. The paired-sample t-test results showed that there were significant differences between the easy and medium tasks (t [24] = −11.39, p < 0.001), between the easy and hard tasks (t [24] = −19.38, p < 0.001), and between the medium and hard tasks (t [24] = −9.86, p < 0.001). However, there was no significant difference between males and females in subjective ratings (p > 0.05).
The results from one male subject were eliminated due to excessive noise in the recording process. Therefore, brain signals were obtained from 24 participants (11 males and 13 females, aged 19–24 years, mean age of 21.5, SD = 1.27). ERP waveforms corresponding to the easy, medium, and hard tasks and the corresponding scalp topographic maps for each time window are shown in Fig. 5.
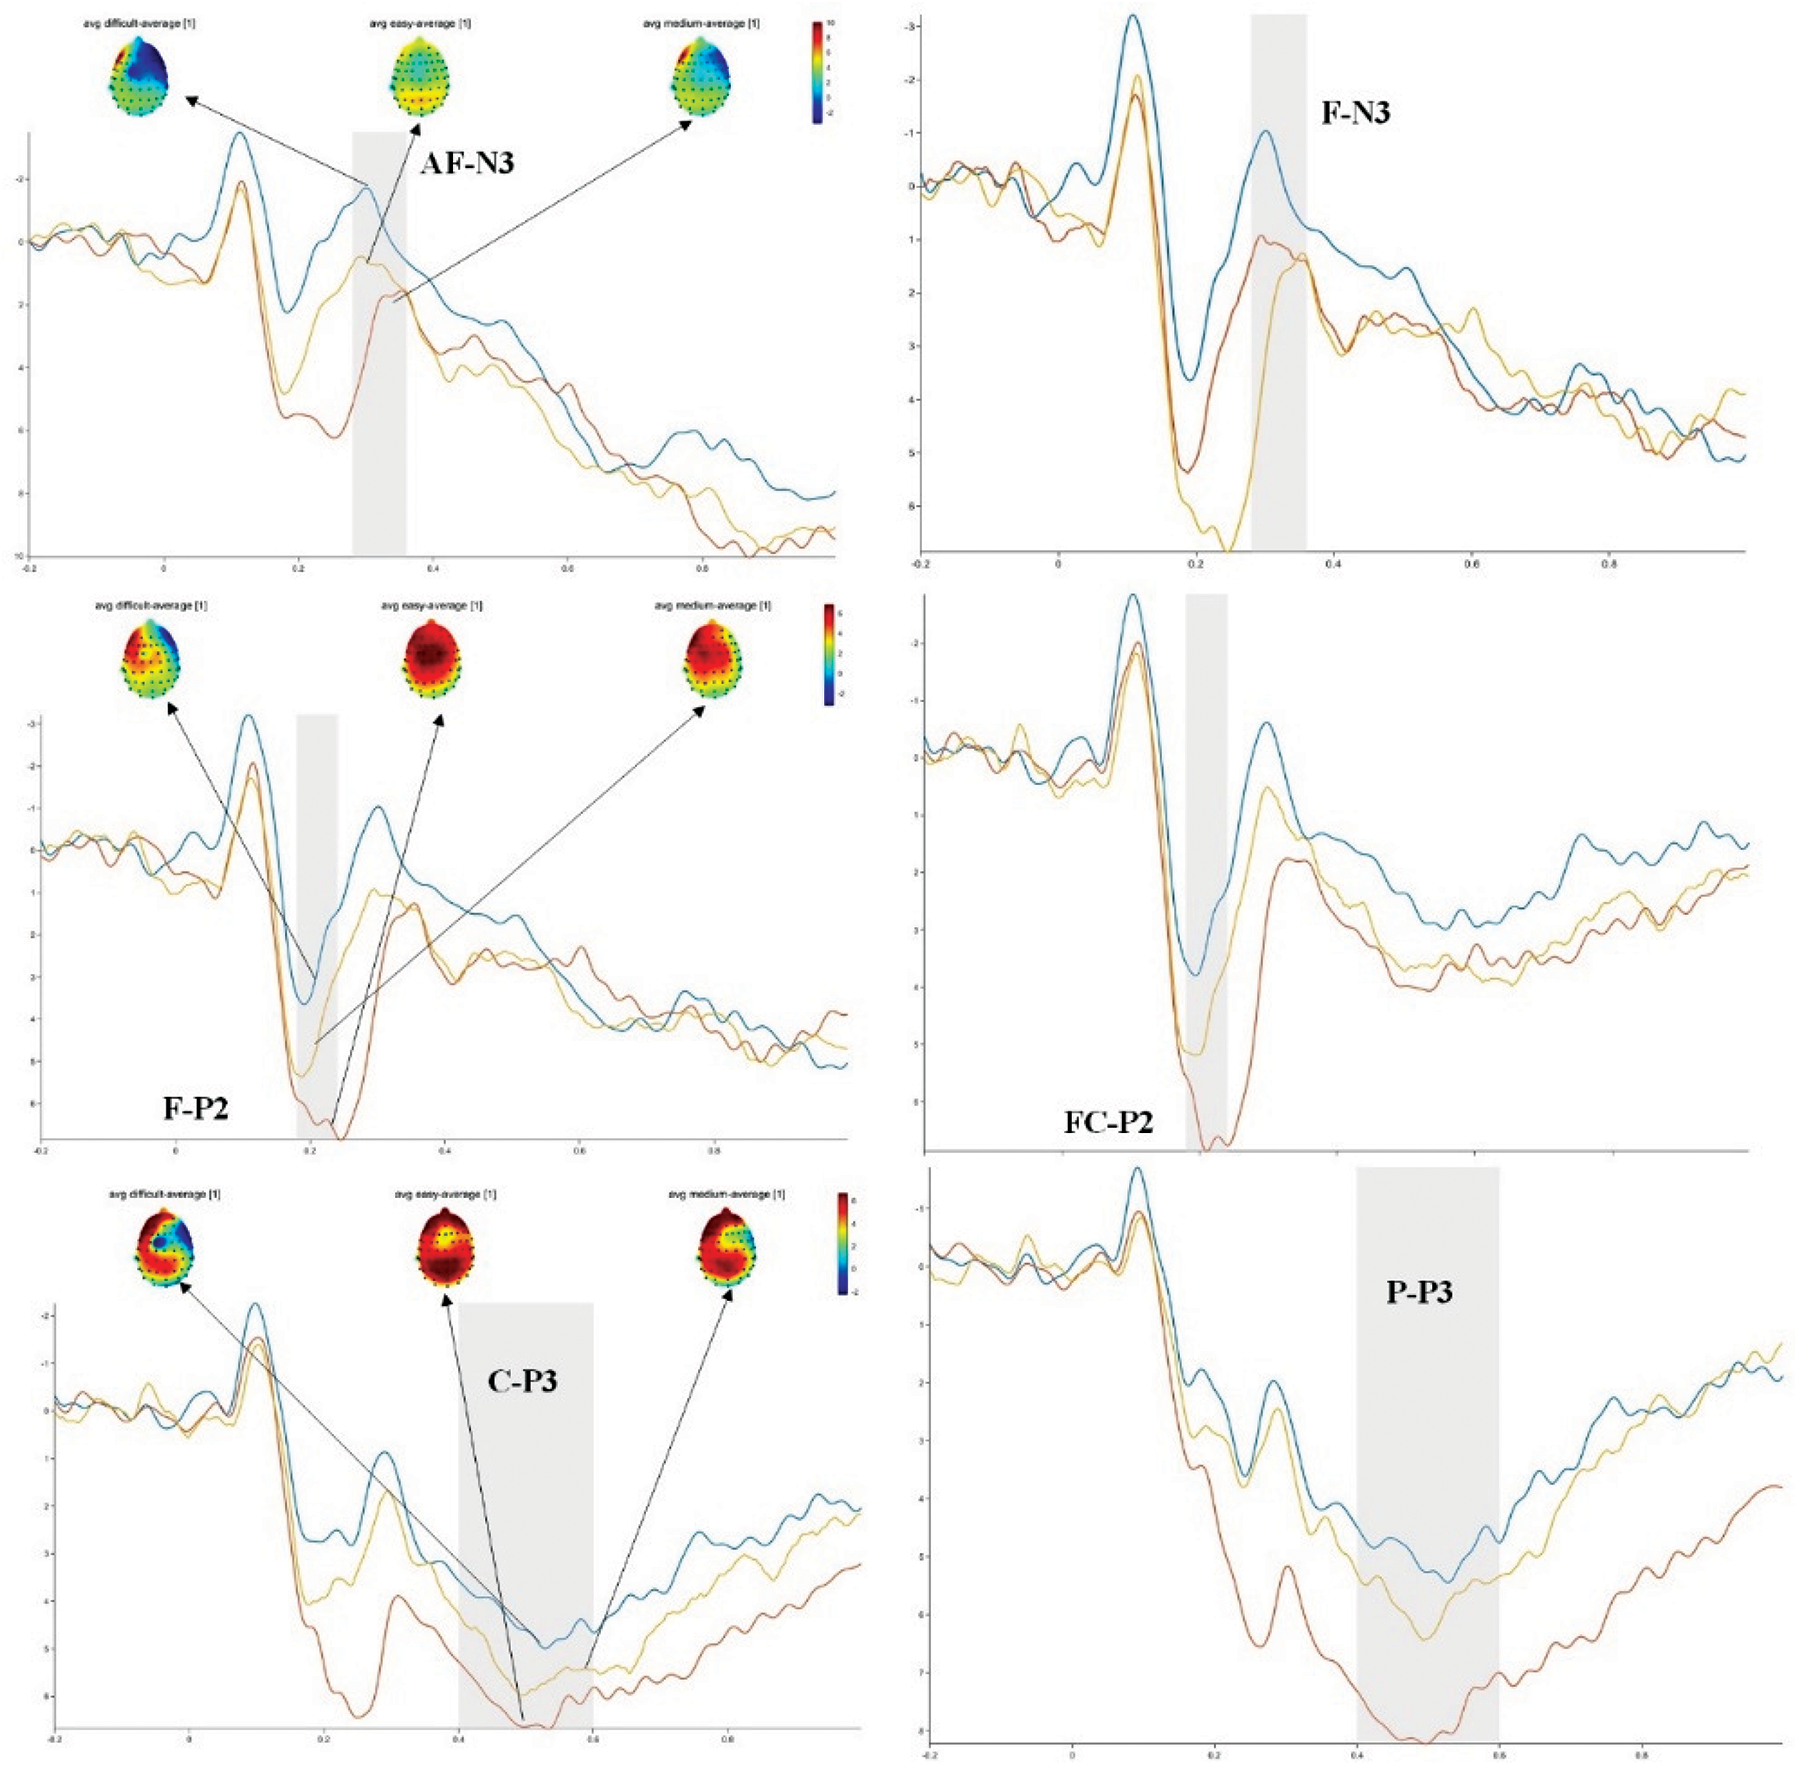
Figure 5: Topographic maps and averaged ERPs from tasks of different difficulty levels at various electrodes
The grand averaged ERP waveforms for each task were from the anterior frontal (AF3/AFz/AF4), frontal (F5/Fz/F6), frontocentral (FC5/FCz/FC6), central (C5/Cz/C6), centro-parietal (CP5/CPz/CP6), parietal (P5/Pz/P6), and post-occipital (PO3/POz/PO4) regions (the ERP waveforms from all electrodes are available in the supplementary data at https://pan.baidu.com/s/1N59vdIT0JlkYdNPwP4yo3w). Electrodes from four areas (anterior frontal-AF, frontal-F, frontocentral-FC, and central-C) were chosen for statistical analysis of P2 within the time window of 160–220 ms and N3 within the time window of 280–340 ms. Electrodes (central-C, centro-parietal-CP, parietal-P, post-occipital PO) were chosen for statistical analysis of P3 within the time window of 350–500 ms. The statistical analysis showed that difficulty mainly affected the P2 component (F [2,46] = 9.78, p < 0.001, η2 = 0.298) and the N3 component (F [2,46] = 17.63, p < 0.001, η2 = 0.434). In addition, the statistical analysis revealed a condition × electrode interaction effect for the P3 component (F [3.1,70.4] = 3.84, p = 0.013, η2 = 0.143).
P2: Post hoc analysis revealed that for P2, regardless of electrode, the average amplitude was significantly different across the three experimental conditions (Fig. 5) (easy > hard, p < 0.001, d = 3.53; easy > medium, p = 0.04, d = 1.76; medium > hard, p = 0.05, d = 1.77). P200 has been associated with compulsory, early sensory processing, and exhibits a frontocentral scalp distribution; moreover, a decreased P200 amplitude has been linked to an increased allocation of attention [31,32].
An independent-sample t-test was conducted to analyze the differences between male and female participants. The results showed that there was a gender difference in the mean amplitude of P2 only between the easy and medium conditions. A significantly larger P2 was evoked in females compared to males in the easy (t 22] = −3.04, p = 0.006) and medium (t [22] = −2.13, p = 0.039) conditions, but not in the hard task (t [22] = −1.97, p = 0.069).
N3: Similar to P2, post hoc analysis revealed that for N3, regardless of electrode, the average amplitude was significantly different across the three experimental conditions (Fig. 5) (easy > hard, p < 0.001, d = 5.56; easy > medium, p = 0.003, d = 3.87; medium > hard, p = 0.05, d = 1.69). N300 at prefrontal and frontocentral sites is associated with increased general cognitive ability in more effort-intensive tasks of executive function, information processing, and verbal memory and learning.
An independent-sample t-test was conducted to analyze the differences between the male and female participants. The results showed that there was no significant difference between males and females across the three experimental conditions with p > 0.05.
P3: Post hoc analysis revealed that for P3 at the electrodes of CP and P areas, the mean amplitude was significantly different across the three experimental conditions (easy > hard, p = 0.005, d = 3.29; easy > medium, p = 0.038, d = 1.85; medium > hard, p = 0.045, d = 1.44). P3 is believed to represent a non-obligatory, cognitive evaluation of stimuli and generates a parietal maximal distribution. Importantly, the P3 at Pz reflects cognitive processes independent of variations in motor processes and is not associated with memory, but it is correlated with participants’ decisions on how to respond to stimuli [33,34].
An independent-sample t-test was conducted to analyze the gender differences. The results showed that there was a significant gender difference in the mean amplitude of P3 between the medium and hard conditions. A larger P3 was evoked in female participants in the medium (t [22] = −2.53, p = 0.019) and hard (t [22] = −2.27, p = 0.033) conditions; no significant difference was observed in the easy condition (t [22] = −0.56, p = 0.580).
The correlations between different measurements were analyzed. The amplitudes averaged from electrodes FC5/FCz/FC6 for P2, from AF3/AFz/AF4 for N3, and from P5/Pz/P6 for P3 within the corresponding time windows were chosen to conduct correlations with the subjective ratings, accuracy, and response time. The results showed that there were significant correlations between the mean amplitude of the P2 component and N3 (r = 0.317, p = 0.007), and between the mean amplitude of the P2 component and P3 (r = 0.232, p = 0.050). Additionally, there was a significant negative correlation between the mean amplitude of P2 and subjective ratings (r = −0.329, p = 0.005) and a significant positive correlation between the mean amplitude of P2 and accuracy (r = 0.254, p = 0.031). For N3, there were significant negative correlations between the mean amplitude of N3 and subjective ratings (r = −0.282, p = 0.017) and between the mean amplitude of N3 and response time (r = −0.448, p < 0.001), whereas there was a significant positive correlation between the mean amplitude of N3 and accuracy (r = 0.275, p = 0.019). Similar to the P2 component, there was a significant negative correlation between the mean amplitude of P3 and subjective ratings (r = − 0.361, p = 0.002) and a significant positive correlation between the mean amplitude of P3 and accuracy (r = 0.318, p = 0.006). Moreover, there were negative correlations between subjective ratings and accuracy (r = −0.635, p < 0.001) and between response time and accuracy (r = −0.691, p < 0.001). There was a positive correlation between subjective ratings and response time (r = 0.701, p < 0.001). Additional correlation analyses can be found in the supplementary data (https://pan.baidu.com/s/1N59vdIT0JlkYdNPwP4yo3w).
First, the mental workload measured by NASA-TLX confirmed that there was a measurable difference across the three experimental conditions. Additionally, performance varied significantly across the three experimental conditions. Participants responded faster to tasks with a lower mental demand. These results are consistent with those of previous research conducted using subjective methods [35,36]. For task performance, males had higher accuracy than females in medium and hard conditions. There were no differences in the subjective ratings or response time. A recent study indicated that gender may influence performance on math achievement tests [37]. In our study, a gender difference was found in tasks of medium and high difficulty but not in easy tasks.
Second, three types of components showed differences elicited by the visual stimuli, and the results demonstrated the effectiveness of ERP in indexing mental workload. The first component was the early cortical visual P2, which is related to the properties of the stimuli; the second was N300, which could be involved in the coding of action, and the third was the late endogenous P3, which is related to the cognitive processing of stimuli. Crowley and Colrain pointed out that frontocentral P2 has been linked to an increased allocation of attention [32]. From this perspective, tasks with higher difficulty require more mental resource distribution, and therefore more attention should be paid to a task of higher difficulty. In a study by Miller et al., the oddball paradigm was applied to determine which ERPs could reflect mental workload [13]. Miller et al. found that the amplitudes of the N1, P2, P3, and LPP components were inversely related to task difficulty. In our study, the amplitudes of P2 and P3 increased with decreasing task difficulty. Research has found that an increase in the amplitude of positive components is associated with a decrease in general cognitive performance on tasks [38], as task difficulty increases, task performance should decrease, which was observed for the amplitudes of the P2 and P3 components.
Higher mental workload conditions elicited an enhanced frontocentral N3 compared to lower mental workload conditions. We have to consider why this was observed. Here, the N3 could not be late N2, because the stimulus in the same condition was fully predictable. Therefore, its occurrence always matched the expectations of the subjects and the previous stimulation. Moreover, the enhanced N3 showed significantly higher mental workload conditions than other stimuli, which was not elicited by eye movements. As shown in Fig. 5, similar results were observed at central and anterior sites. However, there were no such results for the N3 component regarding mental workload measurement. Previous studies on attention and cognition have pointed out that an increase in the amplitude of negative ERP components at the prefrontal and frontocentral sites is associated with increased general cognitive ability on the more effort-intensive tasks of executive function, information processing, and verbal memory and learning. From this view, when participants were performing higher-difficulty tasks, the mental demand was higher, and an enhanced N3 was observed (more details can be seen in the supplementary data at https://pan.baidu.com/s/1N59vdIT0JlkYdNPwP4yo3w). Sekine pointed out that an enhanced N3 was obtained as brain arousal increased [39]. Thus, we can conclude that broader activation of cortical regions in the frontal cortex, rather than inhibition, could be associated with the increased cognitive capacity for more complex and effortful processing.
The amplitudes of the P2 and P3 components showed a gender difference. Gender differences for P2 existed in the easy and medium conditions, whereas those for P3 existed in the medium and hard conditions (both were higher in females than in males). Yuan found that women exhibited larger amplitudes than men for P2, N2, and P3 components [25]. Similar results were obtained in the present study. In a review, Melynyte pointed that P3 amplitude could be significantly modulated by gender, with greater P3 in females relative to males [24]. In the present experiment, gender differences were found in the medium and hard conditions but not in the easy condition.
The comparison between multiple measures showed that there were significant correlations among them. The amplitude of P3 is sensitive to the number of attentional resources, and with increasing task difficulty, P3 decreases. Higher-difficulty tasks evoked enhanced P2 and N3. However, the gender difference analysis showed consistent results on P3 and task performance, which were exhibited in medium as well as hard conditions.
Overall, this study sheds light on the use of ERPs to gauge mental workload during repetitive tasks under some time pressure. Mental state monitoring is a critical component of current and future human–computer interfaces. This study offers the potential to provide a data collection method for the design of wearable monitoring devices and provides preliminary data and theoretical ideas for early mental workload detection systems. Implementing such systems in the real world would greatly benefit worker health and the efficiency of companies.
Acknowledgement: We thank all the participants for completing the experiments. Furthermore, we thank the editor and anonymous reviewers for their valuable comments and advice. We thank LetPub (www.letpub.com) for linguistic assistance during the preparation of this manuscript.
Funding Statement: This work was supported by the National Natural Science Foundation of China (Nos. 71801002, 71701003), the Humanities and Social Science Fund of the Ministry of Education of China (No. 18YJC630023), the Natural Science Foundation of Anhui Province (No. 1808085QG228), and the Postdoctoral Program of Liaoning Province.
Conflicts of Interest: The authors declare that they have no conflicts of interest to report regarding the present study.
1. P. Raja and G. F. Wilson, “Putting the brain to work: Neuroergonomics past, present, and future,” Human Factors, vol. 50, no. 3, pp. 468–474, 2008. [Google Scholar]
2. P. A. Hancock and G. Matthews, “Workload and performance: Associations, insensitivities, and dissociations,” Human factors, vol. 61, no. 3, pp. 374–392, 2019. [Google Scholar]
3. Y. Ding, Y. Q. Cao, V. G. Duffy, Y. Wang and X. F. Zhang, “Measurement and identification of mental workload during simulated computer tasks with multimodal methods and machine learning,” Ergonomics, vol. 63, no. 7, pp. 896–908, 2020. [Google Scholar]
4. G. Zhao, Y. J. Liu, Y. Shi and Y. J. Liu, “Real-time assessment of the cross-task mental workload using physiological measures during anomaly detection,” IEEE Transactions on Human-Machine Systems, vol. 48, no. 2, pp. 149–160, 2018. [Google Scholar]
5. Z. Wang, R. Jiao and H. Jiang, “Emotion recognition using wt-svm in human-computer interaction,” Journal of New Media, vol. 2, no. 3, pp. 121–130, 2020. [Google Scholar]
6. T. Pan, Y. Song and S. Chen, “Wiener model identification using a modified brain storm optimization algorithm,” Intelligent Automation & Soft Computing, vol. 26, no. 5, pp. 934–946, 2020. [Google Scholar]
7. I. Solís-Marcos and K. Kircher, “Event-related potentials as indices of mental workload while using an in-vehicle information system,” Cognition, Technology & Work, vol. 21, no. 1, pp. 55–67, 2019. [Google Scholar]
8. H. Jiang, Z. Wang, R. Jiao and S. Jiang, “Picture-induced EEG signal classification based on CVC emotion recognition system,” Computers, Materials & Continua, vol. 65, no. 2, pp. 1453–1465, 2020. [Google Scholar]
9. G. B. Reid and T. E. Nygren, “The subjective workload assessment technique: A scaling procedure for measuring mental workload,” Advances in Psychology, vol. 52, pp. 185–218, 1988. [Google Scholar]
10. S. G. Hart and L. E. Staveland, “Development of NASA-TLX (Task Workload IndexResults of empirical and theoretical research,” Advances in psychology, vol. 52, pp. 139–183, 1988. [Google Scholar]
11. J. M. Angel, R. Cristian and L. Hernan, “Using psycho-physiological sensors to assess mental workload in web browsing,” Sensors, vol. 18, no. 2, pp. 458, 2018. [Google Scholar]
12. F. Dehais, A. Duprès, S. Blum, N. Drougard, S. Scannella et al., “Monitoring pilot’s mental workload using ERPs and spectral power with a six-dry-electrode EEG System in real flight conditions,” Sensors, vol. 19, no. 6, pp. 1324, 2019. [Google Scholar]
13. M. W. Miller, J. C. Rietschel, C. G. McDonald and B. D. Hatfield, “A novel approach to the physiological measurement of mental workload,” International Journal of Psychophysiology, vol. 80, no. 1, pp. 75–78, 2011. [Google Scholar]
14. B. Somon, A. Campagne, A. Delorme and B. Berberian, “Human or not human? Performance monitoring ERPs during human agent and machine supervision,” NeuroImage, vol. 186, no. 1, pp. 266–277, 2019. [Google Scholar]
15. B. Z. Allison and J. Polich, “Workload assessment of computer gaming using a single-stimulus event-related potential paradigm,” Biological Psychology, vol. 77, no. 3, pp. 277–283, 2008. [Google Scholar]
16. E. T. Muluh, C. L. Vaughan and L. R. John, “High resolution event-related potentials analysis of the arithmetic-operation effect in mental arithmetic,” Clinical Neurophysiology, vol. 122, no. 3, pp. 518–529, 2011. [Google Scholar]
17. J. Hohnsbein, M. Falkenstein and J. Hoormann, “Effects of attention and time-pressure on P300 subcomponents and implications for mental workload research,” Biological Psychology, vol. 40, no. 1–2, pp. 73–81, 1995. [Google Scholar]
18. M. Falkenstein, J. Hohnsbein and J. Hoormann, “Time pressure effects on late components of the event-related potential (ERP),” Journal of Psychophysiology, vol. 8, no. 1, pp. 22–30, 1994. [Google Scholar]
19. P. Comon, “Independent component analysis, A new concept?,” Signal Processing, vol. 36, no. 3, pp. 287–314, 1994. [Google Scholar]
20. A. Delorme and S. Makeig, “EEGLAB: An open source toolbox for analysis of single-trial EEG dynamics including independent component analysis,” Journal of Neuroscience Methods, vol. 134, no. 1, pp. 9–21, 2004. [Google Scholar]
21. I. Winkler, S. Brandl, F. Horn, E. Waldburger, C. Allefeld et al., “Allefeld etal, Robust artifactual independent component classification for BCI practitioners,” Journal of Neural Engineering, vol. 11, no. 3, pp. 035013, 2014. [Google Scholar]
22. J. M. Pignat, O. Koval, D. V. D. Ville, S. Voloshynovskiy, C. Michel et al., “The impact of denoising on independent component analysis of functional magnetic resonance imaging data,” Journal of Neuroscience Methods, vol. 213, no. 1, pp. 105–122, 2013. [Google Scholar]
23. R. Li, G. Sun, H. He, Y. Jiang, R. Sui et al., “Gender forecast based on the information about people who violated traffic principle,” Journal on Internet of Things, vol. 2, no. 2, pp. 65–73, 2020. [Google Scholar]
24. S. Melynyte, G. Y. Wang and I. Griskova-Bulanova, “Gender effects on auditory P300: A systematic review,” International Journal of Psychophysiology, vol. 133, pp. 55–65, 2018. [Google Scholar]
25. J. Yuan, Y. He, Q. Zhang, A. Chen and H. Li, “Gender differences in behavioral inhibitory control: ERP evidence from a two-choice oddball task,” Psychophysiology, vol. 45, no. 6, pp. 986–993, 2008. [Google Scholar]
26. K. Caine, “Local standards for sample size at CHI,” in Proc. of the 2016 CHI conf. on human factors in computing systems, ACM press, pp. 981–992, 2016. [Google Scholar]
27. X. L. Zhou, C. S. Chen, Q. Dong, H. C. Zhang, R. L. Zhou et al., “Event-related potentials of single-digit addition, subtraction, and multiplication,” Neuropsychologia, vol. 44, no. 12, pp. 2500–2507, 2006. [Google Scholar]
28. Y. Q. Cao, Q. X. Qu, V. G. Duffy and Y. Ding, “Attention for Web Directory Advertisements: A Top-Down or Bottom-Up Process?,” International Journal of Human-Computer Interaction, vol. 35, no. 1, pp. 89–98, 2018. [Google Scholar]
29. Y. J. Ren, Y. Leng, J. Qi, P. K. Sharma, J. Wang et al., “Multiple cloud storage mechanism based on blockchain in smart homes,” Future Generation Computer Systems, vol. 115, no. 3, pp. 304–313, 2021. [Google Scholar]
30. J. Wang, X. Wang, Y. Yang, H. Zhang and B. Fang, “A review of data cleaning methods for web information system,” Computers, Materials & Continua, vol. 62, no. 3, pp. 1053–1075, 2020. [Google Scholar]
31. P. Kanske, J. Plitschka and S. A. Kotz, “Attentional orienting towards emotion: P2 and N400 ERP effects,” Neuropsychologia, vol. 49, no. 11, pp. 3121–3129, 2011. [Google Scholar]
32. K. E. Crowley and I. M. Colrain, “A review of the evidence for P2 being an independent component process: age, sleep and modality,” Clinical Neurophysiology, vol. 115, no. 4, pp. 732–744, 2004. [Google Scholar]
33. R. Verleger, “P3b: Towards some decision about memory,” Clinical Neurophysiology, vol. 119, no. 4, pp. 968–970, 2008. [Google Scholar]
34. J. Xu, Q. Y. Meng, J. Wu, J. X. Zheng, X. Y. Zhang et al., “Efficient and lightweight data streaming authentication in industrial control and automation systems,” IEEE Transactions on Industrial Informatics, vol. 17, no. 6, pp. 4279–4287, 2020. [Google Scholar]
35. H. Mansikka, K. Virtanen and D. Harris, “Comparison of NASA-TLX scale, modified Cooper-Harper scale and mean inter-beat interval as measures of pilot mental workload during simulated flight tasks,” Ergonomics, vol. 62, no. 2, pp. 246–254, 2017. [Google Scholar]
36. I. M. Shuggi, H. Oh, P. A. Shewokis and R. J. Gentili, “Mental workload and motor performance dynamics during practice of reaching movements under various levels of task difficulty,” Neuroscience, vol. 360, no. 7, pp. 166–179, 2017. [Google Scholar]
37. M. T. Buelow and L. L. Frakey, “Math anxiety differentially affects WAIS-IV arithmetic performance in undergraduates,” Archives of Clinical Neuropsychology, vol. 28, no. 4, pp. 356–362, 2013. [Google Scholar]
38. V. M. Montero, “Attentional activation of the visual thalamic reticular nucleus depends on ‘top-down’ inputs from the primary visual cortex via corticogeniculate pathways,” Brain Research, vol. 864, no. 1, pp. 95–104, 2000. [Google Scholar]
39. A. Sekine, Y. Niiyama, O. Kutsuzawa and T. Shimizu, “A negative component superimposed on event-related potentials during light drowsiness,” Psychiatry and Clinical Neurosciences, vol. 55, no. 5, pp. 473–478, 2001. [Google Scholar]
 | This work is licensed under a Creative Commons Attribution 4.0 International License, which permits unrestricted use, distribution, and reproduction in any medium, provided the original work is properly cited. |