DOI:10.32604/csse.2022.016620
| Computer Systems Science & Engineering DOI:10.32604/csse.2022.016620 | |
| Article |
Early Detection of Pancreatic Cancer Using Jaundiced Eye Images
Department of Information Technology, Easwari Engineering College, Chennai, Tamilnadu, 600089, India
*Corresponding Author: R. Reena Roy. Email: rreenaroyphd@gmail.com
Received: 06 January 2021; Accepted: 15 June 2021
Abstract: Pancreatic cancer is one of the deadliest cancers, with less than 9% survival rates. Pancreatic Ductal Adeno Carcinoma (PDAC) is common with the general public affecting most people older than 45. Early detection of PDAC is often challenging because cancer symptoms will progress only at later stages (advanced stage). One of the earlier symptoms of PDAC is Jaundice. Patients with diabetes, obesity, and alcohol consumption are also at higher risk of having pancreatic cancer. A decision support system is developed to detect pancreatic cancer at an earlier stage to address this challenge. Features such as Mean Hue, Mean Saturation, Mean Value, and Mean Standard Deviation are computed after color space conversion from RGB to HSV. Fuzzy k-Nearest Neighbor (F-kNN) is designed for classification. The system proposed is trained and tested using features extracted from jaundiced eye images. The proposed system results indicate that this model can predict pancreatic cancer as earlier as possible, helping clinicians make better decisions for surgical planning.
Keywords: Pancreatic adeno carcinoma; fuzzy-based classifier; jaundiced eye; classification system
Among all forms of cancer, pancreatic cancer is one of the deadly diseases [1,2], and it remains unnoticed by many people since cancer-specific symptoms are known only at later stages [3,4]. Due to this, many patients remain under-diagnosed, which does not lead clinicians to surgical planning. One of the earliest symptoms of pancreatic cancer is Jaundice [5,6]. The eyes become yellow discoloration of the skin [5] and whites of the eye as in Fig. 1. The sclera is the white part of the eye that will get affected during Jaundice. As carcinoma blocks the tube, the common bile duct that releases bile into the intestine. It helps develop bilirubin within the blood [7].
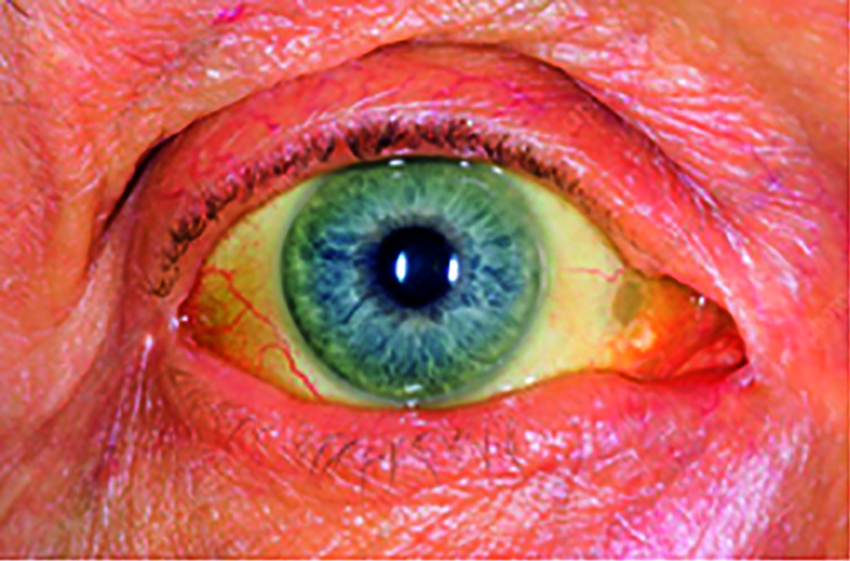
Figure 1: Jaundiced eye image
The blockage causes the urine to be dark yellow, light-colored stools, and itching sensation. The skin color and whites of the eyes will vary dynamically, counting on bilirubin levels in the blood. The yellow color appears when bilirubin exists in moderate levels, while very high levels will appear brown. The patient's severity will be known when there is an elevation in the blood's bilirubin levels. By recognizing sclera using computer vision and machine learning algorithms, it will detect the level of bilirubin in jaundice. The eye image of the patient with jaundice is used to detect whether the pancreas is affected by cancer or not. The symptoms of pancreatic cancer [8] are yellowish of skin and eye, pain or pain in the abdomen, diabetes, nausea, and vomiting, gall bladder or liver enlargement, and blood clots
The research's main objective is to link jaundice and pancreatic cancer since jaundice is easily recognizable through the whites of the eye, i.e., sclera. Hence, this becomes the motive to focus on this research. The pancreas organ condition can be detected through the iris images of diabetes patients [9]. The beta cells of the pancreas organ using iris diagnosis can measure insulin deficiency [10].
The decision support system is built based on recognizing the sclera from eye images through machine learning algorithms and extracting features from the sclera through color descriptors. Hence Hue, Saturation, mean value, and standard deviation are calculated. The sclera is segmented through a modified min-max color space threshold algorithm. The extracted features are calculated and given as the input for the proposed F-kNN for classification and validation. The fuzzy-based initialization functions are modeled. The weights are created using the sigmoid function for improving the accuracy of classification in kNN. This enhanced F-kNN outperforms other classical kNN. The incorporation of deep learning in radiation theory predicts pancreatic cancer for effective decision-making [11]. Deep learning neural network architectures are very useful in processing large-size images [12–14].
A computer decision support system is needed in the medical field for diagnostic purposes, which helps clinician's decisions. Normally, without the intervention of a Computer Aided Diagnosis (CAD) system, the computed tomography, magnetic resonance imaging, and position emission tomography images suffer from high observer variations as it needs well-trained radiologists. Therefore to reduce it, CAD systems are widely used. Likewise, an F-kNN approach to detect the severity of pancreatic cancer is designed. The F-kNN algorithm takes input from the features extracted from the Jaundiced Eye Image. The goal is to build an efficient CAD system framework for pancreatic cancer diagnosis from clinical data, assessing the patient's risk level.
The F-kNN approach is carried out in five stages: image preprocessing, segmentation, RGB to HSV representation, feature extraction, and classification. The block diagram of the proposed CAD system for pancreatic cancer is shown in Fig. 2. The proposed approach includes the following process:
a) Image preprocessing: image acquisition and resizing
b) Segmentation: min-max color space threshold algorithm
c) RGB to HSV representation.
d) Feature extraction
e) Classification: proposed F-kNN Approach
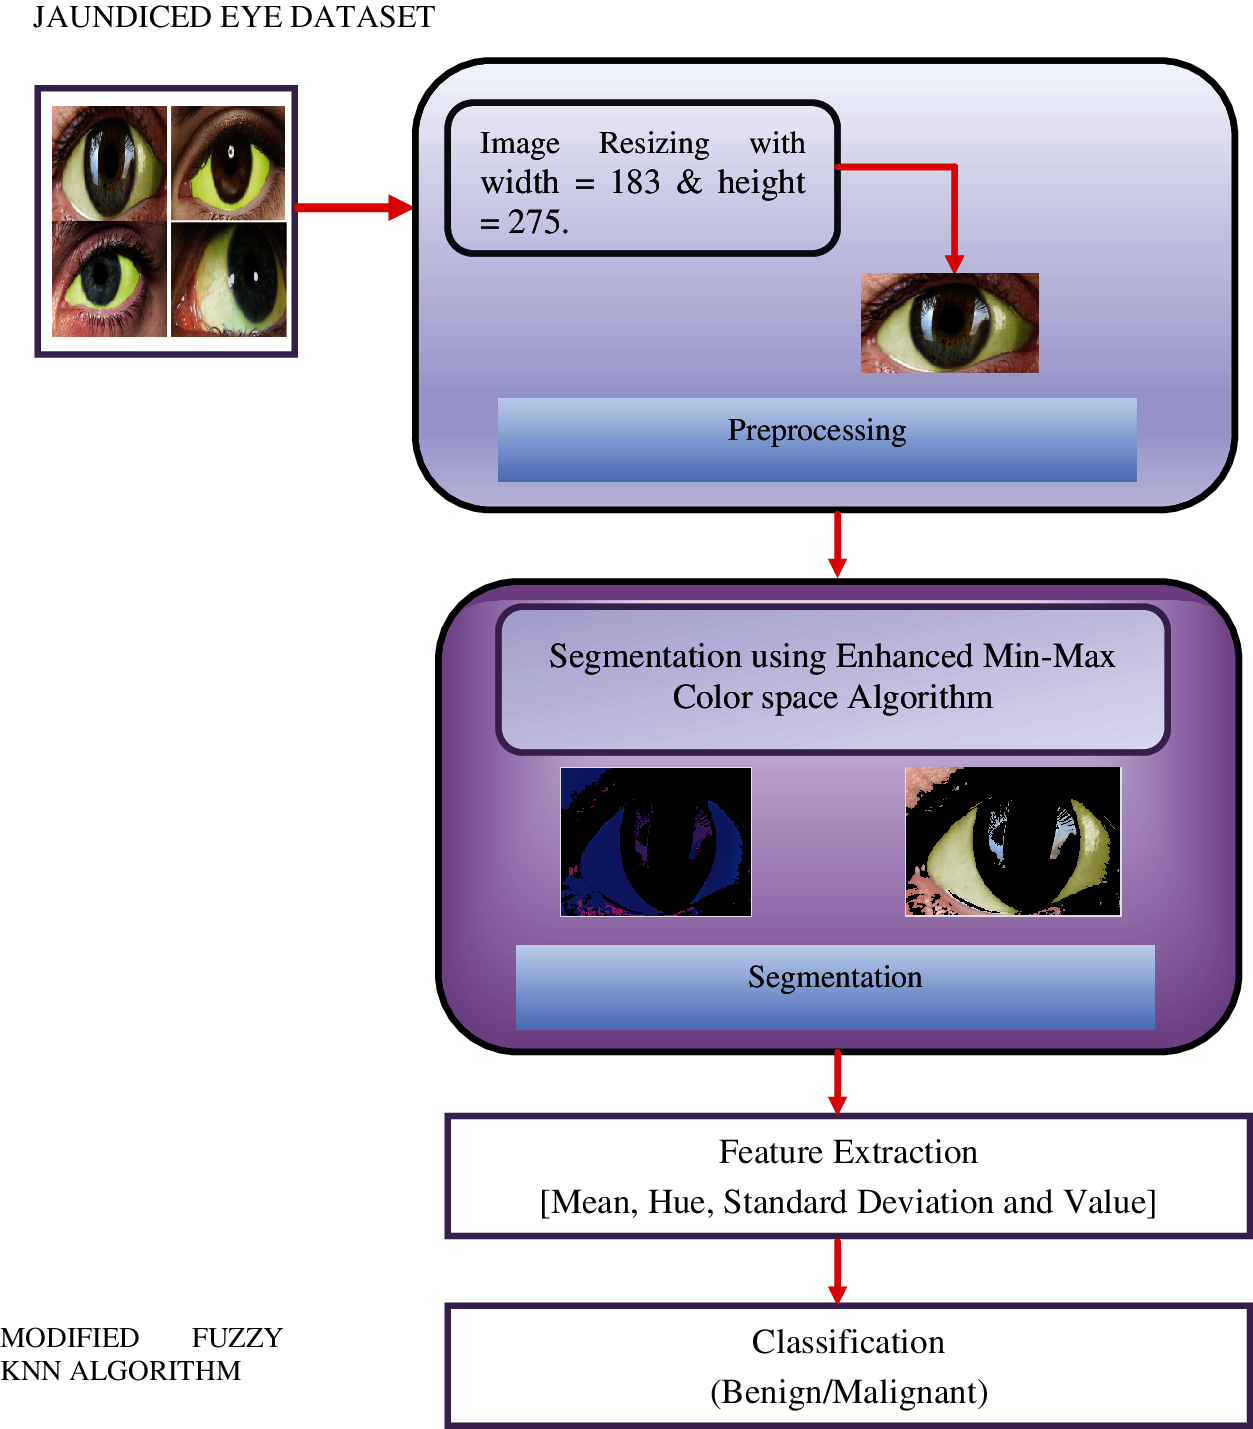
Figure 2: Block diagram of the proposed framework
The original eye image is loaded to detect whether the pancreas is affected by cancer through the ROI of the sclera. As carcinoma blocks the tube, which is named the common bile duct that releases bile into the intestine, it helps develop bilirubin within the blood. Jaundice turns the skin and the eyes (the sclera region) yellow, referred to as jaundice. The same blockage causes the urine to be dark yellow, light-colored stools, and itching sensation. In the eye image, we segment the sclera part to check whether the person is affected by cancer or not through the sclera's yellow part.
The eye image must be pre-processed before it is segmented. The input image is then resized to ensure all the images are in the same size for algorithm compatibility. The preprocessing leads to removing unwanted pixel information from the image. The image should be resized into the same size for further processing. The image's size is W = 183 and L = 275, as shown in Fig. 3.
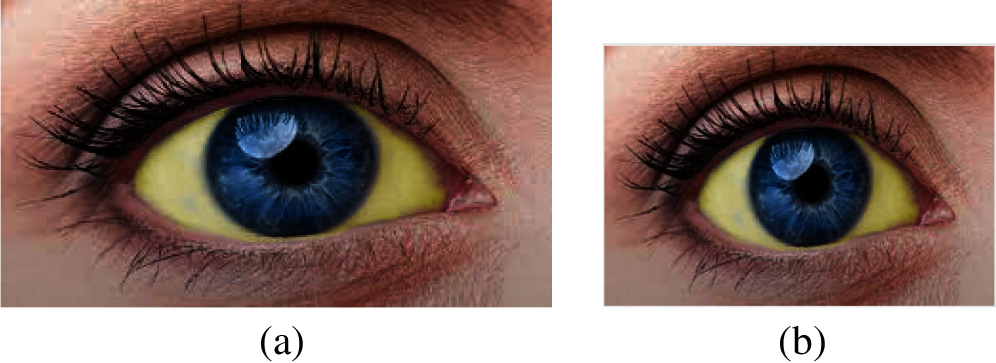
Figure 3: (a) Original image and (b) Resized image
Segmentation is the process of removing a particular portion of Image. The jaundice is affected by the white part in the eye, so it should be segmented using the min-max sclera segmentation. Sclera segmentation is a very important process [15]. Min-max color space algorithm works well by converting the image into the color spaces as RGB split them into their respective channels and then find the min/max value using the minMaxLoc function by minimum and maximum value, the white part is sclera part is segmented from the eye image. Since the yellowish part buildup by bilirubin needs to be extracted from whites of the eye, this min-max algorithm is used to separate the color, which produces much accuracy. The min-max color space threshold algorithm's accuracy is validated using the canny edge algorithm, and k-means algorithm. Accurate segmentation of medical images leads to the exact location of the tumour [16]. After making validation, results found that the proposed technique produces much better accuracy than other algorithms. The validation of segmentation techniques with the k-means algorithm, canny edge algorithm and min-max color space algorithm is shown in Fig. 4. The canny edge operator is widely used in locating the region of interest [17]. The algorithm is as follows:
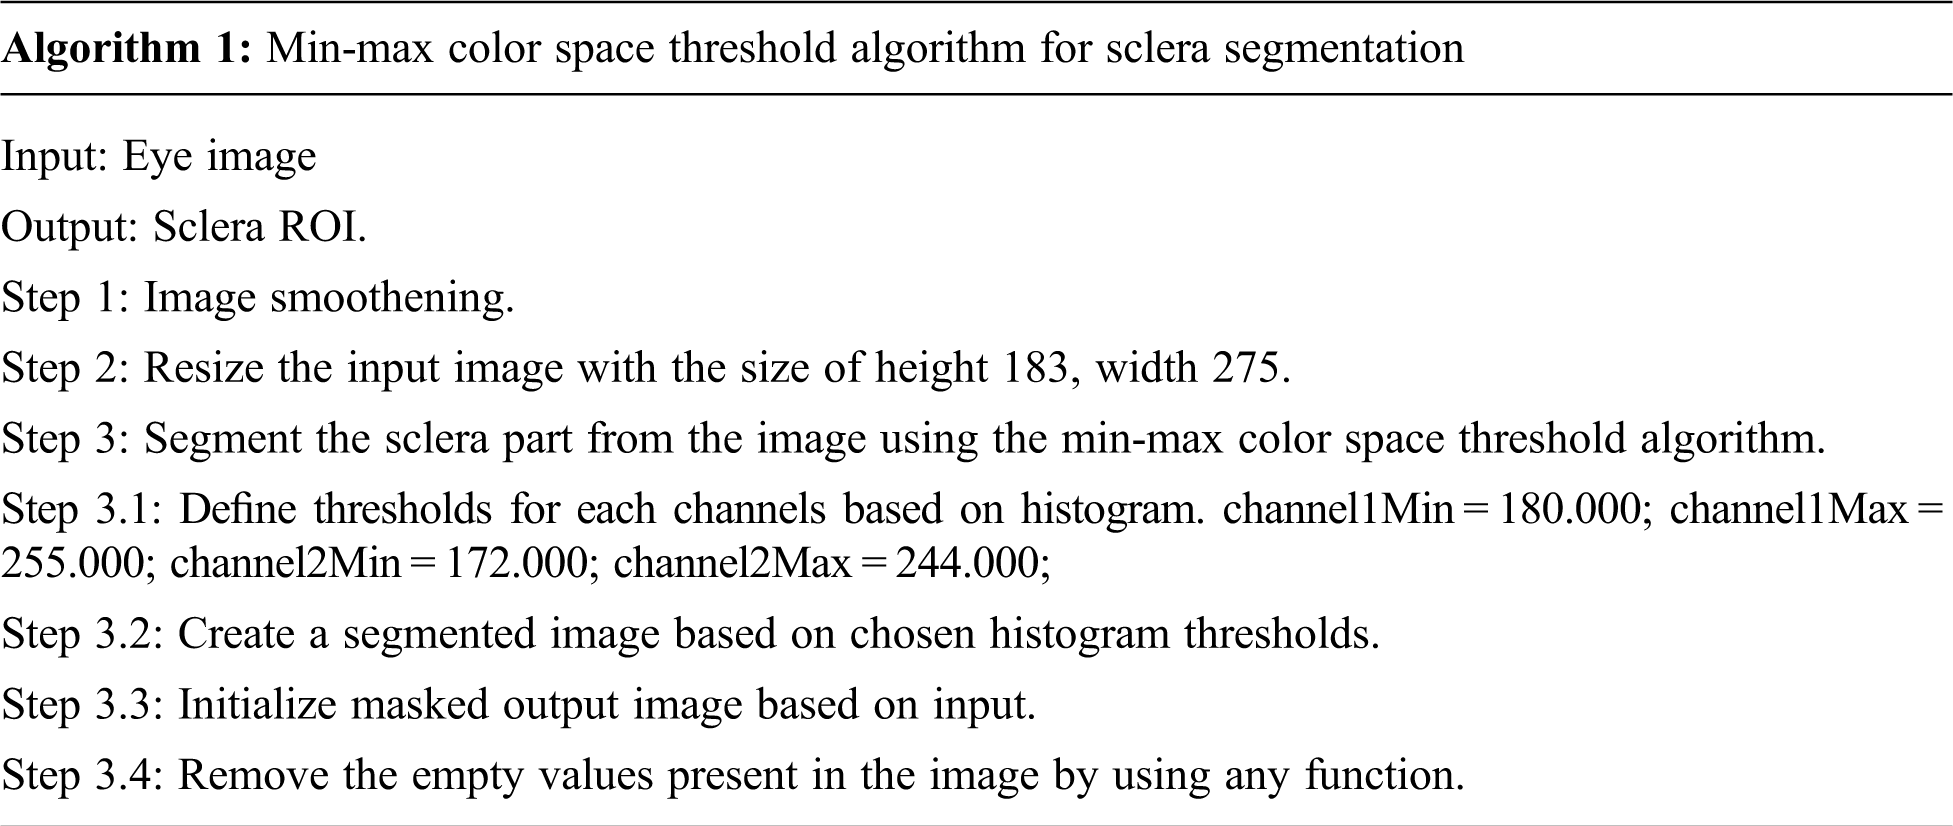

Figure 4: (a) Original image (b) Segmented image by k-means (c) Segmented image by canny edge operator, (d) Segmented image by min-max color space threshold
After the affected sclera is segmented, the image's RGB color representation is converted into HSV color space. The HSV is the widely preferred model over RGB because the human eye tends to recognize color similar to the HSV model describes the color. RGB stands for Red, Green, Blue, and HSV is described in terms of Hue, Saturation, and Value. The Hue represents the type of color. It can be described in angles in a circle. The circle has 360-degree rotation with values normalized from 0 to 255, and 0 is the redcolor. The RGB representation of the image is converted into HSV color space to extract color features. The algorithm for the conversion is shown below.
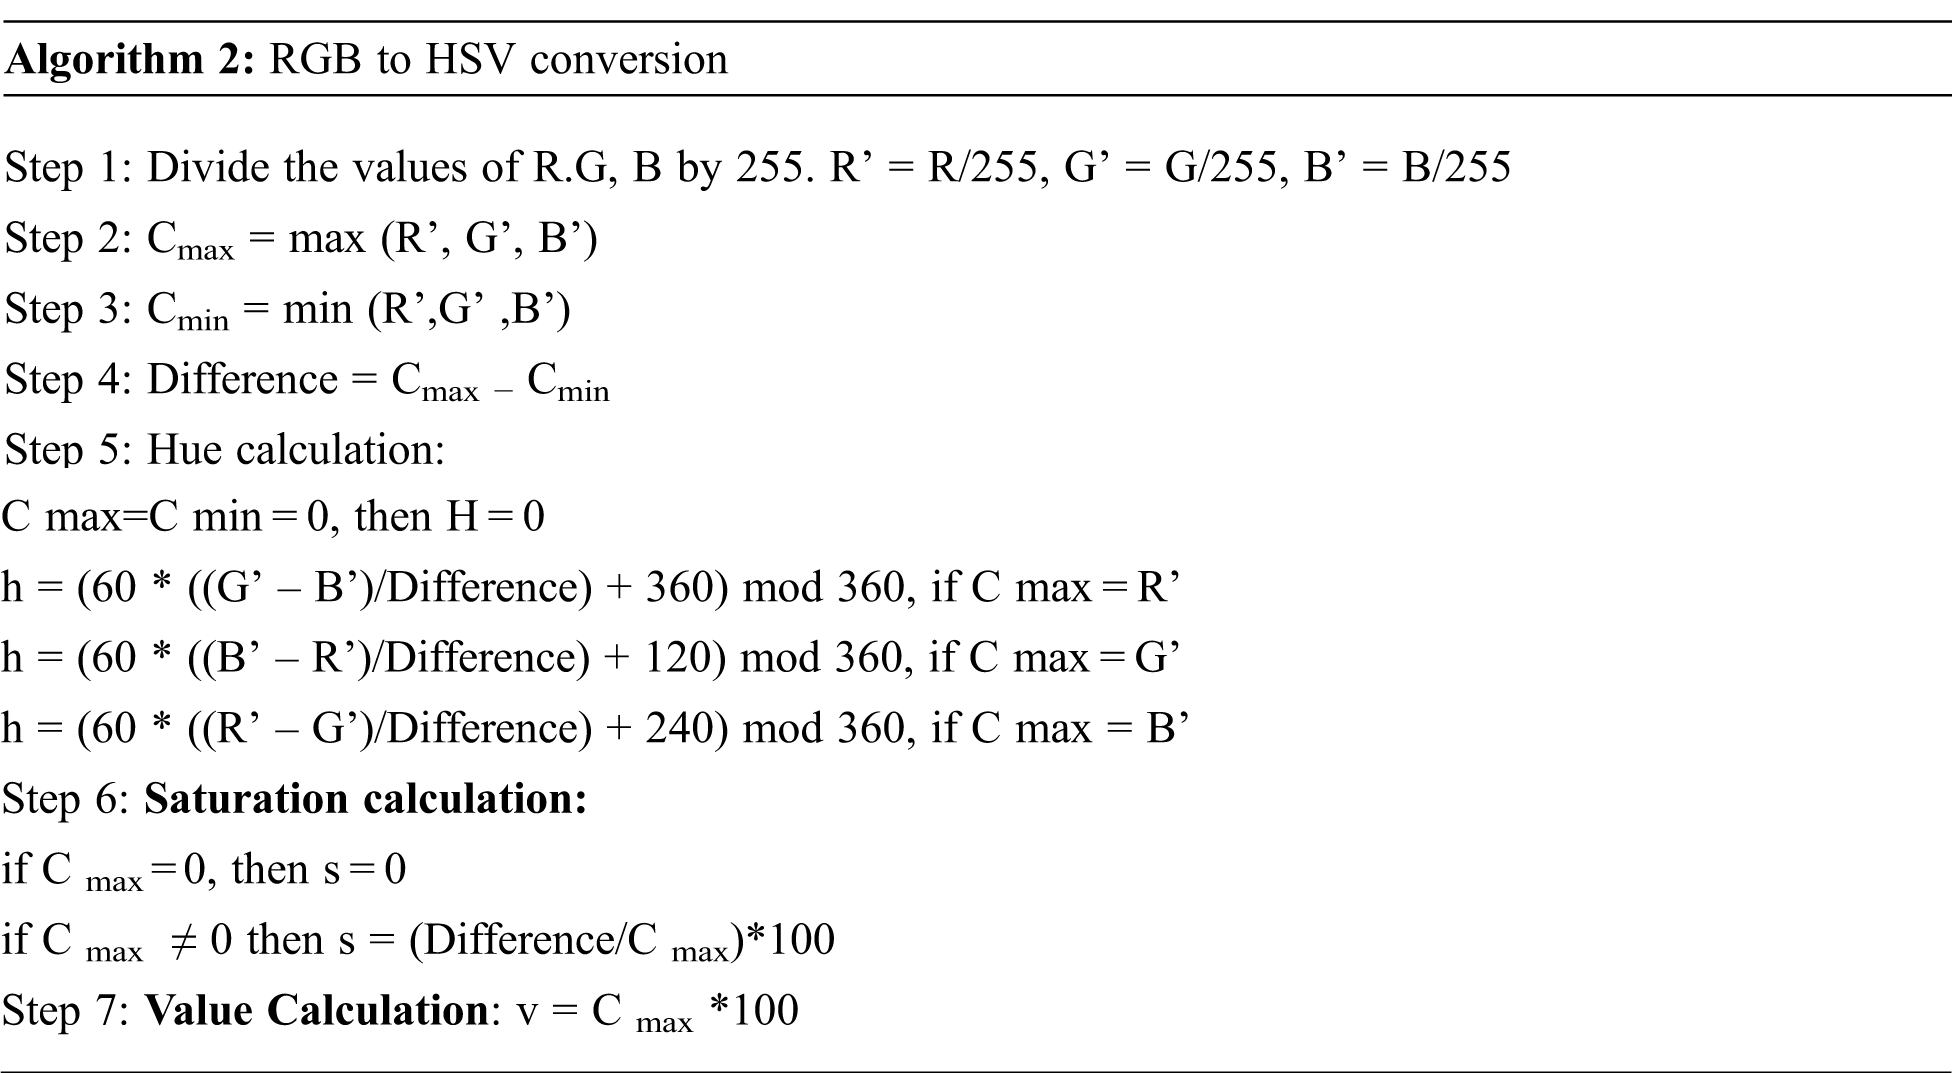
The conversion from RGB to HSV of the affected eye image is shown in Fig. 5.

Figure 5: (a) Original image, (b) Segmented image by min-max color space threshold, (c) RGB image converted to the HSV color space
Feature extraction is a dimensionality reduction technique representing the interesting parts of the image in a compact form. After the segmented image is converted into HSV form, feature extraction is performed. ‘Hue’ indicates the original color, ‘Saturation’ denotes the quantity to which the corresponding color is mixed with white, and ‘Value’ denotes the quantity to which the corresponding color is mixed with black (Gray level). In RGB, the color information cannot be separated from luminance. HSV or Hue Saturation Value is used to separate image luminance from color information. Using the HSV, the mean, standard deviation, mean Value, and mean Saturation of each channel is calculated and used as features. This research mainly focuses on the classification of pancreatic cancer using the proposed kNN Approach. Tab. 1 depicts mean Hue, mean Saturation, mean value, and mean standard deviation extracted from the eye images and the graphical representation of features extracted in Fig. 6. The algorithm for feature extraction is shown below.
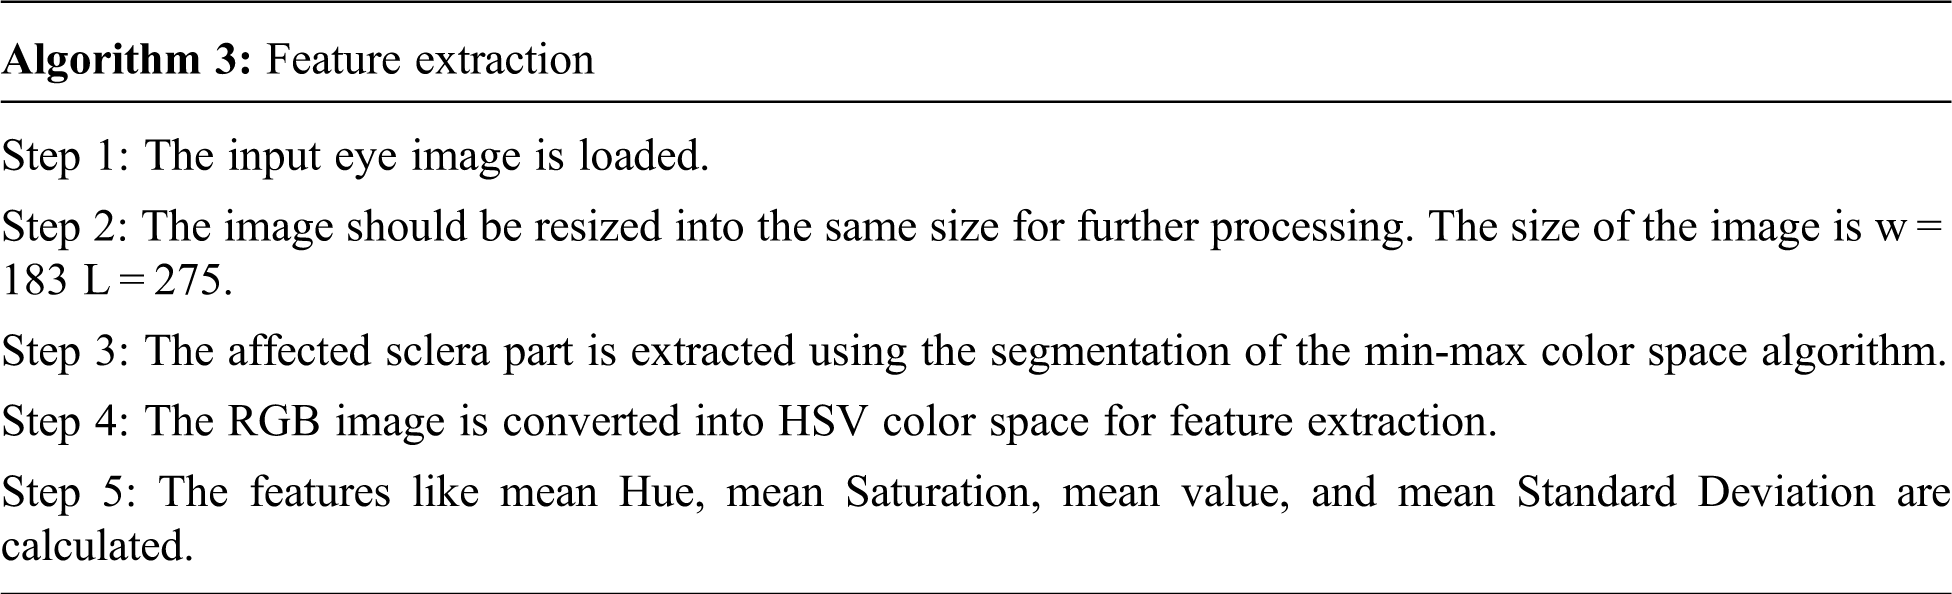
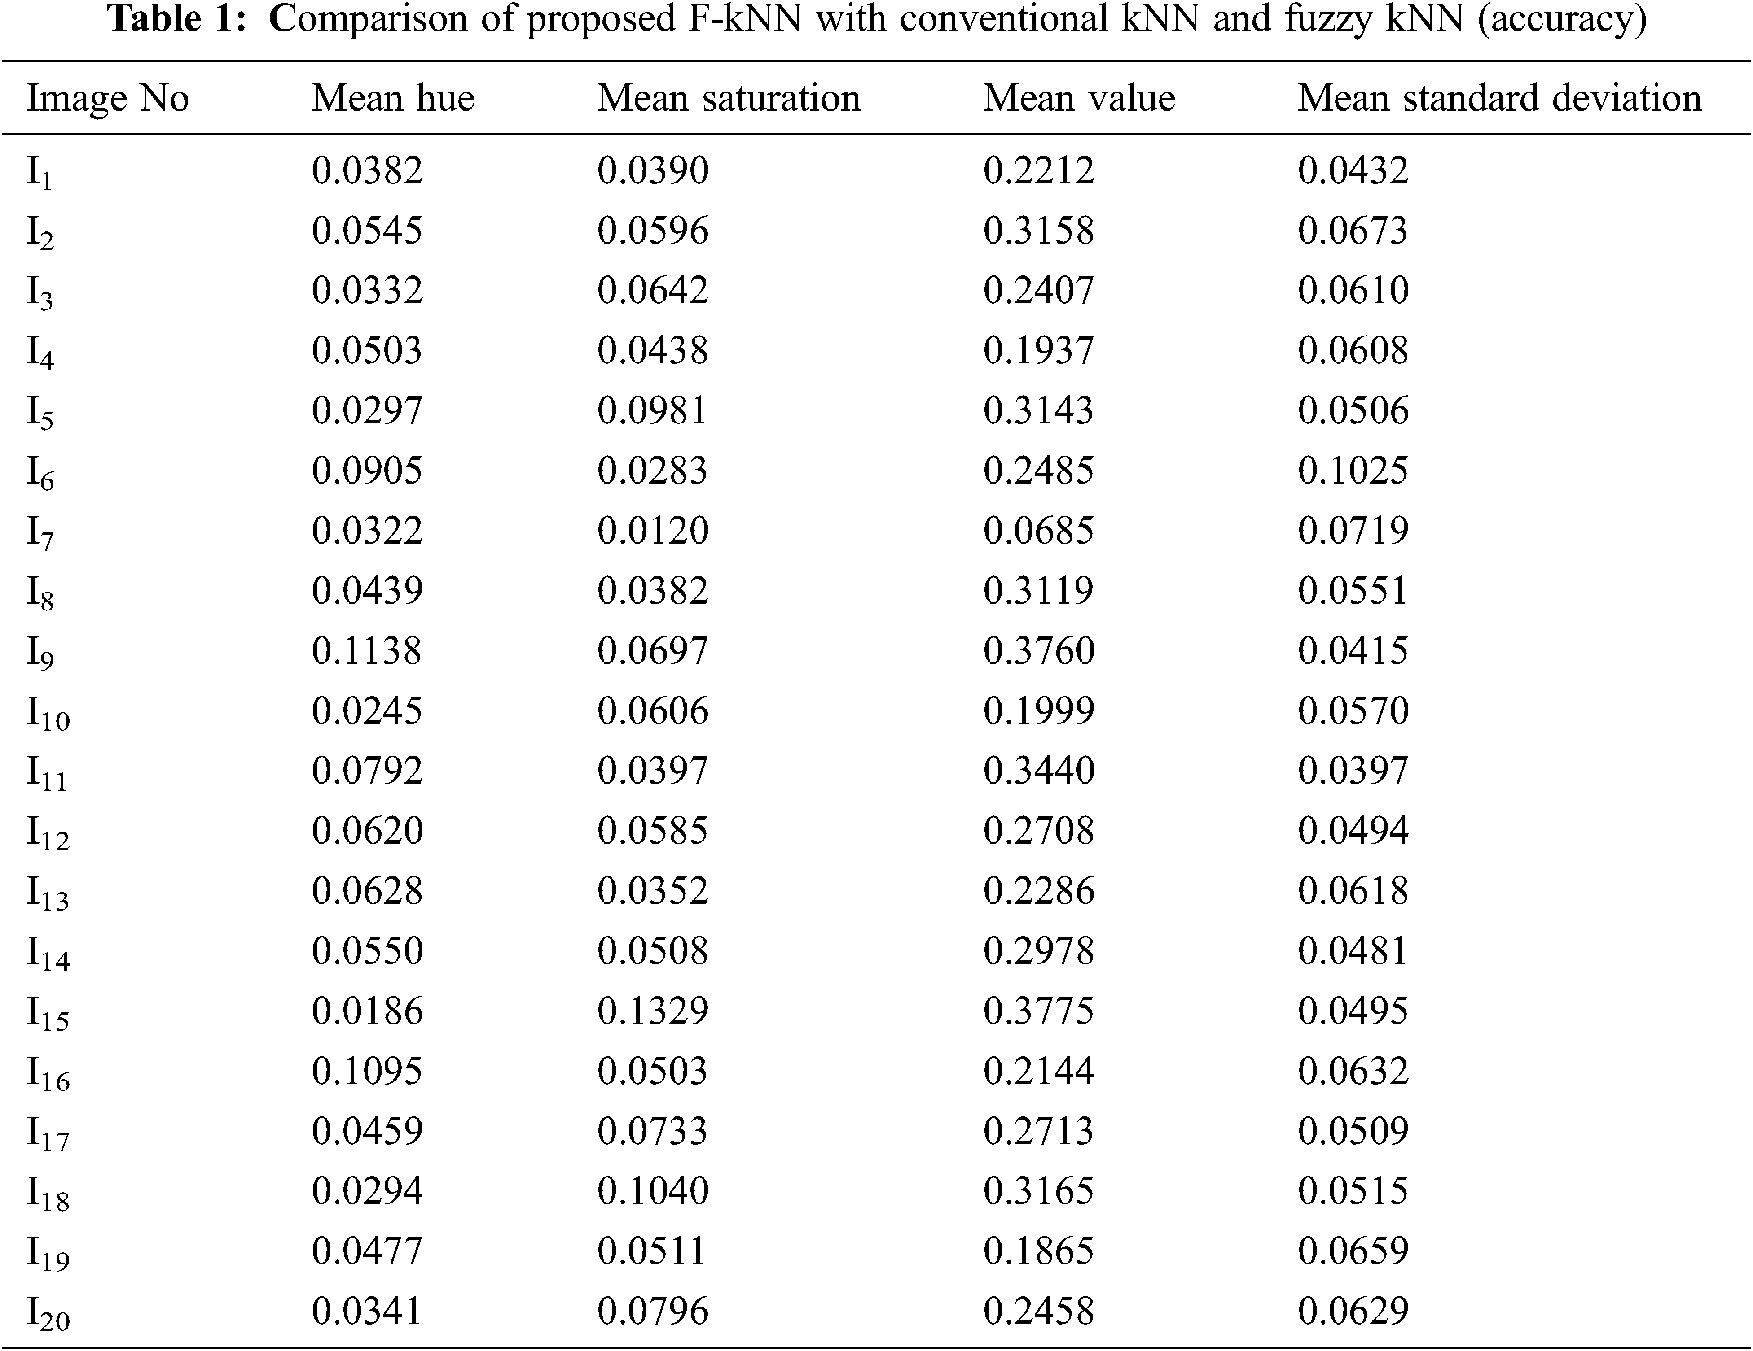
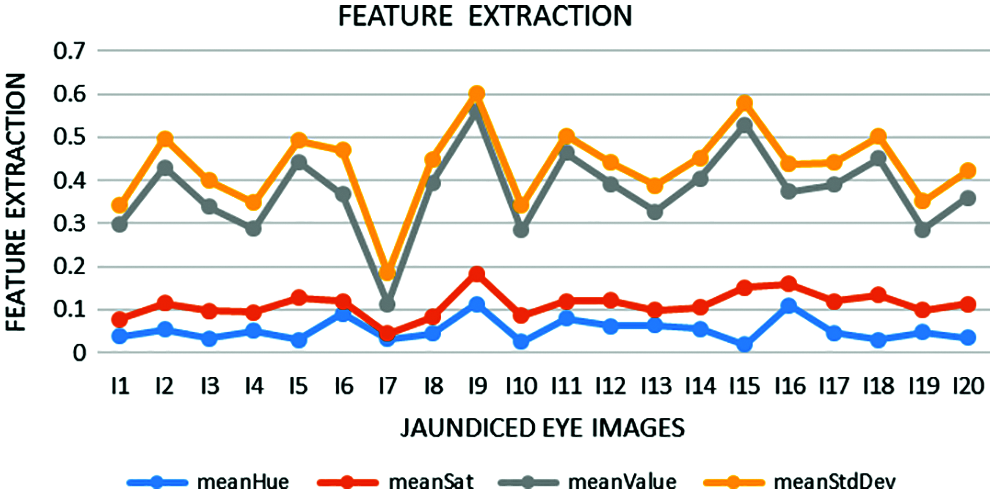
Figure 6: Extracted features such as mean Hue, mean Saturation, mean Value, and mean Standard Deviation
A brief description of F-kNN, as explained in [18] by is given below. In F-kNN, the membership values of samples are assigned to various categories are as follows [19]:
where i takes the values from 1, 2…c and j take the values from 1, 2…c where c indicates the number of classes and k indicates the nearest neighbours.
Euclidean distance is the distance measure used to find the distance between x and its jth neighbour, xj.uijrepresents the degree of membership of the pattern xjfrom the training set to the particular class i among the k nearest neighbours [20].
The value of njrepresents the number of neighbours of class, the membership values calculated using Eq. (2) must satisfy the below equation.
where j takes the values from 1, 2…n, and C is the number of classes.
In this methodology, sigmoid weighted F-kNN is proposed to optimize the feature weights and value of k. This novel work analyses the eye image to find the patient is affected by second-level pancreatic cancer using the proposed machine-learning algorithm called modified K-Nearest Neighbor. The existing kNN algorithm is modified using the weighted sigmoid function. Sigmoid Weighted kNN is one of the variations of the kNN method. It uses K nearest neighbours’ concept, irrespective of their classes, and then uses weighted votes from each sample. The result shows the classification of pancreatic cancer level-2 intensity. The general framework of enhanced F-kNN is shown in Fig. 7.
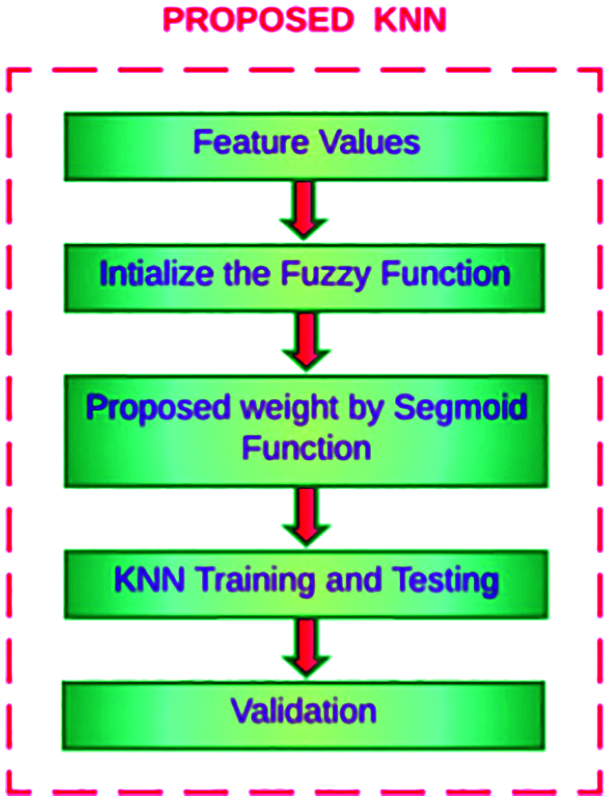
Figure 7: Detection of pancreatic cancer using proposed F-kNN
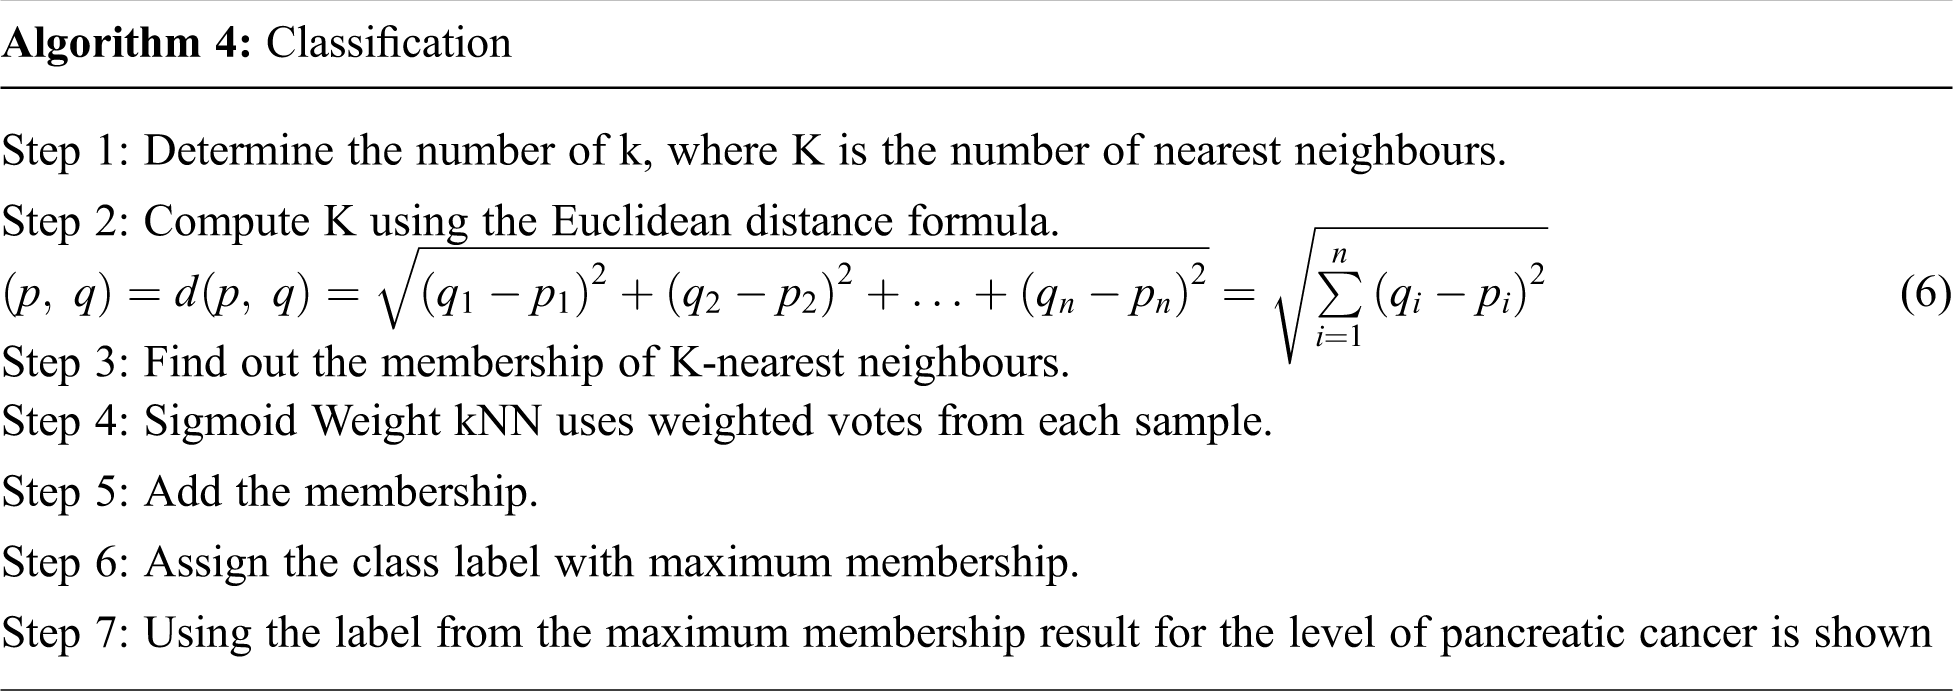
The algorithm for classification is shown below.
3 Experimental Analysis and Results
The dataset contains the four-feature attribute, in which each class label is assigned to have 3 values, 1, 2, and 3. The number of training instances is 42, and the testing instances are 18 instances. In percentage, 70 percent used as training and 30 percent used as testing. Tab. 2 shows the performance of the proposed F-kNN with conventional kNN and fuzzy kNN.
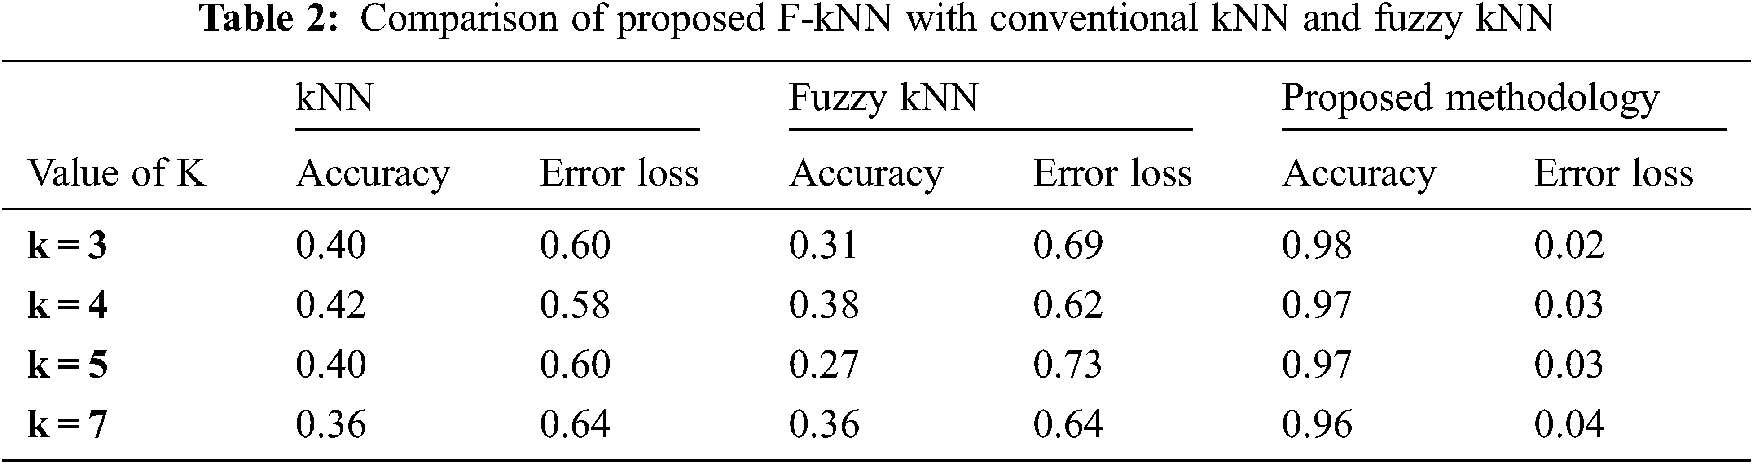
All the results are performed in an Intel Core i3 Duo processor and MATLAB 2020. Here the comparison of the proposed F-kNN approach with Fuzzy kNN and Conventional kNN in terms of accuracy is done. k takes four different values, i.e., k = 3, 4, 5, 7 where k represents the number of nearest neighbours used for the classification process [21]. The graphical representation of the analysis of accuracy is summarized in Fig. 8. The error rate calculated is summarized graphically in Fig. 9.
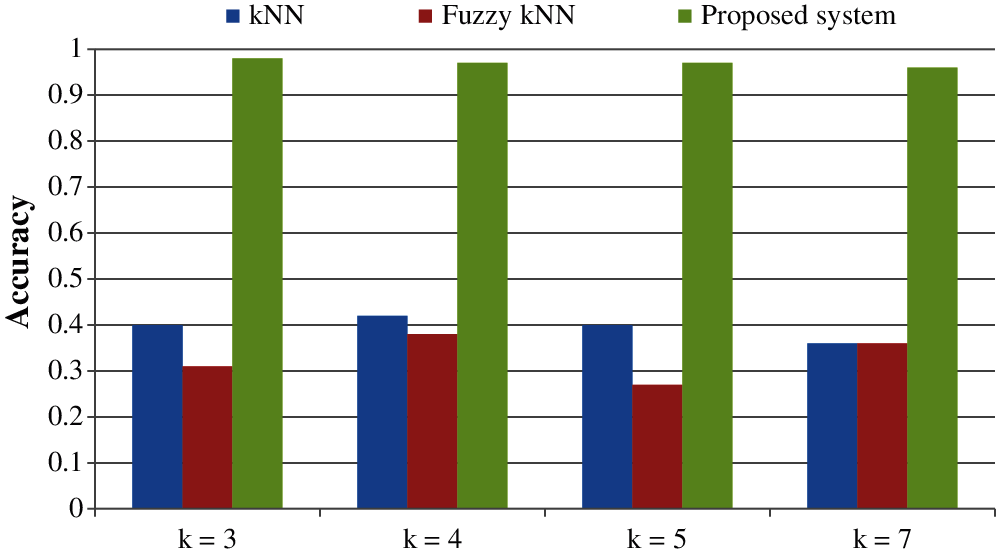
Figure 8: Graphical representation of analysis of accuracy for different values of k
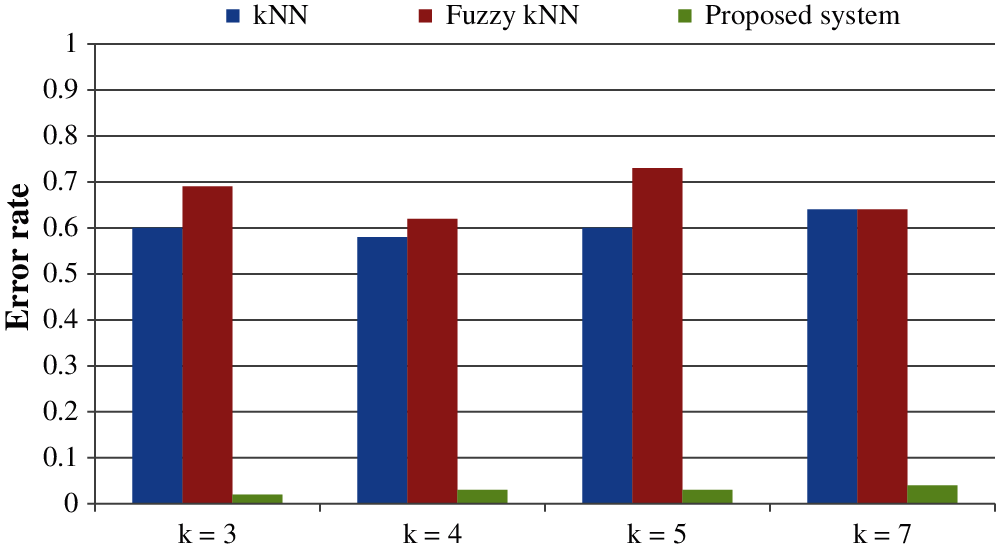
Figure 9: Error rate for different values of k
From the statistics and the graph obtained, it is concluded that the proposed F-kNN outperforms well compared to fuzzy kNN and conventional kNN algorithms. The extracted features are used in the proposed F-kNN for training and testing the samples to check whether the person is affected by pancreatic cancer by jaundice or not. The proposed F-kNN is a novel one that is different from the conventional kNN. The sigmoid-based fuzzy kNN is used in the proposed model. By changing the sigmoid weighted kNN, the accuracy level is improved. By trying the sample dataset, the accuracy improved by 98% percentage for k = 4.
An efficient decision support system is developed to detect pancreatic cancer using the highly related symptom with pancreatic cancer. i.e., jaundice. Experimental results show that the proposed Fuzzy kNN model efficiently classifies the various cancer stages and produces 97% accuracy. The proposed F-kNN model outperforms well compared to classical kNN and Fuzzy kNN, respectively. Here the significance of sclera segmentation with min-max color space, canny edge, and k-means algorithm with features extracted is analyzed and used for risk assessment. Feature extraction is done when the RGB representation is converted into HSV form. This proposed decision support system is built based on recognizing sclera from eye images through machine learning algorithms and extracting features from sclera through color descriptors. Hence, mean Hue, mean Saturation, mean value, and mean Standard Deviation are calculated. This analysis helps clinicians in better decision-making which help in the future. Also, the error loss that occurred during segmentation and classification can be avoided, which still improves accuracy. In the future, this kind of classification model can be used for other kinds of symptoms specific to pancreatic cancer to check the correlations.
Funding Statement: The authors received no specific funding for this study.
Conflicts of Interest: The authors declare that they have no conflicts of interest to report regarding the present study.
1. C. L. Wolfgang, J. M. Herman, D. A. Laheru, A. P. Klein, M. A. Erdek et al., “Recent progress in pancreatic cancer CA,” A Cancer Journal for Clinicians, vol. 63, no. 5, pp. 318–348, 2013. [Google Scholar]
2. American Cancer Society. Cancer Facts & Figures 2016. Technical report, 2016. [Google Scholar]
3. W. Muhammad, G. R. Hart, B. Nartowt, J. J. Farrell, K. Johung et al., “Pancreatic cancer prediction through an artificial neural network,” Frontiers in Artificial Intelligence, vol. 2, pp. 2, 2019. [Google Scholar]
4. T. Sen and S. Das, “An approach to pancreatic cancer detection using artificial neural network,” in Proc. of the Second Int. Conf. on Advances in Computer, Electronics and Electrical Engineering, Mumbai, India, pp. 56–60, 2013. [Google Scholar]
5. A. Mariakakis, M. A. Banks, L. Phillipi, L. Yu, J. Taylor et al., “Biliscreen: Smartphone-based scleral jaundice monitoring for liver and pancreatic disorders,” Proceedings of the ACM on Interactive, Mobile, Wearable and Ubiquitous Technologies, vol. 1, no. 2, pp. 1–26, 2017. [Google Scholar]
6. J. Shah, S. Surve and V. Turkar, “Pancreatic tumor detection using image processing,” Procedia Computer Science, vol. 49, pp. 11–16, 2015. [Google Scholar]
7. https://www.pancan.org/news/the-acts-about-jaundice-and-pancreatic-cancer/. [Google Scholar]
8. J. Shah, S. Surve and V. Turkar, “Pancreatic tumor detection using image processing,” in 4th Int. Conf. on Advances in Computing, Communication and Control, Mumbai, India, pp. 11–16, 2015. [Google Scholar]
9. A. D. Wibawa and M. H. Purnomo, “Early detection on the condition of pancreas organ as the cause of diabetes mellitus by real time iris image processing,” IEEE Asia Pacific Conference on Circuits and Systems, pp. 1008–1010, 2006. [Google Scholar]
10. I. P. D. Lesmana, I. K. E. Purnama and M. H. Purnomo, “Abnormal condition detection of pancreatic beta-cells as the cause of diabetes mellitus based on iris image,” in 2nd Int. Conf. on Instrumentation, Communications, Information Technology, and Biomedical Engineering, Bandung, Indonesia, pp. 150–155, 2011. [Google Scholar]
11. W. Zhao, L. Shen, B. Han, Y. Yang, K. Cheng, “Markerless pancreatic tumor target localization enabled by deep learning,” International Journal of Radiation Oncology* Biology* Physics, vol. 105, no. 2, pp. 432–439, 2019. [Google Scholar]
12. H. Mohsen, E. S. A. El-Dahshan, E. S. M. El-Horbaty and A. B. M. Salem, “Classification using deep learning neural networks for brain tumors,” Future Computing and Informatics Journal, vol. 3, no. 1, pp. 68–71, 2018. [Google Scholar]
13. S. Justin and M. Pattnaik, “Skin lesion segmentation by pixel by pixel approach using deep learning,” International Journal of Advances in Signal and Image Sciences, vol. 6, no. 1, pp. 12–20, 2020. [Google Scholar]
14. C. Srinivasan, S. Dubey and T. R. Ganeshbabu, “Complex texture features for glaucoma diagnosis using support vector machine,” International Journal of MC Square Scientific Research, vol. 7, no. 1, pp. 81–92, 2015. [Google Scholar]
15. P. Rot, M. Vitek, K. Grm, Ž. Emeršič, P. Peer et al., “Deep sclera segmentation and recognition,” in Handbook of Vascular Biometrics, Cham: Springer, pp. 395–432, 2020. [Google Scholar]
16. D. J. Reddy, T. A. Prasath, M. P. Rajasekaran and G. Vishnuvarthanan, “Brain and pancreatic tumor classification based on GLCM k-NN approaches,” in Int. Conf. on Intelligent Computing and Applications, Chennai, India, pp. 293–302, 2019. [Google Scholar]
17. A. Helwan, “ITDS: Iris tumor detection system using image processing techniques,” International Journal of Scientific and Engineering Research, vol. 5, no. 11, pp. 76–80, 2014. [Google Scholar]
18. J. M. Keller, M. R. Gray and J. A. Givens, “A fuzzy k-nearest neighbor algorithm,” IEEE Transactions on Systems, Man, and Cybernetics, vol. 4, pp. 580–585, 1985. [Google Scholar]
19. W. Shang, H. Huang, H. Zhu, Y. Lin, Z. Wang et al., “An improved kNN algorithm-fuzzy kNN,” in Int. Conf. on Computational and Information Science, Xi’an, China, pp. 741–746, 2005. [Google Scholar]
20. Z. Cai, J. Gu, C. Wen, D. Zhao, C. Huang et al., “An intelligent Parkinson's disease diagnostic system based on a chaotic bacterial foraging optimization enhanced fuzzy KNN approach,” Computational and Mathematical Methods in Medicine, vol. 2018, pp. 1–24, 2018. [Google Scholar]
21. S. Taneja, C. Gupta, S. Aggarwal and V. Jindal, “MFZ-kNN—a modified fuzzy based k nearest neighbor algorithm,” in Int. Conf. on Cognitive Computing and Information Processing, Noida, India, pp. 1–5, 2015. [Google Scholar]
 | This work is licensed under a Creative Commons Attribution 4.0 International License, which permits unrestricted use, distribution, and reproduction in any medium, provided the original work is properly cited. |