DOI:10.32604/csse.2022.020439
| Computer Systems Science & Engineering DOI:10.32604/csse.2022.020439 | |
| Article |
Digital Mammogram Inferencing System Using Intuitionistic Fuzzy Theory
1Department of CSE, Rajalakshmi Engineering College, Chennai, India
2Karpagam College of Engineering, Coimbatore, India
*Corresponding Author: Susmita Mishra. Email: susmitamishra@outlook.com
Received: 24 May 2021; Accepted: 29 July 2021
Abstract: In the medical field, the detection of breast cancer may be a mysterious task. Physicians must deduce a conclusion from a significantly vague knowledge base. A mammogram can offer early diagnosis at a low cost if the breasts' satisfactory mammogram images are analyzed. A multi-decision Intuitionistic Fuzzy Evidential Reasoning (IFER) approach is introduced in this paper to deal with imprecise mammogram classification efficiently. The proposed IFER approach combines intuitionistic trapezoidal fuzzy numbers and inclusion measures to improve representation and reasoning accuracy. The results of the proposed technique are approved through simulation. The simulation is created utilizing MATLAB software. The screening results are classified and finally grouped into three categories: normal, malignant, and benign. Simulation results show that this IFER method performs classification with accuracy almost 95% compared to the already existing algorithms. The IFER mammography provides high accuracy in providing early diagnosis, and it is a convenient diagnostic tool for physicians.
Keywords: Mammogram; intuitionistic fuzzy evidential reasoning; trapezoidal fuzzy; malignant; benign
Breast cancer is a leading cause of death in women in both developed and developing countries. Mammography is the best available tool for detecting breast cancer in the primary stage [1,2]. A mass recognized by mammography is one of the important symptoms of breast cancer. Radiologists diagnose such masses by reading mammograms, which is not an easy task. Therefore, suspicious tissues are removed from the breast to check for cancer screening using breast biopsy. Computer-assisted detection software was developed in 1988 for mammography but it has not improved to interpretive accuracy [3,4]. Two main types of mammography are available, such as film-screen mammography and digital mammography. Available facts indicate that more than 60–70% of biopsies of suspicious masses turn out to be benign cases [5]. The use of a computer-based diagnosis system can help to minimize unnecessary biopsies. Such systems can act as a second opinion for radiologists for effective breast cancer diagnosis and to help to reduce the mortality rate [6].
This research is focusing on designing an efficient intuitionistic fuzzy evidential reasoning technique to classify masses in digital mammograms. The proposed system will investigate IFER's overall performance in classifying suspicious areas, using features derived from high-order statistical descriptors and the Gray Level Co-occurrence Matrix (GLCM) system. The remaining part of this work is organized as follows.
i) Section 2 discuss the Literature survey based on the existing mammogram classification methods.
ii) Section 3 discusses the working function of the proposed fuzzy evidential reasoning approach based on the mammogram classification system.
iii) The simulation results and performance analysis of the proposed system are present in Section 4.
iv) Finally, Section 5 discusses the conclusion and future scope of the proposed system.
Many research works have been carried out in breast cancer analysis using handcrafted image features and primitive machine learning classifiers [7–9]. New advancements for recognizing breast cancer are proposed in Gordienko et al. [10]. The strategy utilizes three classification calculations named Radial Basis Function (RBF) [11], Support Vector Machine (SVM) [12], and Particle Swarm Optimization (PSO) [13]. Breast cancer informational index prepared by the innovation and the test property technique additionally applies. Affectability to the framework's functions is determined by using some Artificial Intelligence execution measurements, for example, precision and so on. The researchers have exhibited breast cancer recognition arrangements [14,15], which have been applied to two distinctive Wisconsin breast cancer datasets utilizing GA feature extraction and Random Forest (RF) techniques.
The Genetic Algorithm (GA) disposes pointless information properties but doesn't give data that the framework can quickly utilize [16]. In [17–19] proposed a method called GA-moon to recognize breast cancer. The genetic algorithm is utilized for choosing the ideal properties from the general qualities. In [20] utilizing multi-quality genetic programming representative relapse built up a demonstrative classifier for breast cancer. The model uses a 10-fold cross-validation method [21]. The program gives scientific articulation on the properties of the informational index, but it isn't evident whether the paper is being introduced as training or investigation. The accuracy achieved by the model is 89.28%, and the Root Mean Squared Error (RMSE) is 0.1303. The researchers in [22–24] portrait imaginative procedure for breast cancer forecast by utilizing a hybrid neuro genetic framework involving Genetic Algorithm and Training Feed Forward Back Propagation strategy [25].
The framework is prepared to step out of the design to improve the accuracy by 87%. Random Forest (RF) [26], Bayesian Network (BN) [27], and Support Vector Machine (SVM) were presented in [28] for the discovery of breast cancer. Shirking multiple times cross-validation will be utilized on the format fitting. The Knowledge Analysis Waikato Environmental framework actualized and processed execution measurements, for example, accuracy, recall, precision, etc. In [29] the medical datasets are analyzed and inferred for prediction with features. The features can be processed with cloud environment.
While reviewing the literature, we observed the existing methods have a high false classification ratio, so a new method is needed to overcome the drawbacks of existing methods. Therefore, this work uses a fuzzy evidential reasoning classifier to enhance the performance of mammogram classification.
3 Proposed Mammogram Classification
This work proposes a novel computer-Aided Detection (CAD) framework to decrease the human factor affiliation and help radiologists in the precise revelation of thoughtful/intrusive tissue utilizing fundamental morphological measures. The data Region of Interest (ROI) is lit up by expanding physical removed and preprocessing conditions with Adaptive Vector Median Filter's help. The features are extracted using the GLCM method, and a multi–decision intuitionistic fuzzy evidential reasoning classifier is used to recognize the vital class of breast disease. The block diagram of the proposed mammogram classification is shown in Fig. 1.
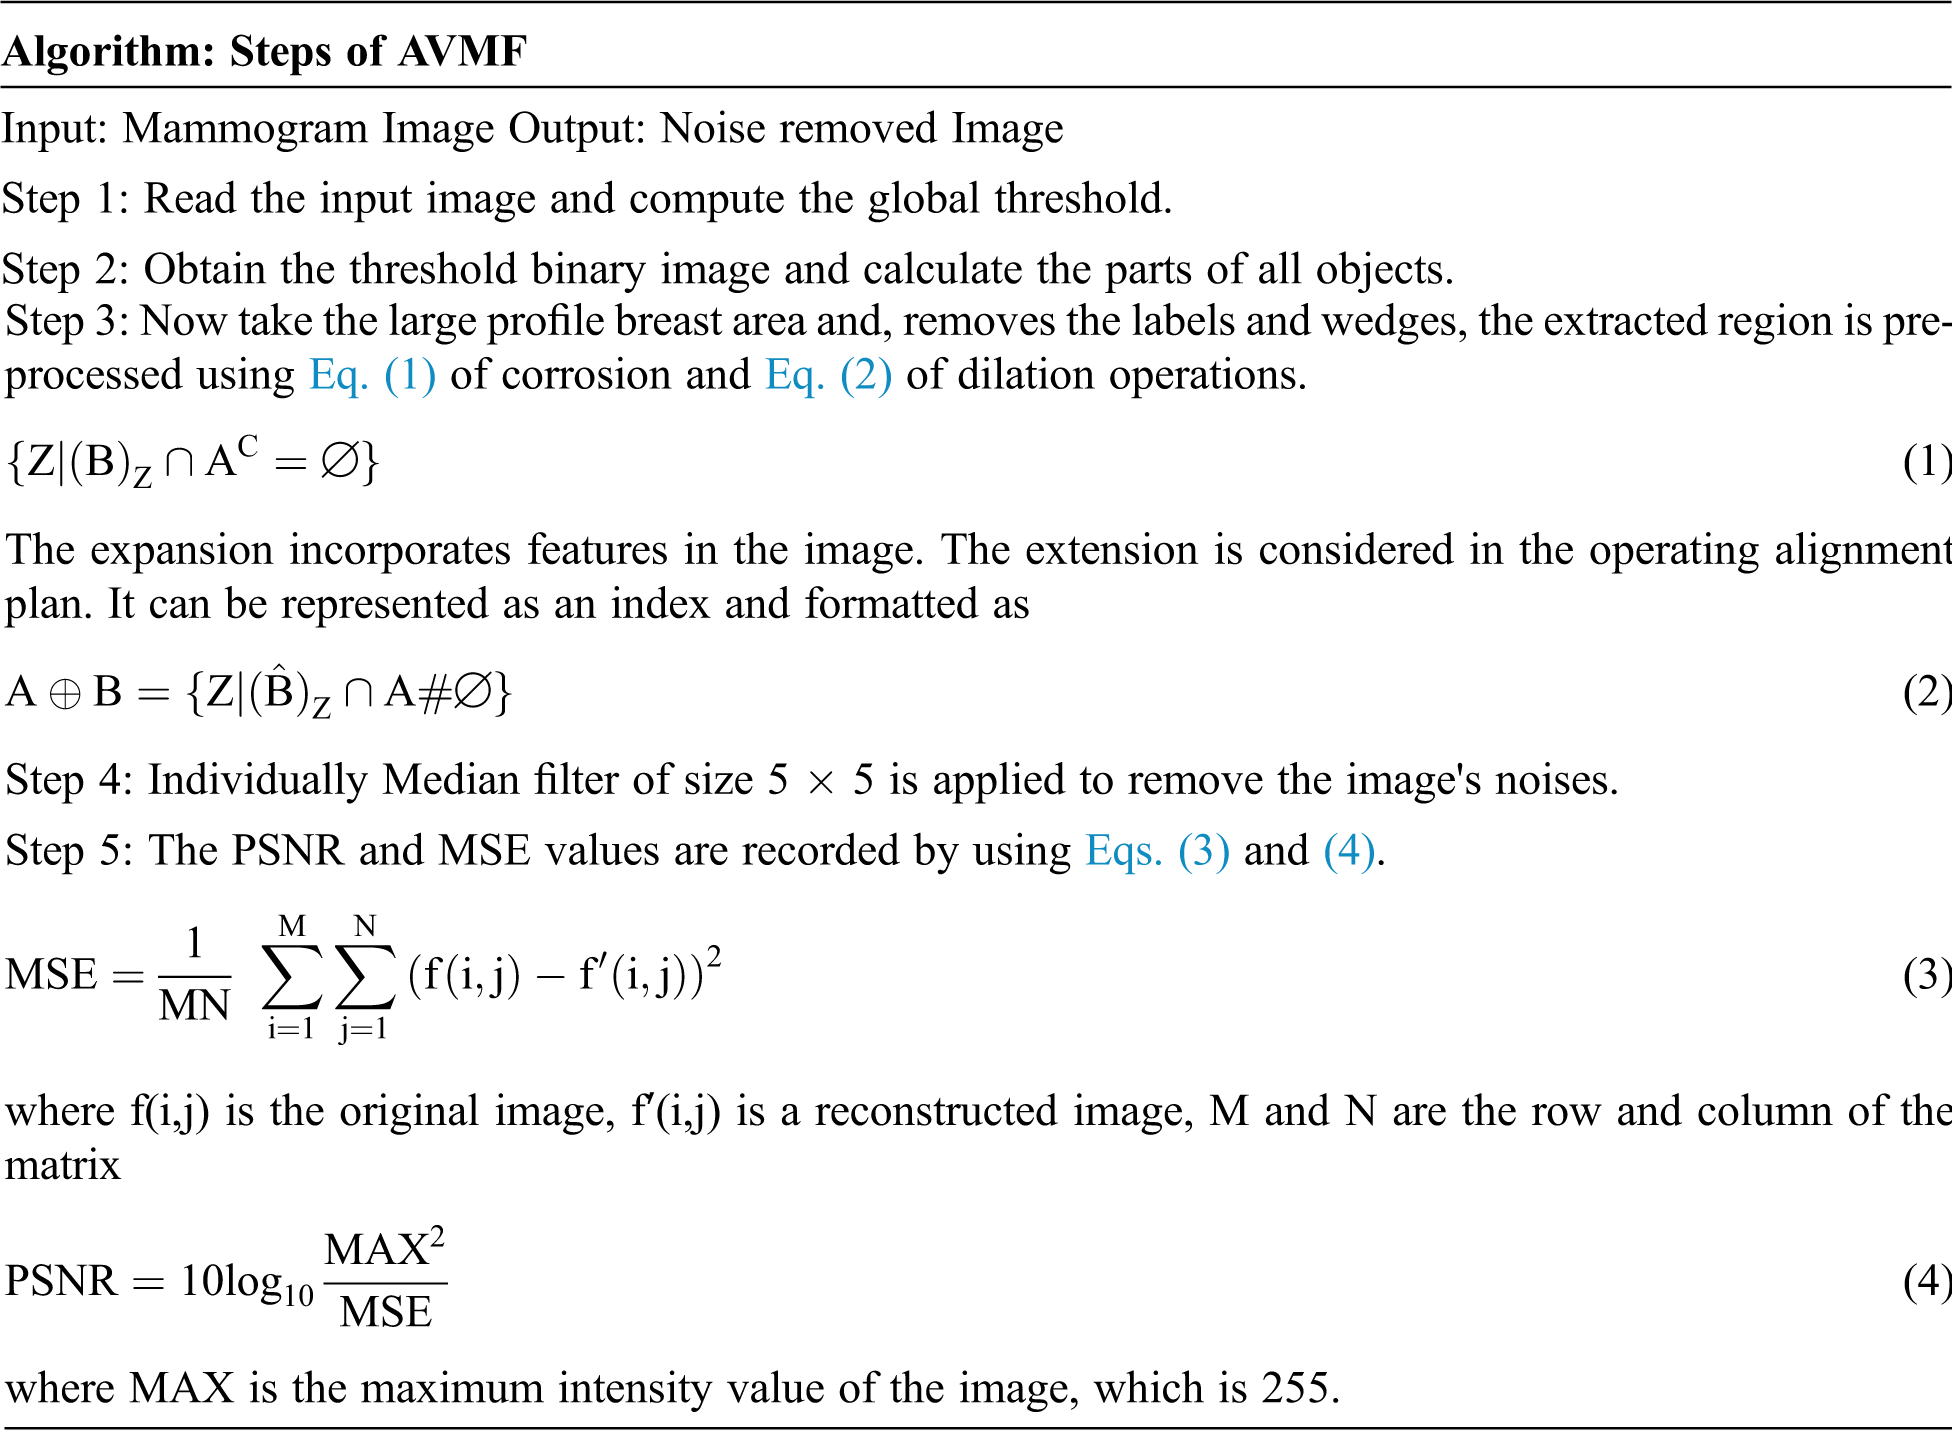
3.1 Preprocessing—Adaptive Vector Median Filter
Pre-processing stage involves the process of image restoration, image enhancement. The process of image enhancement aims to sharpen or clarify the image's characteristics, making it easy for the next process. Improved images include manipulation contrast and gray level, noise reduction, pseudo coloring, filtering, and others. AVMF performs spatial preparation to figure out which pixels of an image are influenced by motivation clamor. AVMF characterizes pixels as commotion by contrasting every pixel of the image with its encompassing neighboring pixels.
AVMF performs spatial preparation to figure out which pixels of an image are influenced by noise. AVMF characterizes pixels as commotion by comparing every pixel contrast and intensity of the image with its encompassing neighboring pixels.
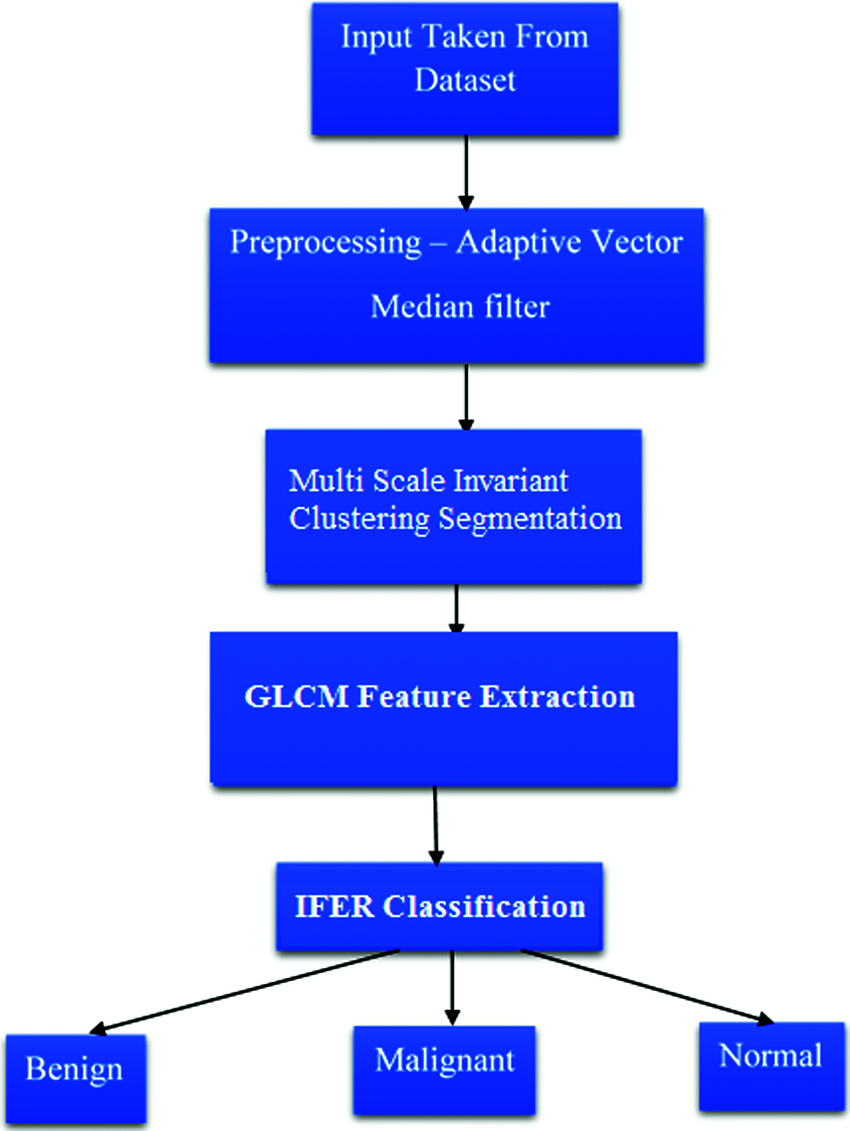
Figure 1: Block diagram of proposed mammogram classification system
For comparison with input samples (Figs. 2a–2c), the pre-processed images (Figs. 2d–2f) have low noise (The detailed Comparison is shown in Section 4). Further, these images are used for the segmentation process.
3.2 Multi Scale-Invariant Clustering Segmentation
The pre-processed image's impact is segmented by utilizing a Multi-Scale Invariant Clustering (MSIC) segmentation method. The proposed segmentation is the procedure by which discrete objects with similar qualities can be appointed to gatherings. A clustering algorithm has been used as an apparatus to break down assortments of information. This idea has been investigated by numerous clustering experts, demonstrating how valuable it is for information examination. The examples got from perceptions, informational things, and feature vectors are unsupervised classified, or clustered. The proposed method requires registering the separations between all the information. The Gaussian piece is taken as the essential estimation of thickness ρi of the information point I in the segmentation procedure. The accompanying condition is utilized to measure the separation
The first estimation of information is removed using the Euclidean separation. Along with the portrayal of anticipating the information image into shading spaces and the fundamental thought of MSIC segmentation algorithm, the segmentation algorithm could be depicted as follows:
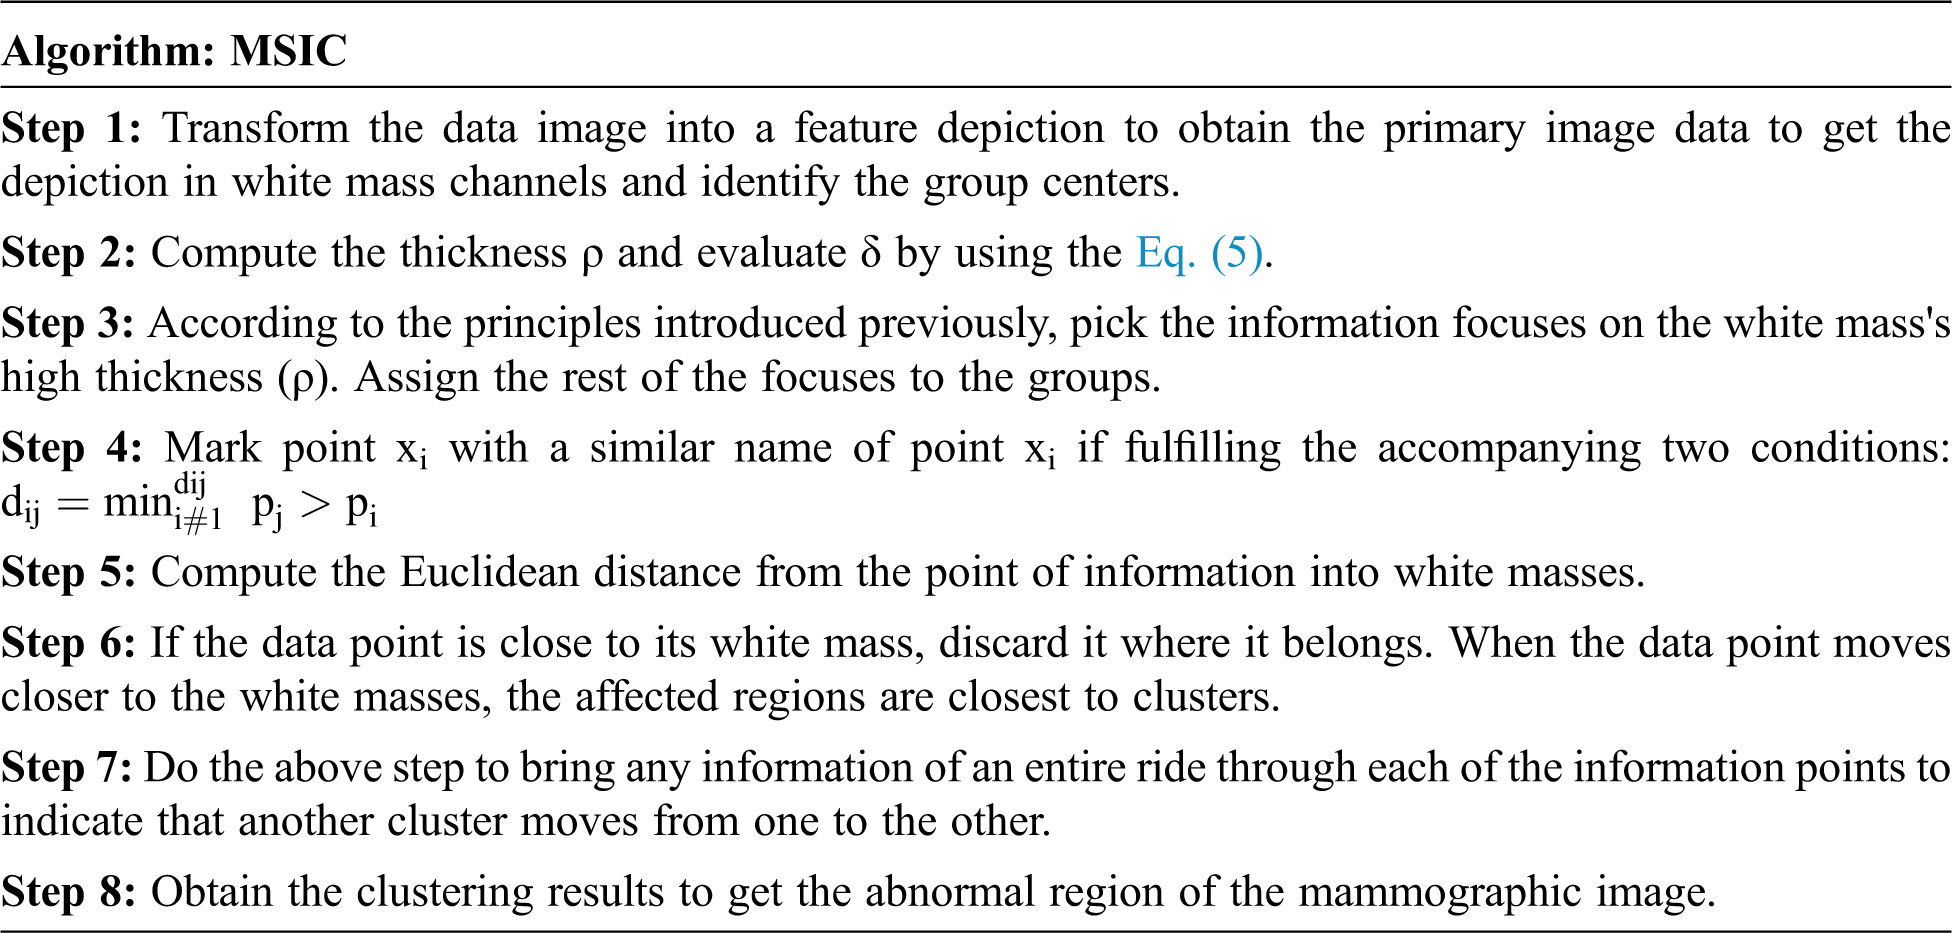

Figure 2: Result of Pre-processing a) Sample-1, b) Sample-2, c) Sample-3, d) Result of Sample-1, e) Result of Sample-2, f) Result of Sample-3
Fig. 3 shows the overall flow chart of segmentation. The Probabilistic Rand Index (PRI), Variation of Information (VOI), and Global Consistency Error (GCE) parameters are used to validate the performance of segmentation. The result of segmentation is shown in Fig. 4.
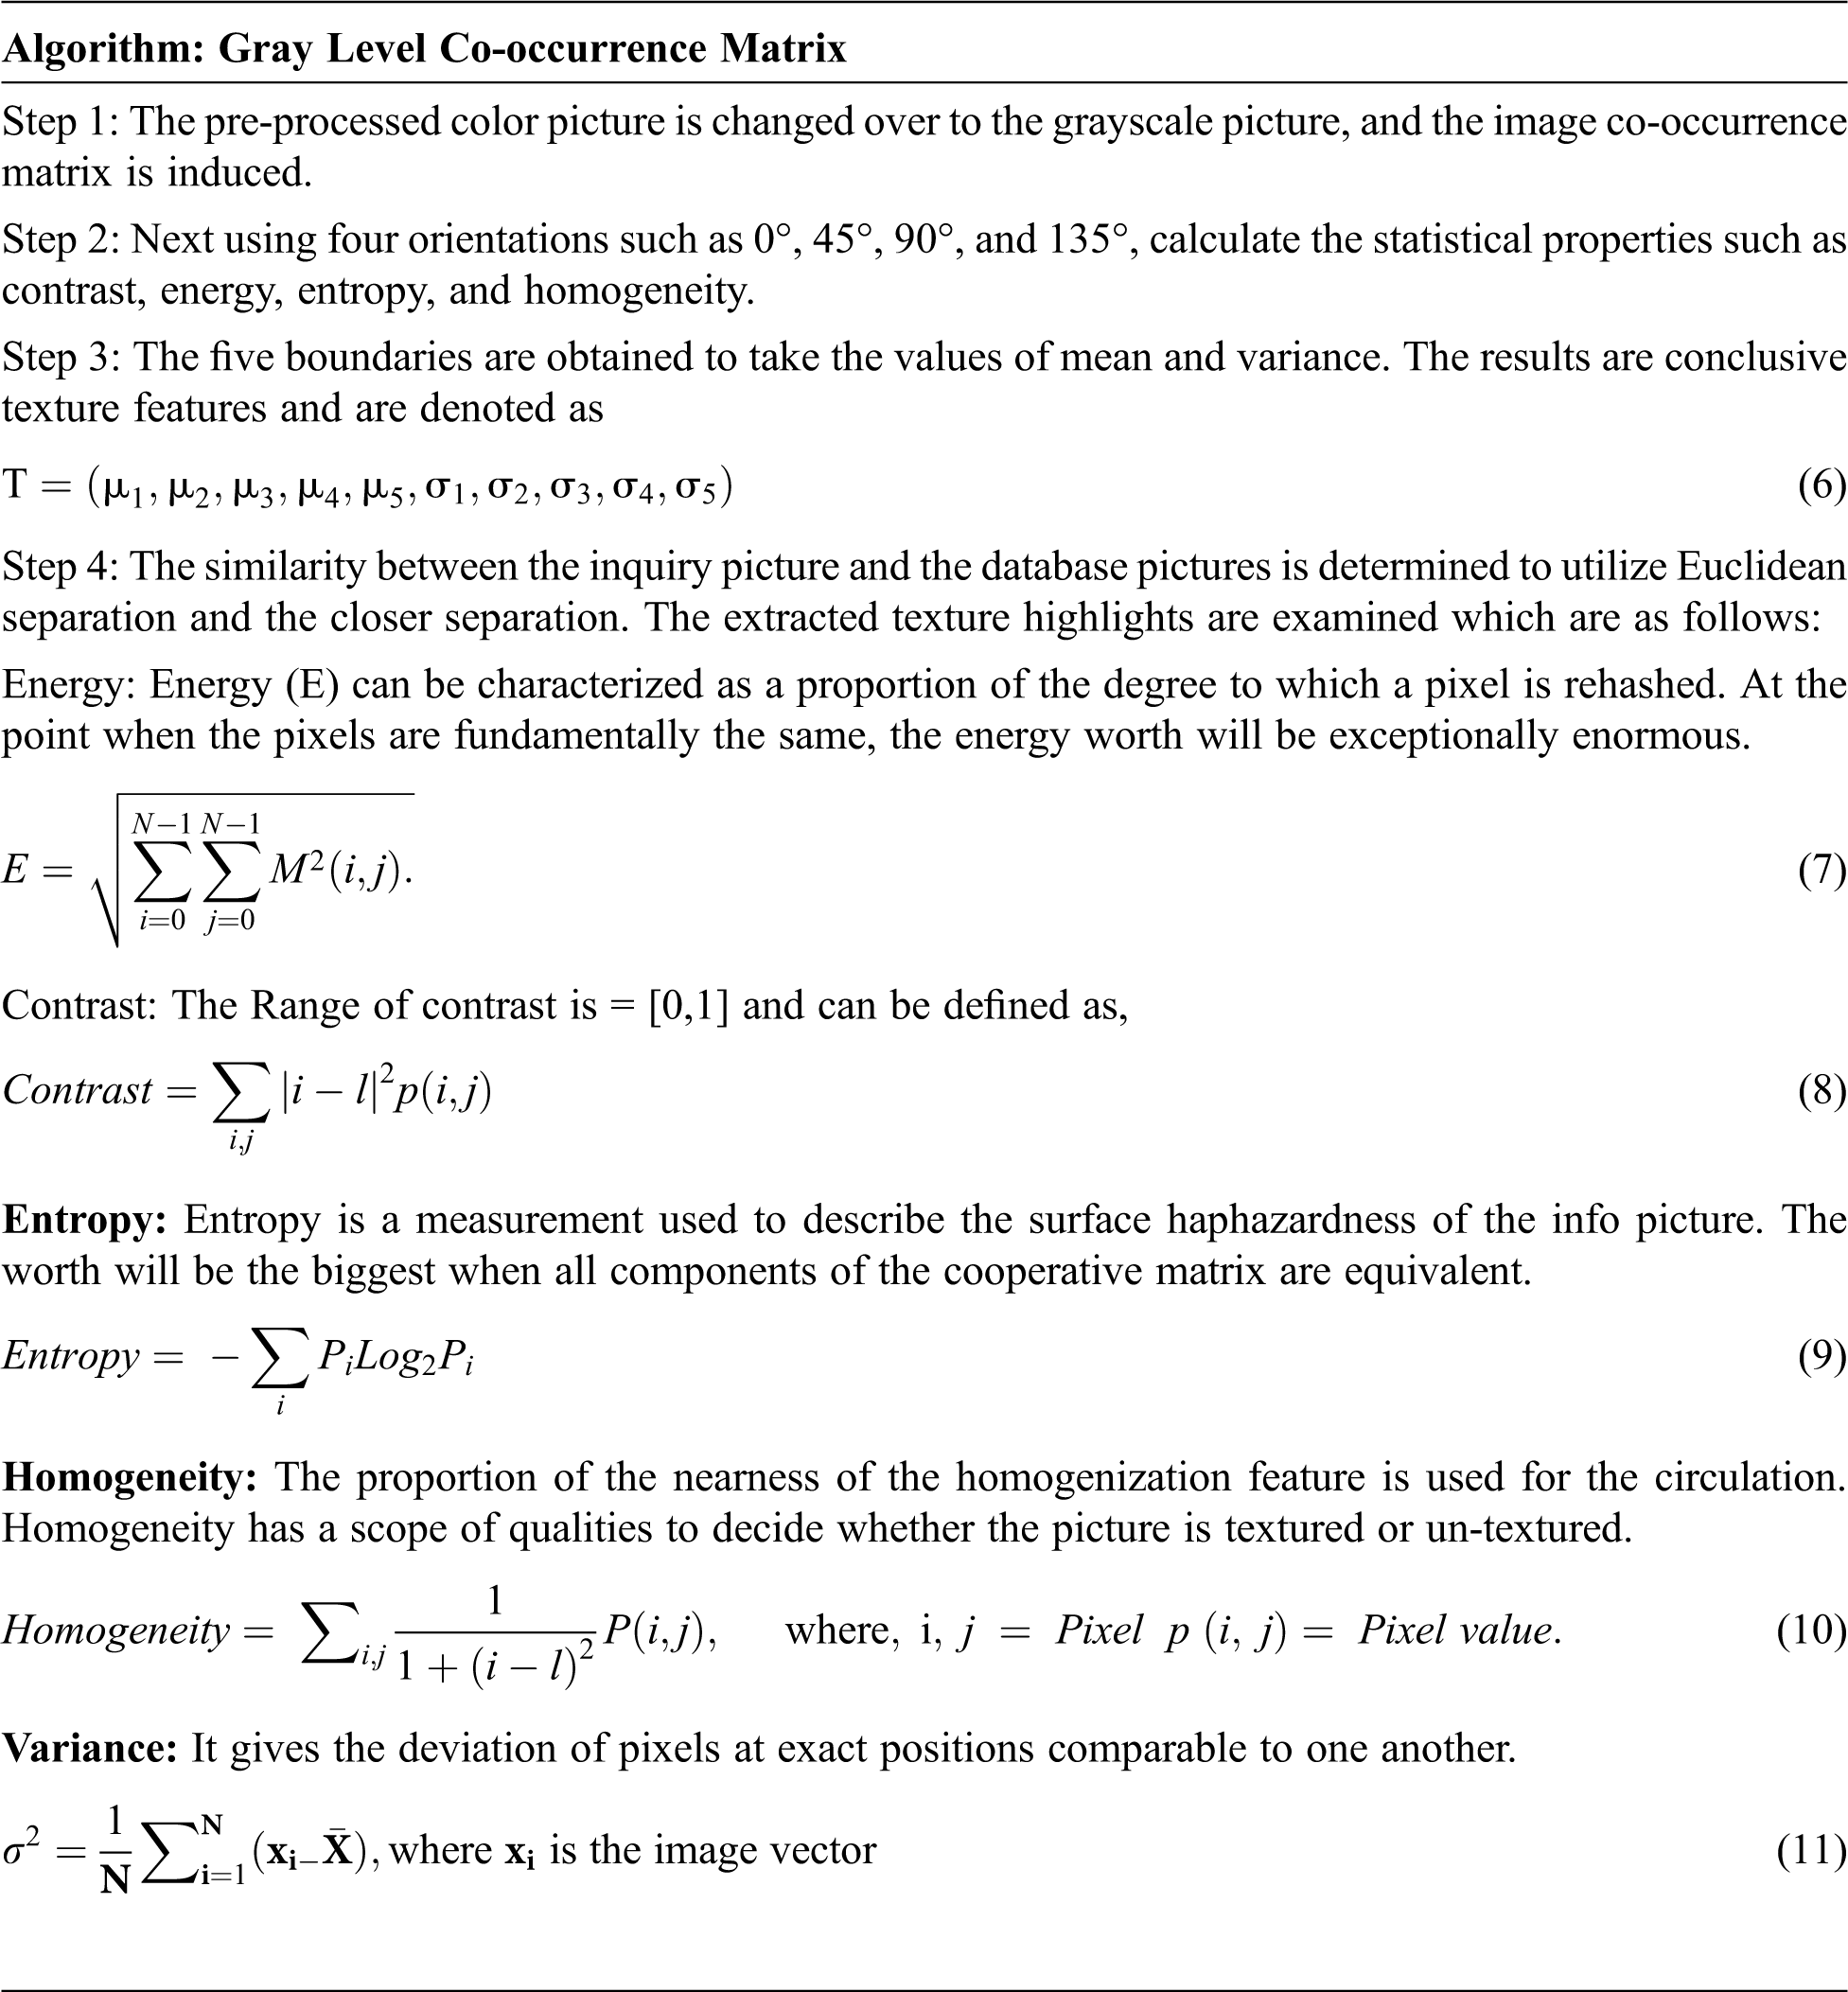
3.3 Gray Level Co-Occurrence Matrix
Feature extraction examination is a fundamental and useful territory of study. It is a visual component indicating an item's natural surface properties and its relation to the general condition. While inspecting natural pictures, texture features are increasingly valuable in recognizing models with a comparative shading. Scenes containing pictures of wood, grass, etc., can be adequately characterized depending on the texture instead of color or shape. In this manner, it might be helpful to extricate texture features for image classification.
In this work, Gray Level Co-event Matrix (GLCM) is utilized for texture feature extraction. Compared with other feature extraction methods, GLCM has a set of features based on second-order statistics. GLCM can reflect the overall average, for the correlation between pairs of pixels in different aspects in terms of homogeneity, uniformity, etc. So GLCM feature extraction method is widely used in medical imagining applications.
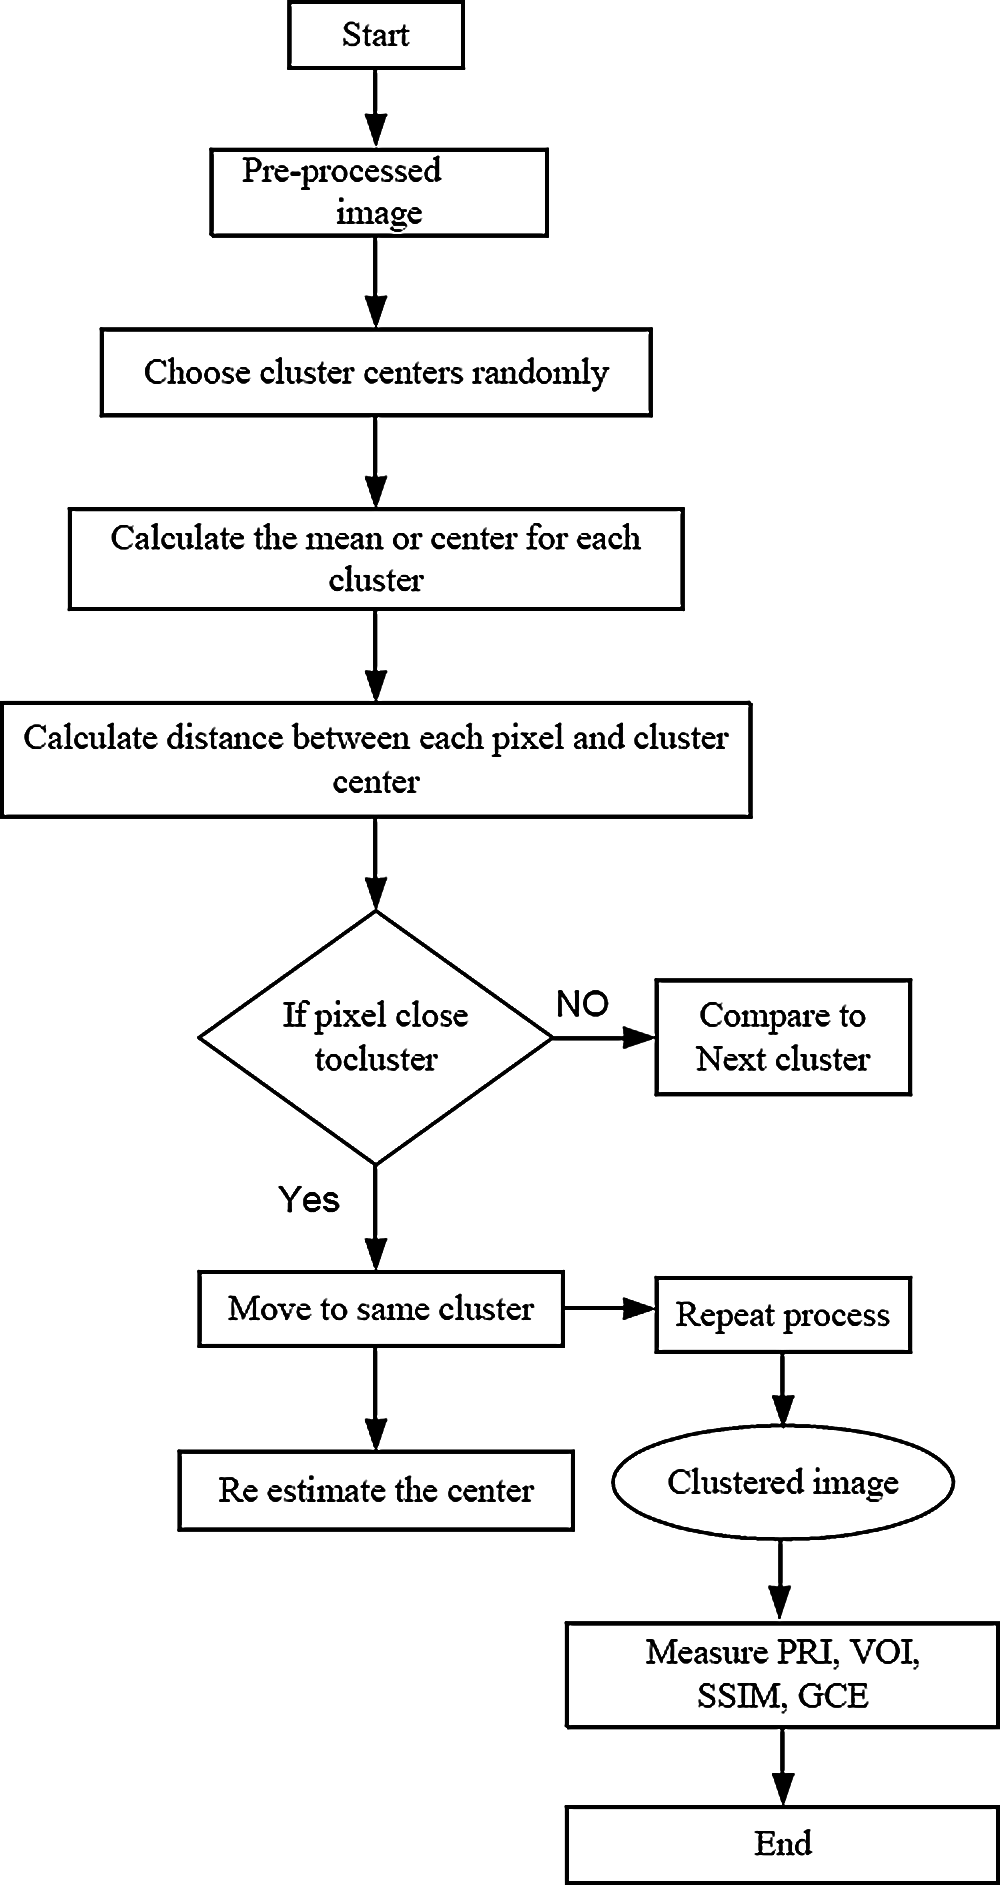
Figure 3: Flow chart of segmentation
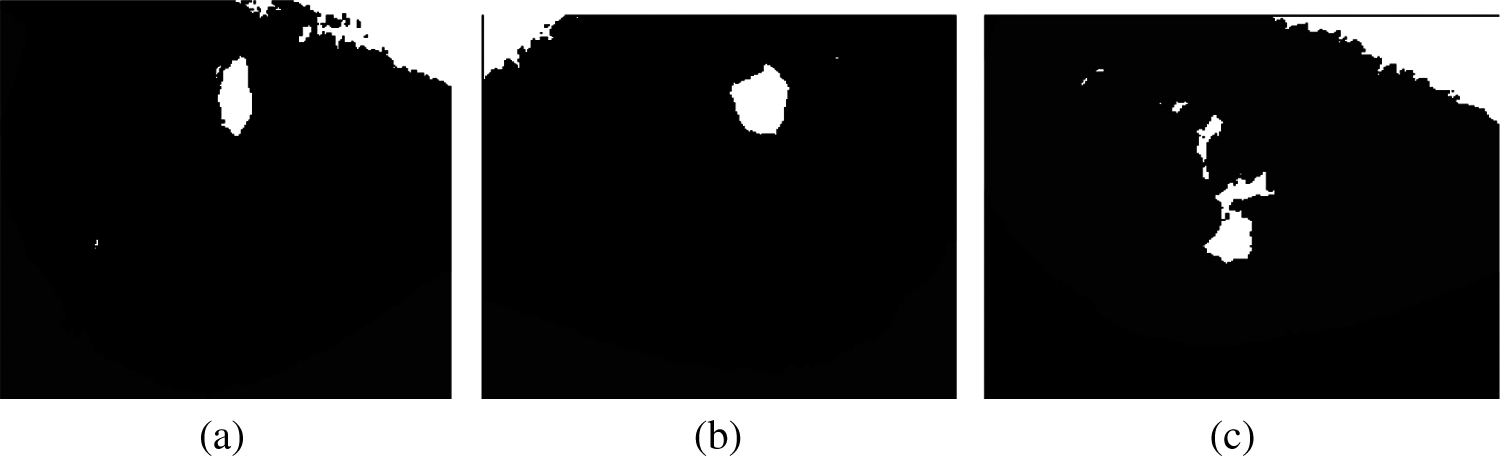
Figure 4: Result of Segmentation a) Segmented_Image1, b) Segmented_image2, c) Segmented_image3
3.4 Multi Decision Intuitionistic Fuzzy Evidential Reasoning
For clinical diagnosis, the fuzzy and Dempster-Shafer theory uses the domain knowledge under probability and uncertainty. Data loss is one of the major concerns in different fuzzy sets and the traditional matching degree method. This research work provides a new body of evidence to reduce information loss.
From the high-order fuzzy package available, intuitionistic fuzzy sets (IFS's) would have been more appropriate in dealing with uncertainty. Let X be the universal set, for IFS A and X is given by the following Eq. (12).
where functions μ A (x), ν A (x) : X →[0,1]. The degree of non-membership degree of the member entity is the x ∈ X with set A, which is a subgroup of X, and each x ∈ X, 0 ≤ μA (x) + νA (x) ≤ 1. Apparently, every fuzzy set has the form
The parameters a1, a2, a3, a4, b1, b2, b3, b4 ∈ R, b1 ≤a1 ≤b2 ≤a2 ≤a3 ≤b3 ≤a4 ≤b4. Intuitionistic fuzzy ITFN is then denoted as A = < (a1, a2, a3, a4), (b1, b2, b3, b4).
In this work, input images' entropy and energy are considered since they reflect the image information content. These input variables
Here
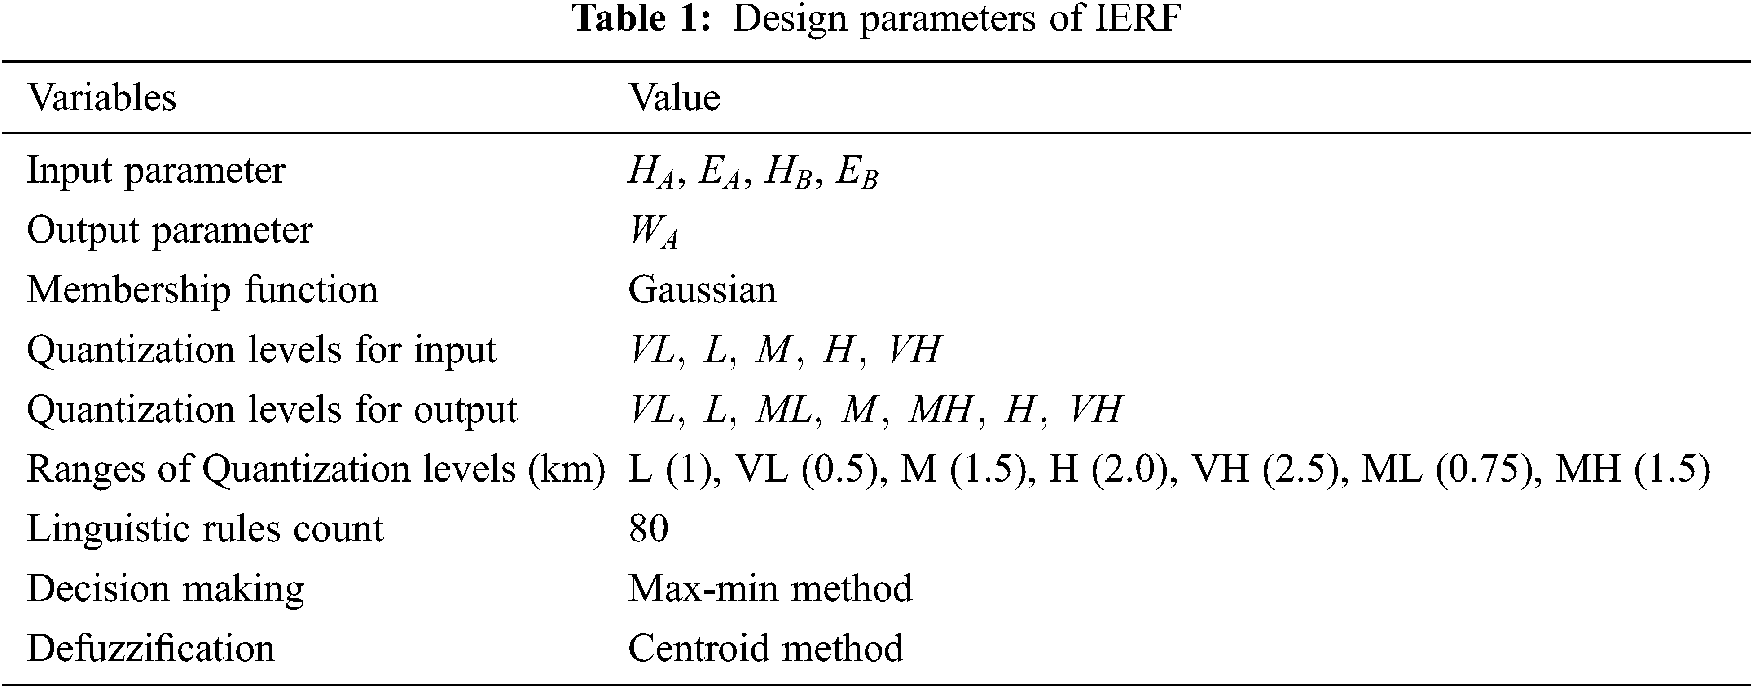
Normally Membership functions can be defined as a technique to solve practical problems by experience rather than knowledge. Different forms of membership function are available, such as Triangular, Trapezoidal, Piecewise linear, Gaussian, and Singleton. This work uses the Gaussian membership function because compared with other membership functions taking parameter values is easier.
For example, one of the linguistic rules used for determining the weight
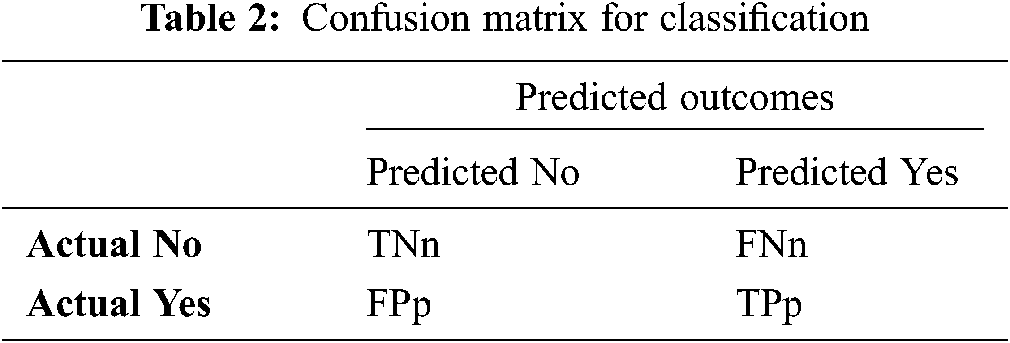
The value of Precision (P), Recall (R), and F-measure (F) are used to validate the performance of the proposed IFER based mammogram classification system. The results of Precision (P), Recall (R), and F-measure (F) are obtained from the confusion matrix. The model of the confusion matrix is shown in following Tab. 2.
The mathematical representation of precision, recall, F-measure, and accuracy is shown in the following Eqs. (18)–(21).
4 Simulation Results and Discussion
This section discusses the simulation results and performance analysis of the proposed Multi Decision Intuitionistic Fuzzy Evidential Reasoning method-based mammogram classification system. This work uses Digital Database to Screen Mammography (DDSM) and Mammographic Image Analysis Society (MIAS) dataset to classify mammogram stages. The following Tab. 3 shows the details of the MIAS and DDSM datasets. Fig. 5 shows the Graphical User Interface model of the proposed Multi Decision Intuitionistic Fuzzy Evidential Reasoning method-based mammogram classification system.
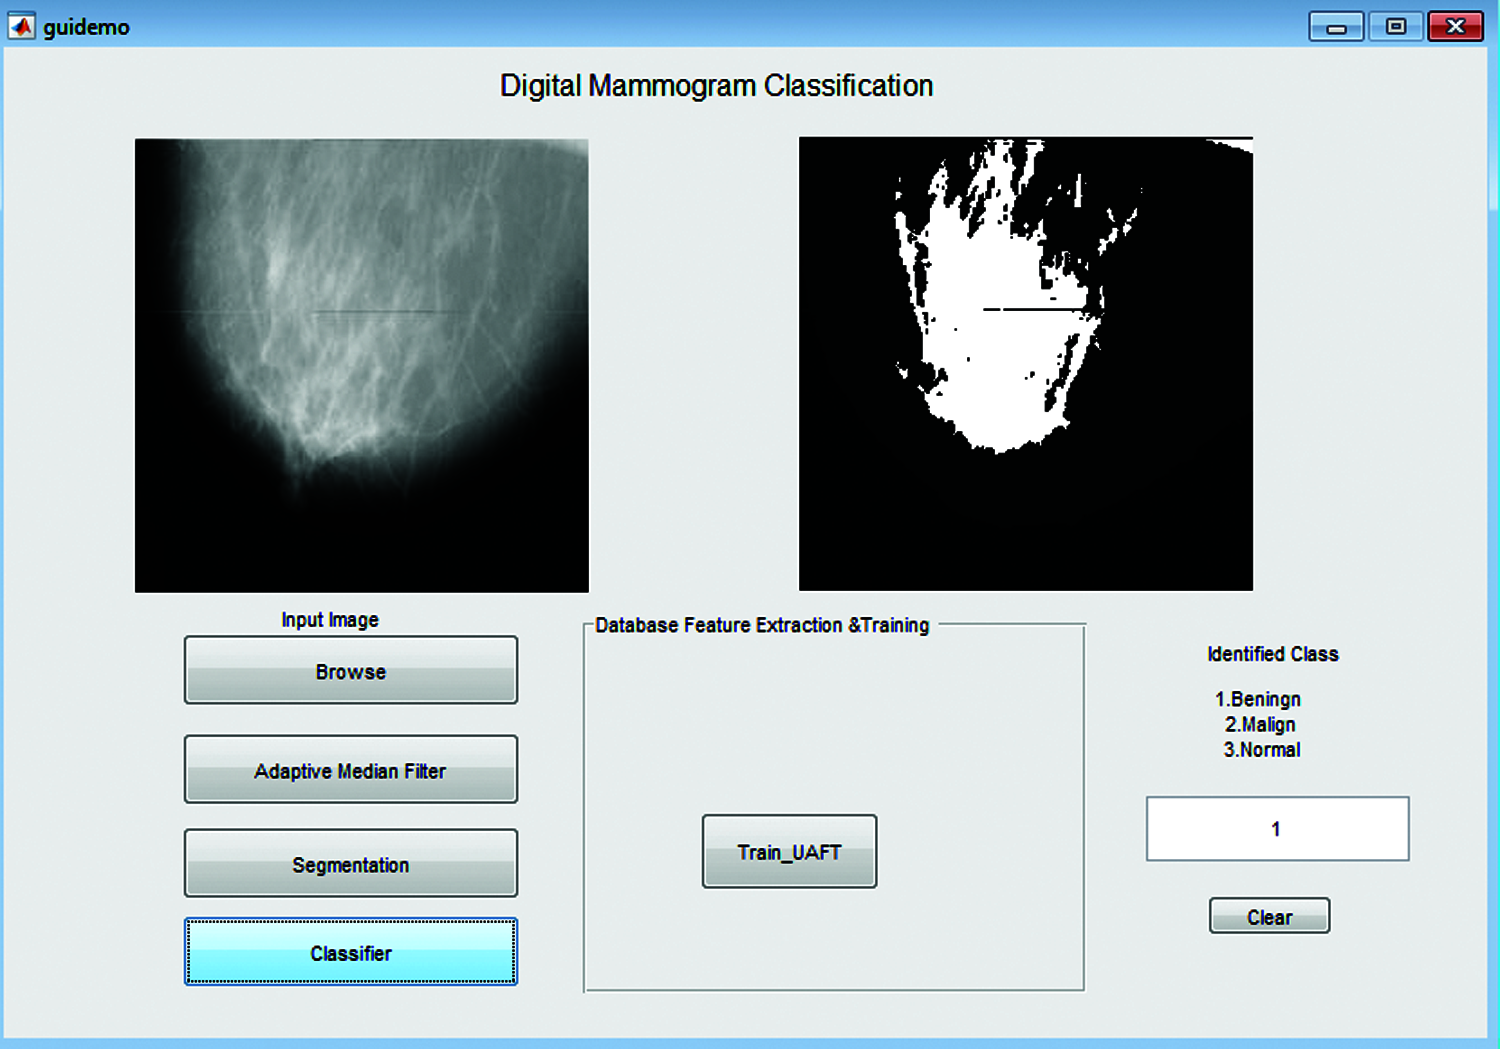
Figure 5: Simulation model
4.1 Performance Analysis of Preprocessing
This section discusses the performance analysis of preprocessing for proposed AVMF with some conventional Gaussian and Mean filters. The overall performance of preprocessing is validated using various parameters, such as Mean Squared Error and Peak Signal to Noise Ratio. The mathematical expression of these parameters is discussed as follows.
Mean Squared Error: The Mean Square Error (MSE) is the error between the filtered image and the original image. The MSE can be calculated in several ways to measure the difference between the values implied by an estimate and the true quality of an image.
where, M = Width of enhanced images (I(i,j)), N = height original image (K(i,j))
i and j = row and column pixels of both the original and enhanced images.
Peak Signal to Noise Ratio: The Peak Signal to Noise Ratio (PSNR) is the ratio between maximum potential power and distorting noise that affects image representation. PSNR is commonly used as a measure of image quality reconstruction. A high PSNR value indicates a high-quality image. It is defined by the mean square error (MSE) and the associated deviation metric.
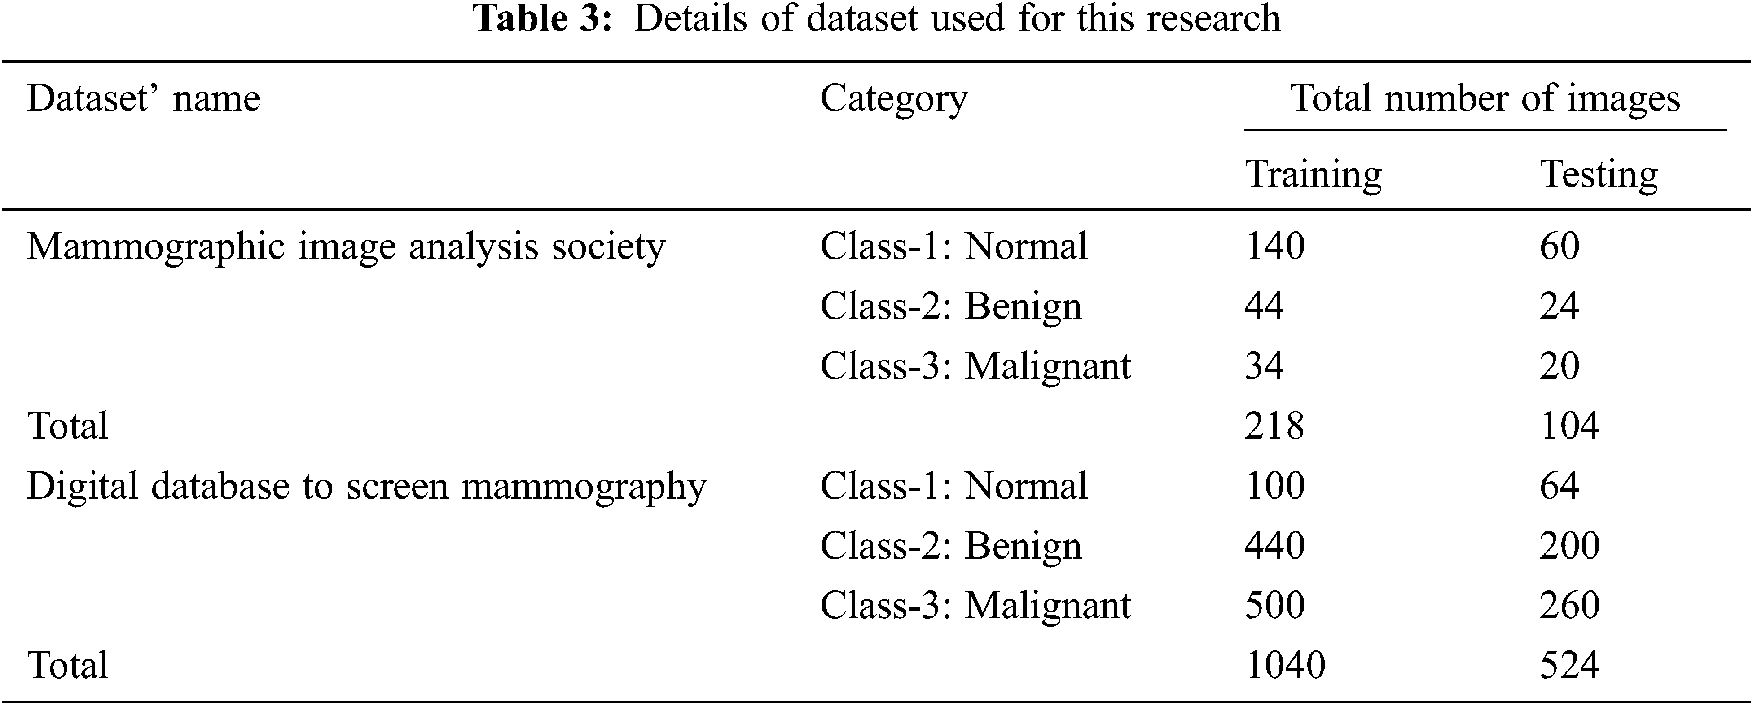
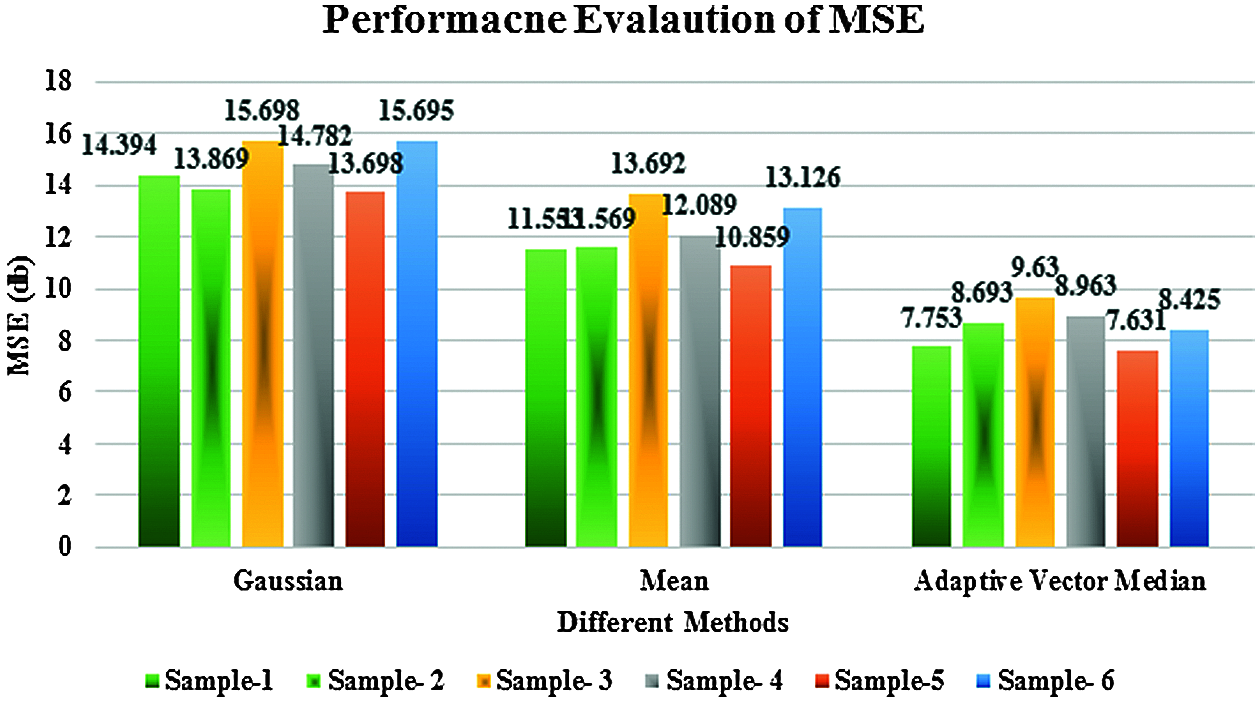
Figure 6: Performance evaluation of MSE
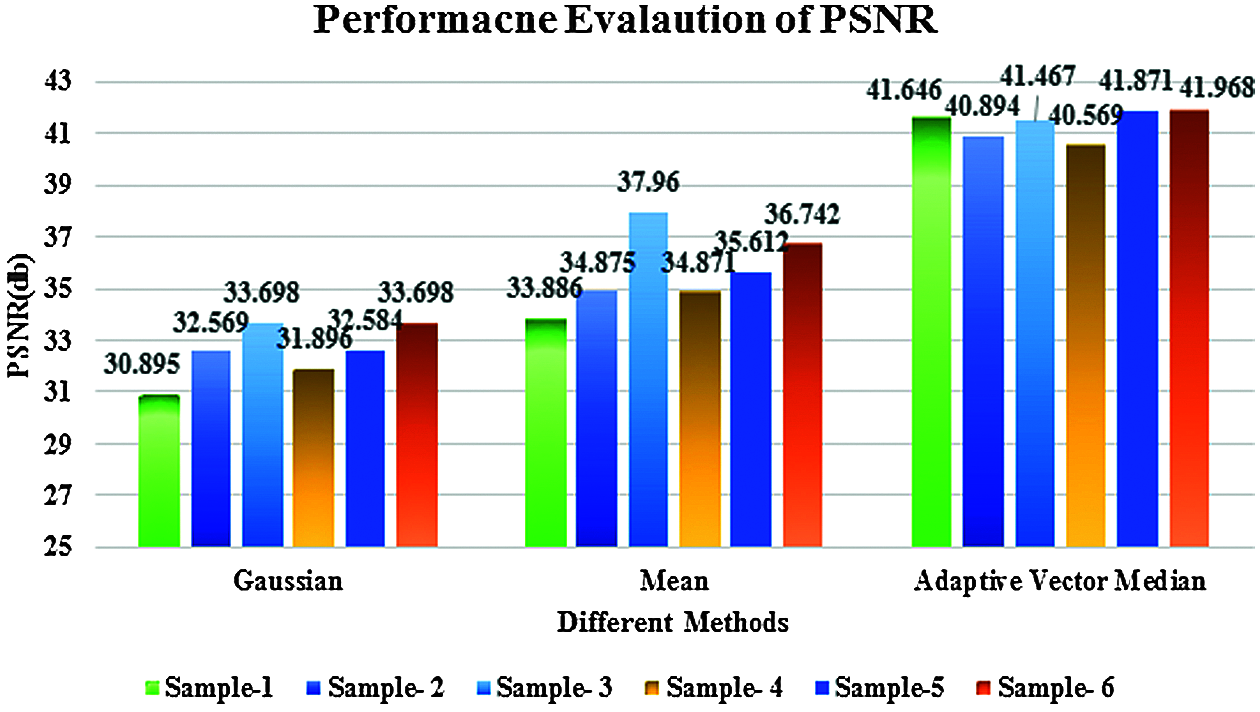
Figure 7: Performance evaluation of PSNR
Figs. 6 and 7 discuss the performance evaluation of the filtering response of MSE and PSNR for the proposed adaptive vector median filter with existing Gaussian and mean filters. This comparison clearly shows the proposed AVMF gives good results because some of the edges and image details are unclear in existing methods, especially at transitions between image regions.
4.2 Performance Analysis of Segmentation
This section discusses the performance analysis of the segmentation error ratio of the proposed multiscale invariant clustering segmentation method with existing K-means and Fuzzy c-means clustering methods. This work uses Global Consistency Error and DICE coefficient parameters to validate the performance of segmentation. The mathematical representation of Global Consistency Error and DICE coefficient are discussed as follows.
Global Consistency Error: The Global Consistency Error (GCE) measures the extent to which one partition can be considered as a refinement of another. It is by the following equation.
GCE measure takes both S1 and S2 as inputs and produces a real-valued output in the range [0: 1] where zero forms are not an error. For a given pixel, pi assumes the segments in S1 and S2 that contain that pixel.
DICE coefficient parameters: The Dice coefficient (DICE) is also known as the overlap index. The DICE metrics are mostly used to validate the volume of medical image segmentation. The mathematical representation of the Dice coefficient is shown in the following equation.
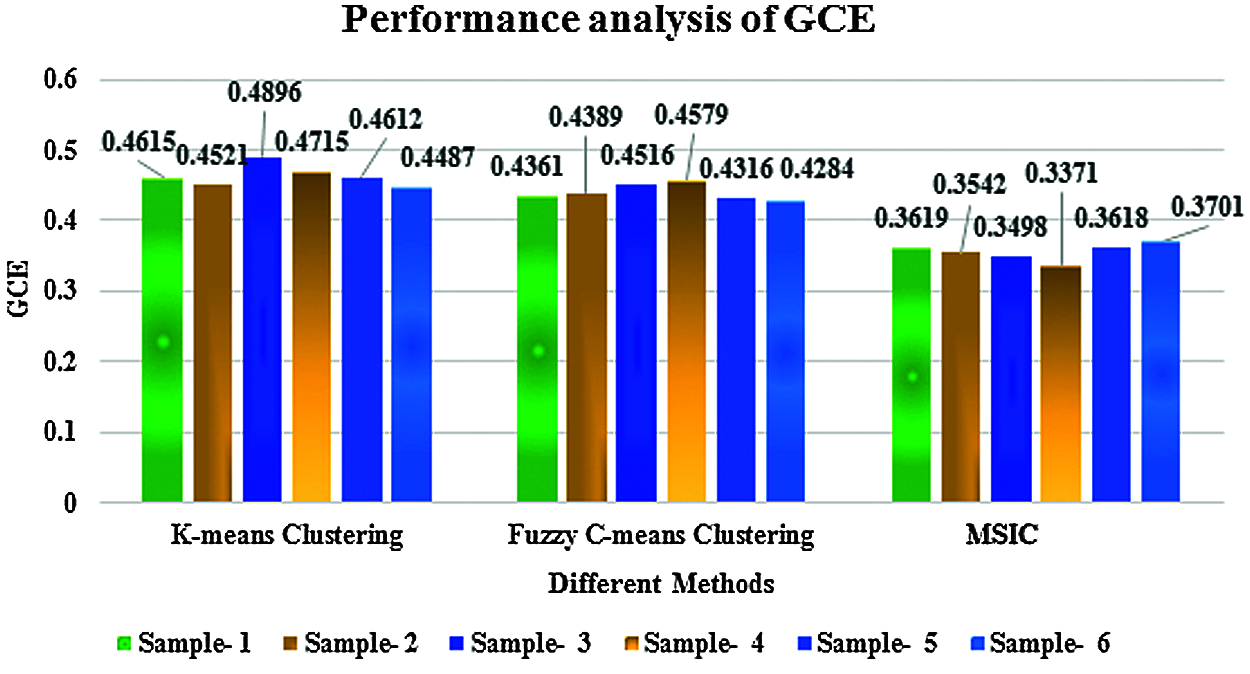
Figure 8: Performance analysis of global consistency error
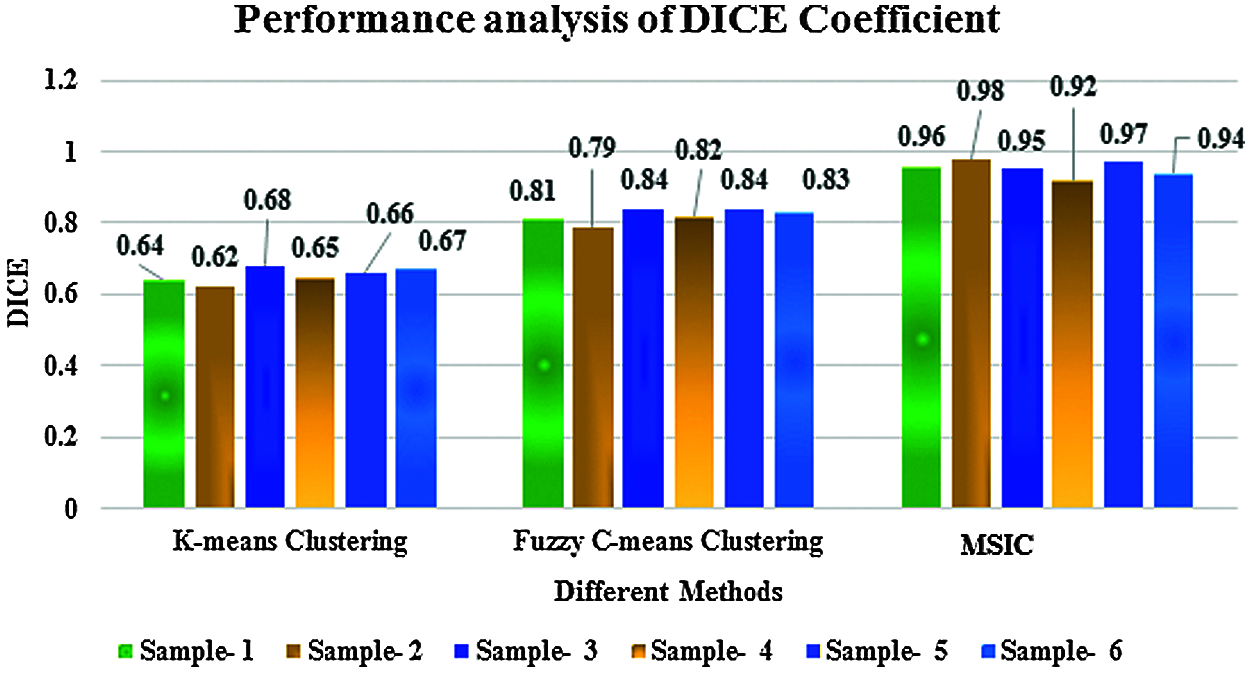
Figure 9: Performance analysis of DICE coefficient
Figs. 8 and 9 show the performance analysis of segmentation. This comparison clearly shows the proposed multiscale invariant clustering segmentation method obtains a good segmentation ratio compared with K-means and fuzzy c-means clustering methods because the multi scale-invariant clustering segmentation algorithm generates super-pixels by clustering pixels based on their color similarity and proximity in the image plane.
4.3 Performance Analysis of Classification
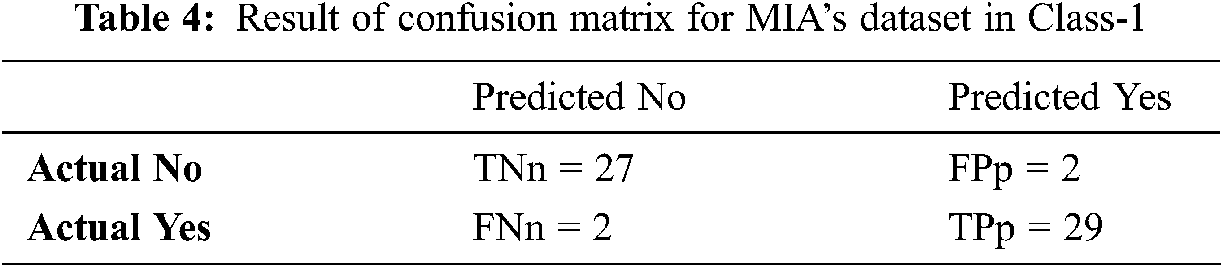
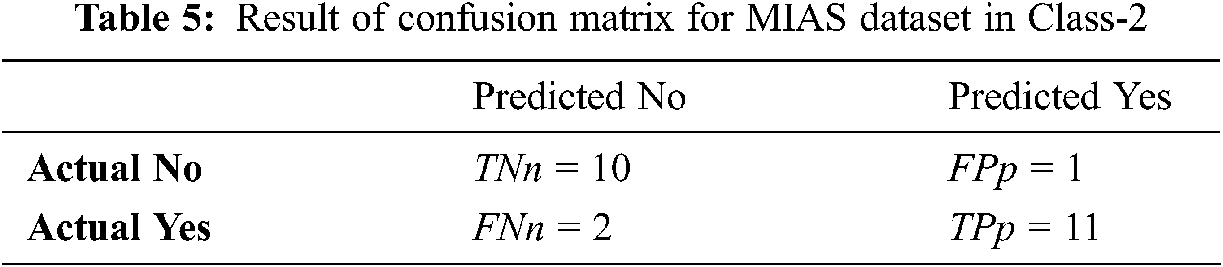
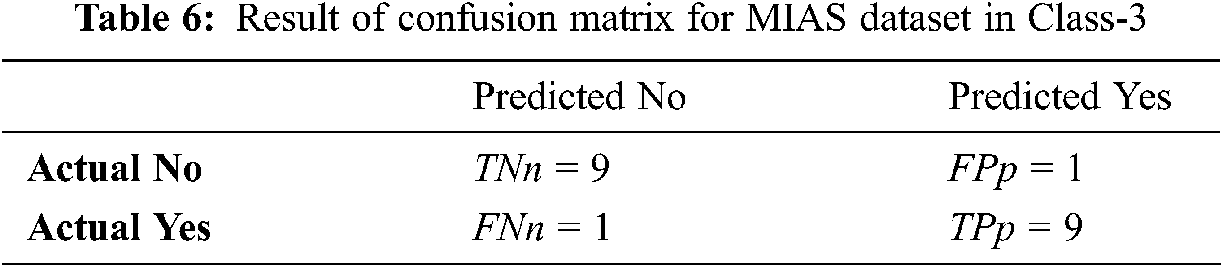
Tabs. 4–6 discuss the three stages of confusion matrix results proposed IFER based mammogram classification system using the MIAS dataset.
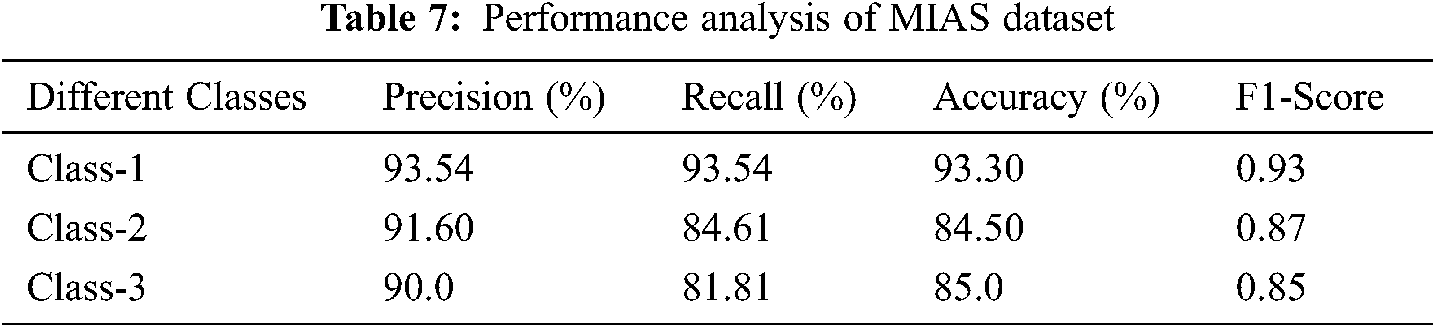
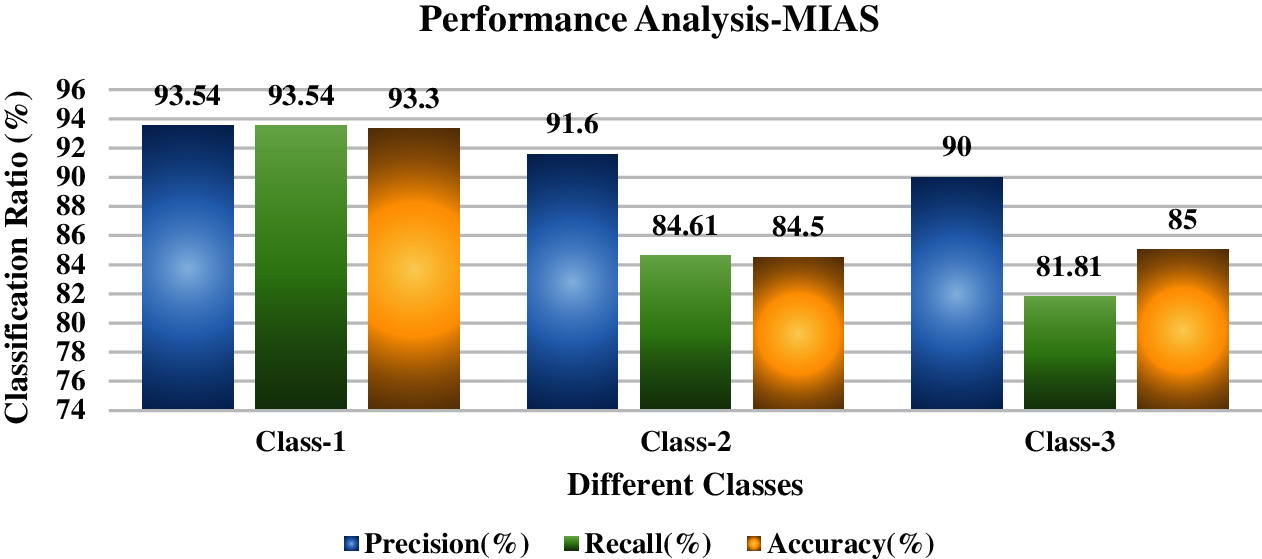
Figure 10: Performance analysis of MIAS dataset
Tab. 7 and Fig. 10 discuss the performance analysis of the proposed IFER based mammogram classification system using the MIAS dataset with different classes. The accuracy of class1, class2, and class3 of the proposed system is 93.30%, 84.5%, and 85.0%.
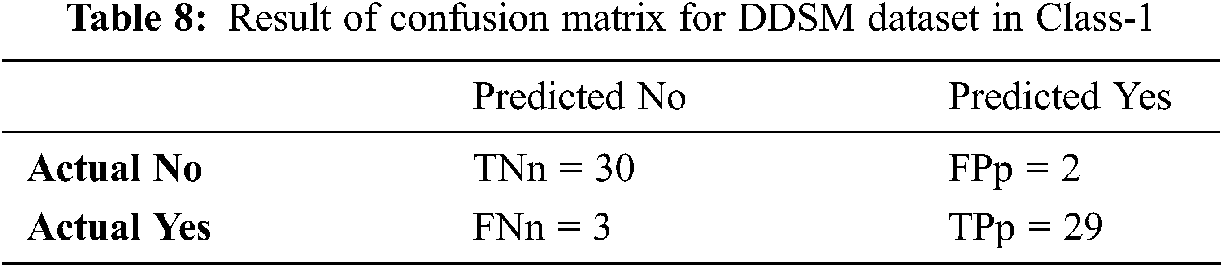
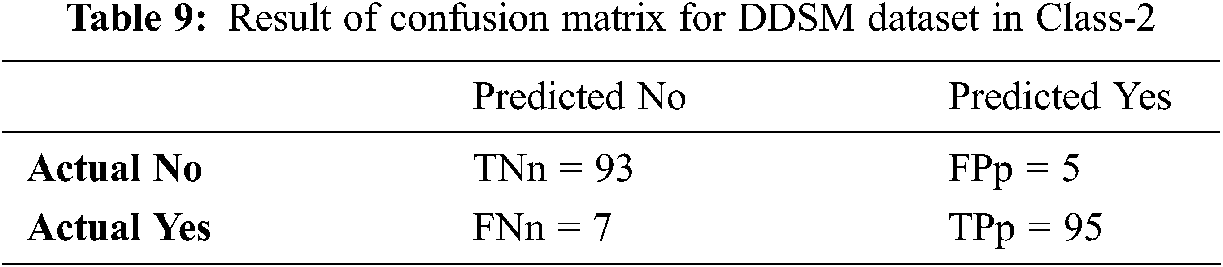
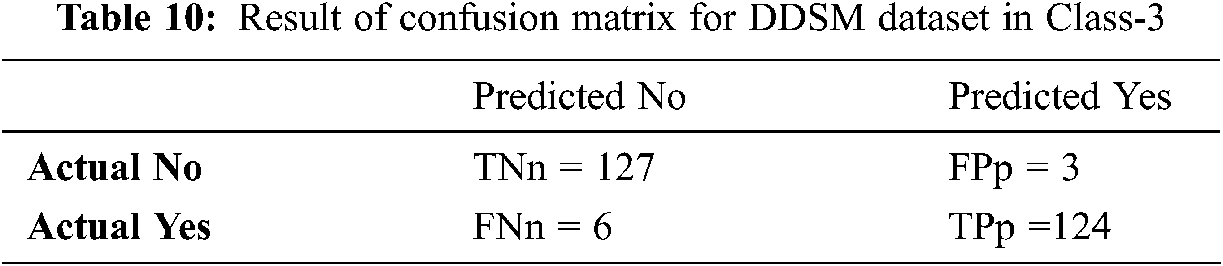
Tabs. 8–10 discuss the simulation results of the confusion matrix for the proposed IFER based mammogram classification system using the DDSM dataset.
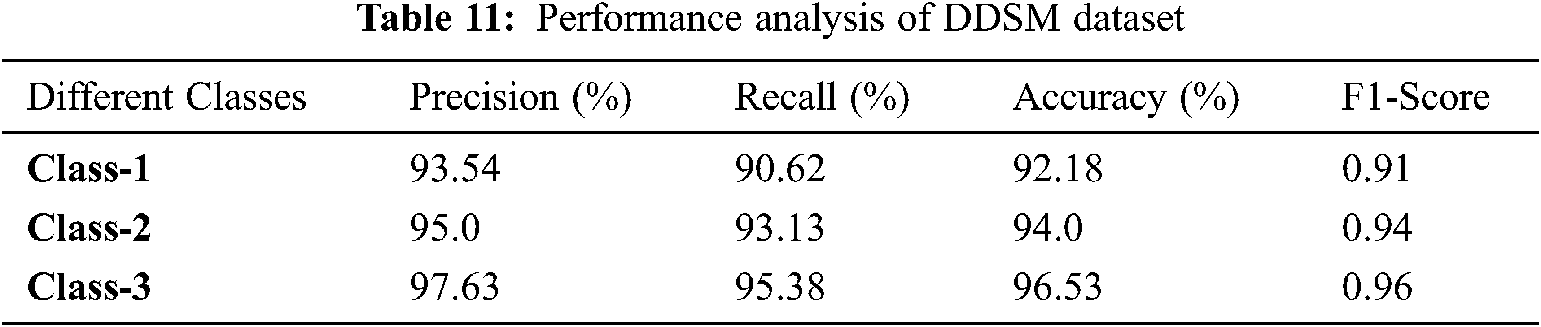
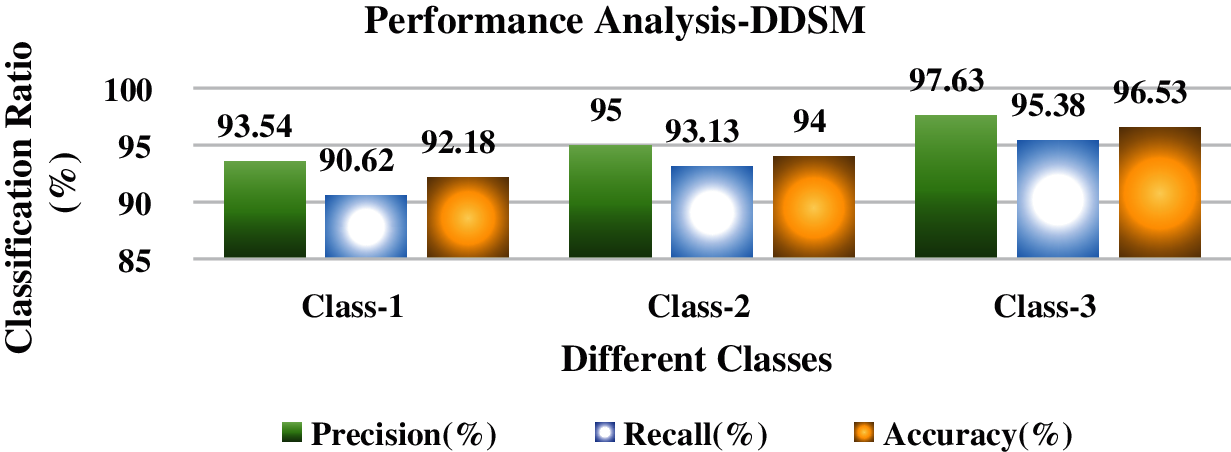
Figure 11: Performance analysis of DDSM dataset
Tab. 11 and Fig. 11 discuss the proposed IFER based mammogram classification system's performance analysis using the DDSM dataset with different classes. The accuracy of class1, class2, and class3 of the proposed system is 92.18%, 94.0%, and 96.53%.
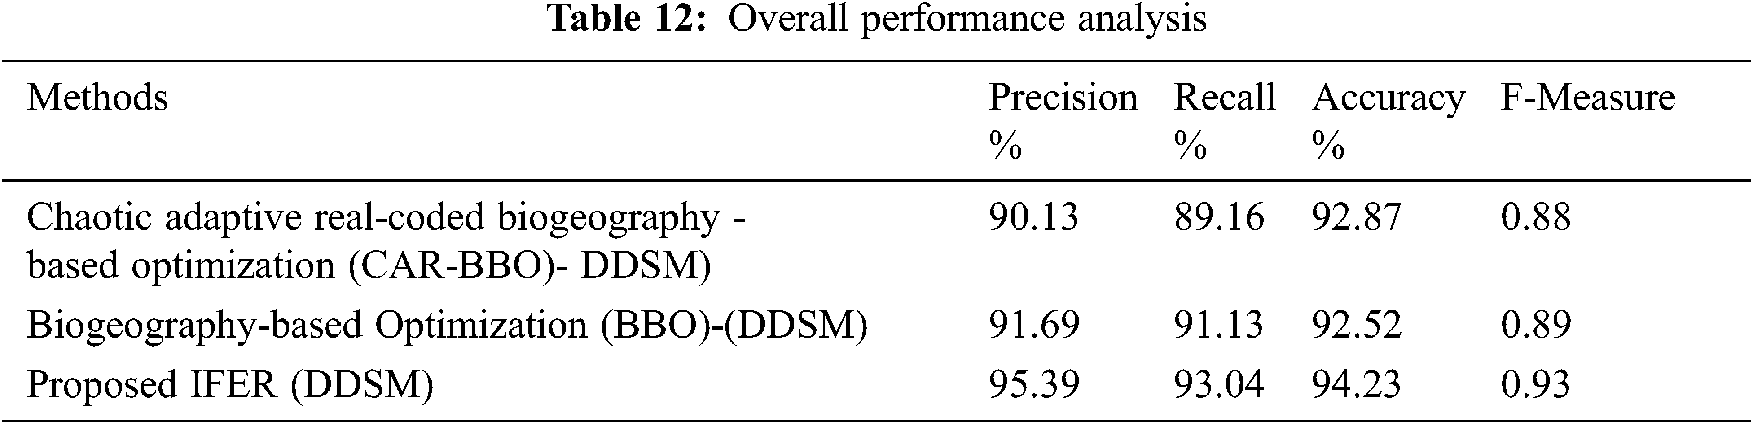
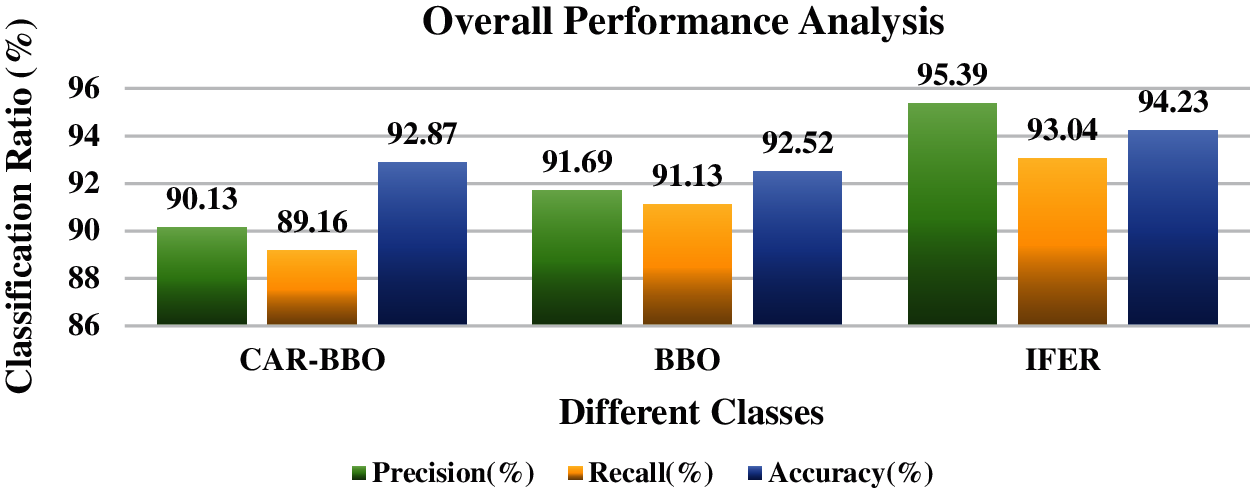
Figure 12: Overall performance analysis
Tab. 12 and Fig. 12 discuss the mammogram classification system’s overall performance analysis using the proposed IFER method with existing CAR-BBO and BBO methods. This comparison clearly shows the proposed IFER gives a good result. The precision, recall, accuracy, and F1-score of the proposed IFER are 95.39%, 93.04%, 94.23%, and 0.93.
One of the most common infections among women is breast cancer. Further exploration of early detection techniques of cancer is necessary. A Multi Decision Intuitionistic Fuzzy Evidential reasoning is developed for this research work to classify the mammogram. This work shows that IFER achieves competitive results for both static and dynamic protocols. The proposed suggestions can be easily extended to more data to obtain similar or more accurate results. This work is an effort to develop methods that can distinguish only breast images if the breast's changes are benign or malignant. As compared with existing CAR-BBO and BBO methods, the proposed IFER gives a good result. The precision, recall, accuracy, and F1-score of the proposed IFER are 95.39%, 93.04%, 94.23%, and 0.93. Fine-tuning the threshold levels will improve the performance of recall, accuracy, and F1-score. In the future, we will introduce deep learning methods to improve the overall accuracy of the proposed system.
Funding Statement: The authors received no specific funding for this study.
Conflicts of Interest: The authors declare that they have no conflicts of interest to report regarding the present study.
1. G. Murtaza, L. Shuaib and A. Wahab, “Deep learning-based breast cancer classification through medical imaging modalities: State of the art and research challenges,” Artificial Intelligence Review, vol. 53, no. 3, pp. 1655–1720, 2020. [Google Scholar]
2. R. S. Patil and N. Baradari, “Automated mammogram breast cancer detection using the optimized combination of convolutional and recurrent neural network,” Evolutionary Intelligence, 2020. https://doi.org/10.1007/s12065-020-00403-x. [Google Scholar]
3. M. H. Hesamian, W. Jia, X. He and P. Kennedy, “Deep learning techniques for medical image segmentation: Achievements and challenges,” Journal of Digital Imaging, vol. 32, no. 4, pp. 582–596, 2019. [Google Scholar]
4. W. Alakwaa, M. Nassef and A. Badr, “Lung cancer detection and classification with 3D convolutional neural network (3D-CNN),” International Journal of Advanced Computer Science and Applications, vol. 8, no. 8,pp. 409–417. 2017. [Google Scholar]
5. R. Anirudh, J. J. Thiagarajan, T. Bremer and H. Kim, “Lung nodule detection using 3D convolutional neural networks trained on weakly labeled data,” Medical Imaging, Computer-Aided Diagnosis, vol. 9785, pp. 978532, 2016. [Google Scholar]
6. J. Cai, L. Lu, Y. Xie, F. Xing and L. Yang, “Improving deep Pancreas segmentation in CT and MRI images via recurrent neural contextual learning and direct loss function,” in Proc. of the Medical Image Computing and Computer Assisted Interventions, 20th International Conference, Quebec City, QC, Canada, 2017. [Google Scholar]
7. H. Chen, Q. Dou, L. Yu, J. Qin and P. A. Heng, “VoxResNet: Deep voxelwise residual networks for volumetric brain segmentation from 3D MR images,” Neuroimage, vol. 170, pp. 446–455, 2018. [Google Scholar]
8. H. Chen, D. Ni, J. Qin, S. Li, X. Yang et al., “Standard plane localization in fetal ultrasound via domain transferred deep neural networks,” IEEE Journal of Biomedical and Health Informatics, vol. 19, no. 5, pp. 1627–1636, 2015. [Google Scholar]
9. H. Chen, X. Qi, J. Z. Cheng and P. A. Heng, “Deep contextual networks for neuronal structure segmentation,” in Proc. of the Thirtieth AAAI Conf. on Artificial Intelligence, Phoenix, Arizona USA, pp. 1167–1173, 2016. [Google Scholar]
10. Y. Gordienko, P. Gang, J. Hui, W. Zeng, Y. Kochura et al., “Deep learning with lung segmentation and bone shadow exclusion techniques for chest X-ray analysis of lung cancer,” Advances in Intelligent Systems and Computing, vol. 754, pp. 638–647, 2018. [Google Scholar]
11. S. Hamidian, B. Sahiner, N. Petrick and A. Pezeshk, “3D convolutional neural network for automatic detection of lung nodules in chest CT,” SPIE Proceedings, vol. 10134, pp. 1013409, 2017. [Google Scholar]
12. K. He, X. Zhang, S. Ren and J. Sun, “Deep residual learning for image recognition,” in Proc. of the IEEE Conf. on Computer Vision and Pattern Recognition, Las Vegas, NV, USA, pp. 770–778, 2016. [Google Scholar]
13. K. He, X. Zhang, S. Ren and J. Sun, “Identity mappings in deep residual networks,” in European Conf. on Computer Vision Springer, Amsterdam, The Netherlands, pp. 630–645, 2016. [Google Scholar]
14. S. Hoo-Chang, H. R. Roth, M. Gao, L. Lu, Z. Xu et al., “Deep convolutional neural networks for computer-aided detection: CNN architectures, dataset characteristics and transfer learning,” IEEE Transaction in Medical Imaging, vol. 35, no. 5, pp. 1285–1298, 2016. [Google Scholar]
15. P. Hu, F. Wu, J. Peng, Y. Bao, F. Chen et al., “Automatic abdominal multi-organ segmentation using deep convolutional neural network and time-implicit level sets,” International Journal of Computer Assisted Radiology and Surgery, vol. 12, no. 3, pp. 399–411, 2017. [Google Scholar]
16. F. Li and M. Liu, “A hybrid convolutional and recurrent neural network for hippocampus analysis in Alzheimer's disease,” Journal of Neuroscience Methods, vol. 323, pp. 108–118, 2019. [Google Scholar]
17. A. Askarzadeh, “A novel metaheuristic method for solving constrained engineering optimization problems: Crow search algorithm,” Computers & Structures, vol. 169, no. 2, pp. 1–12, 2016. [Google Scholar]
18. R. S. Patil and N. Baradari, “Improved region growing segmentation for breast cancer detection: Progression of optimized fuzzy classifier,” International Journal of Intelligent Computing and Cybernetics; Bingley, vol. 13, no. 2, pp. 181–205, 2020. [Google Scholar]
19. F. Fernández-Navarro, M. Carbonero-Ruz, D. B. Alonso and M. T. Jiménez, “Global sensitivity estimates for neural network classifiers,” IEEE Transaction on Neural Networks and Learning Systems, vol. 28, no. 11, pp. 2592–2604, 2017. [Google Scholar]
20. Y. Shuang, K. K. Tan, B. L. Sng, S. Li and A. T. H. Sia, “Lumbar ultrasound image feature extraction and classification with Support Vector Machine,” Ultrasound in Medicine and Biology, vol. 41, no. 10, pp. 2677–2689, 2015. [Google Scholar]
21. M. J. Sousa, A. Moutinho and M. Almeida, “Classification of potential fire outbreaks: A fuzzy modeling approach based on thermal images,” Expert Systems with Applications, vol. 129, no. 8, pp. 216–232, 2019. [Google Scholar]
22. I. Namatevs, “Deep convolutional neural networks: Structure feature extraction, and training,” Information Technology and Management Science, vol. 20, pp. 40–47, 2017. [Google Scholar]
23. D. Selvathi and A. Poornila, “A deep learning techniques for breast cancer detection using medical image analysis,” in Biologically Rationalized Computing Techniques for Image Processing Applications. Lecture Notes in Computational Vision and Biomechanics, J. Hemanth, V. Balas (eds.vol. 25, pp. 159–186, 2018. [Google Scholar]
24. J. Shan, S. K. Alam, B. Garra, Y. Zhang and T. Ahmed, “Computer-aided diagnosis for breast ultrasound using computerized BI-RADS features and machine learning methods,” Ultrasound in Medicine and Biology, vol. 42, no. 4, pp. 980–988, 2016. [Google Scholar]
25. D. Shen, G. Wu and H. I. Suk, “Deep learning in medical image analysis,” Annual Review of Biomedical Engineering, vol. 19, no. 1, pp. 221–248, 2017. [Google Scholar]
26. M. F. Siddiqui, G. Mujtaba, A. W. Reza and L. Shuib, “Multi-class disease classification in Brain MRIs using a computer-aided diagnostic system,” Symmetry, vol. 9, no. 37, pp. 37, 2017. [Google Scholar]
27. D. Hernandez-Contreras, H. Peregrina-Barreto, J. Rangel-Magdaleno, J. A. Gonzalez-Bernal and L. Altamirano-Robles, “A quantitative index for classification of plantar thermal changes in the diabetic foot,” Infrared Physics and Technology, vol. 81, pp. 242–249, 2017. [Google Scholar]
28. D. A. Hernandez-Contreras, H. Peregrina-Barreto, J. D. J. Rangel-Magdaleno and F. Orihuela-Espina, “Statistical approximation of plantar temperature distribution on diabetic subjects based on beta mixture model,” IEEE Access, vol. 7, pp. 28383–28391, 2019. [Google Scholar]
29. T. Senthil Kumar, A. Suresh, K. K. Pai and C. Priyanka, “Survey on predictive medical data analysis,” Journal of Engineering Research & Technology, vol. 3, pp. 2283–2286, 2014. [Google Scholar]
 | This work is licensed under a Creative Commons Attribution 4.0 International License, which permits unrestricted use, distribution, and reproduction in any medium, provided the original work is properly cited. |