DOI:10.32604/csse.2022.021563
| Computer Systems Science & Engineering DOI:10.32604/csse.2022.021563 | |
| Article |
Prediction of Covid-19 Based on Chest X-Ray Images Using Deep Learning with CNN
1Department of Electrical and Computer Engineering, North South University, Bashundhara, Dhaka, 1229, Bangladesh
2Department of Computer Science, College of Computers and Information Technology, Taif University, P. O. Box 11099, Taif 21944, Saudi Arabia
*Corresponding Author: Mohammad Monirujjaman Khan. Email: monirujjaman.khan@northsouth.edu
Received: 07 July 2021; Accepted: 17 August 2021
Abstract: The COVID-19 pandemic has caused trouble in people’s daily lives and ruined several economies around the world, killing millions of people thus far. It is essential to screen the affected patients in a timely and cost-effective manner in order to fight this disease. This paper presents the prediction of COVID-19 with Chest X-Ray images, and the implementation of an image processing system operated using deep learning and neural networks. In this paper, a Deep Learning, Machine Learning, and Convolutional Neural Network-based approach for predicting Covid-19 positive and normal patients using Chest X-Ray pictures is proposed. In this study, machine learning tools such as TensorFlow were used for building and training neural nets. Scikit-learn was used for machine learning from end to end. Various deep learning features are used, such as Conv2D, Dense Net, Dropout, Maxpooling2D for creating the model. The proposed approach had a classification accuracy of 96.43 percent and a validation accuracy of 98.33 percent after training and testing the X-Ray pictures. Finally, a web application has been developed for general users, which will detect chest x-ray images either as covid or normal. A GUI application for the Covid prediction framework was run. A chest X-ray image can be browsed and fed into the program by medical personnel or the general public.
Keywords: Covid-19 prediction; covid-19; coronavirus; normal; deep learning; convolutional neural network; image processing; chest x-ray
In recent times, Coronavirus disease has become the biggest health hazard worldwide. Each country is going up against furious events as far as ensuring the wellbeing of its inhabitants because of the boundless thought of the disease and the detachment of medicine or immunization for it. The COVID-19 pandemic has achieved excellent examinations the world over. The effect on exploring ahead of time at the hour of the boundless, the criticality and difficulties of ongoing far and wide ask about, and this epic far-reaching fully emphasizes the importance of a pediatrician-researcher labor force. As it examines and goes through and beyond this far-reaching issue, which has the prospect of having a long-term impact on our reality, research, and the biomedical inquiry initiative, it is vital to recognize and address openings and procedures, as well as difficulties in analyzing and sustaining the pediatrician-researcher labor force [1]. In the first-place instances of what is by and by perceived as SARS-CoV-2, the defilement, named COVID-19, were point by point in Wuhan, China in December 2019 as instances of deadly pneumonia. Then Italy, then the United States, and Russia. After that, it was the U.S., Brazil, and India. Because the locations of the coronavirus epidemic are spreading and growing, the economic prices are also rising. Bangladesh had a mortality toll of 21,397 people, a total incidence of 1,296,093, and a total amount of recoveries of 1,125,045. In just 24 h, the infection rate was 28.54 percent. On Tuesday, August 4th, as the pandemic continues to inflict damage on Bangladesh, health officials reported another 235 Covid-19 deaths and 15,776 new cases. On Thursday, August 5th, the total number of COVID-19 infections worldwide surpassed 200 million, as per Worldometers [2–4].
The impact on the investigations into the case of COVID-19 was immediate, emotional, and, without a doubt, long-lasting. Most scholarly, business, and government fundamental research and clinical investigations have been decreased, or investigations have already been diverted to COVID-19. The majority of ongoing clinical trials, including those researching life-saving cures, have been postponed, and the majority of those that are still open to modern recruitment have closed. Continuous clinical trials have been altered to allow domestic organizations to give care and virtual monitoring, reduce the risk of COVID-19 contamination, and avoid the diversion of healthcare resources from a widespread reaction [5,6].
In a medical environment, learning the resulting outcome takes about 6–7 days, and it is also expensive for the general population. Due to these limitations, radiography checks can be used as a stand-in for diagnosing the disease. Chest radiography images can be evaluated to determine the presence of the novel coronavirus or its side effects. Infections are found in this family, according to studies, and show up as crucial symptoms in radiographic images. Furthermore, Polymerase Chain Reaction (PCR) test results are not always accurate. Furthermore, chest X-rays are more tolerant than other radiological examinations, such as Computed Temography (C.T) scans, and are available in almost every clinic. The difficulties of locating Covid-19 patients using chest x-rays (CXR) have been demonstrated, with prepared specialists not always being available, especially in the higher ranges [7]. Furthermore, the radiological indications associated with Covid-19 are novel and unexplored, with many specialists who have no experience with Covid-19 reporting positive, persistent CXRs. It has also been contrasted with a couple of existing benchmark works by different experts [8,9].
The COVID-19 pandemic has resulted in a global emotional loss of human lives and is a magnificent test of our entire condition. Public mindfulness and “dos and don’ts” programs for COVID-19 are being implemented in public areas. Environmental factors may also aid the coronavirus. However, the loss and recovery rates show that the pandemic is not being well handled. They couldn’t even get the results on time in most cases. As a result, the patient’s condition declines or dies.
Many corona detection systems like CXR and C.T. images use Transfer Learning and Haralick features, using the internet of things and sending alerts, COVID-19 Deep Learning Prediction Model Using Publicly Available Radiologist. Also, in a medical way, like Molecular point-of-care test, Polymerase chain reaction (qrt-PCR) etc. Due to a shortage of diagnostic kits and the incorrect prediction of RT-PCR in Algeria, public and private hospitals employed CT scans as an alternate diagnostic method to detect COVID-19 in patients [10]. CXR images, on the other hand, are better than any other in the field of Covid-19, according to [10,11], because they are made possible by the availability of CXR equipment and its maintenance. None of the studies have attempted to combine the models in order to duplicate their identification ability. They are all in the medical field. Deep learning-based techniques have been developed to recognize pneumonia, several classes of chest infections, skin cancer, drain categorization, and other therapeutic images in a number of studies. With reasonably basic engineering, a handful of these works have achieved encouraging outcomes [12]. With the help of C.T. check images, a convolutional neural (CNN) demonstration was used to differentiate Covid-19 patients in a study. A few more studies using C.T. scans to detect Covid-19 infection in human lungs with low accuracy [13]. The authors in [4,14–16] investigated the performance of many deep learning formulas like VGG16, CNN-AD, Densenet, Resnet50, Custom CNN etc. to diagnose Covid-CXR and Normal-CXR images and their accuracy was in between (85% to 98.9%), which is quite good.
The study’s main goal is to estimate the most accurate result, to save time and money when it comes to Coronavirus tests. It shows a fully programmed framework for differentiating coronavirus-infected lungs from chest CT scan images and other lung disorders. For the frontend, a Graphical User Interface (GUI) system was used instead of Flask and Django. The novelty of this paper is that we used (CNN, Inception and DenseNet) 3 types of models for comparison. The accuracy obtained from the CNN model is 98.3 percent. Also, the GUI software tool will detect the covid patients’ results within a sec using the given x-ray images. In this way, it can be claimed that classification using radiographic images, such as a chest X-ray (CXR), can be precise while also being significantly faster and less expensive than a PCR test.
Section one provides an introduction. In section two, methods and methodology are described. In section three, mathematical equations and expressions are presented. The results are provided in section four. A performance comparison is shown in section five. Finally, section six discusses the conclusion.
The proposed system aims to predict Covid-19 from chest X-ray images using Deep Learning and Convolutional Neural Networks. The available dataset [17,18] was collected from Kaggle and GitHub, which is about normal, pneumonia, and covid chest x-ray images. To begin, the dataset had 6432 samples and metadata.csv front images data which was adjusted using pictures of almost 196 operations on the tests of two classes. At that point, the chest X-ray 60 pictures were resized to make them uniform in terms of their determination. This section contains the methods and materials that are adapted to implement the system’s goal. The first subsection discusses the classification part and dataset creation techniques of the system; the next section contains the outlines of the system. Afterward, it will highlight the design and experiments of the system.
As a result, the article recommends a simple and effective Convolutional Neural Network (CNN) and Deep Learning-based technique for classifying Covid-19 positive and negative cases using CXR images. This method can saturate a very small, specific area of Covid-19 positive patients in a matter of seconds. We supplied an apparatus that can be designed to recognize Covid-19 positive patients as part of this study. To be sure, in the absence of a radiologist or if the topic specialists’ opinions conflict, this deep learning-based device will continue to offer interpretation without requiring human participation. We used data from free sources to demonstrate the applicability of the proposed gadget in terms of arrangement exactness and affected ability in this paper. Fig. 1 shows the process of the system.
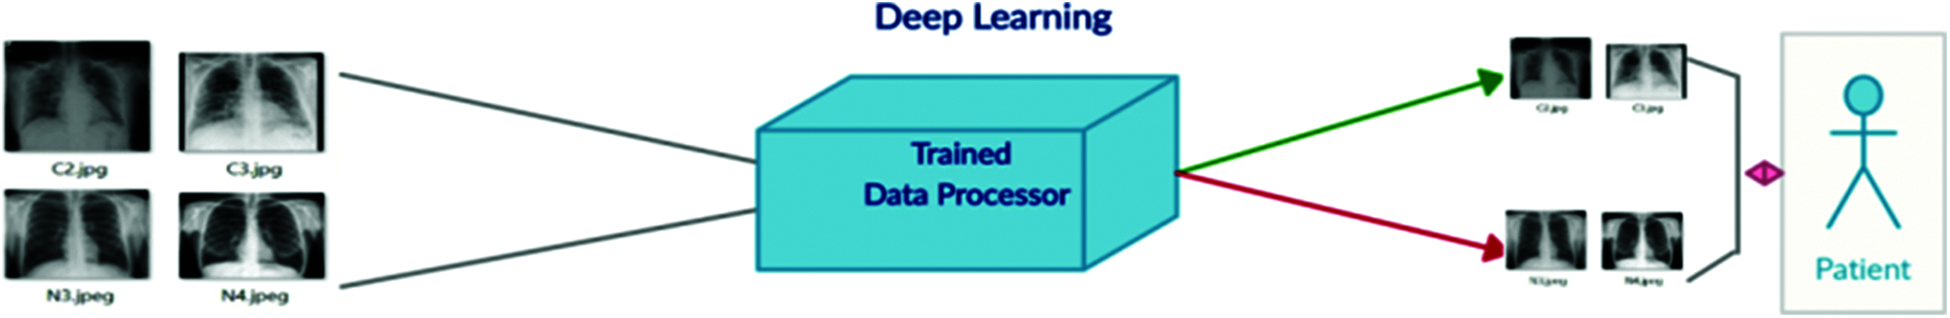
Figure 1: Showing the process
Fig. 2 depicts a block diagram of the entire system.
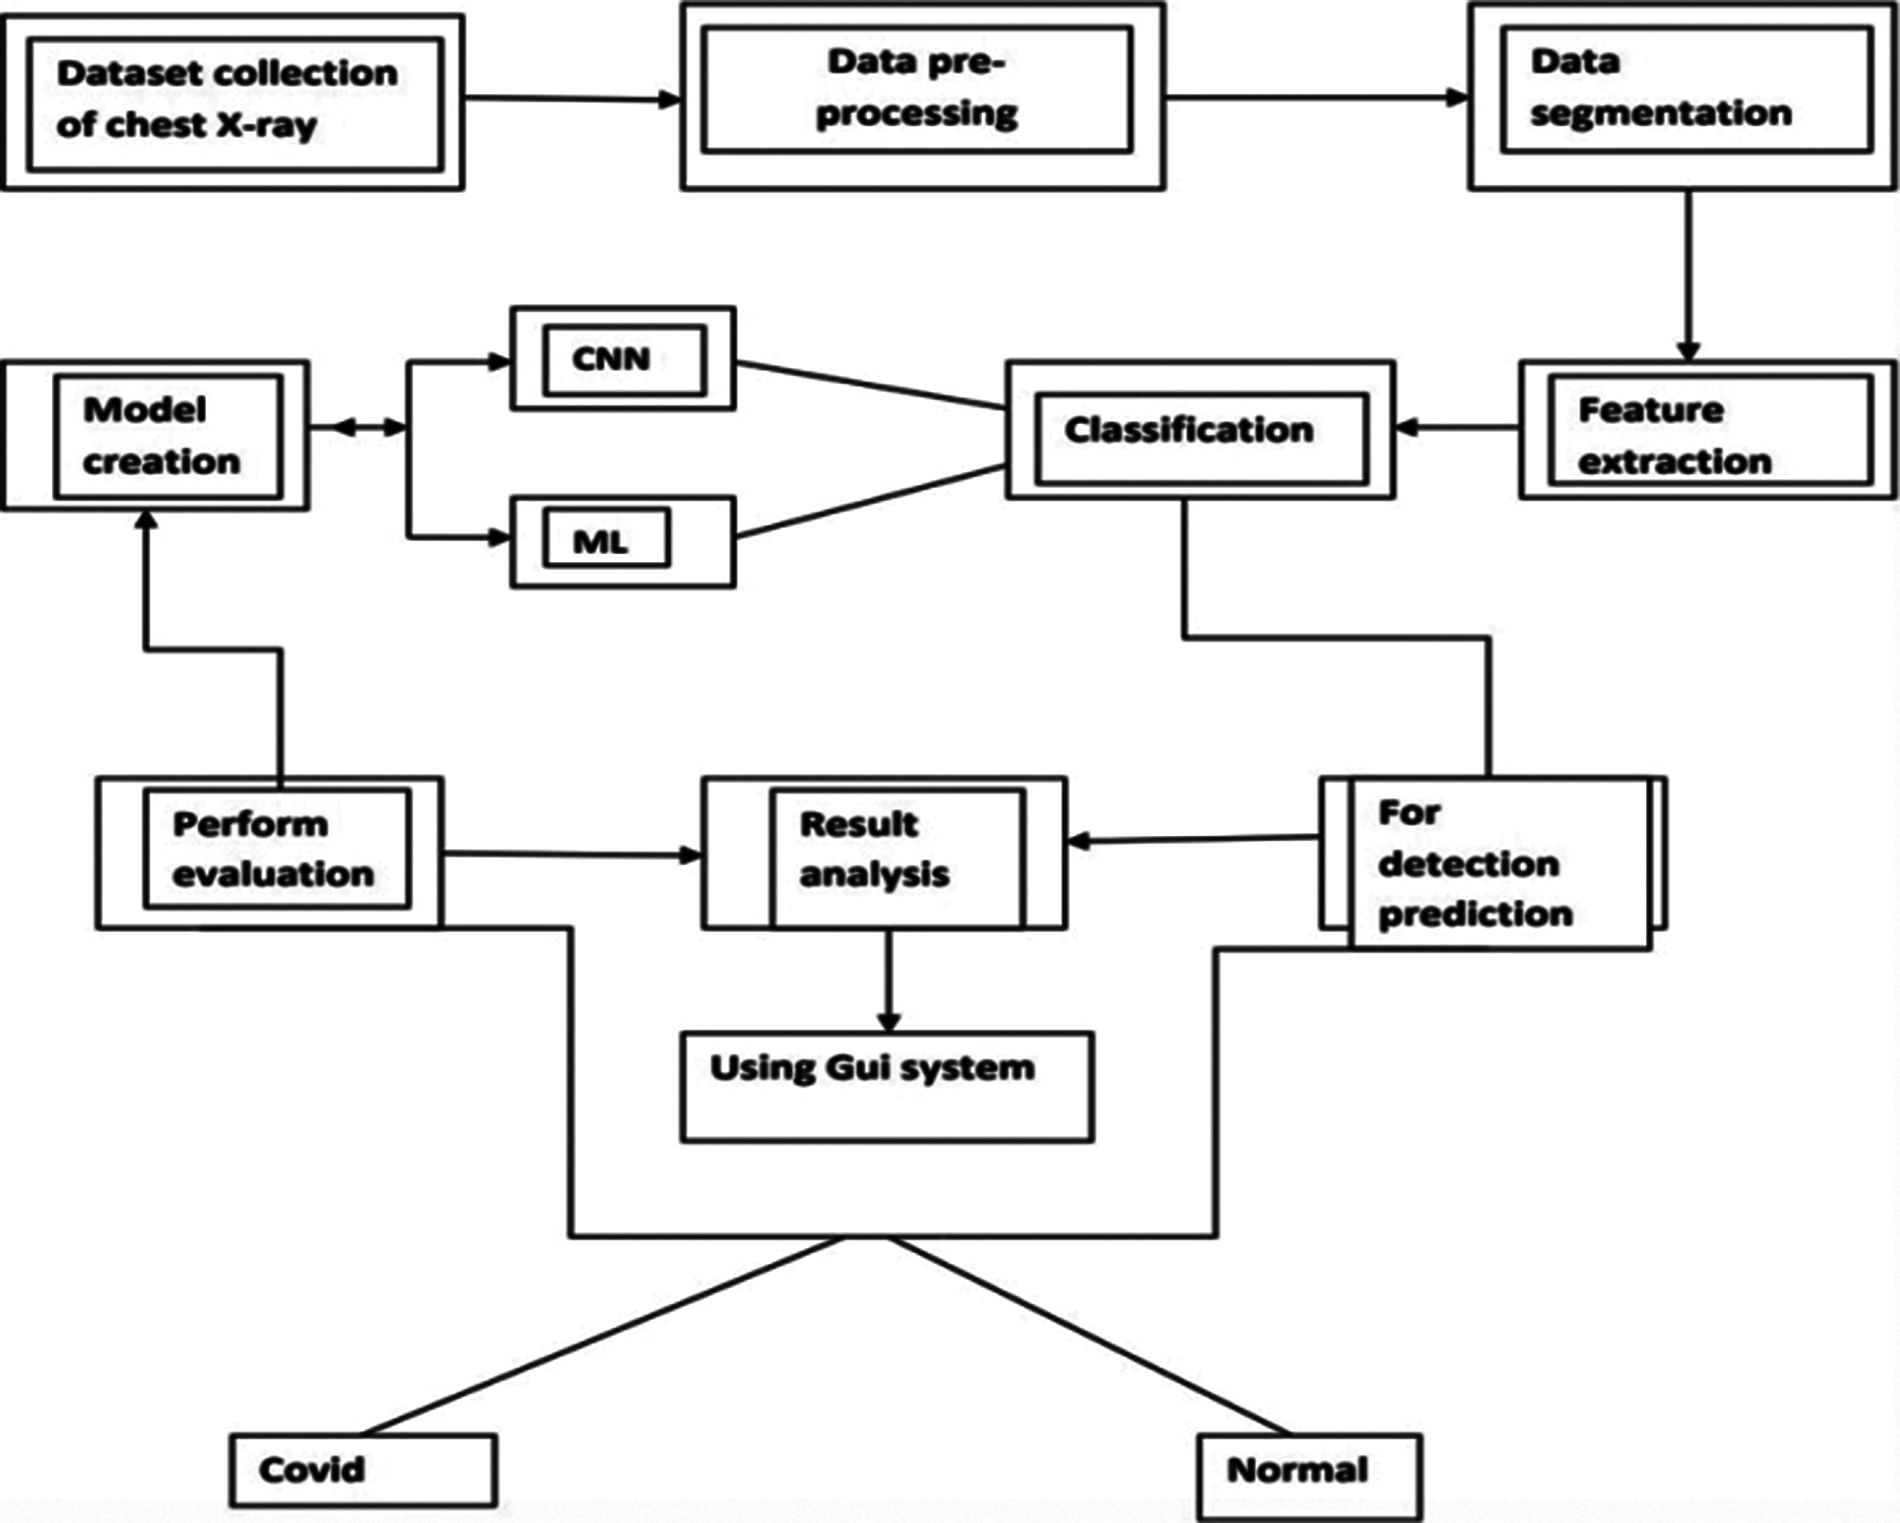
Figure 2: Block flow diagram of the system
The system is made up of a dataset that includes normal and Covid patients’ chest X-ray images [17,18]. Then, from the X-ray, we employed Artificial Intelligence to identify the occurrence of the Covid virus. Then, for a prediction model, data augmentation and dataset training using Deep Learning. So, here is the system showing the creating dataset part; data preprocessing may well be a get ready for arranging the rough data and making it suitable for a machine learning illustration. CXR images, in comparison to earlier image classification tasks, contain a high level of pair-wise similarity and little intra-subject variability. This type of data can easily cause model deviation and over fitting issues, diminishing the network’s generalization performance and making picture classification jobs more complicated [19]. It is an essential and crucial step in making machine learning illustrated. Then data augmentation, data augmentation methods on CNN utilize Tensorflow and Keras. But a few times as of late, any procedure: Images are resized. The most commonly utilized image broadening strategies are code cases and representation of pictures after extension. From here onwards, data will be alluded to like pictures. We are going to be utilizing Tensorflow or OpenCV composed in Python in all our cases. After that, the feature was extracted. In machine learning and measurements, classification could be an administered learning approach. The computer program learns from the input information and makes a show that has been utilized to evaluate the performance and result analysis. To predict the result, using the GUI system as the front end. That system will show the detective result of the coronavirus after chest x-ray image dataset training using CNN and then testing of CXR images. Using this mproposed application, Covid-19 prediction will be shown.
To identify objects for our Covid-19 detection system from chest X-ray images, we used OpenCV. This image processing technique helps with object detection based on the color, size, and shape of images. Different benchmark CNN models have been embraced in our proposed work. They have been trained individually to make independent predictions. Then the models are combined, using the new method of weighted average assembling technique, to predict a class value. We used OpenCV to detect particles in chest X-ray images for our Covid-19 detection system. This image processing technique assists in recognition of objects based on image color, size, and shape. In our proposed work, we used a variety of benchmark CNN models. Individually, they’ve been taught to make predictions on their own. The models are then merged to determine a class value, utilizing a novel way of the weighted average assembly procedure. This modern proposed assembling technique is expected to produce a more powerful expectation. DenseNet, h5, and the Inception model are three pre-trained CNN models in our proposed study. To train models, we applied Keras and TensorFlow with supplied parameters. Then, using the weighted normal gathering of the three models, they run the prepared models on the test images and choose lesson name 0 or 1 based on the results. Whereas partitioning the pictures into preparing and testing guarantees that there’s no persistent cover, i.e., distinctive pictures of the same quiet aren’t displayed in both preparing and testing datasets.
Firstly, the DenseNet’s convolution creates a greater number of highlight maps. The number of yields, including maps of a layer, is characterized as the development rate. DenseNet has lower requirements for wide layers since layers are thickly associated with little excess within the learned highlights. Fig. 3 shows the architecture of the CNN model DenseNet [20].
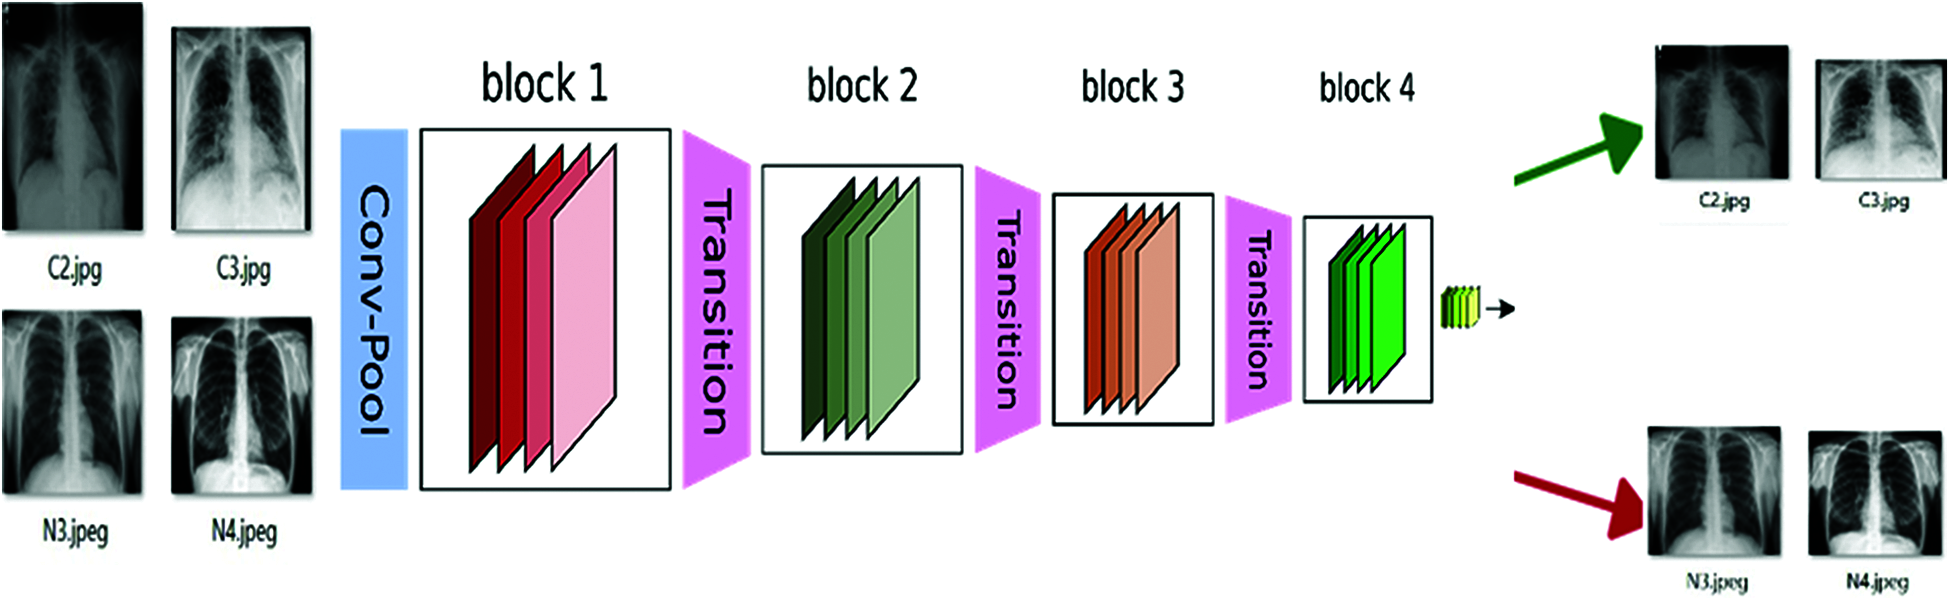
Figure 3: DenseNet architecture
Densely interconnected Convolutional Systems, also known as DenseNets, are the next step in the evolution of profound convolutional systems. After executing a composite of operations, traditional feed-forward neural systems interface the layer to yield it to the next layer. As we’ve seen, this composite typically includes a convolution operation or pooling layers, group normalization, and actuation work. The Dense Nets are divided into Dense Blocks, where the highlight map measurements remain constant within a piece, but the number of channels varies [21]. These layers are called Move Layers, and they focus on down sampling while utilizing a variety of normalization techniques, including 1 × 1 convolution and 2 × 2 pooling layers. I can comprehend how this behavior, including 32 times the number of layers, is really, really, performed within the new deeper level, speaking to the primary Thick Layer inside the basic Thick Square. We do a 1 × 1 convolution with 128 filters to lower the highlight map estimate, and then a more expensive 3 × 3 convolution with this chosen 32 number (keeping in mind adding the cushioning to assure the measurements stay consistent). The input volume is then concatenated with the results of the two processes (which are the same for each Thick Layer inside each Thick Piece).
The paper proposes a modern sort of engineering – Google Net or Initiation v1. It is essentially a convolutional neural network (CNN) that is 27 layers dense. The 1 × 1 Convolutional layer is sometimes applied to another layer, which is primarily utilized for dimensionality reduction. Fig. 4 shows the architecture of the CNN model Inception Module.
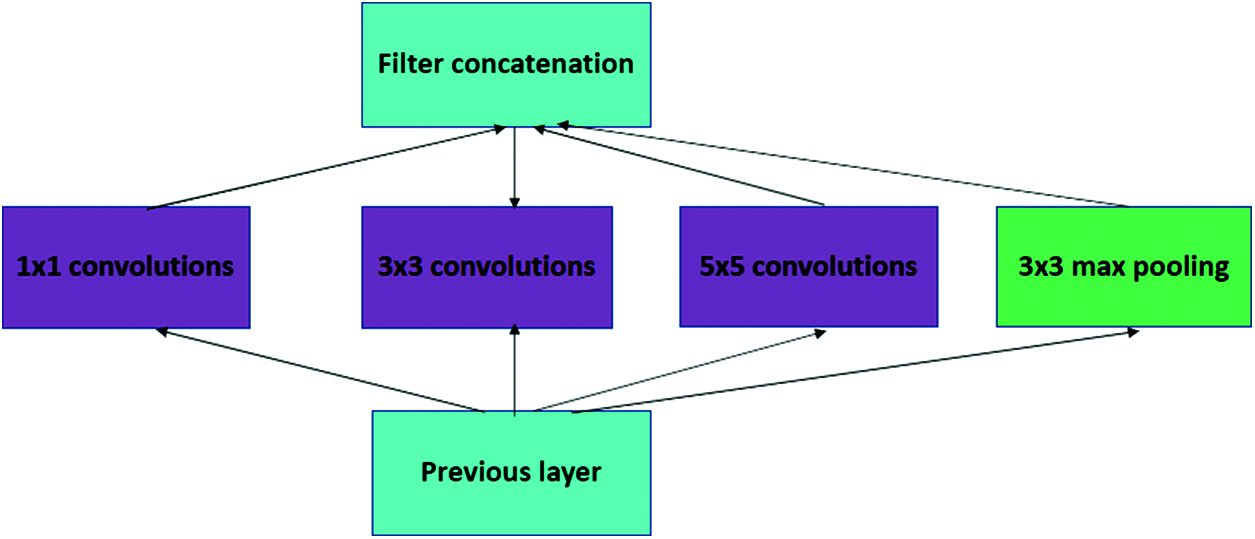
Figure 4: Inception module
Beginning Convolutional Neural Network systems (CNNs) are used to reduce processing costs by combining modules. Because a neural network interacts with an infinite number of pictures, each of which has a wide variety of significant components, they must be appropriately described. Convolution is performed on input with not one but three distinct channel sizes in the first disentangled adaption of a starting module (1 × 1, 3 × 3, 5 × 5). Furthermore, maximum pooling is employed. The following yields are concatenated and passed to the next phase at that time. The following yields are concatenated and passed to the next tier at that time. The arrangement becomes dynamically more extensive, not more profound, by organizing CNN to complete its convolutions at the same level [22]. So, here this DenseNet and Inception model are used for better results and fewer validation errors. Also, the model files are saved as h5 model file names, which we used for the prediction result. It is divided into two-part Covid (0) and Normal (1).
Convolutional neural networks were used to detect objects, and two chest X-ray datasets were analyzed. It consists of normal, COVID-19, and Pneumonia patients’ chest X-ray samples [17]. The second dataset can be accessed from the Github repository [18]. The other one was downloaded from Kaggle. That dataset basically contains images in three categories: normal, bacterial pneumonia, and viral pneumonia. It has around six thousand images, which are pretty big, so we separated 196 random images of type normal. In order to train a classifier, we need positive and negative samples. Women, men, and children of different ages, patients’ chest X-ray image collections and other information were present in the GitHub folder. The first dataset contains a total of 392 images containing normal and covid samples. 196 images were found and extracted as COVID-19. Some of the X-rays have a front view, and some of the X-rays have a top view or side view. As we needed only the front view of X-ray images, we separated them and found a total of 196 posteroanterior (P.A.) views of X-rays. So, we created 50 percent Covid and 50 percent normal samples.
The dataset images, which are divided into two parts. Those are Covid positive and normal CXR images. The images are then converted into (224,224) forms and normalized. At that point, the pictures are rearranged and split into preparing and testing information. Thus, the training part has 60 images and 2 classes. The same testing part has 60 images and 2 classes. There are many possibilities that the same patients’ CXR images are kept in both the training and testing parts. It can be overlapping, but it’s kind of promising that training of the model, which has been examined by testing and validation checking, defines the ability of the trained model. Covid-19 positive and negative patients’ chest X-Ray images below in Figs. 5 and 6.
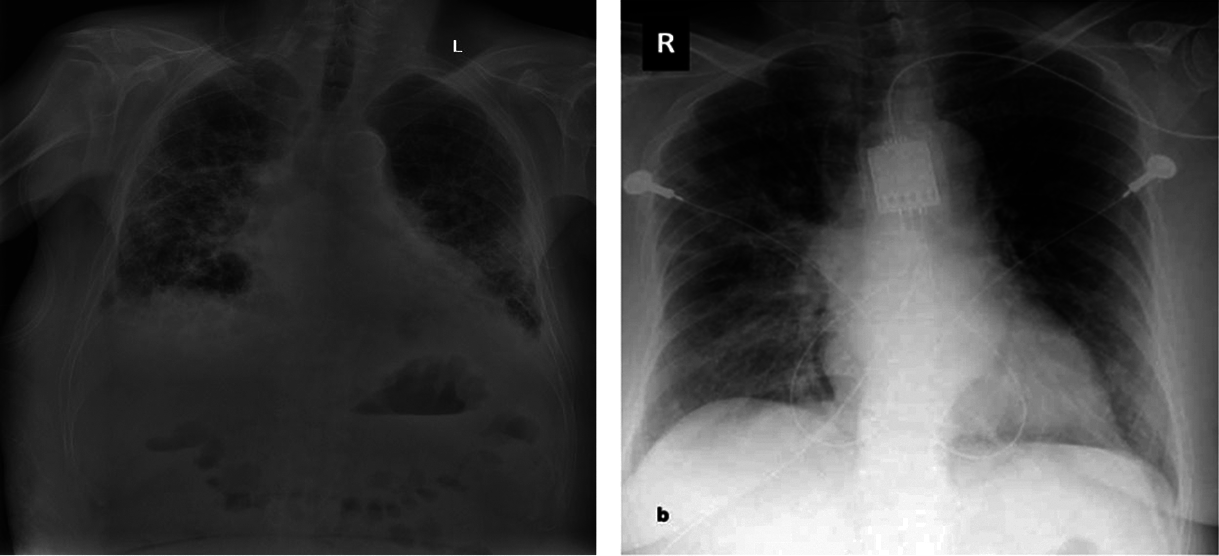
Figure 5: Covid-19 positive patient CXR pictures
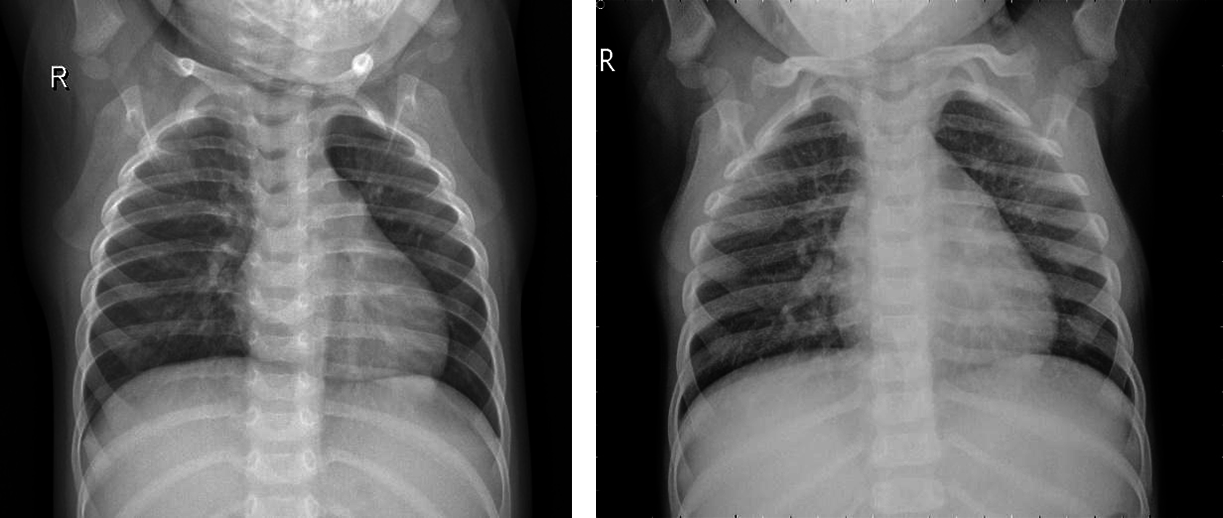
Figure 6: Covid-19 negative patient CXR pictures
Here are 4 images from the dataset which have been taken from the Kaggle dataset. Covid and Normal. The first dataset was distributed in 2018, and from that point forward, around 100 exploration articles have 121 been distributed so far, including its example. The benchmark paper by Kermany et al. reports 122 claims a grouping exactness of 92.8 percent while utilizing the Inception V3 architecture (pre-prepared for the 123 ImageNet datasets) to recognize Normal and COVID tests. When it came to recognizing normal, bacterial, and viral pneumonia, they achieved a 90.9 percent accuracy rate. Notwithstanding, 125 ongoing examinations have revealed better order results (for paired groupings) on these 126 datasets. For instance, in 2020, Chouhan et al. detailed an examination portraying a Transfer Learning127 based methodology for Covid identification, which brought about a 96.39 percent grouping exactness 128. Nahid et al. suggested a two-channel CNN-based pneumonia location technique that generated a 132-characterization exactness of 97.92 percent [23]. They utilized five diverse pre-prepared CNN structures, including extraction and a 129-troupe procedure for the last grouping. Mittal et al. [13] used Dynamic Capsule Routing 130 to achieve a maximum categorization accuracy of 95.90 percent using the second dataset [17]. The creators utilized numerous pictures preparing strategies 133 to deal with the examples prior to playing out the grouping utilizing the profound learning model. Covid-19, a CNN-based design with 21 layers, including standard 135 and the depth of the astute detachable convolution operations, was introduced by R. 134 Siddiqi. Different parallel arrangements of 136 were used in that review to recognize pneumonia, and Covid-19 accomplished a 94.80 percent 137 arrangement exactness on the testing tests. For pneumonia identification, Hu et al. presented MD-Conv, a multi-portion, profound, and comprehensive 138 convolution plot. On the popular Chest X-beam 14 dataset, they tested their 139 methods and got a 98.30 percent Area Under the Curve (AUC) 140 score. 141 A little research, such as the 142 suggested approach, used chest X-beam images to perform three-class characterization, including the initial dataset. Mahmud et al. 143, for example, presented CovXNet (a multi-enlargement CNN) for normal and COVID-19 identification and 144 Covid-19 arrangements in 2020. They tried various layouts using subsets of 145 of the two chest radiograph datasets and a variety of deep learning models. In any case, they 146 accomplished pinnacle results by utilizing CovXNet with adaptable multi-open element 147 advancement. Using CNN and Transfer Learning, Jain et al. achieved three-class characterizations to recognize Covid and its 148 types. To fulfill their objective, they looked at several avenues using 149 six different CNN-based models, four of which were pre-prepared 150 models, similar to the former inquiry [23].
This proposed work’s most significant benefit is that it is very user-friendly, and the system benefits in all sections of socities. Everyone can use it if anyone has a minimum knowledge of browsing and selecting images. This whole system is mainly done in the Python language, and for the overall design, we use the Tkinter library, which is Python’s default graphical user interface toolkit, to generate a standard user interface. A dataset was created using a Jupyter notebook. We train and validate our data in Google Colab. We use Flask, which helps us to import libraries. For the CNN base model, we use Keras for image processing; we also use OpenCV and Tensorflow, which resize images and zoom. Also, the standard image size is 224,224. We use scikit-learn to maintain our algorithm-like epochs. To highlight training loss, training accuracy, validation accuracy, and validation loss, we use Matplotlib, from which the library was born, as well as Sklearn. Metrics, which allow us to show true positive, true negative, falsely positive, and falsely negative, actually show how successfully the system’s work is done. To detect the image, we use artificial intelligence. In the backend part, deep learning is used.
3 Equations and Mathematical Expression
Actual or classification accuracy, which we may obtain using some variant of cross-validation data, or sensitivity, which is the ratio of the correctly + classified by our program to all, are the performance metrics used to measure the success of the proposed system. The ratio of accurately + classified by our software to all + classified is known as precision. After that, the overall score was calculated.
Accuracy measured as follows:
It’s called a classification metric, which, in summary, is the number of correct and incorrect predictions made by a classifier.
For these confusion metrics, we need the Python machine learning library nameScikit-learn. The True Positive/Negative name refers to the anticipated result of a test, whereas the True/False refers to the real result. So, in the event, I anticipated that somebody would be Covid-19 positive, but they weren’t. At that point, that would be a False Positive since the real result was wrong, but the expectation was positive.
It is a summary of our proposed solutions and results. The technique is repeated until a specified meeting model is fulfilled, a predetermined number of eras has elapsed, or the arrangement has remained the same for a few successive periods. Tab. 1 shows the data preprocessing.
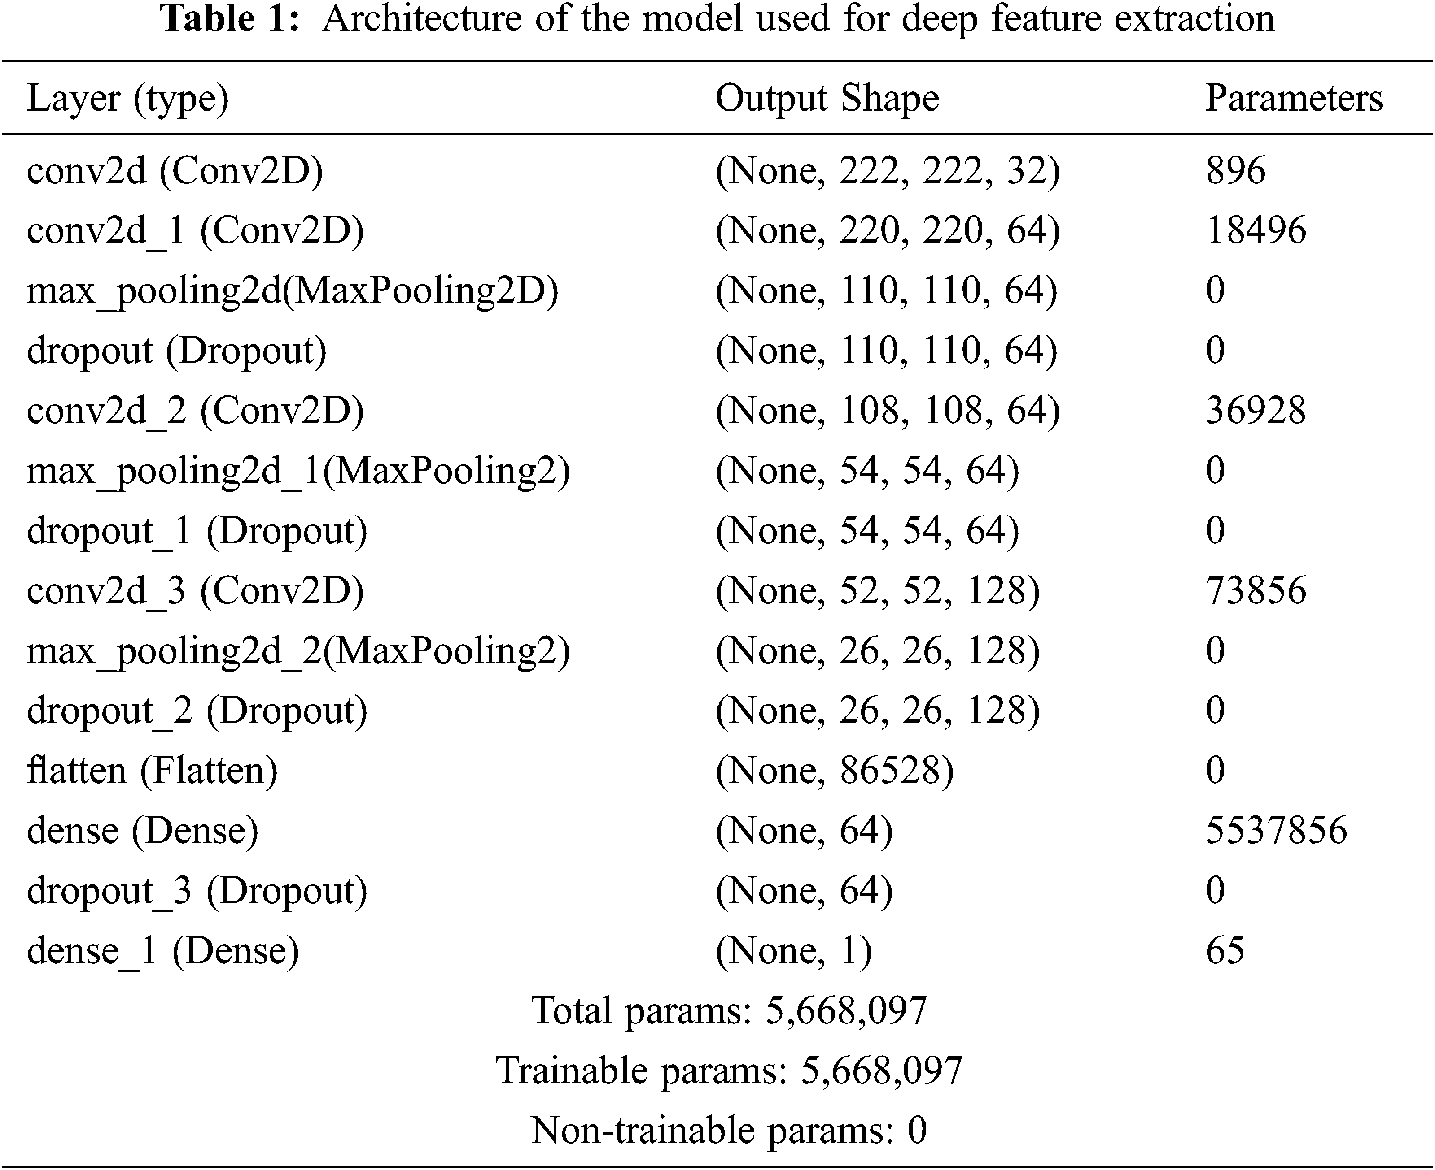
The model is sequential. It is also a CNN-based model in Keras. From here, we can see the layer types and our shape number. Total params number, where 5,668,097 is trainable and non-trainable number is 0. The table summarizes the training and validation loss and accuracy of two files, where for Covid positive it is 0 and for normal it is 1: for example, Tab. 2.
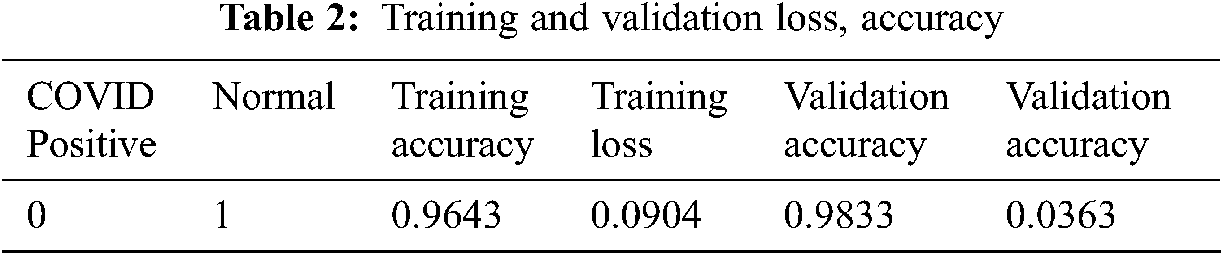
From Tab. 2, it can be seen that training accuracy is 0.96, training loss is 0.09, validation accuracy is 0.98 and validation loss is 0.03.
Tab. 3 shows the Model evaluate generator for the Training and Validation part of Covid and Normal. Here for Covid it’s 0, and normal it’s 1. After the Model Training it has got the accuracy of training and validation up to 97 percent.
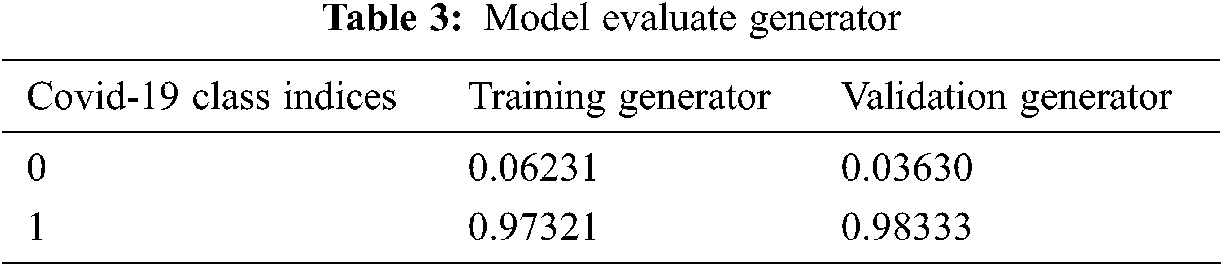
The model evaluates the generator of training and validation is Training accuracy of 0.6231 and loss of 0.97321. Validation accuracy is 0.98333, and loss is 0.03630.
All models are trained for a total of 10 epochs with a step-per-epoch of 7. Model fit is generated here, and the model is saved as an a.h5 file. Model training takes 9 s for each epoch. The training accuracy of this model is almost 96 percent, and the validation accuracy is almost 98 percent.
The experimental evaluation of the suggested method is described in this section. The goal of the offline training and testing experiments is to find the best machine learning model with the highest output for real-time sentiment polarity prediction. We analyzed the performance using two machine learning models and training on a total of five thousand CXR images. Where 60 images for testing and validation.
So, starting by describing the confusion matrix. For these confusion metrics, the True Positive/Negative name refers to the anticipated result of a test, whereas the True/False refers to the real result. In Fig. 7, it can be seen in the accuracy table of performance evaluation.
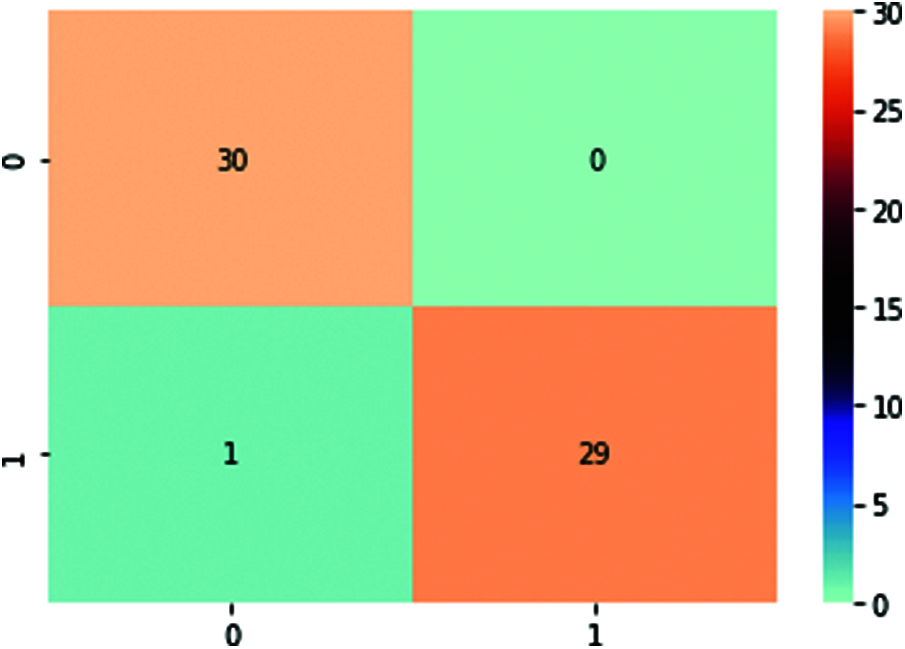
Figure 7: Accuracy table
Here, T.P. is 30, TN is 29, F.P. is 1, and F.N. is 0. So, the train generator class index Covid is 0 and normal is 1.
Here the graph shows that training and validation accuracy is increasing. At epoch 4, the training accuracy was a little bit, but after epoch 04, the training accuracy increased. Here, the highest training accuracy is 0.95 after epoch 8. Here the graph also shows the validation accuracy; it also increases when epoch 0; the validation accuracy is 0.92. The validation accuracy is highest at epoch 1, after epoch 7, it is a little bit decreasing. After epoch 8, the validation accuracy again increased. The training loss is 0.09, and the validation loss is 0.03. Here, when the epoch is 0, the training loss is high. At the highest point, training loss is decreasing. Here the graph shows that in epoch 2, 4, 6, 8, training loss is decreasing, and after the epoch, the training loss rate is the lowest. But in epoch 4, 7, it slightly increased, and after epoch 08, the training loss was very low. On the other hand, the graph also shows validation loss. Here the highest validation loss is close to 0.58 when epoch 0. When the epoch is 1 to 2, range validation is constant, and after epoch 2, the validation loss also decreases. When epoch is in the range of 3–7, the change in validation loss is more or less the same, but at epoch 7, the validation is a little bit increased, but after epoch 7, the validation loss again decreases. Training loss is higher than validation loss. It can be shown with the help of both graphs below. Figs. 8 and 9 show the graph of the accuracy and loss:
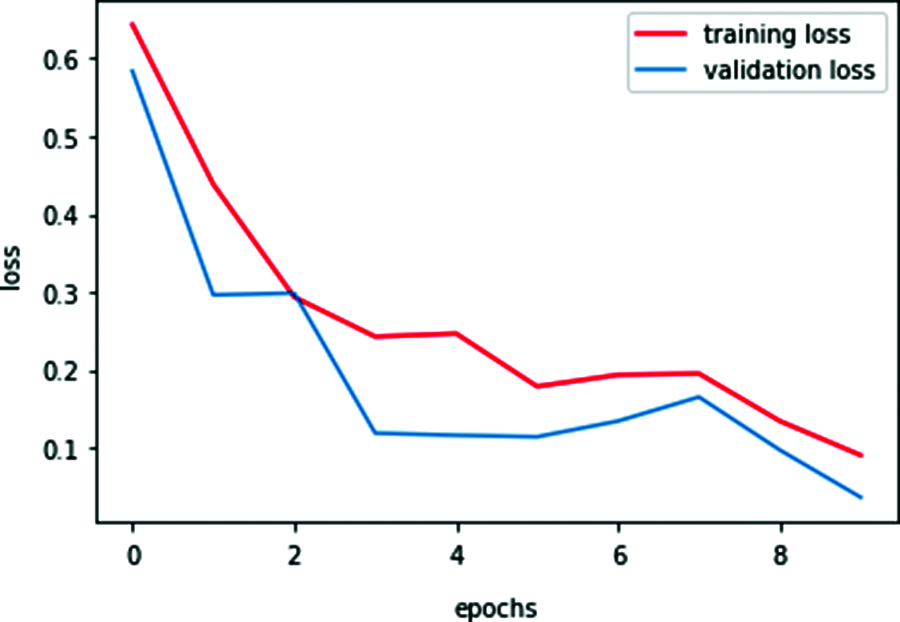
Figure 8: Training and validation loss
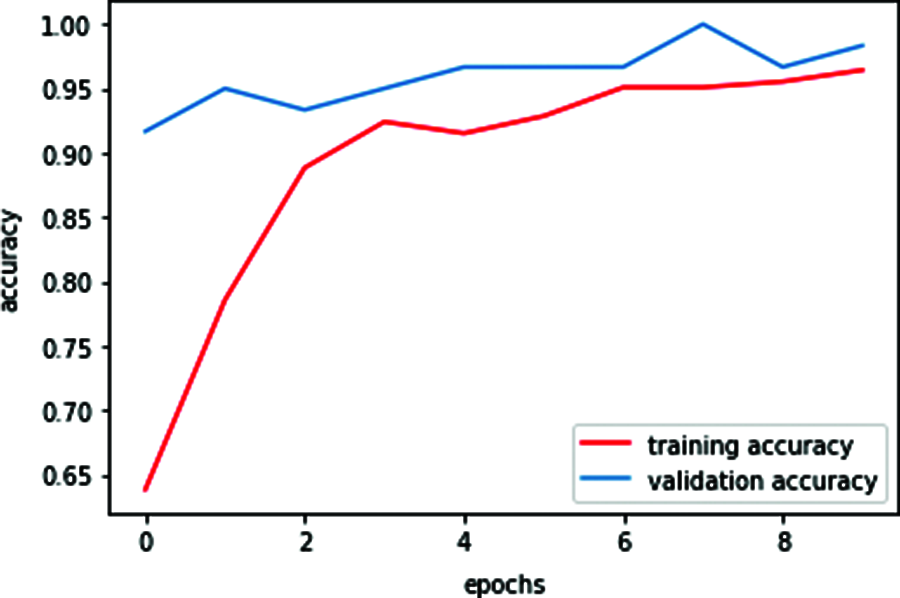
Figure 9: Training and validation accuracy
Overall validation accuracy is higher than training accuracy. It can be shown with the help of both graphs below. For graphing the epochs for training and validation, it has been used by matplotlib and the Sklearn library.
Based on the proposed course of action, a GUI application for the Covid Prediction framework was run. In a way that will minimize Covid-19 positive and negative situations, a direct desktop program was developed, as shown in Fig. 10.
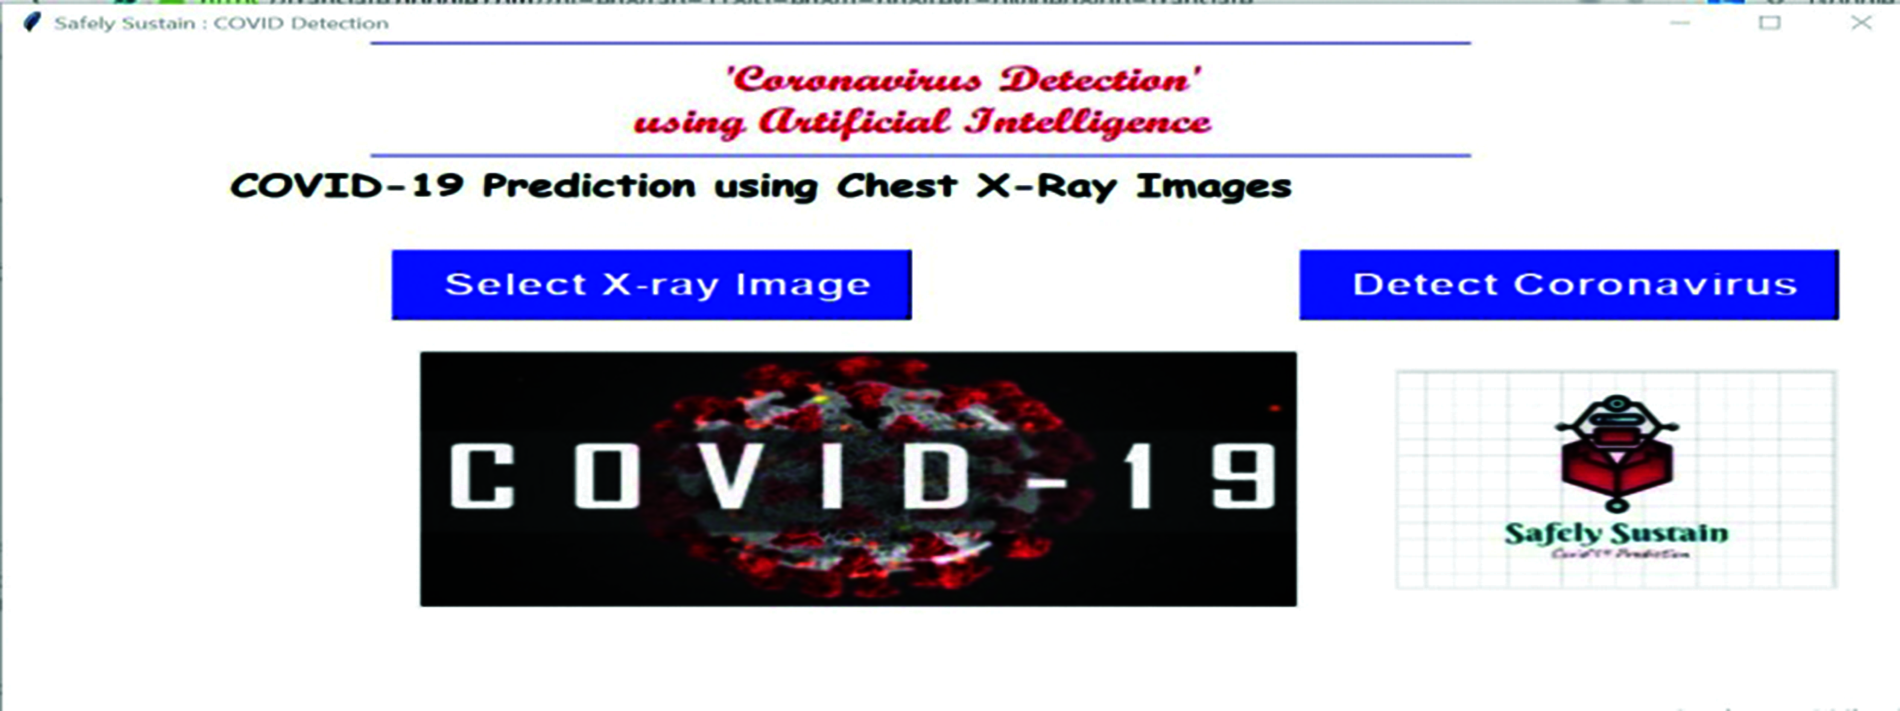
Figure 10: Gui Covid-19 prediction desktop tool
A chest X-ray image can be browsed and fed into the program by medical personnel or the general public. In turn, the application will implement the provided illustration in this paper and assign a title to the given Chest X-Ray image, such as Covid or Normal. As a result, they will identify the Covid +ve and Covid -ve situations in addition to their probabilities, as illustrated in Fig. 11. This might be used on a variety of platforms, including Windows, Mac OS X, and Linux. This interface can be used in any Covid-19 testing center or other medical offices for specific areas of the disease. This arrangement to utilize devices alongside the fundamental code for data course of action and appear planning is accessible freely on the GitHub account.
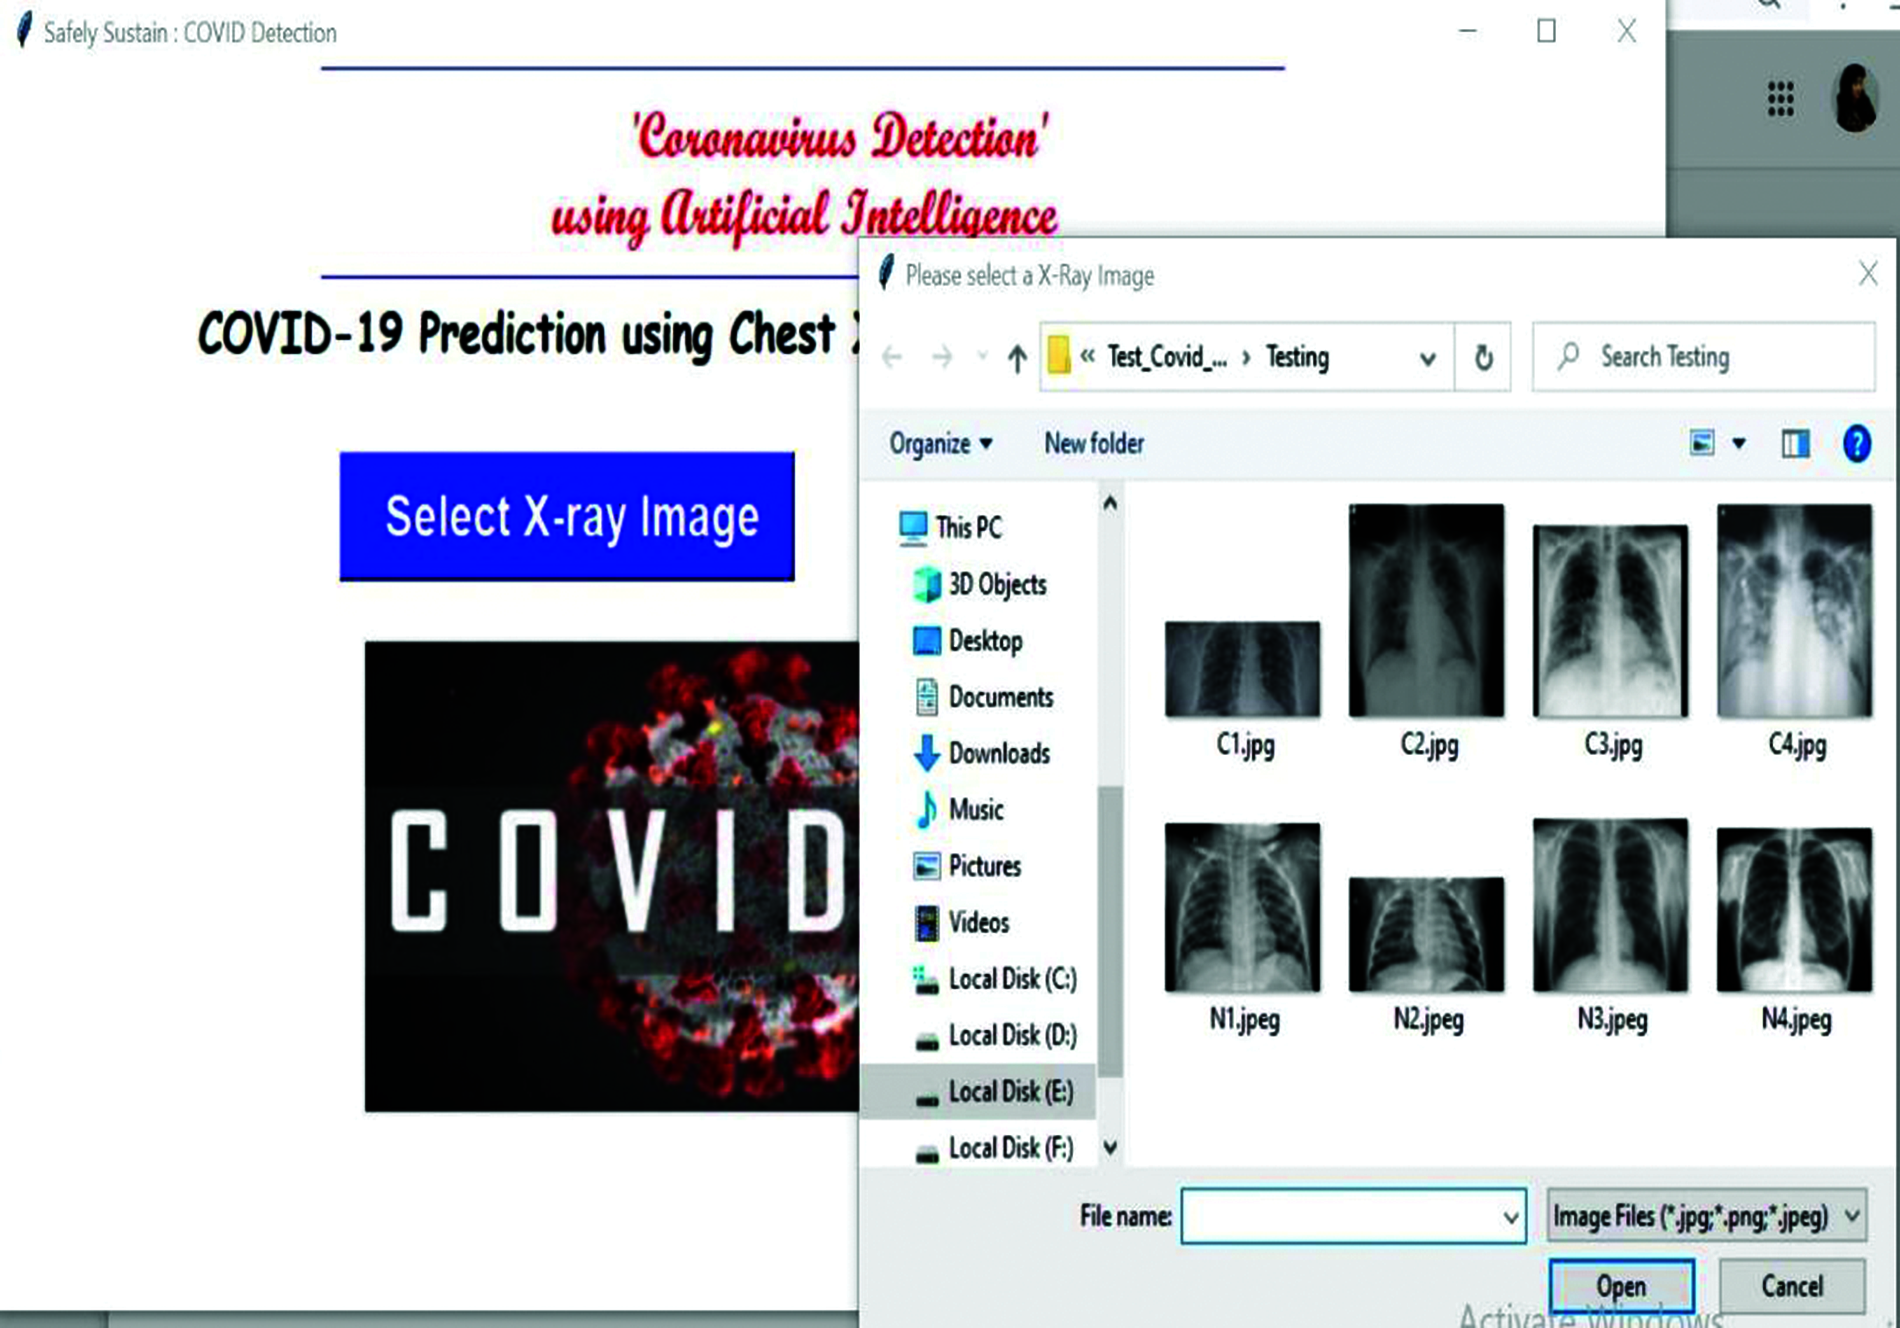
Figure 11: Selection of CXR images
Firstly, to get the desktop tool in Anaconda Prompt, press the tool name gui_covid.py. Then enter the platform where it can be seen like the one below. In Fig. 10, it shows the Gui Covid-19 prediction desktop tool.After that, press the select X-ray image, open your file explorer, select your chest x-ray image, and it will look like Fig. 11.
After the selection of the images, it will now press the detect button to predict your result. Then press OK. After that, press the detect the coronavirus button. After a few seconds, the result will appear on the screen, either Covid or Normal. The result can be shown in Fig. 12.
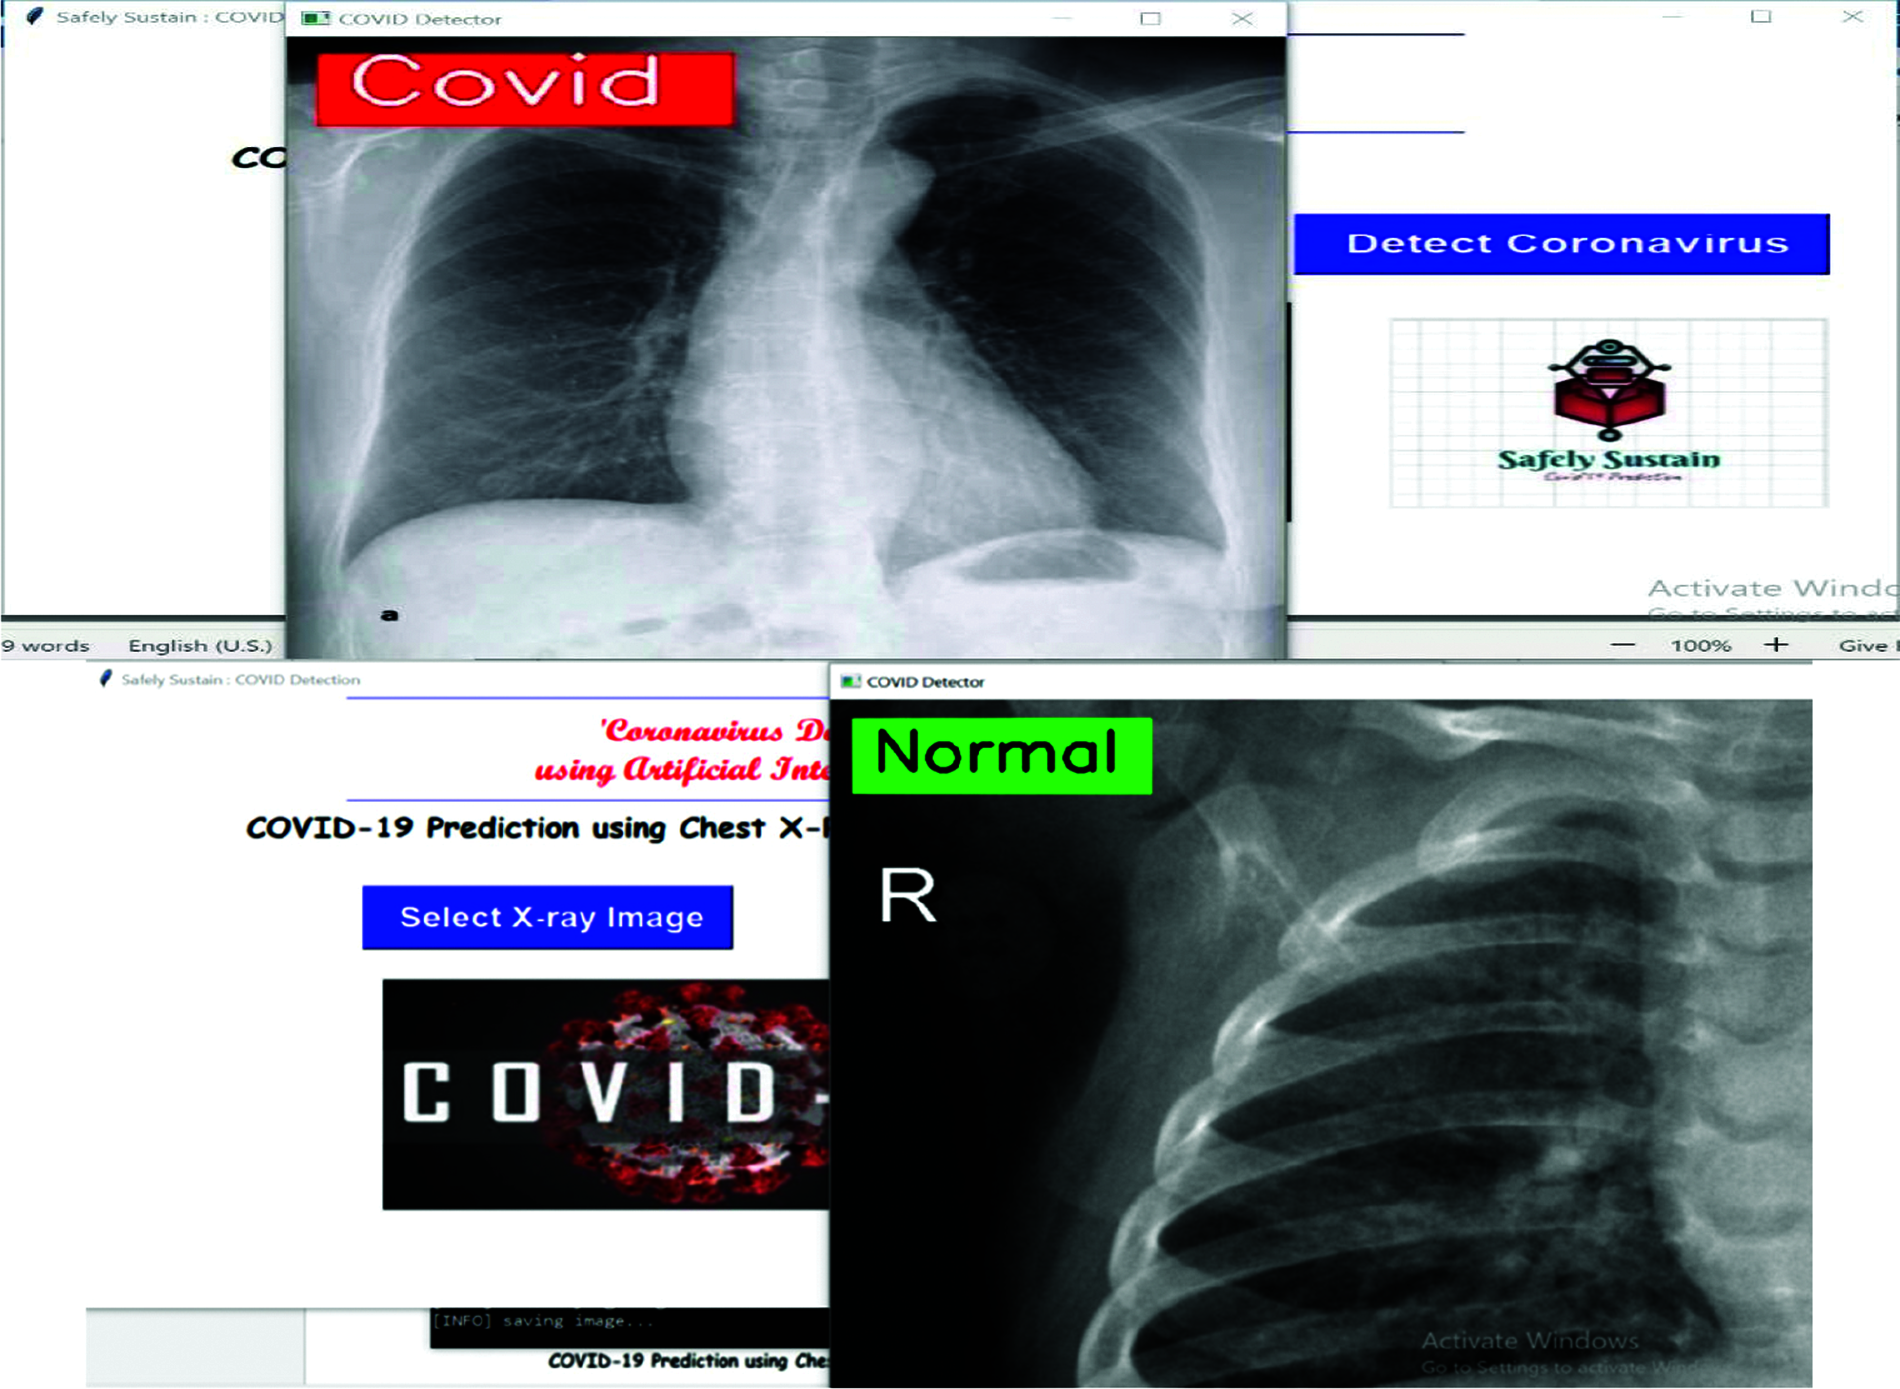
Figure 12: Detect coronavirus result
Finally, after image analysis, the user will get the result and it will show users a message. Figs. 13 and 14 show the text box of the result. The image is shown below.
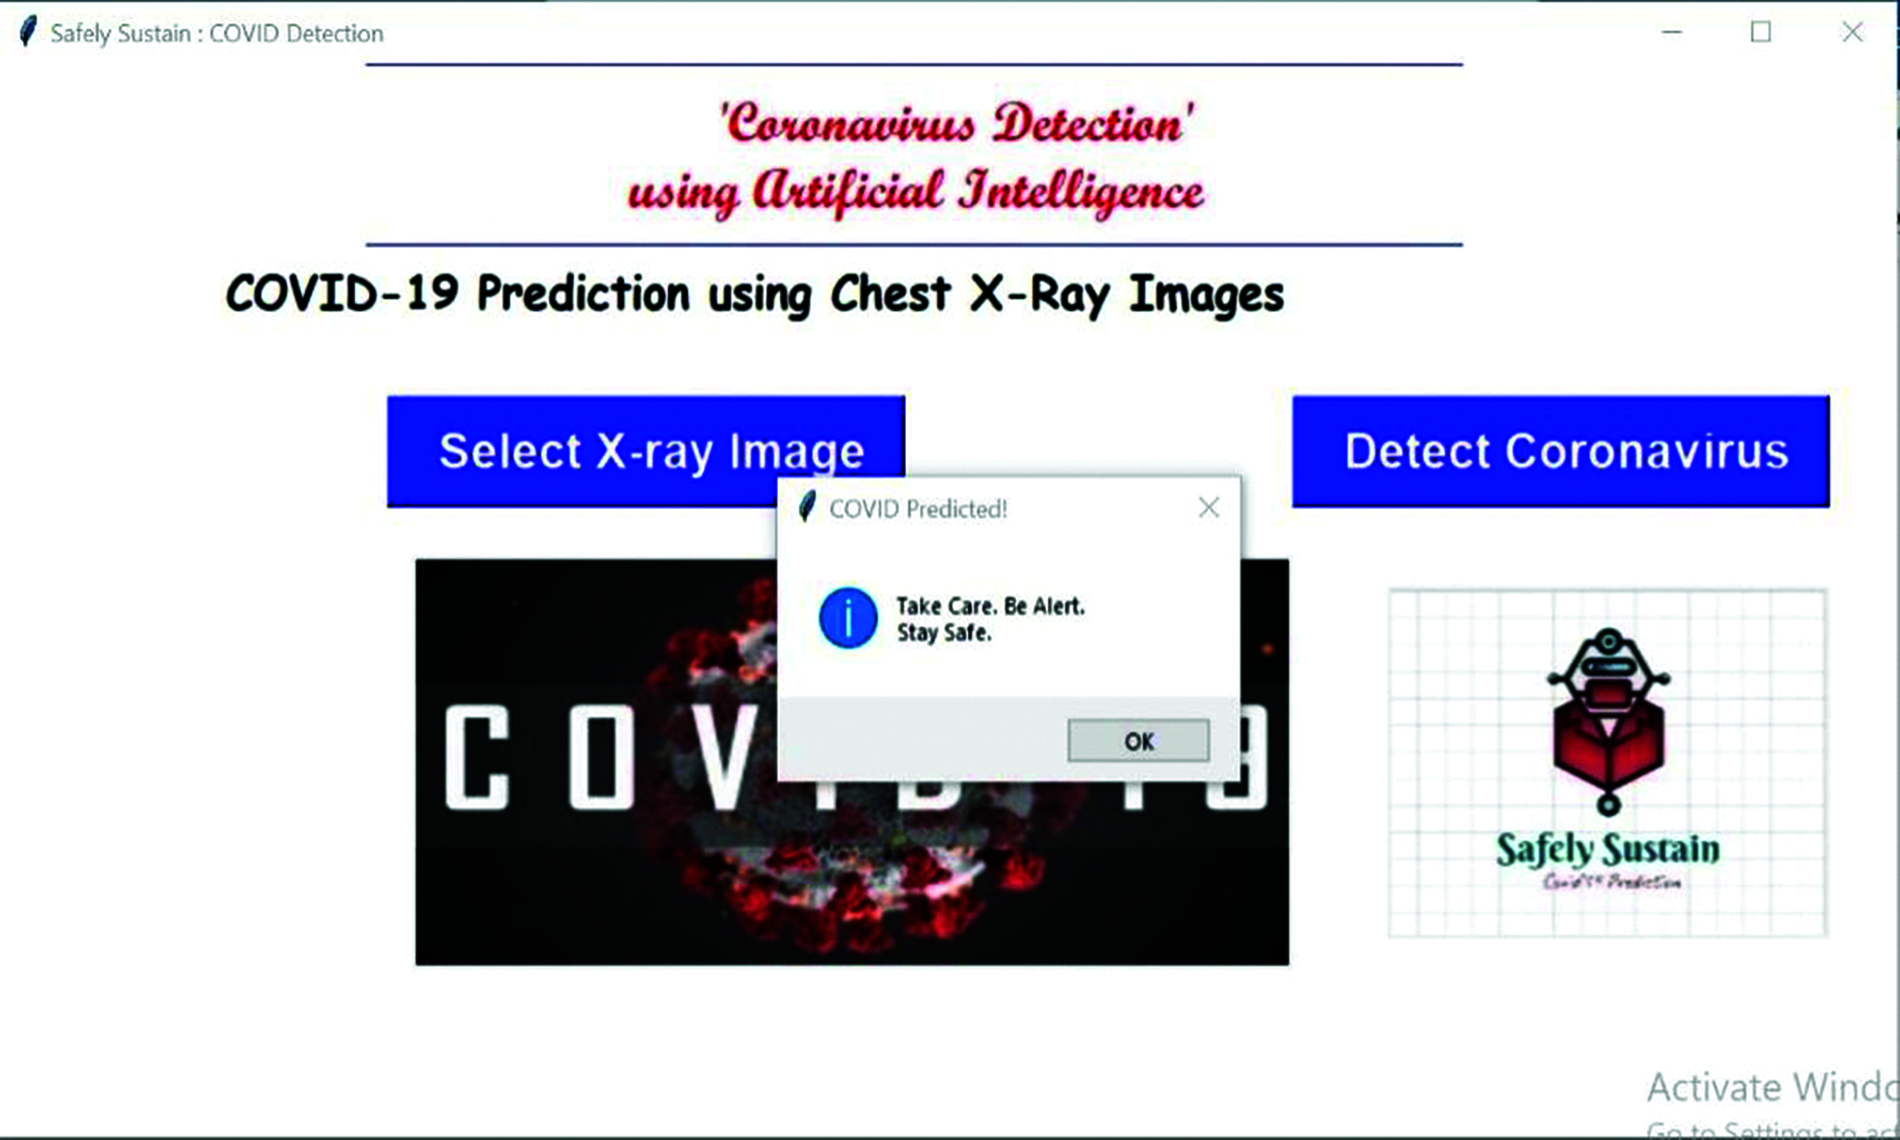
Figure 13: Showing the text for Covid report
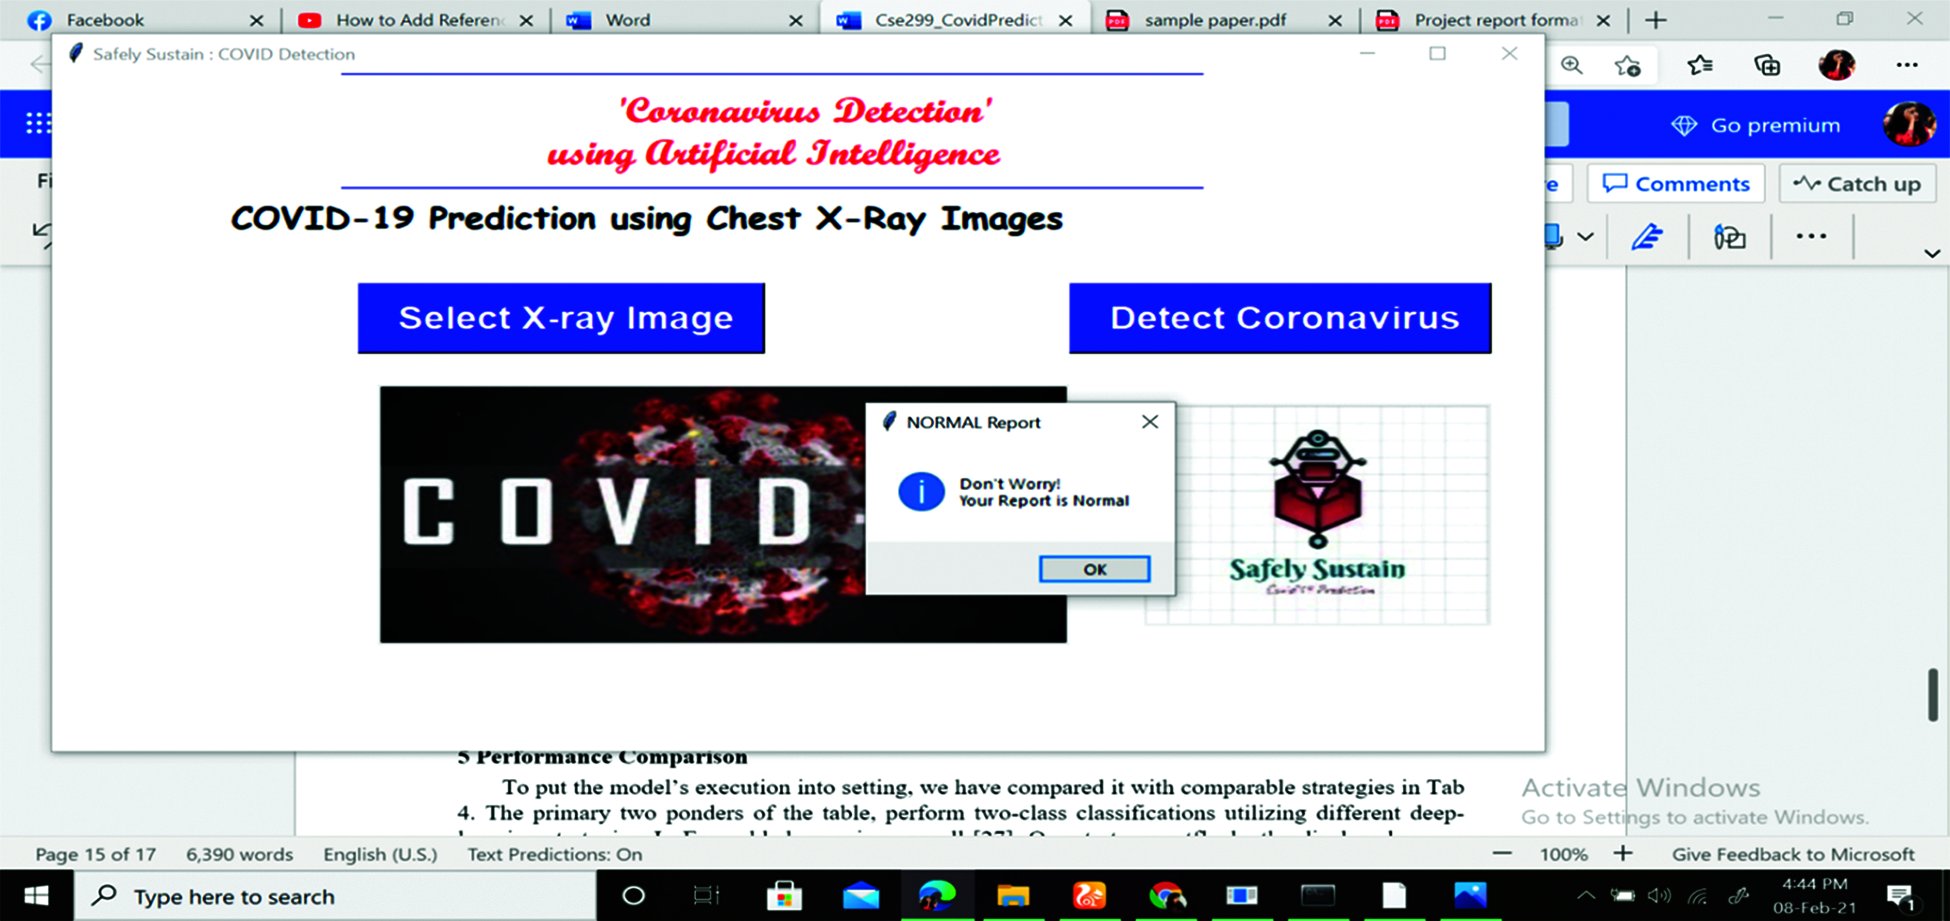
Figure 14: Showing the text for normal report
When the user crosses the x-ray image, the text message will be shown to the user. If the patient gets a result of Covid-19 positive, it shows Take Care, be alert and Stay Safe. If the patient gets the result of Covid-19 negative, it shows don’t worry, and you are safe. After that, the user can end their prediction or they can again apply the same procedure with different chest x-ray images.
So, developing tools where they have been used in the Gui application for indexing and templates. For the Gui application, we imported the Python library named Tkinter. To predict exact results, we used our training model.h5 file. So. This is how users can get their Covid-19 results.
We compared the model’s execution to comparable strategies in Tab. 4 to put it in context. To execute two-class classifications, the first two questions on the table require distinct deep-learning algorithms. There are also ensembles. Regardless, we must emphasize that none of the cited papers [24] address the specific dataset in question. They took the corresponding lesson exams from the parent dataset in the majority of cases.
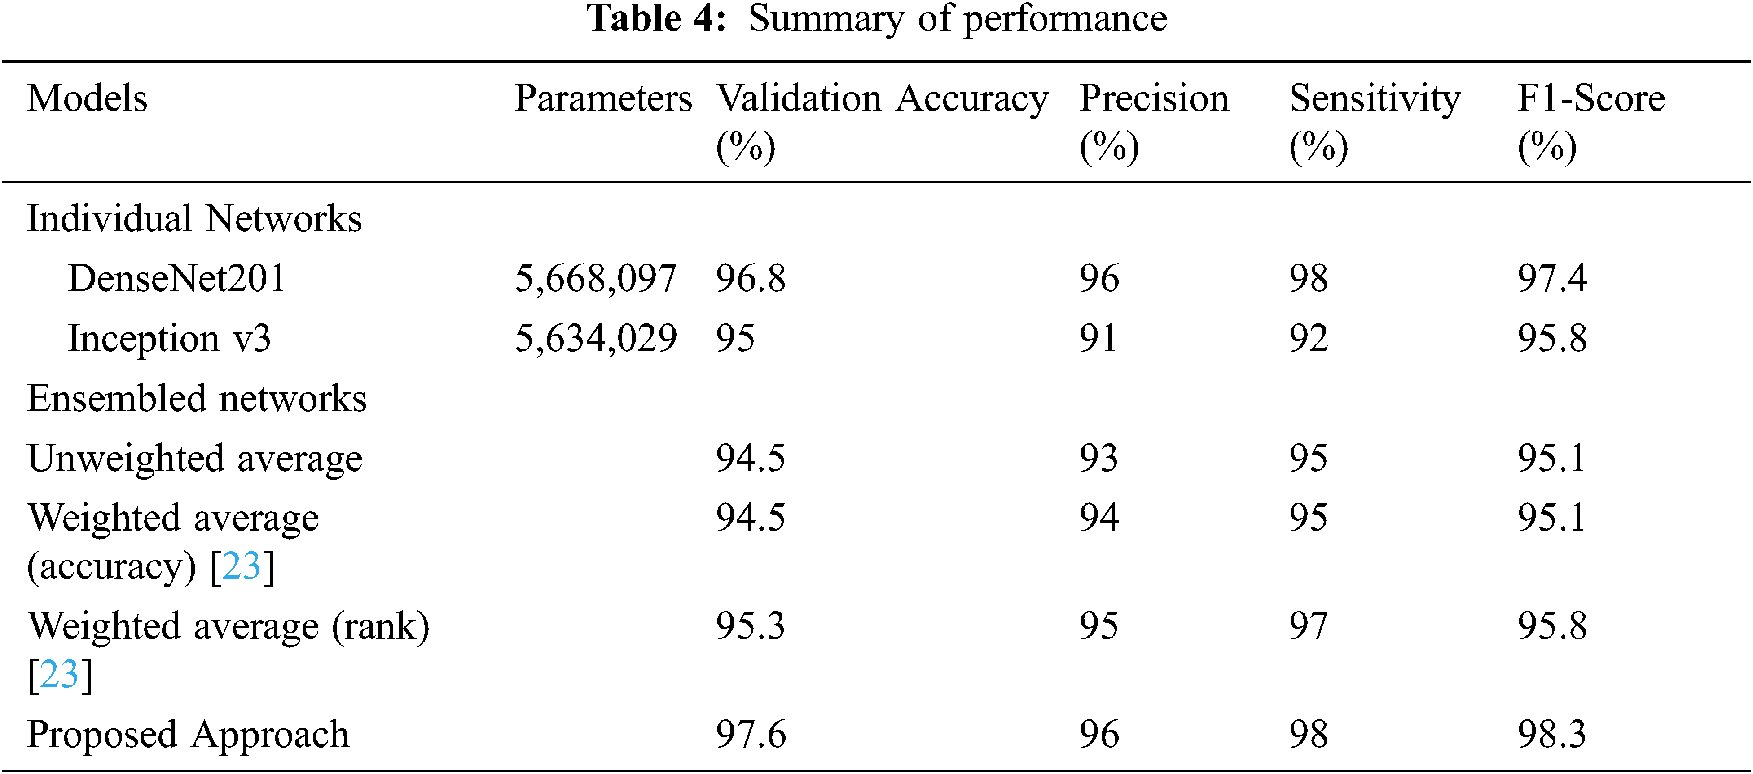
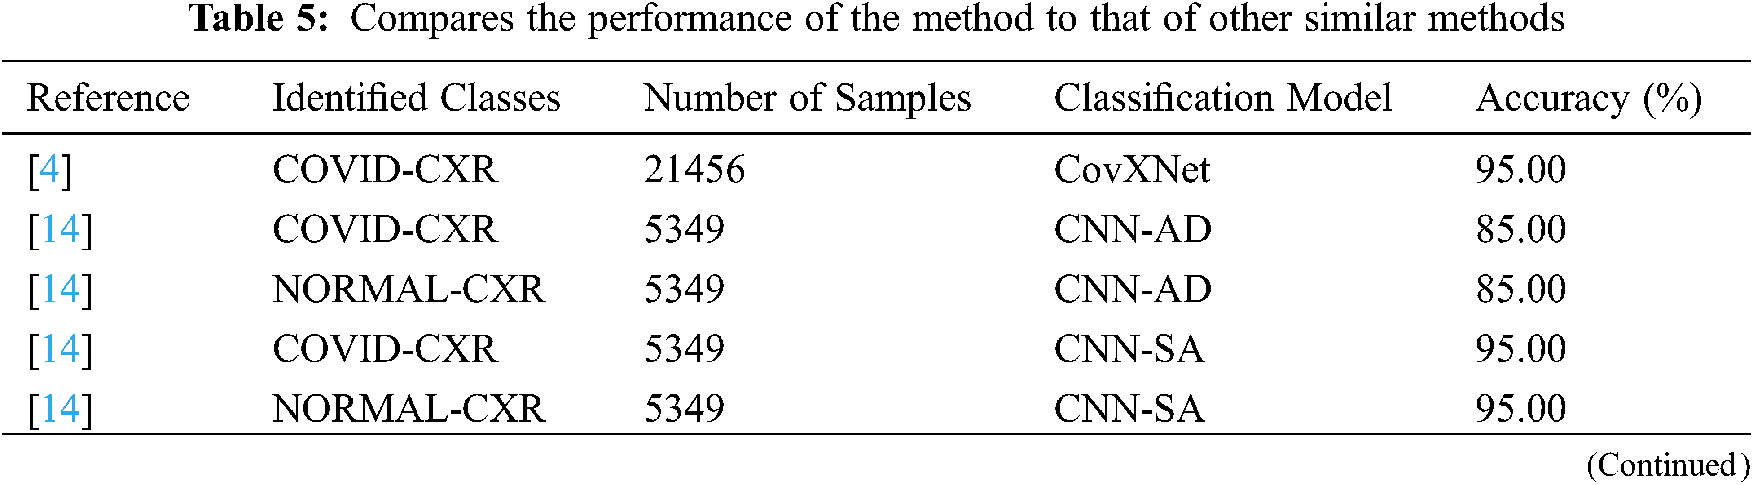
In summary, the success of our proposed solution, It’s better than models of individuals. The closest execution is that of DenseNet201. In Tab. 5, we compared the model’s performance to that of similar methods to put it in context. References [14,16] use numerous deep-learning algorithms to produce four-class classifications. In one case, the described model’s performance was practically identical to this proposed method (98.3 percent). In every case, the strategy outperforms the presented lead in terms of classification accuracy in those studies. However, none of the referenced papers are relevant to the specific dataset used in this analysis. They took the associated class samples from the parent dataset in the majority of situations.
Covid patients’ most important duty is to not spread the Covid to healthy people. Suppose someone doesn’t know about their Covid result. In that case, they cannot control the spread of Covid in healthy people, so each person should know about Covid’s positive or negative results as early as possible. This paper is all about how the system can know their Covid results as early as possible at a low cost. The main motive is to decrease the cost of the corona test and get the results as early as possible using neural networks and artificial intelligence. The research work was done to detect chest X-ray images using detection. In this detection model part, it is seen that the accuracy of giving the true result is 98 percent. That means in a hundred results, and there might be two false results. This will help the patient to get the Covid result from home at no cost. They can take their treatment from home. That will be helpful for Covid patients and also for healthy people who are not affected by Covid. In this way, we can save people from Covid-19. Because when Covid affected people are in quarantine at home, they don’t spread the disease to other people. Also, they save their health by going into bad situations with proper treatment. Lastly, this paper shows a Graphical User Interface (GUI) application that has been operated for the Covid Prediction framework, which introduces the design and implementation of technology. It is believed that the proposal is very helpful for all people and greatly impacts on decreasing the Covid rate if it can be implemented. It also added a great milestone in the Covid-19 testing section. However, in the future, our goal is to improve the CNN architecture to get better accuracy and implement different models for comparison with deep learning models. Also, we have the possibility to scale up the web application by helping users to save their login info, data and open their comment sections for better improvement.
Acknowledgement: Authors would like to thank the Department of Electrical and Computer Engineering of North South University and Taif University Researchers Supporting Project number (TURSP-2020/73), Taif University, Taif, Saudi Arabia.
Funding Statement: Authors would like to thank for the support from Taif University Researchers Supporting Project number (TURSP-2020/73), Taif University, Taif, Saudi Arabia.
Conflicts of Interest: The authors proclaim that they have no conflicts of interest to report concerning the present study.
1. World Health Organization, “Coronavirus Disease 2019 (COVID-19Situation Report, 94,” 2020. [Online]. Available: https://apps.who.int/iris/handle/10665/331865. [Google Scholar]
2. M. Hasan, “Covid: Bangladesh records 235 more deaths, 15,776 new cases,” [Online]. 2021. Available: https://www.dhakatribune.com/bangladesh/2021/08/03/covid-bangladesh-records-235-more-deaths-15-776-new-cases. [Google Scholar]
3. Worldometers, “Coronavirus,” 2021. Available: https://www.worldometers.info/coronavirus/?utm_campaign=homeAdvegas1?%22. [Google Scholar]
4. A. Makris, I. Kontopoulos and K. Tserpes, “COVID-19 detection from chest X-ray images using deep learning and convolutional neural networks,” in Proc. 11th Hellenic Conf. on Artificial Intelligence, Athens, Greece, pp. 60–66. 2020. [Google Scholar]
5. D. Wu, T. Wu, Q. Liu and Z. Yang, “The SARS-coV-2 outbreak: What we know,” International Journal of Infectious Diseases, vol. 94, pp. 44–48, 2020. [Google Scholar]
6. V. Smolyakov, “Ensemble learning to improve machine learning results,” [Online]. 2021. Available: https://www.kdnuggets.com/2017/09/ensemble-learning-improve-machine-learning-results.html. [Google Scholar]
7. J. Irvin, P. Rajpurkar, M. Ko, Y. Yu, S. Ciurea-Ilcus et al., “Chexpert: a large chest radiograph dataset with uncertainty labels and expert comparison,’’ in Proc. 33rd AAAI Conf. on Artificial Intelligence, AAAI, Honolulu, U.S, pp. 590–597, 2019. [Google Scholar]
8. L. Wang, Z. Q. Linc and A. Wong, “COVID-Net: A tailored deep convolutional neural network design for detection of COVID-19 cases from chest X-ray images,” Scientific Reports, vol. 10, no. 19549, pp. 1–9, 2020. [Google Scholar]
9. A. Gupta, S. Gupta and R. Katarya, “Instacovnet-19: A deep learning classification model for the detection of COVID-19 patients using chest x-ray,” Applied Soft Computing, vol. 99, no. 4, pp. 1–13, 2021. [Google Scholar]
10. S. Benbelkacem, A. Oulefki, S. Agaian, T. Trongtirakul, D. Aouam et al., “Lung infection region quantification, recognition, and virtual reality rendering of CT scan of COVID-19,” in Proc. SPIE, Multimodal Image Exploitation and Learning, vol. 11734, no. 117340I, pp. 1–10, 2021. [Google Scholar]
11. L. Li, L. Qin, Z. Xu, Y. Yin, X. Wang et al., “Using artificial intelligence to detect COVID-19 and community-acquired pneumonia based on pulmonary CT: Evaluation of the diagnostic accuracy,” Radiology, vol. 296, no. 2, pp. 65–71, 2020. [Google Scholar]
12. M. Rahimzadeh and A. Attar, “A modified deep convolutional neural network for detecting COVID-19 and pneumonia from chest X-ray images based on the concatenation of xception and resnet50v2,’’ Informatics in Medicine Unlocked, vol. 19, no. 100360, pp. 1–10, 2020. [Google Scholar]
13. X. Xu, X. Jiang, C. Ma, P. Du, X. Li et al., “Deep learning system to screen coronavirus disease 2019 pneumonia,” Engineering, vol. 6, no. 10, pp. 1122–1129, 2020. [Google Scholar]
14. A. Das, S. Ghosh, S. Thunder, R. Dutta, S. Agarwal et al., “Automatic COVID-19 detection from x-ray images using ensemble learning with convolutional neural network,” Pattern Analysis and Applications, vol. 2020, pp. 1–14, 2021. [Google Scholar]
15. M. D. K. Hasan, S. Ahmed, Z. M. E. Abdullah, M. M. Khan, M. Masud et al., “Deep learning approaches for detecting pneumonia in COVID-19 patients by analyzing chest X-ray images,” Mathematical Problems in Engineering, vol. 2021, no. 9929274, pp. 1–8, 2021. [Google Scholar]
16. X. Zhang, H. Saleh, E. M. G. Younis, R. Sahal, A. A. Ali et al., “Predicting coronavirus pandemic in real-time using machine learning and big data streaming system,” Complexity, vol. 2020, no. 6688912, pp. 1–10, 2020. [Google Scholar]
17. P. Patel, Normal CXR Dataset. [Online]. 2020. Available: https://www.kaggle.com/prashant268/chest-xray-covid19-pneumonia. [Google Scholar]
18. J. P. Cohen, Covid Chest X-Ray Dataset. [Online]. 2020. Available: https://github.com/ieee8023/covid-chestxray-dataset. [Google Scholar]
19. W. Wang, Y. Li, J. Li, P. Zhang and X. Wang, “Detecting COVID-19 in chest x-ray images via MCFF-net,” Computational Intelligence and Neuroscience, vol. 2021, no. 3604900, pp. 1–8, 2021. [Google Scholar]
20. G. Huang, Z. Liu, L. V. D. Maaten and K. Q. Weinberger, “Densely connected convolutional networks,” in Proc. IEEE Conf. on Computer Vision and Pattern Recognition (CVPRHonolulu, HI, pp. 2261–2269, 2017. [Google Scholar]
21. DenseNet Architecture Explained. [Online]. 2020. Available: https://towardsdatascience.com/understanding-and-visualizing-densenets-7f688092391a. [Google Scholar]
22. C. Szegedy et al., Inception Module Explained. [Online]. 2014. Available: https://deepai.org/machine-learning-glossary-and-terms/inception-module. [Google Scholar]
23. M. Masud, A. K. Bairagi, A. A. Nahid and N. Sikder, “A pneumonia diagnosis scheme based on hybrid features extracted from chest radiographs using an ensemble learning algorithm,” Journal of Healthcare Engineering, vol. 2021, no. 8862089, pp. 1–11, 2021. [Google Scholar]
24. X. F. Frazao and L. A. Alexandre, “Weighted convolutional neural network ensemble,” in Proc. Iberoamerican Congress on Pattern Recognition, CIARP, Puetro Vallarta, Mexico, vol. 8827, pp. 674–681, 2014. [Google Scholar]
 | This work is licensed under a Creative Commons Attribution 4.0 International License, which permits unrestricted use, distribution, and reproduction in any medium, provided the original work is properly cited. |