DOI:10.32604/csse.2022.021741
| Computer Systems Science & Engineering DOI:10.32604/csse.2022.021741 | |
| Article |
Heart Disease Classification Using Multiple K-PCA and Hybrid Deep Learning Approach
School of Computer Science and Engineering, Vellore Institute of Technology, Vellore, 632014, India
*Corresponding Author: S. Kusuma. Email: kusu87@gmail.com
Received: 13 July 2021; Accepted: 16 August 2021
Abstract: One of the severe health problems and the most common types of heart disease (HD) is Coronary heart disease (CHD). Due to the lack of a healthy lifestyle, HD would cause frequent mortality worldwide. If the heart attack occurs without any symptoms, it cannot be cured by an intelligent detection system. An effective diagnosis and detection of CHD should prevent human casualties. Moreover, intelligent systems employ clinical-based decision support approaches to assist physicians in providing another option for diagnosing and detecting HD. This paper aims to introduce a heart disease prediction model including phases like (i) Feature extraction, (ii) Feature selection, and (iii) Classification. At first, the feature extraction process is carried out, where the features like a time-domain index, frequency-domain index, geometrical domain features, nonlinear features, WT features, signal energy, skewness, entropy, kurtosis features are extracted from the input ECG signal. The curse of dimensionality becomes a severe issue. This paper provides the solution for this issue by introducing a new Modified Principal Component Analysis known as Multiple Kernel-based PCA for dimensionality reduction. Furthermore, the dimensionally reduced feature set is then subjected to a classification process, where the hybrid classifier combining both Recurrent Neural Network (RNN) and Restricted Boltzmann Machine (RBM) is used. At last, the performance analysis of the adopted scheme is compared over other existing schemes in terms of specific measures.
Keywords: Heart disease prediction; ecg; recurrent neural network; pca; restricted boltzmann machine
Recently, CVDs (Cardiovascular Diseases) is one of the diseases that cause death in millions of people worldwide. Moreover, the normal CVDs consist of heart valve problems, heart failure, ischemic stroke, heart attack, various types of arrhythmia, and hemorrhagic stroke, etc. The heart condition becomes almost an abnormal state due to the CVD; the irregularities in the nervous system and several sinus arrhythmias are detected from the patient's ECG (Electrocardiogram) signals. The diagnostic approach that records and measures the electrical activity of the heart muscles is known as the ECG signal. For attaining the ECG signal, the standard 12 lead system was used frequently. To diagnose the CVD in the patient, the signal processing techniques or frequency domain and time domain were used to reveal the ECG signal's inherent features.
ECG is used widely in various medical researches to identify and interpret heart disorders [1,2]. CHF (Congestive Heart Failure) is one of the heart disorders that is a severe cardiac condition linked with morbidity rates and high mortality rates. Moreover, some of the symptoms of CHF are easy fatigue, generalized swelling, and breathlessness. The blood is not adequately pumped from the heart to the particular organs with nutrients, oxygen, etc. As per ESC (European society of cardiology), around 26 million persons are diagnosed with heart disease, whereas, every year, 3.6 million people are diagnosed newly.
Further, of the patients diagnosed with CHF, nearly 17–45% will die in the first year, and then the rest of patients in five years. Still, the early diagnosis of CHF can treat and so the death rates will be lowered. The ARR (Arrhythmia) is a severe disorder due to the improper heart rate that may cause sudden death of the patient [3]. There are two major classes of ARRs; they are supraventricular and ventricular. In addition, the Ventricular ARRs is occurred in the ventricles (i.e.), the lower chamber of the heart.
In contrast, the supraventricular ARRs occur in the atria (i.e.,), upper chambers of the heart present. Here, the diagnosis of CHF and ARR using the ECG signal required uniform and accurate evaluation by skilled cardiologists, which is time-consuming and tedious. Thus, novel efficient CAD (Computer-aided diagnosis) systems are developed to enhance the diagnostic reliability in the ECG recordings.
The DL (Deep learning) models have been popularly used towards the HD (Heart disease) classification in recent times. In recent years, the premature ventricular contraction beat detection, ECG ARR detection, atrial fibrillation detection, ECG disease classification, and myocardial infarction detection is compared to healthy patients by ML (Machine learning) algorithms [4] or deep NN (neural networks) to predict the heart disease [5,6]. The normal sparsed NN structure is introduced for the HD prediction using the ECG signals to analyze and classify the cardiac ARR. The ECG based HD classification and detection were boasted by the ECG signal features like standard deviation of a beat-to-beat interval, wavelet analysis, VAT, maximum and minimum entropy, DTCWT (Dual tree complex wavelet transformation), R-peak amplitudes, entropy calculation, the standard deviation of a beat-to-beat interval, R–R interval time, etc. The main contribution of the adopted methodology is as follows:
• Proposes a multiple kernel-based PCA for feature space reduction, which concerns the ‘curse of dimensionality.
• Introduces hybrid RBM+RNN classifiers for obtaining the predicted results.
The section of this proposed work is as follows: Section 2 addresses the related works. Section 3 proposed a heart disease prediction model with a hybrid classification system. Section 4 portrays the proposed multiple kernel-based principal component analysis for feature dimensionality reduction. Section 5 describes the hybrid restricted Boltzmann machine-a recurrent neural network for heart disease prediction. Section 6 discussed the results and discussions of the presented work. Then, this paper is concluded in Section 7.
In 2020, Mazaheri et al. [7] had presented the CAD system for the accurate diagnosis and automated classification based on the 7 types of cardiac arrest by the ECG signal. Several ML algorithms were used for classifying the 6 abnormal cardiac functions and normal rhythm. Initially, the pre-processing was performed in the ECG signal, and then the segmentation process would extract the different morphological features, nonlinear indices, and frequency domain features. Specific optimization algorithms have minimized the feature space dimension and remove the irrelevant or redundant features. The proposed model has used the mixture of the extracted features as the NSGA II that provides the best performance. Finally, the performance of the presented method has shown minimum computational complexity, improved recognition sensitivity, maximum precision, and eliminates the misleading data than other conventional models. However, the proposed model did not consider the lower computational time that occurred during the classification of a novel single ECG signal.
In 2020, Eltrass et al. [8] had proposed novel DL methods for the automatic identification of ARR and CHF. The proposed method has implemented a novel ECG diagnosis algorithm combining CNN(Convolutional neural network) with the CQ-NSGT(Constant-Q Non-Stationary Gabor Transform). Moreover, the CQNSGT algorithm was examined to convert the 1-D ECG signal into a 2-D time-frequency representation and then given to the pre-trained CNN approach AlexNet. Furthermore, the AlexNet architecture with the extracted features was used as the relevant features distinguished through the MLP (Multi-layer perceptron) technique into 3 various cases like ARR, NSR, and CHF, respectively. At last, the simulation outcomes of the proposed model have proven better performance than other existing models in terms of specific measures like sensitivity, specificity, and accuracy, correspondingly. CNN with CQ-NSGT algorithm offers higher classification performance, shortest processing time, better diagnosis performance, and faster convergence rate, but the deeper networks were not efficient for the ECG classification.
In 2020, Butun et al. [9] developed an automatic CAD detection from the CapsNet (Capsule Networks) ECG signals. Moreover, the DL-based approaches were more used in the CAD models, and the CapsNet was the novel approach in the proposed model. In addition, a 1D version of CapsNet was used for the automatic detection of CAD on five second-long and two-second ECG segments; however, it was obtained from the 7 CAD and 40 normal subjects. Here, the 1D-CADCapsNet approaches could automatically learn the pertinent representations from the raw ECG data for helping the cardiologists with no hand-crafted technique. In the end, the experimental outcomes of the proposed model have achieved increased specificity, better accuracy, higher precision values, and improved sensitivity, respectively. Nevertheless, the performance of the proposed method for the detection of other cardiac diseases was not tested.
In 2021, Panganiban et al. [10] have introduced the classification process for ECG arrhythmia that utilizes CNN with images based on spectrograms with no ECG visual examination like P-peak or R-peak detection. Additionally, the proposed CNN model disregarded the noise parameters as the ECG data converted to 2D images. In contrast, the suitable characteristics map was extracted from the convolution and the pooling layer. Here, Google's Inception V3 approach was used for retraining the last layer of the CNN model for recognition. The diagnostic support model could enable the acquisition, interpretation, and clinical data analysis, and the ECG bio-signals from patients facilitate the diagnosis of heart disease in rural areas. Finally, the simulation outcomes of the proposed model have attained increased specificity, improved sensitivity, better F1 scores, and higher accuracy, respectively. However, a more enhanced algorithm was needed for classifying the ECG paper.
In 2019, Hasan et al. [11] had developed a new approach for classifying the multiple HD by 1-D deep CNN. Moreover, the modified ECG signal was provided as an input signal, and every signal was decomposed by the higher-order IMFs (Intrinsic mode functions) and the EMD (Empirical mode decomposition). Furthermore, the EMD usage has provided denoising performance as well as a wide range of information. In the CNN architecture, the pre-processed signal was given, and then it classified the record by the SoftMax regressor based on the CVD. The inherent features of the altered ECG signal have shown superior performance compared to the raw ECG signal in the CNN architecture. Finally, the experimental outcomes of the proposed model have proven maximum accuracy robustness, average time complexity, and highest accuracy. However, ECG signals were not separable due to noise.
In 2019, Bhurane et al. [12] have proposed an automated model for CHF diagnosis through the ECG signals. Further, the adopted model was tested on the 4 sets of CHF and normal ECG signals collected from public databases. The short 2 s ECG segments were conducted in the experiments, and 5 different features like Higuchi's fractal dimension, Renyi entropy, Kraskov entropy, fuzzy entropy, and energy were extracted using the frequency localized filter banks of ECG segments. The QSVM (Quadratic support vector machine)was employed in the proposed model for classification and training; however, the evaluation process has used the 10-fold cross-validation models. At last, the experimental outcomes of the adopted method have attained better accuracy, improved sensitivity, increased specificity, and minimum error rate than other traditional schemes. However, different deep learning models were not used for classifying without extracting the features by some datasets and advanced techniques.
In 2019, Tripathy et al. [13] had introduced a new scheme for designing the classifier-based method for CHF detection. Likewise, the proposed method has established the frequency division and the Stock well-transform usage from the ECG signals for analyzing the time-frequency sub-band matrices stemming. The entropy features were assessed from the sub-band matrices of the ECG signal. Moreover, the average distances from the nearest neighbors and the sparse representation classifier for the CHF detection implemented the hybrid classification approach. The normal sinus rhythm and the CHF subjects were validated from public databases by the ECG signals. Finally, the outcome of the adopted model has proven improved accuracy, maximum sensitivity, and better specificity than other models. In this research, the time-frequency analysis was not performed for CHF detection.
In 2019, Acharya et al. [14] have presented the 11-layer deep CNN approach for CHF detection. The proposed CNN method could need the lower pre-processing process, classification, or no engineered features in the ECG signals. Moreover, the adopted approach was entirely–automatic; whereas, the R-peak detection was not needed in work. For testing and training the CNN model, the 4 different sets of data like A, B, C, and D were collected from the Physio Bank. At last, the performance of the proposed method has shown higher accuracy, increased specificity, maximum sensitivity, and faster interpretation than other existing models. This review observed that the CNN methods were not developed for detecting normal ECG, CHF, MI, and CAD signals. Such limitations must be taken into account based on heart disease prediction using the ECG signal in the present work effectively.
3 Proposed Heart Disease Prediction Model with Hybrid Classification System
The proposed scheme based on the HD prediction model includes three significant phases: (i) Feature extraction, (ii) Feature selection (dimensional reduction), and (iii) Classification. The features include a time-domain index, frequency-domain index, geometrical domain features, nonlinear features, WT features, signal energy, skewness, entropy, kurtosis features from the input signal. The curse of dimensionality becomes a severe issue in this aspect. This paper introduces a new Multiple kernel-based PCA for reducing the feature set dimension, which incurs only the needed information or feature to make the classification more precise and accurate. This is to be believed by the proposed dimensionality reduction model. Moreover, the dimensionally reduced feature set is subjected to a classification process, where the hybrid RNN and RBM are used. Fig. 1 represents the overall architecture of the proposed methodology.
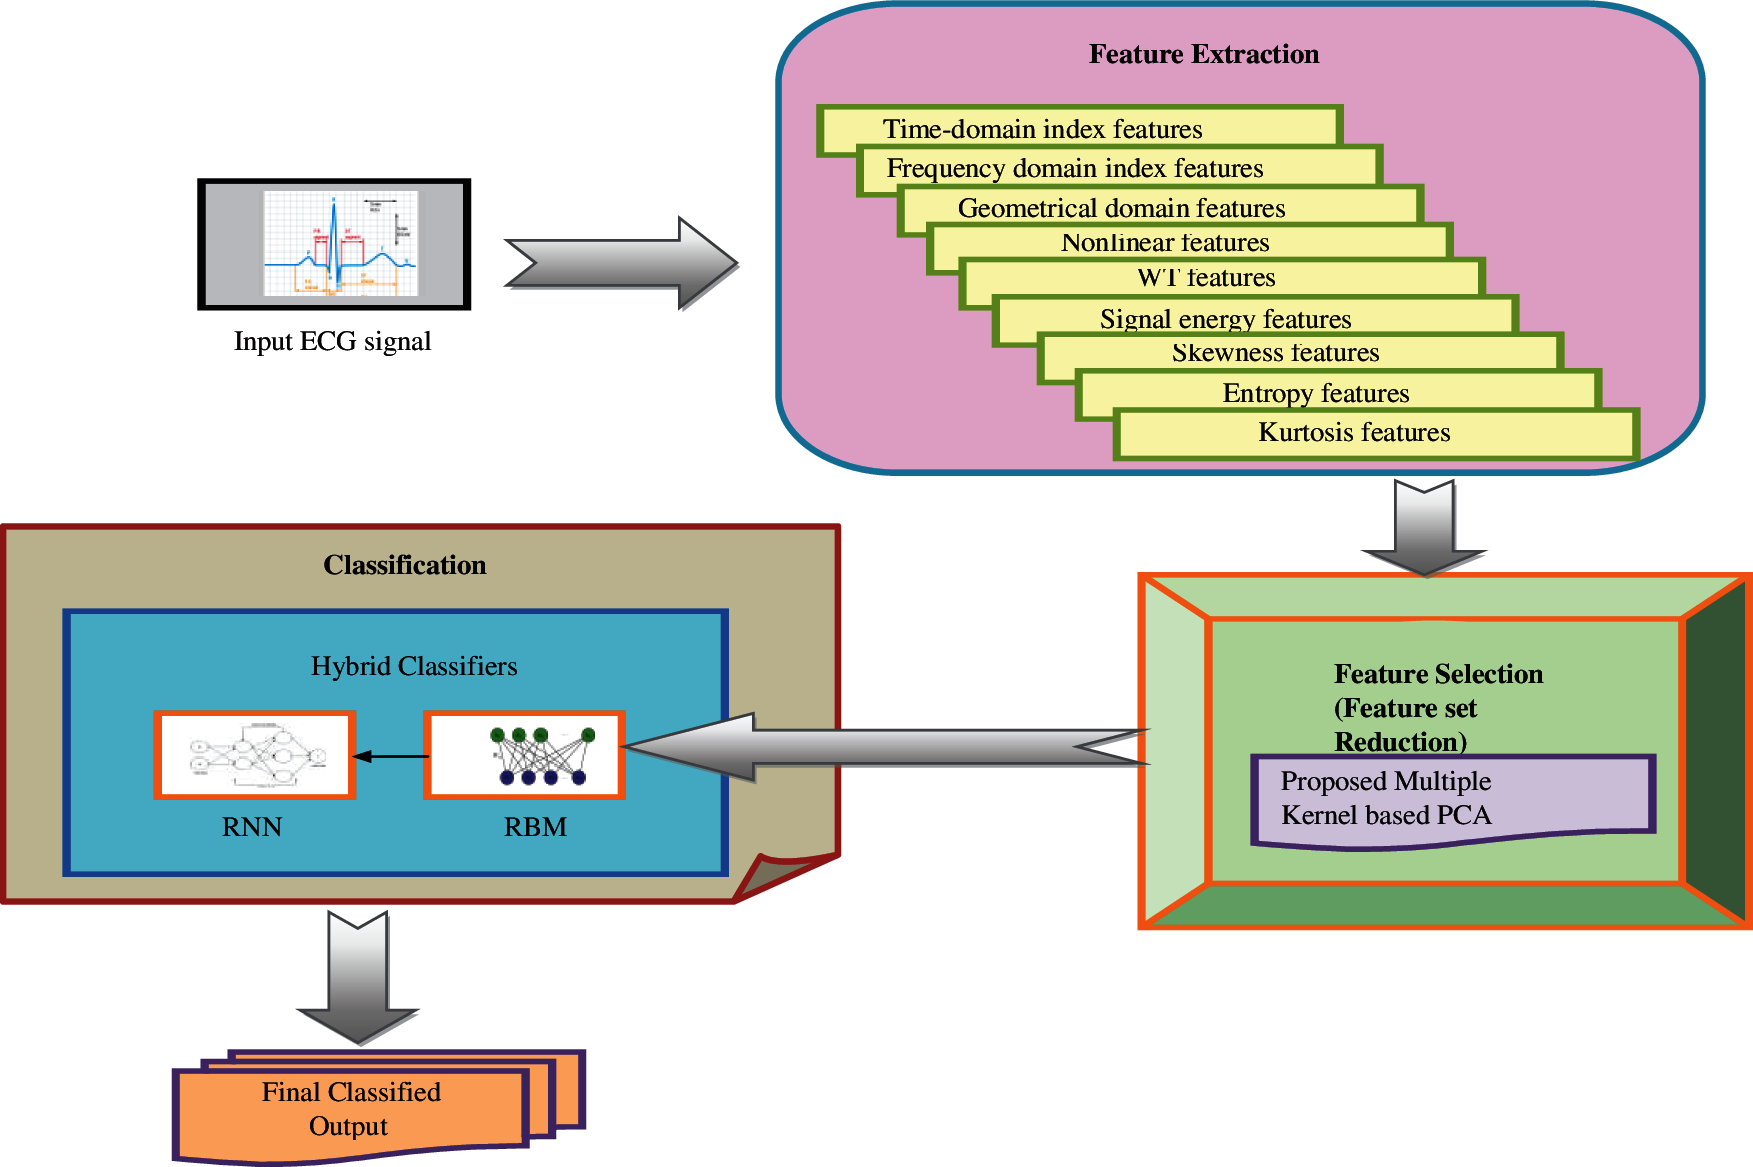
Figure 1: Overall design of the proposed methodology
Feature extraction
The frequency domain and the time domain features are extracted from the input ECG signal. The feature extraction process includes 9 features: time-domain indices, frequency-domain indices, geometrical domain features, nonlinear features, WT features, signal energy, skewness, Kurtosis features, and entropy, respectively. Thus, the extracted energy features are denoted by F.
4 Proposed Multiple Kernel Based PCA for Feature Dimensionality Reduction
The extracted features F have to be selected for the effective classification of HDs from the ECG signals. But the curse of dimensionality is the major problem in the feature sets. To handle this, a new multiple kernel-based PCA is introduced in this work. The multiple kernel function is used in the process modulation of PCA to reduce the dimensions of the feature set.
PCA is the base transformation to diagonalize the estimation of the covariance matrix of data
This work contributes with the data nonlinearly into the feature space, which is done by the multiple kernel function.
Let us consider that the data mapped into feature space
Eq. (2)
Eq. (3)
where n*n matrix k is a kernel matrix, in Eq. (9), A is the feature vector of the kernel matrix. Here, the hybrid kernel function is expressed in Eq. (13).
5 Hybrid RBM-RNN for Heart Disease Classification
This work introduces the hybrid classifier combining the RBM and RNN classifiers for predicting heart disease. The hybrid classifiers are more effective in dealing with complex scenarios that minimize the risks in predicting the disease. As per this paper, the hybrid classifiers process in this way: The extracted features are given as the input to the RBM classifier [15], and then the output of RBM is subjected to the RNN as its input. Finally, the RNN output is considered as the classified output.
5.1 Restricted Boltzmann Machine
The parameterized generative approach that represents the probability distribution is RBM. RBM learning is the adjustment of RBM parameters in the given training data, in which the probability distribution determined through the RBM would fit the possible training data. Moreover, the RBM provides the closed-form with representation after the successful learning in the distribution underlies the training data assisting the interferences relating to the provided data. The RBM is a type of MRF from its structural view, including the hidden and visible layers. There is no connection between the two units inside the same layer, and there is a connection between the visible and hidden units.
Further, the visible units comprise the 1st layer and correspond to the observation components. In addition, the hidden layer provides the dependency among the observation components. Therefore, the RBM is known as a nonlinear feature detector. The standard RBM model consists of a visible layer v with l units representing the hidden layer h with q units and the observable data to capture the dependencies among those observed variables. The real-valued matrix is known as a link matrix w, and the element represented wa,b specifies the weight among the hidden hb and visible unit va s. Let us assume all the hidden units and the visible units as binary variables such as h ∈ {0, 1}q, and v ∈ {0, 1}l. Moreover, the joint probability distribution v, h is determined through the Gibbs distribution with the energy function in Eq. (14).
Here,x indicates the normalization factor and
In Eq. (17), (.) data and (.) model indicates the expectations below the distribution is given as p(h/v) and p(v,h), correspondingly. Eq. (18) illustrates the learning rule for stochastic gradient steepest ascent performance in the log probability of training data.
where γ indicates the learning rate that the user specifies in advance. Since there is no direct connection among the hidden units in RBM, it gets an unbiased sample (vahb) data. Consider a training vector v that is randomly selected; the binary state hb of each hidden unit (b = 1, 2, …, q) is set as 1 with its probability.
Eq. (19) σ(u) indicates the logistic sigmoid function as (1/(1 + exp( − u)). Likewise, the unbiased sample of the state of a visible unit is obtained from the given hidden vector h.
Eq. (19) represents the binary states of the hidden units in parallel. A ‘‘reconstruction’’ is obtained via setting each va to 1 with a probability once the binary states are given to the hidden units as in Eq. (20). Therefore, the weight change is determined in Eq. (21).
Eq. (20) (va,hb ) recon indicates the distribution achieved via running the alternate Gibbs sampling and initializing the data va.
Moreover,
In Eq. (22), the vanilla gradient ascent is obtained if the nonnegative constants
where
5.2 Recurrent Neural Network
The output of RBM is given as the input of the RNN framework. RNN [16] includes an output layer, a hidden layer, and an input layer, in which each layer consists of neurons [17]. Moreover, the input units
Here, the hidden units are connected to the output layer by the weight matrix
In addition, the RNN has different weight parameters, including the weight matrix
Step 1: The weight matrices are
Step 2: Moreover, the prediction is calculated by the Forward propagation. The RNN forward pass is given in Eqs. (26)–(29), correspondingly. The
Step 3: The loss function is determined in Eq. (30).
Eq. (30) N specifies the count of possible class labels, z indicates the binary indicator that checks whether the class label cl s are classified correctly for the observation obs. In addition, the predicted probability of the model is denoted as r.
Step 4: Compute the gradients through the back-propagation.
Thus, the output is obtained from the RNN is the final predicted outcome.
The proposed HD prediction model was executed in Python, and their resultant outcomes were observed. Moreover, the performance of the adopted scheme was compared to the existing classifiers like NN [18], RF [19], SVM, and KNN [20], in terms of specific measures like Accuracy, Bookmakers Informedness, FDR, FNR, FOR, F-Measure, MCC, NPV, Precision, Recall, specificity, Sensitivity, and Threat score, respectively. The analysis was performed for each measure considering the reduced feature set to 15, 20, 25, and 30 via proposed multiple kernel-based PCA. The analysis is carried out here by varying the learning percentage from 40, 50, 60, 70, and 80. Further, the statistical analysis was done for the proposed model over the other traditional schemes based on specific case scenarios like best, worst, mean, median, and standard deviation performances. The MIT-BIH arrhythmia from physio net database were used for evaluation includes 48 ECG recordings which is downloaded from the link “https://www.physionet.org/content/mitdb/1.0.0/”.
6.2 Performance Analysis by Varying Reduced Feature Set
Figs. 2–5 represent the adopted model's performance analysis compared to the existing schemes like NN, RF, SVM, and KNN by varying the reduced feature sets to 15, 20, 25, and 30, respectively. Moreover, the proposed RBM+RNN model has attained better outcomes for specific measures like accuracy, Bookmaker Informedness, FOR, NPV, MCC, and Threat score. From the graph, it is observed that the accuracy of the proposed RBM+RNN model at the 80th training percentage is 87.36%, 5.26%, 24.21%, and 26.31% superior to the traditional models like NN, RF, SVM, and KNN, respectively, with 15 feature set in Fig. 2. Further, in Fig. 3, the bookmarker Informedness of the adopted RBM+RNN model holds the maximum value (∼0.9) for 20 feature sets; however, the conventional models attain the minimum value for NN (∼0.75), RF (∼0.8), and SVM (∼0.7), correspondingly at 80th training percentage. In addition, the adopted RBM+RNN method achieves the highest NPV values for 20 feature set at 70th training percentage than other existing schemes in Fig. 4. Likewise, in Fig. 4, the proposed RBM+RNN model for 25 feature sets attains a lower FOR value (∼0.15) with better performance than other traditional models such as NN, RF, SVM, and KNN, respectively, at 50th training percentage. Similarly, on examining the 30-feature set in Fig. 5, the MCC of the adopted RBM+RNN model holds the highest values at 70th training percentage than other existing schemes like NN, RF, SVM, and KNN, respectively. Finally, the threat score of the proposed RBM + RNN model for 30 feature sets is 95.55%, 5.55%, 20%, and 22.22% better than other traditional models such as NN, RF, SVM, and KNN, respectively at 80th training percentage. Thus, the betterment of the adopted RBM + RNN model is validated effectively.
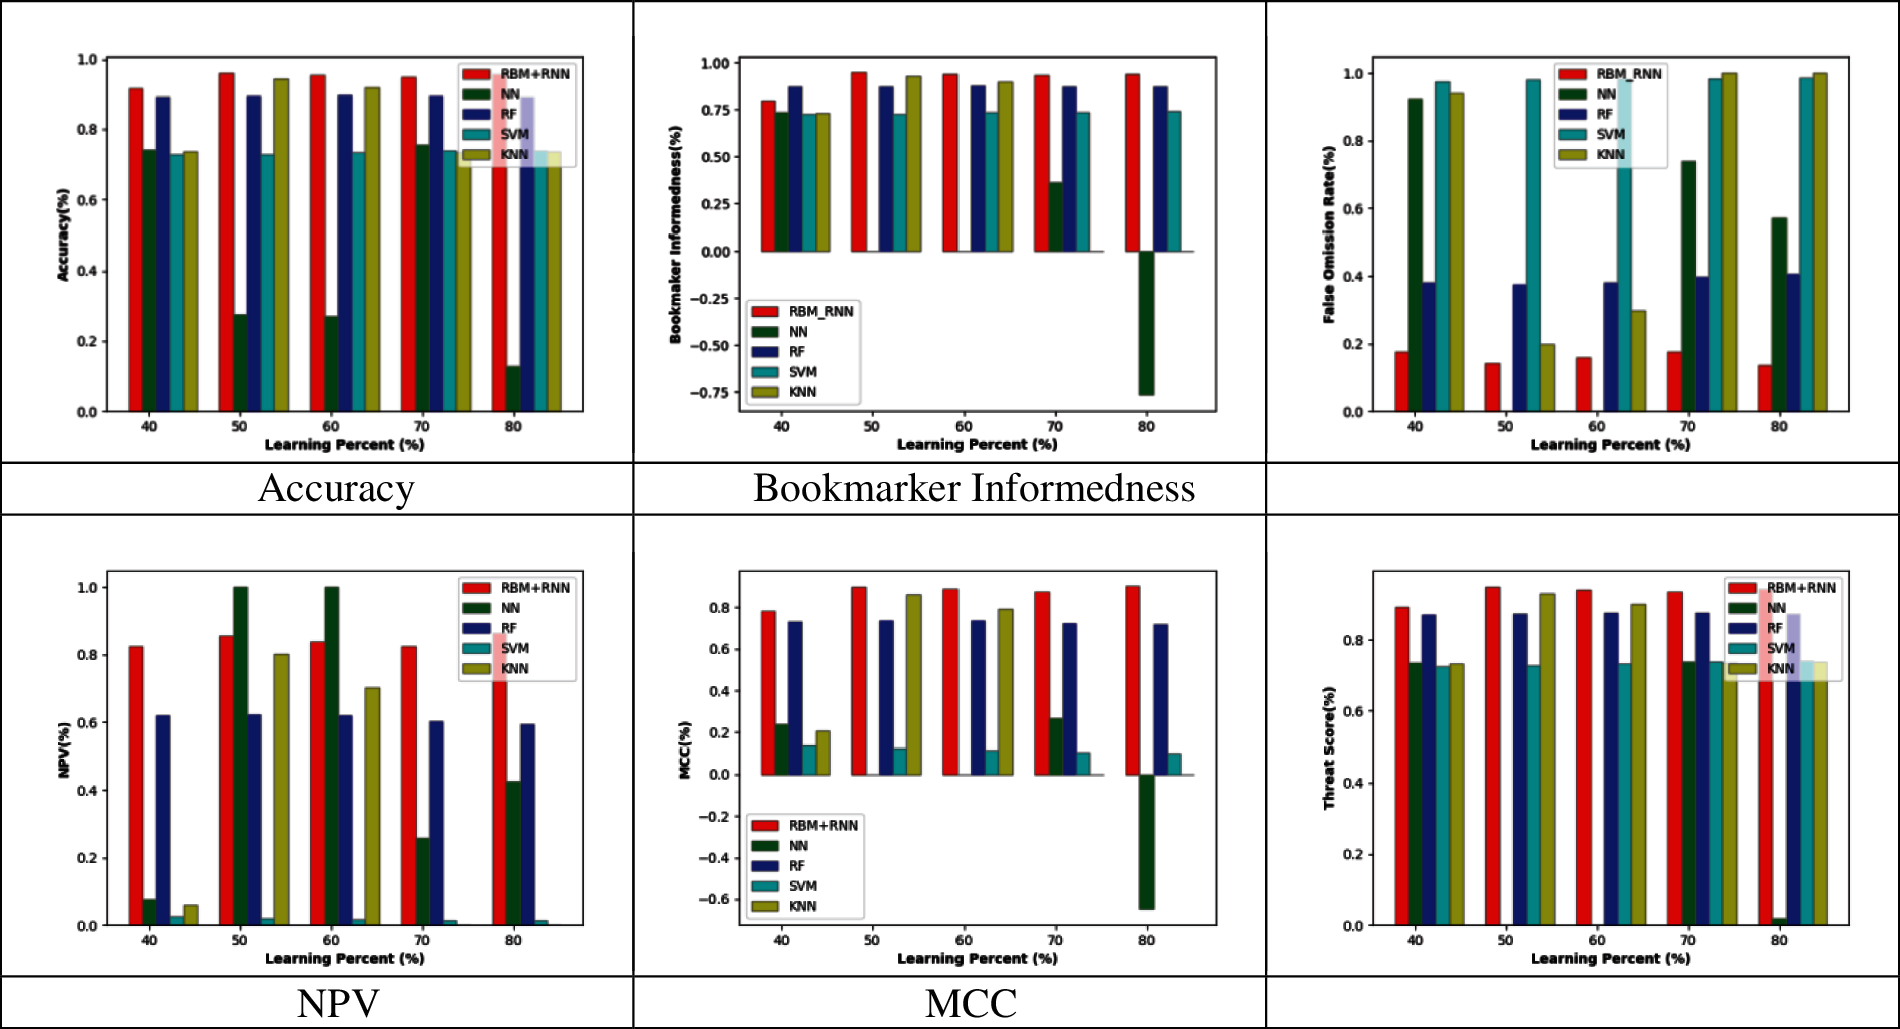
Figure 2: Performance analysis by varying the reduced 15 feature set
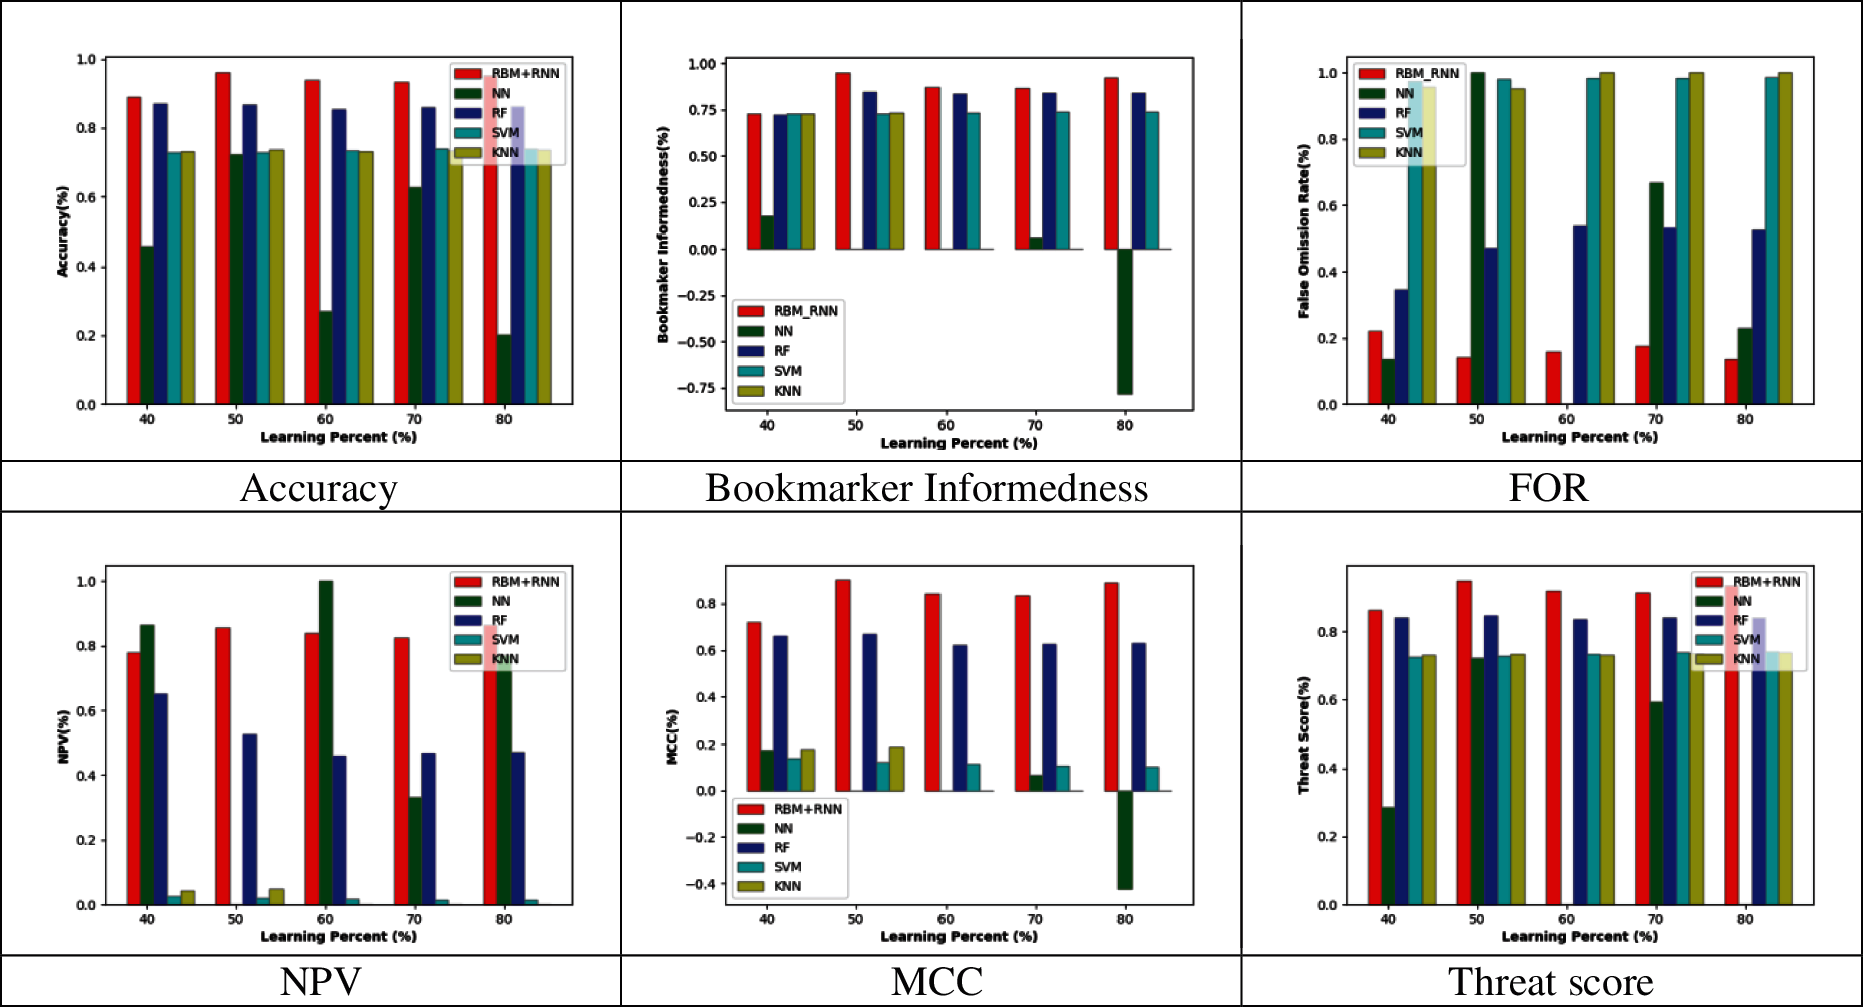
Figure 3: Performance analysis by varying the reduced 20 feature set
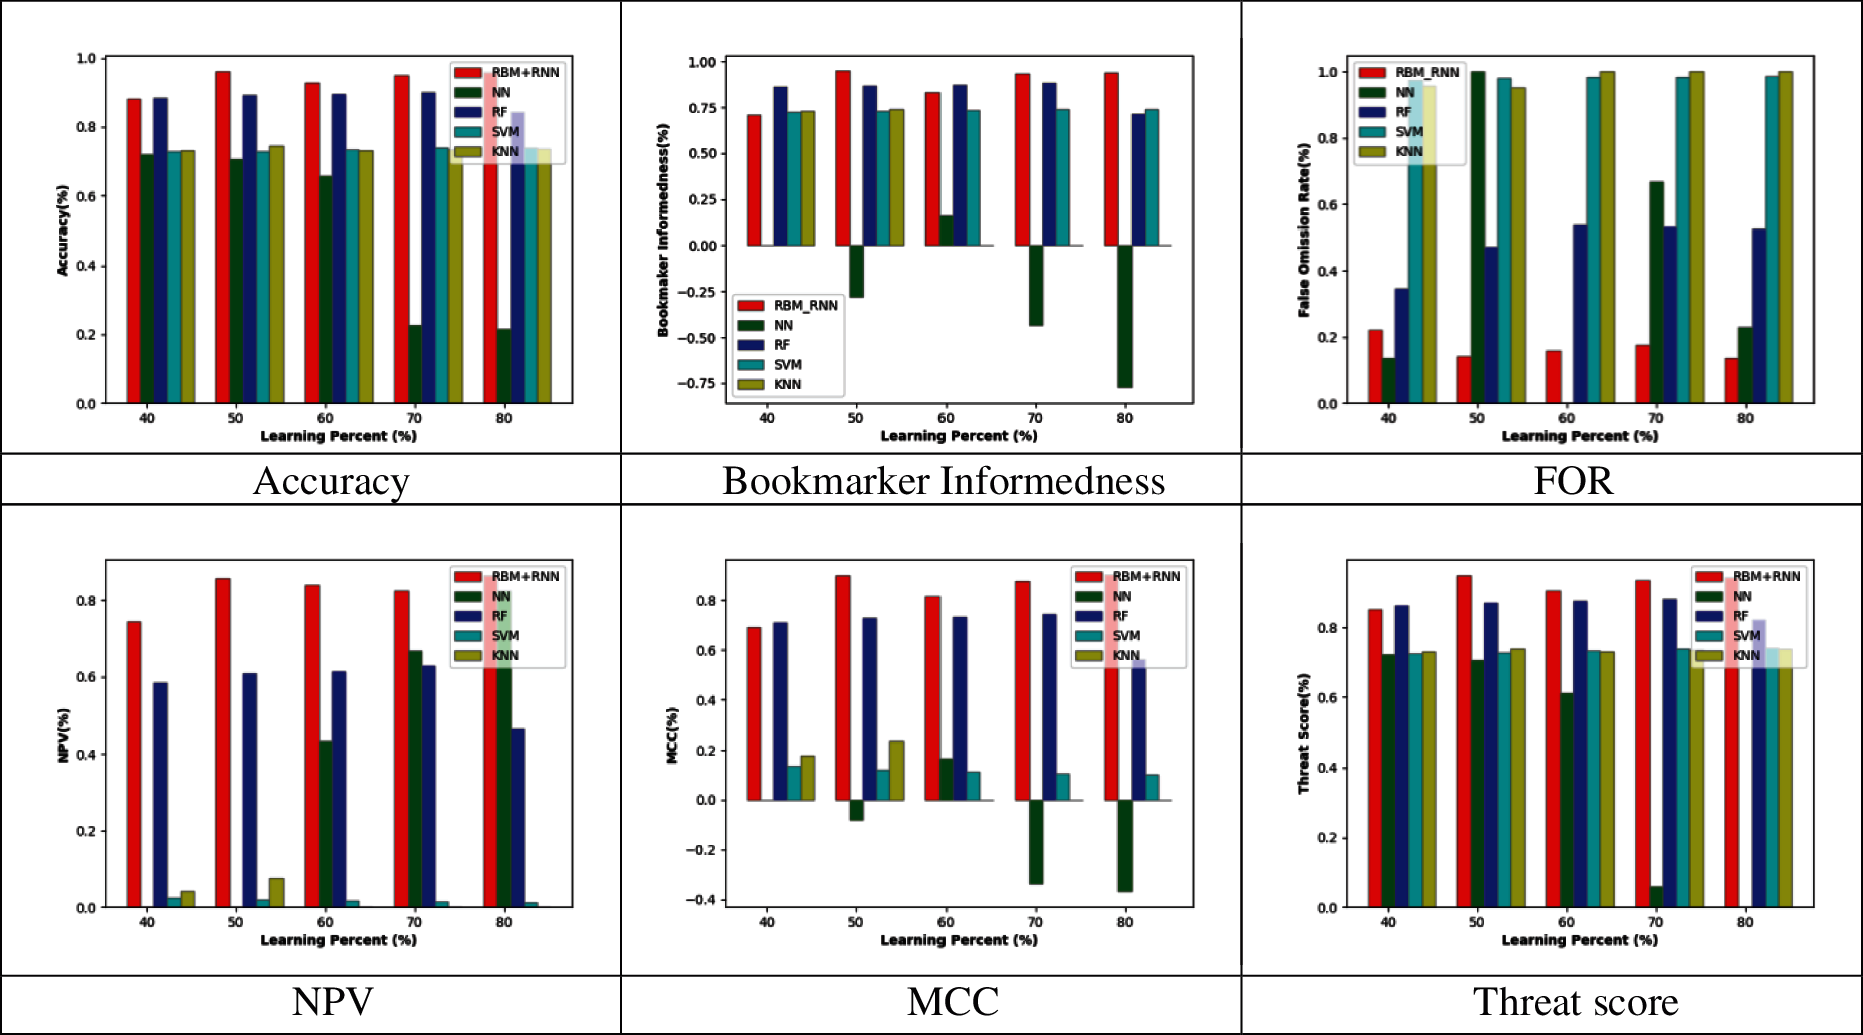
Figure 4: Performance analysis by varying the reduced 25 feature set
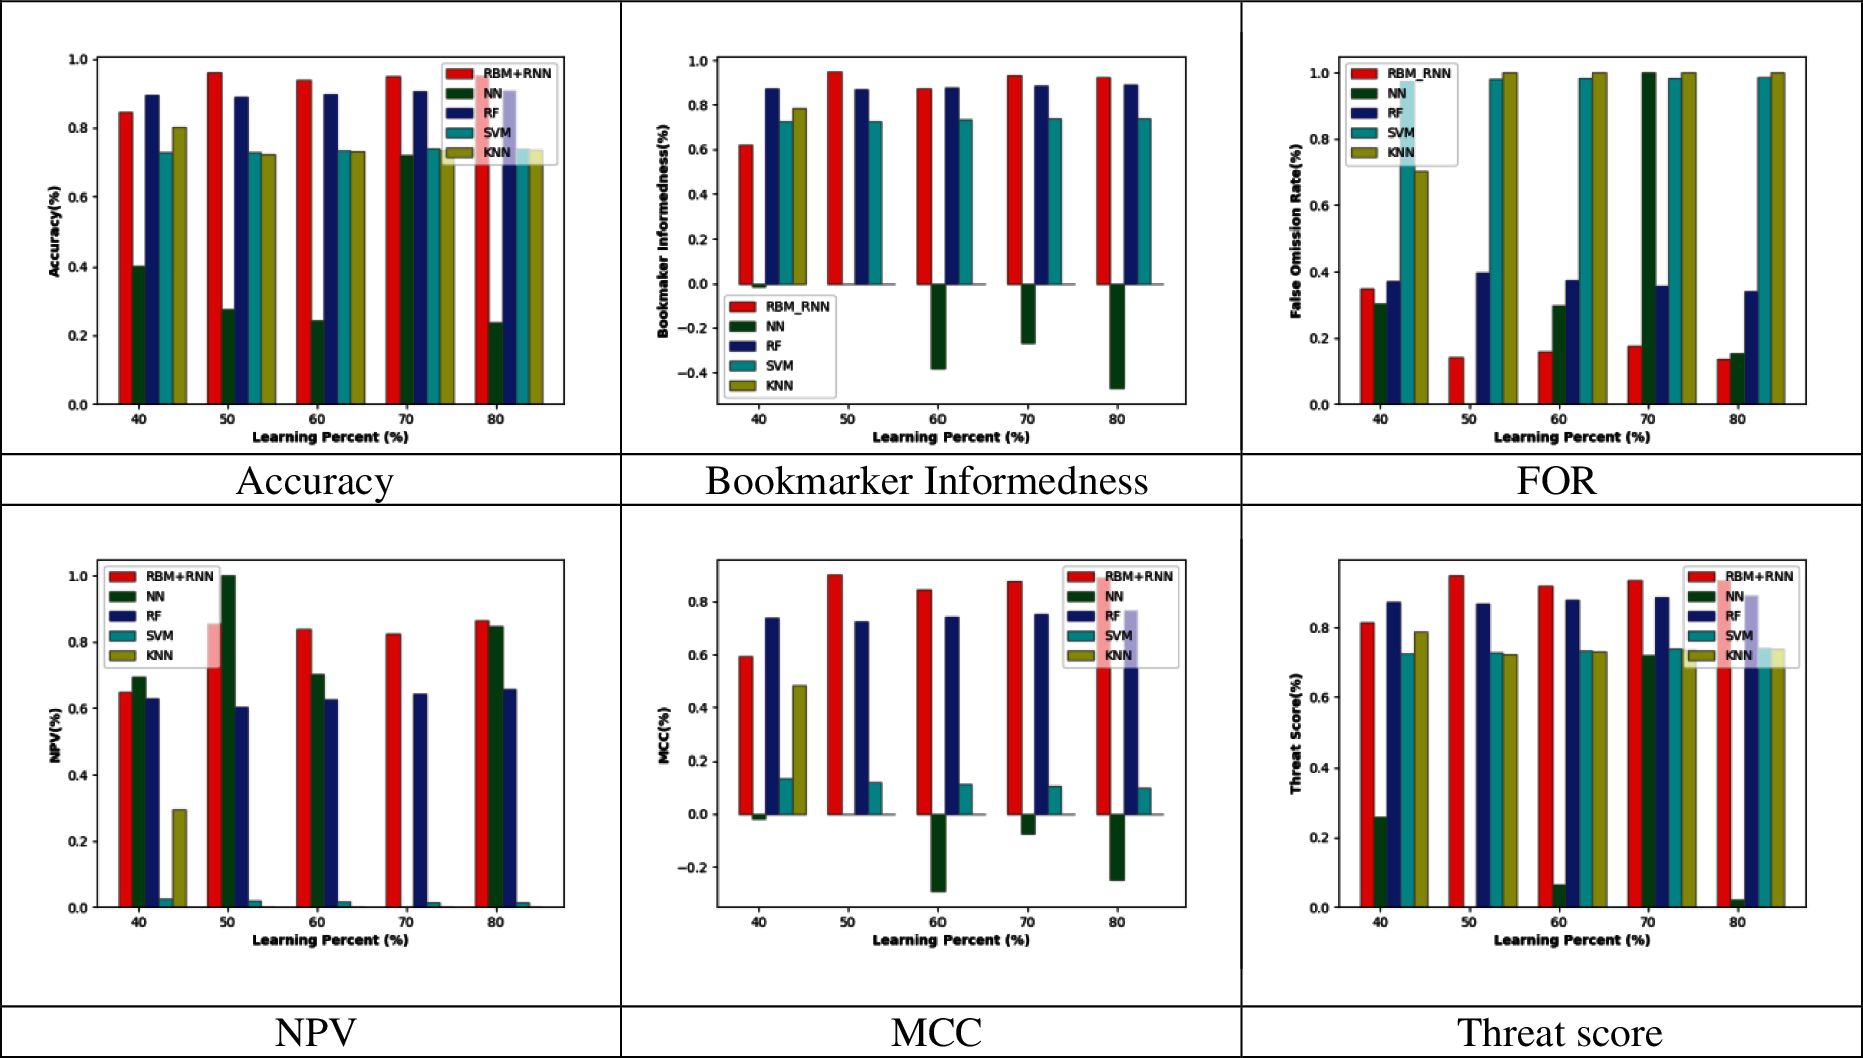
Figure 5: Performance analysis by varying the reduced 30 feature set
6.3 Feature Analysis Based on Varying Learning Percentage
The feature analysis of the proposed model with a feature set reduction over without feature set reduction for all the performance measures like Recall, Accuracy, FOR, Specificity, Bookmaker Informedness, Precision, MCC, F-Measure, Threat Score, NPV, Sensitivity, FNR, Markedness, and FDR, respectively are illustrated in Tabs. 1–3. This analysis is carried out for all the learning percentages like 50, 60, and 70, respectively. Moreover, in Tab. 1 the proposed work with a reduced feature set provides less FNR and FOR, indicating less error rate during prediction. The FDR value is 0 for both proposed models with feature selection and without feature selection for learning percentage 50. Likewise, the MCC value is higher (0.888698) for a proposed model with feature selection than the model without (0.808576) for 60 learning percentages in Tab. 2. Hence, it is proved that the adopted work is more apt to predict heart disease with the appropriate information (reduced feature set).


Tabs. 4–8 represents the statistical analysis of the adopted RBM + RNN model with feature selection and traditional models like NN, RF, SVM, KNN, RBM+PCA, and RBM for various measures such as accuracy, bookmaker Informedness, FOR, NPV, MCC, and Threat score, respectively. From the statistical analysis outcomes, the accuracy of the proposed RBM + RNN model with feature reduction attains maximum values for a best-case scenario than other traditional models like NN, RF, SVM, KNN, RBM+PCA, and RBM, respectively in Tab. 4. Moreover, under a worst-case scenario, the FOR of the proposed RBM+RNN model with feature reduction attains a lower value (0.175824) with better performance; however, the traditional models attain higher values for NN (0.923729), RF (0.405405), SVM (0.986486), KNN (1), RBM+PCA (1), and RBM (0.391813), respectively in Tab. 5. The mean performance of the proposed RBM+ RNN model with feature reduction for NPV measure in Tab. 6 is 34.29%, 27.30%, 97.80%, 62.86%, 67.41%, and 16.95% superior to the traditional models like NN, RF, SVM, KNN, RBM + PCA, and RBM, respectively. Likewise, in Tab. 8, the median performance of the adopted RBM + RNN model with feature reduction holds better threat score values (0.941358) compared to the existing models like NN, RF, SVM, KNN, RBM + PCA, and RBM, correspondingly. Thus, the statistical analysis outcome proves the superiority of the proposed RBM + RNN model with feature reduction.


This paper has introduced a heart disease prediction model including phases like (i) Feature extraction, (ii) Feature selection, and (iii) Classification. At first, the feature extraction process was carried out, where the features like a time-domain index, frequency-domain index, geometrical domain features, nonlinear features, WT features, signal energy, skewness, entropy, kurtosis features were extracted from the input ECG signal. The curse of dimensionality becomes a severe issue. This paper provides the solution for this issue by introducing a new Modified Principal Component Analysis known as Multiple Kernel-based PCA for dimensionality reduction. Furthermore, the dimensionally reduced feature set was then subjected to a classification process, where the hybrid classifier combining both RNN and RBM was used.
At last, the performance analysis of the adopted model was compared to the existing schemes models for certain measures. From the graph, the bookmarker Informedness of the adopted RBM+RNN method holds the maximum value (∼0.9) for 20 feature sets; however, the conventional models attain the minimum value for NN (∼0.75), RF (∼0.8), and SVM (∼0.7), correspondingly at 80th training percentage. The threat score of the proposed RBM+RNN model for 30 feature sets was 95.55%, 5.55%, 20%, and 22.22% better than other traditional models such as NN, RF, SVM, and KNN, respectively at 80th training percentage. Likewise, the median performance of the adopted RBM+RNN model with feature reduction holds better threat score values (0.941358) when compared to the existing models like NN, RF, SVM, KNN RBM + PCA, and RBM, correspondingly.
Funding Statement: The authors received no specific funding for this study.
Conflicts of Interest: The authors declare that they have no conflicts of interest to report regarding the present study.
1. X. C. Li, X. H. Liu, and R. H. Mead, “Evaluation of left ventricular systolic function using synchronized analysis of heart sounds and the electrocardiogram,” Heart Rhythm, vol. 17, no. 5, pp. 876–880, 2020. [Google Scholar]
2. G. D. Poian, C. J. Rozell, R. Bernardini, R. Rinaldo, and G. D. Clifford, “Matched filtering for heart rate estimation on compressive sensing ECG measurements,” IEEE Transactions on Biomedical Engineering, vol. 65, no. 6, pp. 1349–1358, 2018. [Google Scholar]
3. V. B. Lakshmi, D. Ramchandra, and D. Geeta, “Arrhythmia classification using cat swarm optimization-based support vector neural network,” Journal of Networking and Communication Systems, vol. 1, no. 1, pp. 28–35, 2018. [Google Scholar]
4. R. L. Devi and V. Kalaivani, “Machine learning and IoT-based cardiac arrhythmia diagnosis using statistical and dynamic features of ECG,” The Journal of Supercomputing, vol. 76, no. 76, pp. 6533–6544, 2020. [Google Scholar]
5. V. H. Arul, V. G. Sivakumar, R. Marimuthu and B. Chakraborty, “An approach for speech enhancement using deep convolutional neural network,” Multimedia Research, vol. 2, no. 1, pp. 37–44, 2019. [Google Scholar]
6. T. C. S. Rao, S. S. T. Ram, and J. B. V. Subrahmanyam, “Enhanced deep convolutional neural network for fault signal recognition in the power distribution system,” Journal of Computational Mechanics, Power System and Control, vol. 2, no. 3, pp. 39–46, 2019. [Google Scholar]
7. V. Mazaheri and H. Khodadadi, “Heart arrhythmia diagnosis based on the combination of morphological, frequency and nonlinear features of ECG signals and metaheuristic feature selection algorithm,” Expert Systems with Applications, vol. 161, art. no. 113697, 2020. [Google Scholar]
8. S. A. Eltrass, B. M. Tayel, and I. A. Ammar, “A new automated CNN deep learning approach for identifying ECG congestive heart failure and arrhythmia using constant-Q non-stationary gabor transform,” Biomedical Signal Processing and Control, vol. 65, art. no. 102326, 2020. [Google Scholar]
9. E. Butun, O. Yildirim and U. R. Acharya, “1D-Cadcapsnet: One-dimensional deep capsule network for coronary artery disease detection using ECG signals,” Physica Medica, vol. 70, pp. 39–48, 2020. [Google Scholar]
10. B. E. Panganiban, C. A. Paglinawan, and S. G. L. Paa, “ECG diagnostic support system (EDSSA deep learning neural network-based classification system for detecting ECG abnormal rhythms from a low-powered wearable biosensor,” Sensing and Bio-Sensing Research, vol. 31, p.100398, 2021. [Google Scholar]
11. N. I. Hasan and A. Bhattacharjee, “Deep learning approach to cardiovascular disease classification employing modified ECG signal from empirical mode decomposition,” Biomedical Signal Processing and Control, vol. 52, pp. 128–140, 2019. [Google Scholar]
12. A. A. Bhurane, M. Sharma and U. R. Acharya, “An efficient detection of congestive heart failure using frequency localized filter banks for the diagnosis with ECG signals,” Cognitive Systems Research, vol. 55, pp. 82–94, 2019. [Google Scholar]
13. R. K. Tripathy, R. A. M. Paternina and R. G. Naik, “Automated detection of congestive heart failure from electrocardiogram signal using stockwell transform and hybrid classification scheme,” Computer Methods and Programs in Biomedicine, vol. 173, pp. 53–65, 2019. [Google Scholar]
14. U. R. Acharya, H. Fujita, S. L. Oh, Y. Hagiwara, J. H. Tan et al., “Deep convolutional neural network for the automated diagnosis of congestive heart failure using ECG signals,” Applied Intelligence, vol. 49, pp. 16–27, 2019. [Google Scholar]
15. C. D. Velusamy and K. Ramasamy, “Ensemble of heterogeneous classifiers for diagnosis and prediction of coronary artery disease with reduced feature subset,” Computer Methods and Programs in Biomedicine, vol. 198, p. 105770, 2021. [Google Scholar]
16. H. Y. Jan, M. F. Chen, T. C. Fu, W. C. Lin, C. L. Tsai et al., “Evaluation of coherence between ECG and PPG derived parameters on heart rate variability and respiration in healthy volunteers with/without controlled breathing,” Journal of Medical and Biological Engineering, vol. 39, pp. 783–795, 2019. [Google Scholar]
17. L. J. Kao and C. C. Chiu, “Application of integrated recurrent neural network with multivariate adaptive regression splines on SPC-EPC process,” Journal of Manufacturing Systems, vol. 57, pp. 109–118, 2020. [Google Scholar]
18. M. Hammad, A. Maher, and M. Amrani, “Detection of abnormal heart conditions based on characteristics of ECG signals,” Measurement, vol. 125, pp. 634–644, 2018. [Google Scholar]
19. T. Lan, H. Hu, C. Jiang, G. Yang, and Z. Zhao, “A comparative study of the decision tree, random forest, and convolutional neural network for spread-F identification,” Advances in Space Research, vol. 65, pp. 2052–2061, 2020. [Google Scholar]
20. V. Gupta, V. Mittal and M. Mittal, “Chaos theory and ARTFA: Emerging tools for interpreting ECG signals to diagnose cardiac arrhythmias,” Wireless Personal Communications, vol. 118, pp. 3615–3646, 2021. [Google Scholar]
 | This work is licensed under a Creative Commons Attribution 4.0 International License, which permits unrestricted use, distribution, and reproduction in any medium, provided the original work is properly cited. |