DOI:10.32604/csse.2022.020619
| Computer Systems Science & Engineering DOI:10.32604/csse.2022.020619 | |
| Article |
Machine Learning Technique to Detect Radiations in the Brain
1Department of Computer Science and Engineering, Kongu Engineering College, Erode, 638060, India
2School of Computing Science and Engineering, VIT Bhopal University, Bhopal, 466114, India
3Department of Computer Science, CHRIST (Deemed to be University), Bangalore, 560029, India
4Department of Computer Science and Engineering, CHRIST (Deemed to be University), Bangalore, India
5Department of Computer Science and Engineering, Erode Sengunthar Engineering College, Thudupathi, 638057
6Department of EEE, M.Kumarasamy College of Engineering, Karur, 639113, Tamilnadu, India
*Corresponding Author: E. Gothai. Email: egothairesearch1@yahoo.com
Received: 31 May 2021; Accepted: 19 July 2021
Abstract: The brain of humans and other organisms is affected in various ways through the electromagnetic field (EMF) radiations generated by mobile phones and cell phone towers. Morphological variations in the brain are caused by the neurological changes due to the revelation of EMF. Cellular level analysis is used to measure and detect the effect of mobile radiations, but its utilization seems very expensive, and it is a tedious process, where its analysis requires the preparation of cell suspension. In this regard, this research article proposes optimal broadcasting learning to detect changes in brain morphology due to the revelation of EMF. Here, Drosophila melanogaster acts as a specimen under the revelation of EMF. Automatic segmentation is performed for the brain to attain the microscopic images from the prejudicial geometrical characteristics that are removed to detect the effect of revelation of EMF. The geometrical characteristics of the brain image of that is microscopic segmented are analyzed. Analysis results reveal the occurrence of several prejudicial characteristics that can be processed by machine learning techniques. The important prejudicial characteristics are given to four varieties of classifiers such as naïve Bayes, artificial neural network, support vector machine, and unsystematic forest for the classification of open or nonopen microscopic image of D. melanogaster brain. The results are attained through various experimental evaluations, and the said classifiers perform well by achieving 96.44% using the prejudicial characteristics chosen by the feature selection method. The proposed system is an optimal approach that automatically identifies the effect of revelation of EMF with minimal time complexity, where the machine learning techniques produce an effective framework for image processing.
Keywords: Electromagnetic field radiations; brain morphology; segmentation; machine learning; image processing
In recent years, the usage of the smart phones and its sales increased enormously. Owing to this increase, the radio frequency–electromagnetic field (EMF) radiations spread everywhere in the environment, which affects the brain of humans and other organisms in various ways. The revelation of EMF may explain neurological changes that affect the morphological and electrical characteristics of the nervous system [1]. The increase in tumor development in the brain is also due to the increase in the number of users of mobile phones, which creates risk to human life [2].
To make people aware about the effect of radio frequency–EMF, the International Agency for Research on Cancer (IARC), an arm of the World Health Organization, released a report indicating that the exposure of human beings to radio frequency–EMF results in a high chance of cancer [3]. This report from the IARC made people aware of the ill effects of radiations produced by cell phones.
Various studies by the International Organization specified that if human beings and animals are exposed to radio frequency–EMF, then the possibility of affecting the brain's nervous system arises. Apart from cancer, these radiations cause various biological effects to human beings, animals, and insects such as blood–brain barrier, learning and memory, neuronal calcium channels, myelin sheath, and autophagic activities in neurons.
This article is arranged in the following sequence: Section 1 deals with the introduction. Section 2 briefly explains the literature review of all existing papers. Section 3 discusses the proposed technique, optimal broadcasting learning to detect changes in brain morphology due to revelation of EMF. Section 4 presents a case study, which illustrates optimal broadcasting learning to detect the changes in brain morphology due to revelation of EMF. Section 5 compares the proposed system with the existing system. Section 6 deals with the conclusion.
The existing report explored the effect of EMF on spinal cord morphology and motor processing in female rat pups during pregnancy. This report also mentioned that the revelation of EMF in pregnancy disturbs the growth of rat pups. Another report exposed the truth of effects of radio frequency that affects the gabaergic system in the brain of rats, and EMF tempts the glial reaction and biochemical variations in the rat brain [4].
Numerous experiments were conducted by researchers during which they analyzed the effect of microwave vulnerability on the spatial memory of rats [5]. Similarly, various experiments and studies were conducted to check the memory, nervous system, and hippocampal pyramidal cells of animals after EMF radiations [6]. Another researcher stated that microwave revelation resulted in a rise in deoxyribonucleic acid in rat brain [7]. Predominantly, insects were chosen for the experiment, and Drosophila melanogaster is mostly used for research study due to its high resistance than the animals [8]. Researchers believe that if D. melanogaster is affected by any of the radiations, then the possibility that those radiations will affect human beings as well as animals is high.
In the existing system, cellular level analysis is used to detect the effect of radio frequency–MF on the deoxyribonucleic acid of D. melanogaster. However, using the traditional cellular level analysis has the following disadvantages: The effect of radio frequency–EMF on D. melanogaster can be found using the dominant geometrical features of D. melanogaster, but recognizing this is quite challenging because the structure of D. melanogaster varies for each sample in the microscopic image.
The major drawback of using cellular level analysis is that it will not show any difference between the microscopic image of D. melanogaster taken before and after subjecting it to radio frequency–EMF. The brain of D. melanogaster is small such that even a small change in chemical provides a large variation in the result. Determining the vulnerability becomes highly impossible because the color of the D. melanogaster brain will not change even after it is kept under radio frequency–EMF.
3 Optimal Broadcasting Learning to Identify Changes in Brain Morphology
To overcome the drawback of the existing system, the proposed technique uses optimal broadcasting learning to detect changes in brain morphology due to cell death and deoxyribonucleic acid from revelation of radio frequency–EMF. Fig. 1 presents the flow diagram of the proposed technique.
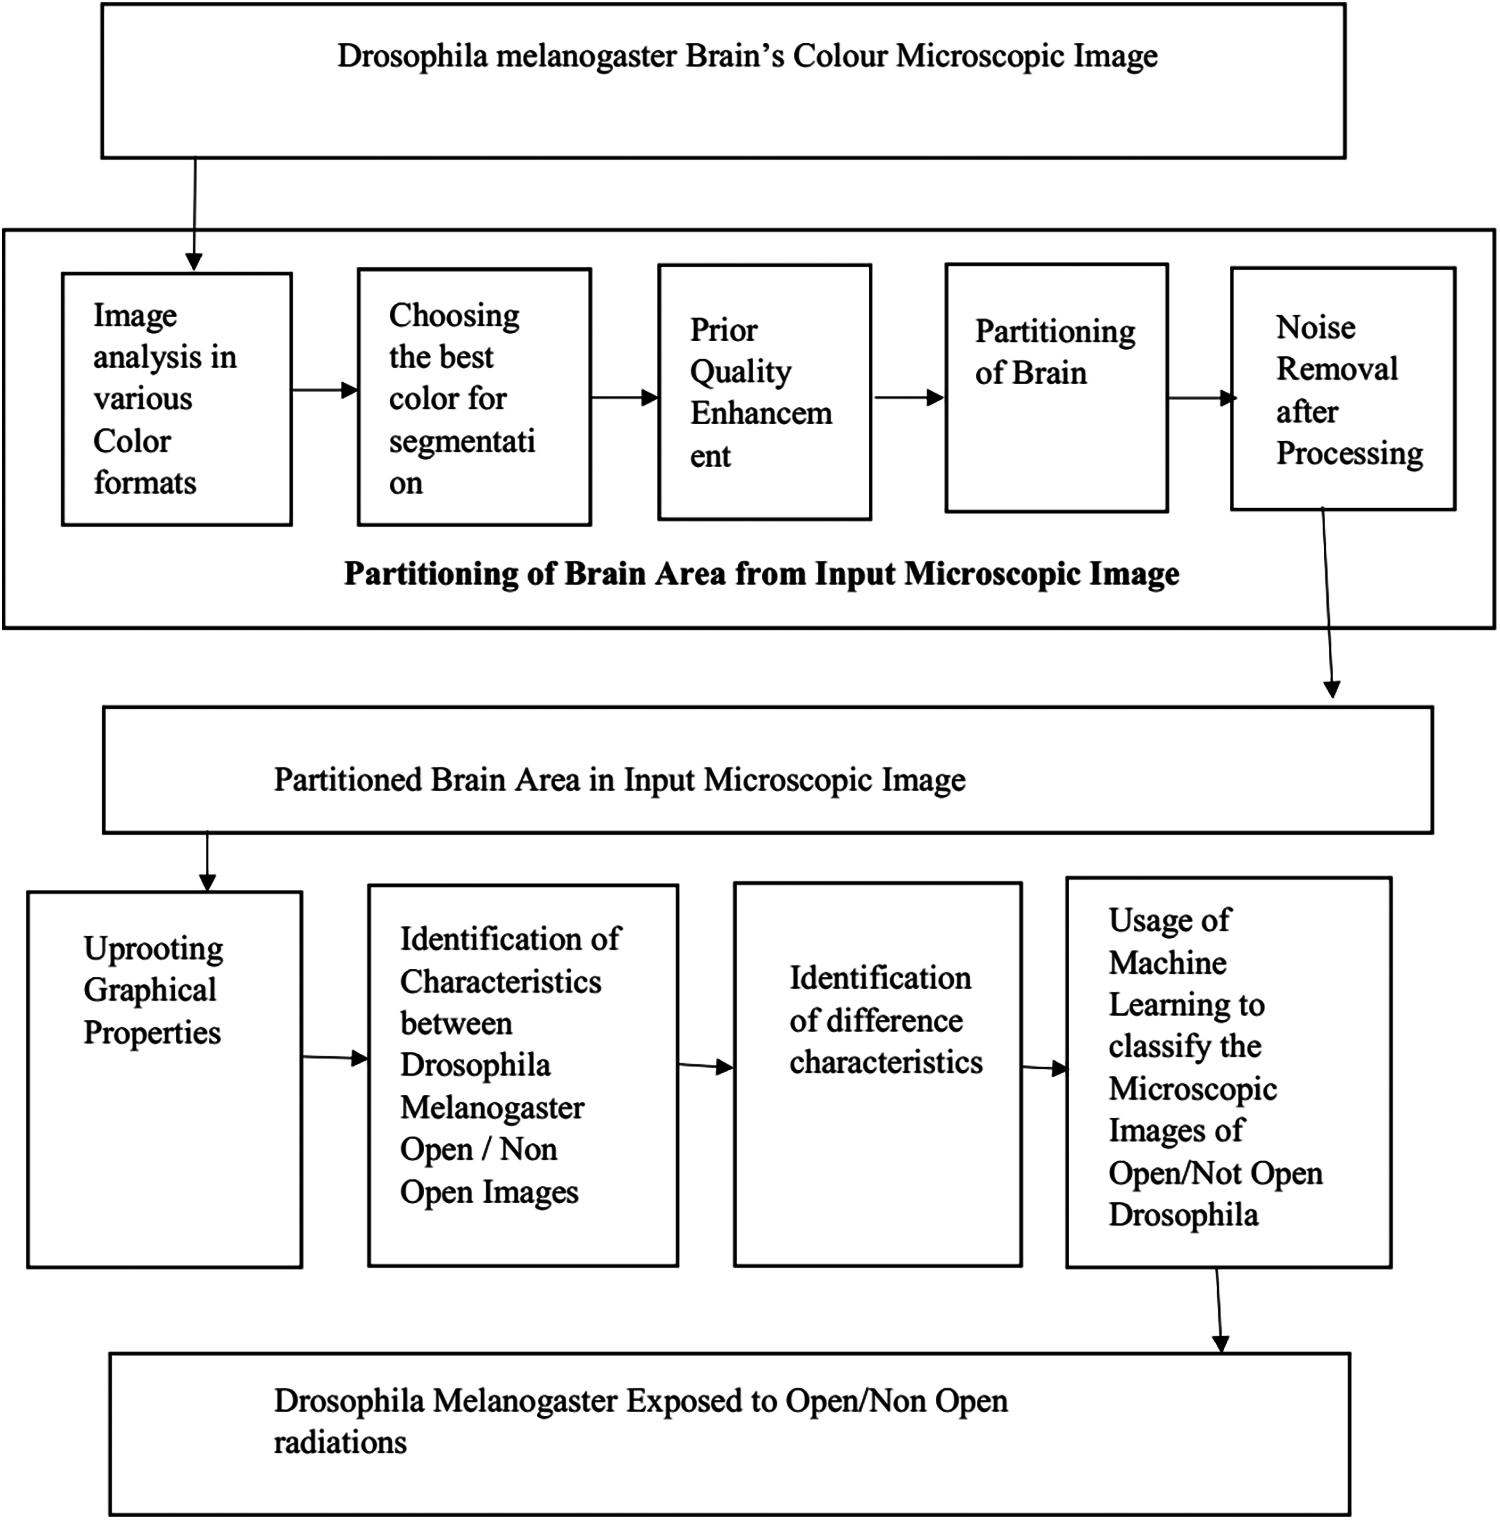
Figure 1: Flow diagram for detecting the effect of EMF radiation on morphology
D. Melanogaster was selected as the specimen to detect the effect of EMF radiations on the brain using machine learning. D. Melanogaster was collected and kept at room temperature maintained at 25°C±1°C, and the specimen was kept under relative humidity of 70% for half day continuously for 5 days. To produce EMF radiations, 2400 MHz of horn antennae experimental was set up. The computed power density was maintained at 29 mW/m2. During this experiment, the EMF source produced 1800–2700 MHz frequency with an antennae gain of 10 dB (relative). Fig. 2 depicts the flow diagram of the exposure chamber. The temperature of the chamber was maintained at 25°C ± 0.1°C to avoid effects caused by thermal energy during this process.
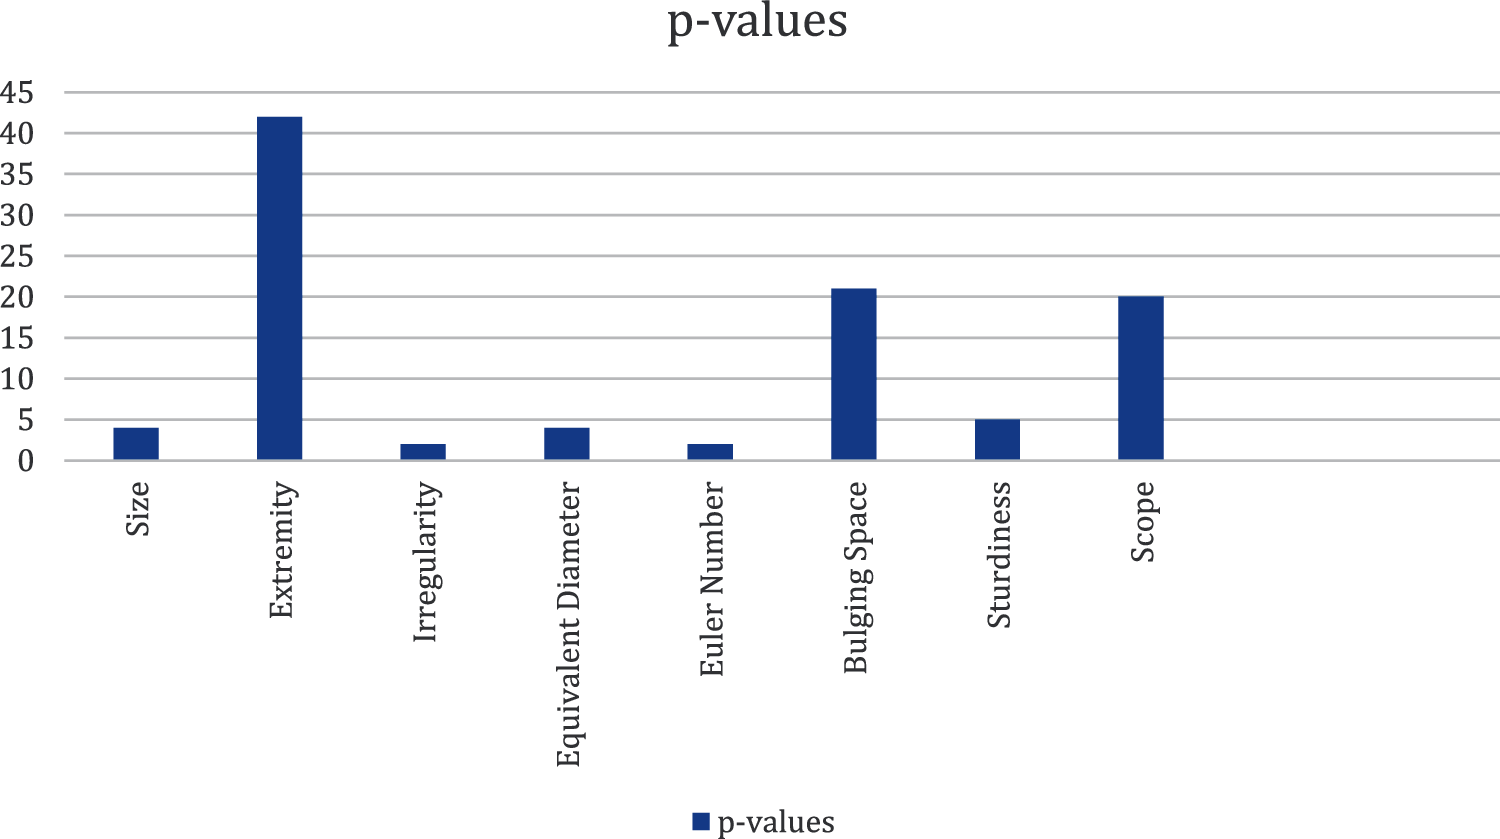
Figure 2: P values for obtained structural characteristics
Similarly, another five D. Melanogaster were taken for this research. These D. Melanogaster underwent the same process as the above D. Melanogaster, but the difference was that these five D. Melanogaster were not under EMF. Two images of D. Melanogaster were taken (one was exposed to EMF, and the other was not revolutionized). Magcam DC 5 (5.1 M P) fitted along with the microscope. The resolution of the image was 1944 × 2592 pixels.
3.1 Examination of Microscopic Image of Brain
After exposing the D. Melanogaster to EMF, the image of the brain was examined using a color microscopic image [9]. Examination of D. Melanogaster can be completed using image acquisition, during which noise and reflections in the color microscopic image were observed. However, other than noise and reflection, no difference was observed in the image of D. Melanogaster with and without EMF, hence the need for image examination.
3.2 Partitioning of Brain from Microscopic Image
The input image for the image partitioning was the microscopic color image. In this process, the image of the brain was partitioned sepavaluely from the overall image by removing noise and reflection. The partitioning of the image should be carefully done because even a small mistake may drastically change the end result. Thus, image partitioning should be examined with various color models and individual color components to identify the appropriate color components.
3.2.1 Examining Microscopic Image in Various Color Models
During the partitioning of the brain image, the microscopic color image was transformed into different color models. Predominantly, three different color models were used: red, green, and blue (RGB); hue, saturation, and value (HSV); and L: lightness, A and B: color components (LAB).
From the image acquisition, whether the image belongs to RGB can be decided easily by examination. If the image fails to falls in red, green, and blue, then this RGB color model cannot be chosen. After confirming it, the next image model, HSV, has to be checked. A series of steps must be followed to change the RGB color image into an HSV color image:
By using the above equations, the RGB microscopic image can be converted into an HSV color model. In this HSV color model, the examination of the image is checked via color as well as from the value. After checking the color, if it is distinct, then the partition has to be checked; if the partition is not uniform, then the image has to be converted into the LAB color components. They are as follows:
where L is lightness; A and B are the rivals of the green–red and blue–yellow.
3.2.2 Preliminary Process for Quality Upgradation
Before segmenting the brain area, the preliminary process (lightness) is applied to the image order to enhance the brain area separately from the background. Whenever lightness is applied to the image, intensity adjustment is mandatory [10].
3.2.3 Partitioning After Processing
After adjusting the intensity of the image, the brain area becomes distinct. The threshold algorithm is applied to the image to partition the brain area from the preliminary image. τ is selected as the threshold parameter for the partitioning of the brain area.
3.3 Examination of Structure of Image
The structure of D. Melanogaster obtained from the partitioned image is used to classify whether it is affected by EMF radiations.
Recognizability: Things that are visually similar have similar characteristics that are common to both of them.
Transformation: The movement of the thing should not affect the characteristics of the image obtained.
Trustworthiness: The obtained information provides the same result in situations dealing with identical things.
Computably Self-reliant: All information obtained should be computable self-reliant. Eight structural images can be obtained from the partitioned brain.
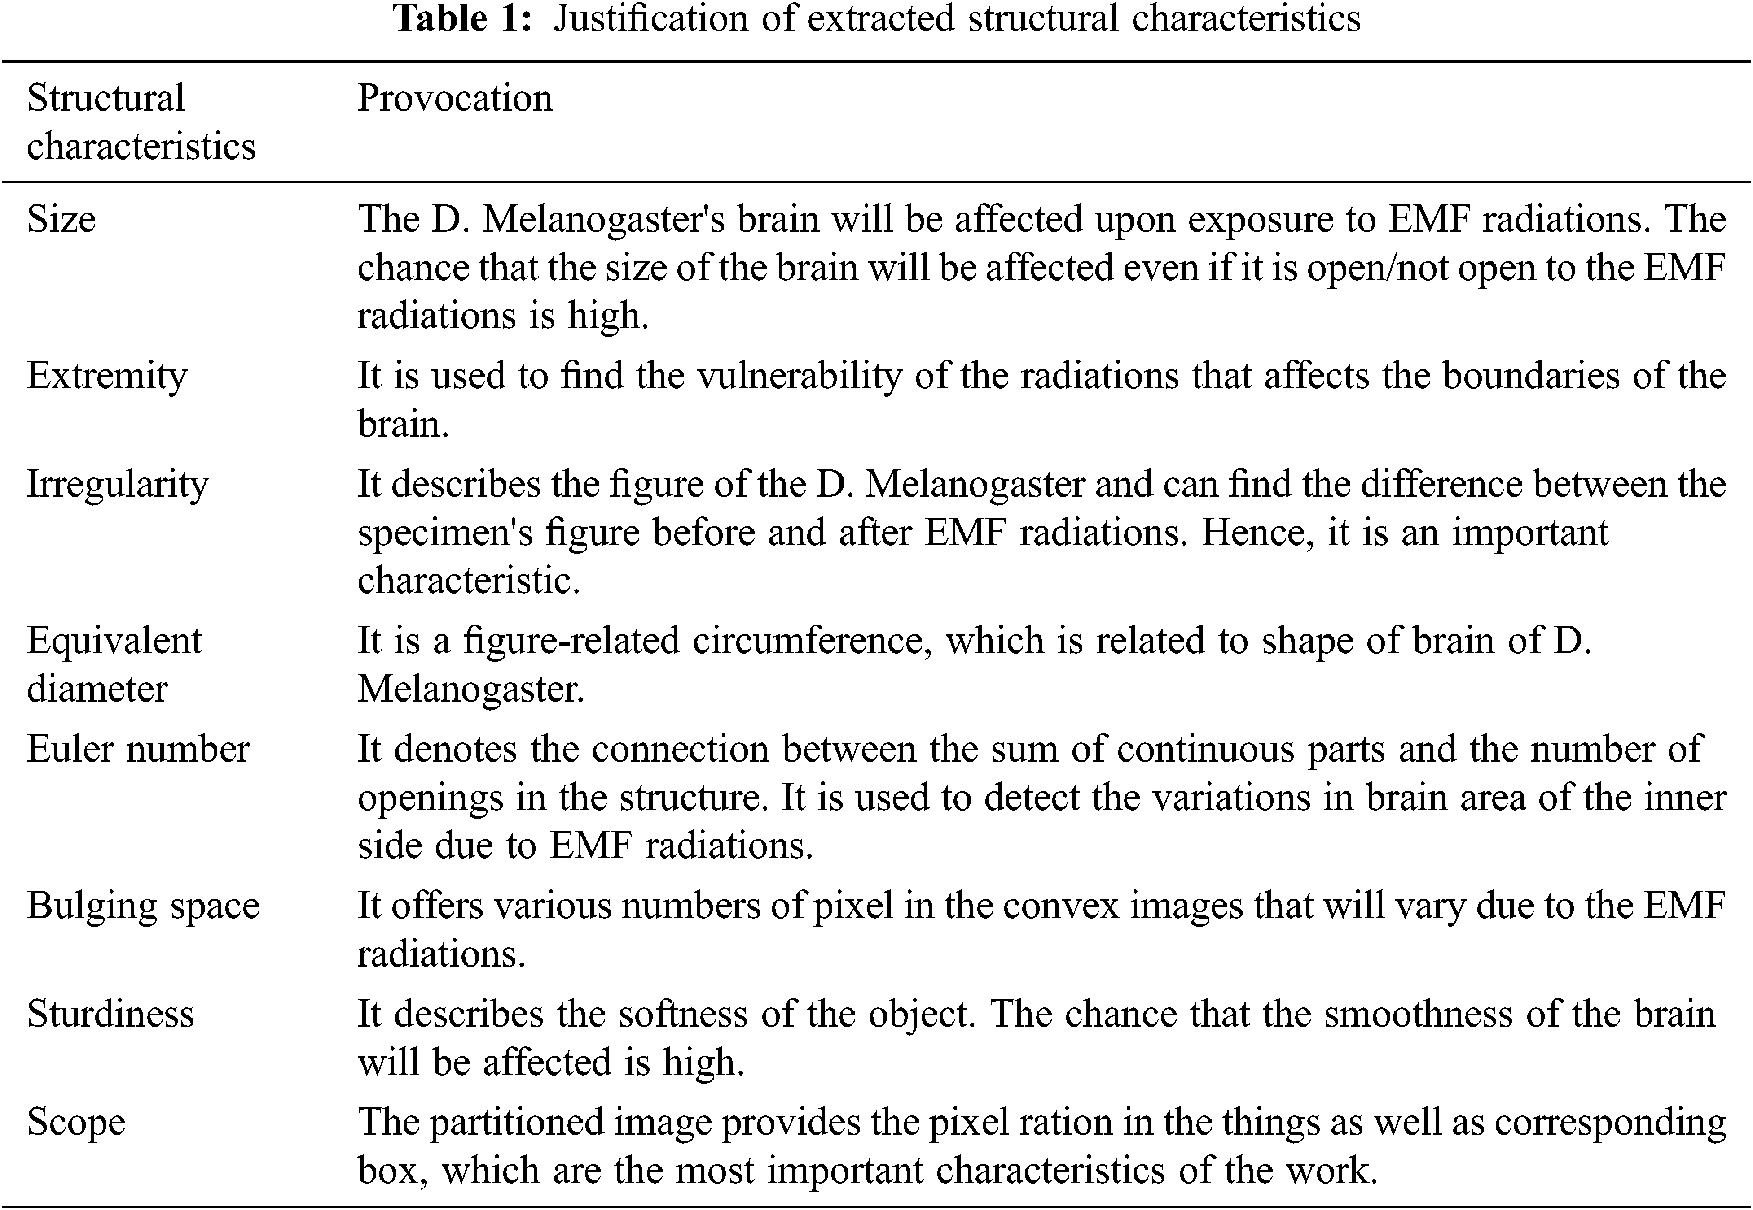
Size: Addition of the nonzero pixels of binary image (BI) of partitioned image provides the total size of the brain. It can be calculated as
Extremity: It is the distance measured around the border of the object. It is calculated by measuring the neighbor pixel pair around the boundary region.
Irregularity: It is calculated by dividing the length between the foci by the major axis length.
Equivalent Diameter: It is a diameter of the object that indicates the diameter of the object and the circle are similar. It can be calculated as
Euler Number = It denotes the connection between the sum of continuous parts and the number of openings in the structure.
Bulging Space = It represents the number of the pixels in the bulging space of the image.
Sturdiness = It describes the degree, which determines whether the image is concave or convex. If S is the size of the object, then SH is the convex size of the object.
Scope: It is calculated by dividing the sum of pixels (TP) in things and related bounding box (BB).
All the above characteristics are important. Tab. 1. describes the provocation of the above characteristics, all the characteristics are calculated, and the most important characteristics are selected.
3.4 Identifying the Most Preferential Characteristics
Various characteristics were identified in the previous technique [11]. However, the authenticity and time intricacy of machine learning algorithms vastly rely on the preferential power of characteristics fed to the classifiers. Authenticity will rise only when the characteristics fed to classifiers have sufficient preferential power. To attain this, Wilcoxon rank sum Examines is implemented.
Wilcoxon rank sum is used to find the value of p. If the value of p is low, then the preferential characteristics are high. To identify this, the algorithm uses the nonparametric and speculative test in z statistics [12]. This test checks all the characteristics obtained from the previous steps. Another element that provides confidence regarding the usage of the Wilcoxon rank sum's p-value method [13] is to determine the preferential of vector Box and Whisker Plot [14]. Tab. 2. presents the average, mean, standard deviation, and p values for all the characteristics that identified the D. Melanogaster groups.
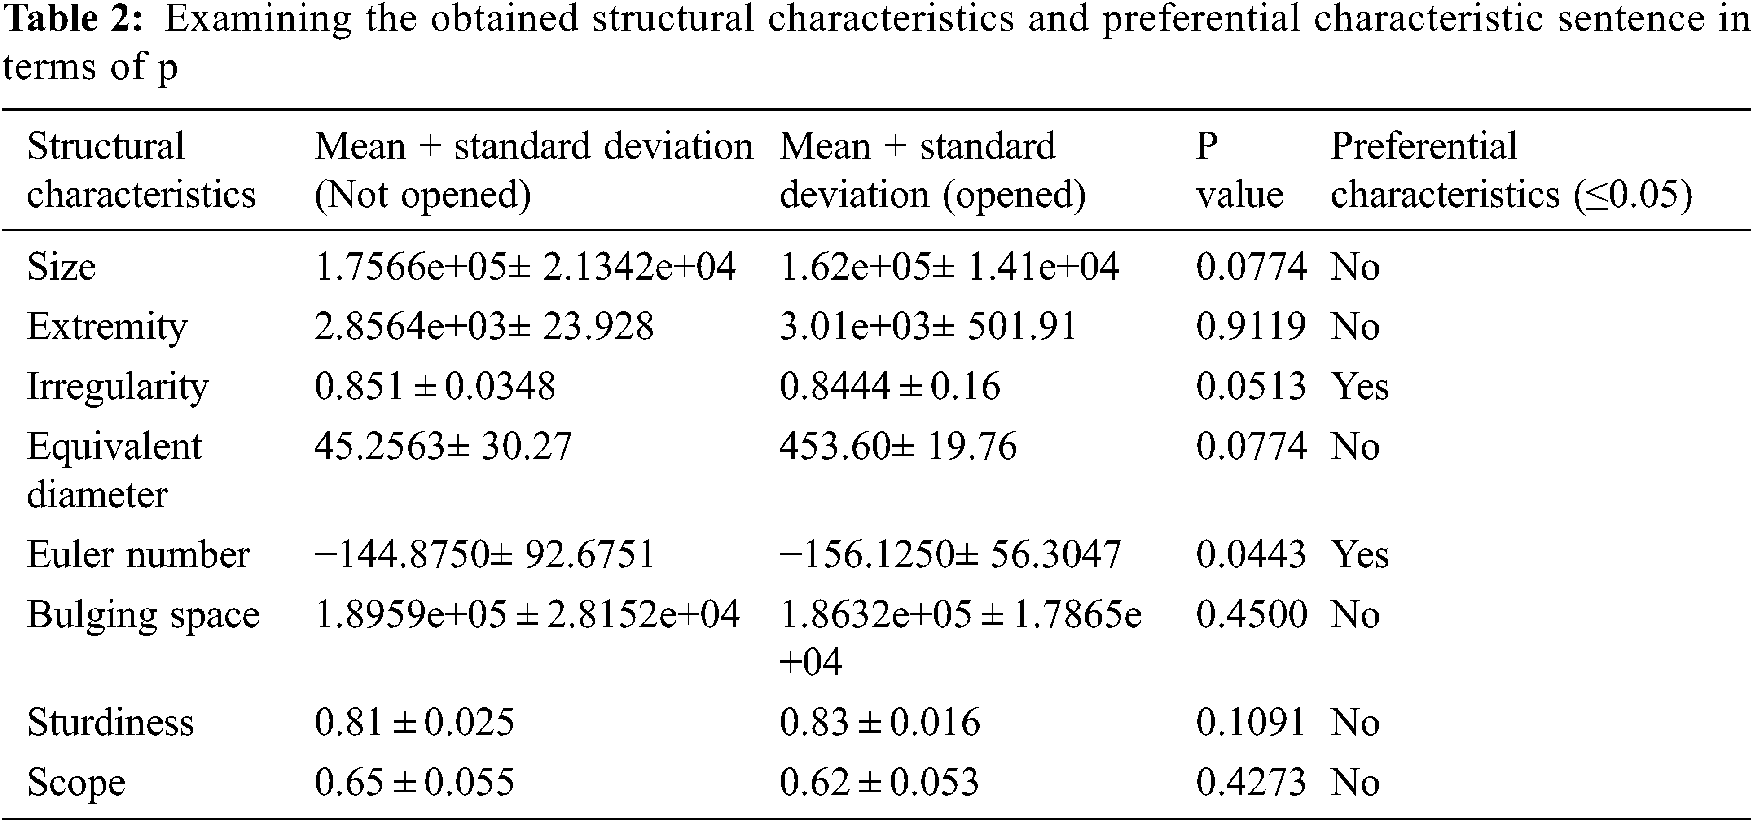
Fig. 2 shows that two out of the eight characteristics have the lowest dissemination, which means only these two characteristics have the highest preferential power among all the characteristics. After calculating the p value, which is ≤ 0.05, only two characteristics are capable of finding the open/not open D. to EMF. Now, selecting the preferential characteristics is easy.
3.5 Segregating Open/Not Open Groups Using Machine Learning
Preferential characteristics out of eight were selected, and the selected characteristics were analyzed based on their performance after final segregation. To examine the effect of EMF radiations on the morphology of the D. Melanogaster brain, four classifiers were used to segregate it. These four classifiers were naïve Bayes [15–17], artificial neural network [18–22], support vector machine [23–25], and unsystematic forest.
The efficiency of the classifiers was measured by using various criteria. Initially, classifiers were skilled in using the datasets and checking database, and were all used to examine the performance of the classifiers. These criteria were used to check the classifiers: correct optimistic value (COV), correct pessimistic value (CPV), noncorrect optimistic value (NOV), noncorrect pessimistic value (NPV), optimistic predictive value, and pessimistic predictive value.
Youden's J statistic (also called Youden's index [YI]) is in the ROC Curve. It is far from the diagonal line. It increases the distance between COV and NOV. The value between 0–1.0 is the lowest value, and 1 is the highest value. It can be calculated as follows:
Apart from YI, another methodology can check the efficiency of the classifiers. Predominantly, this F1 score is used when the distribution of classifiers is uneven. It considers NOV and NPV.
As YI, F1 score also ranges from 0 to 1, where 0 is the least score. As discussed earlier, authenticity is the most important criteria while testing the efficiency of the classifiers.
The following are proven:
Correct Optimistic: D. Melanogaster is classified as affected if the microscopic image is revealed.
Correct Pessimistic: D. Melanogaster is classified as affected if the microscopic image is Shaw revealed.
Noncorrect Optimistic: D. Melanogaster is classified as affected if the microscopic image is Shaw exposed.
Noncorrect Pessimistic: D. Melanogaster is classified as affected if the microscopic image is exposed.
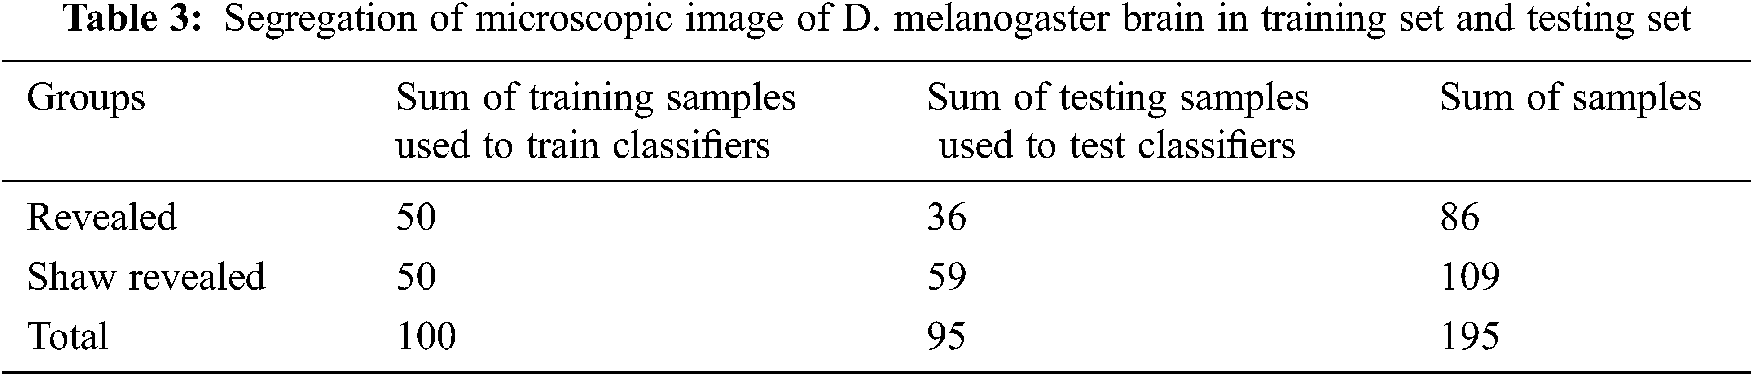
Optimal broadcasting learning to detect the effect of EMF radiations on the brain using machine learning is proposed to examine the brain morphology of D. Melanogaster after it is vulnerably affected by EMF radiations. The brain was examined by the series of the image database. A total of 155 images were taken for the research purpose, of which 66 images were exposed to EMF radiations and the still existing 89 images were selected by not concentrating any EMF radiation.
The database was subdivided into two sets, training set and testing set, to look into the efficiency of the classifiers. The training set provided training to the classifiers, whereas the testing set checked the efficiency of the classifiers. Tab. 3. shows the segregation of the database into testing set and training set. The database was partitioned as 52% for training, and the remaining 48% was for testing. Classifiers were examined by two methodologies, namely, F1 score and YI.
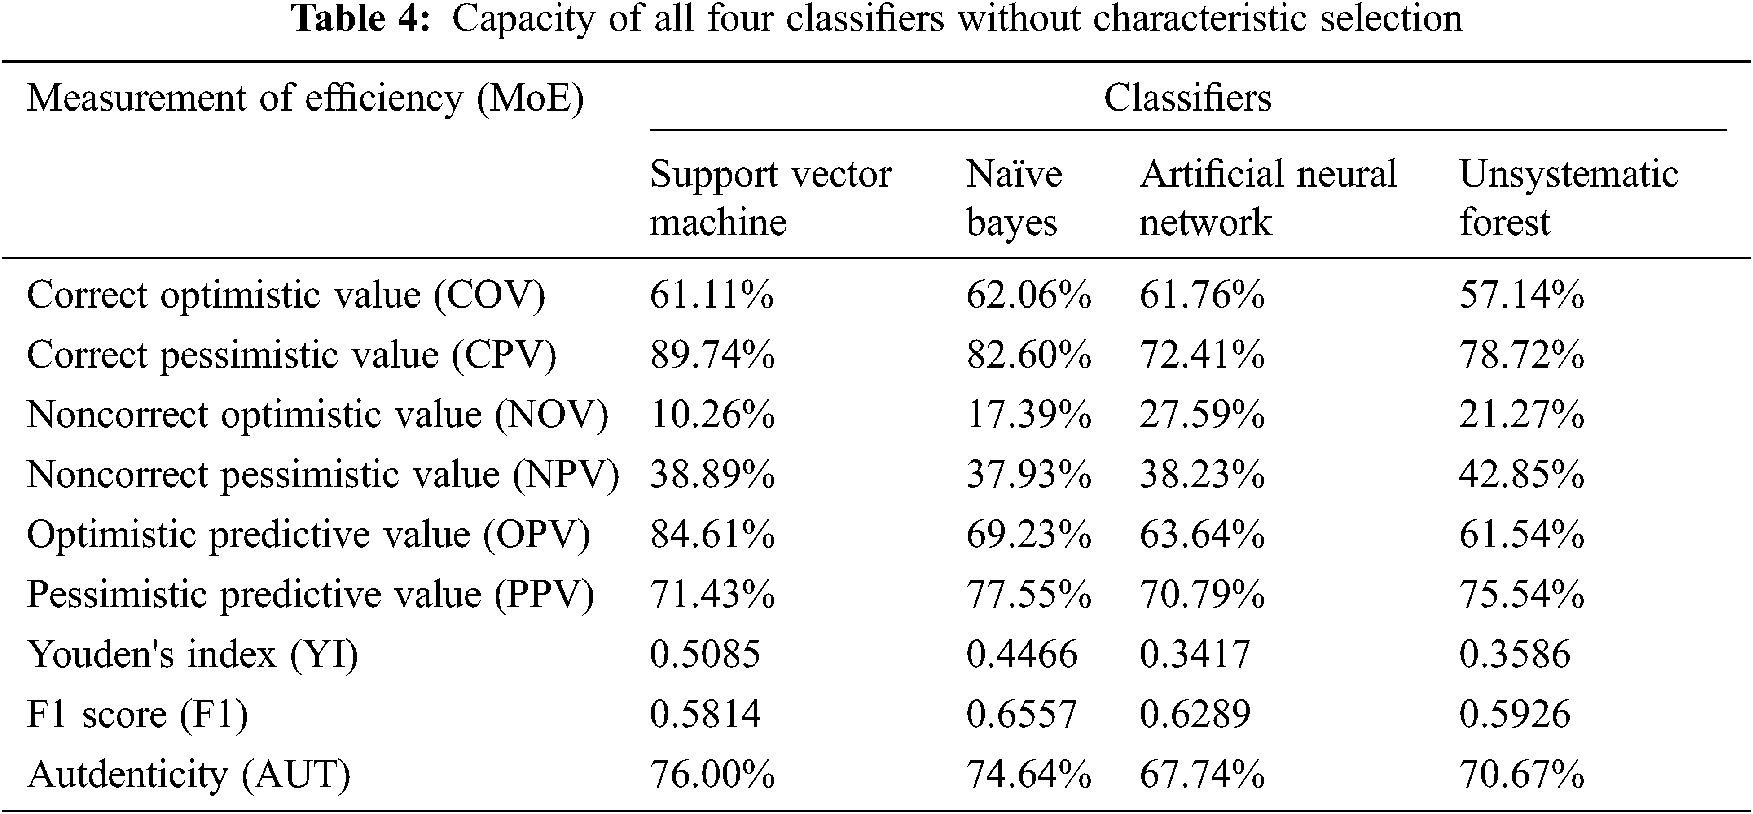
Tab. 4. and Fig. 3. present the results of the four classifiers (naïve Bayes, artificial neural network, support vector machine, and unsystematic forest) without the characteristic selection method. All the classifiers produce authenticity of nearly 67%. Among the four classifiers, the support vector machine produces the high authenticity of 76%. Similarly, the artificial neural network has the least authenticity among the four classifiers. In the F1-score methodology, all the four classifiers are less than the 0.6557, but the value below is not much lesser; hence, it cannot be classified using this value.
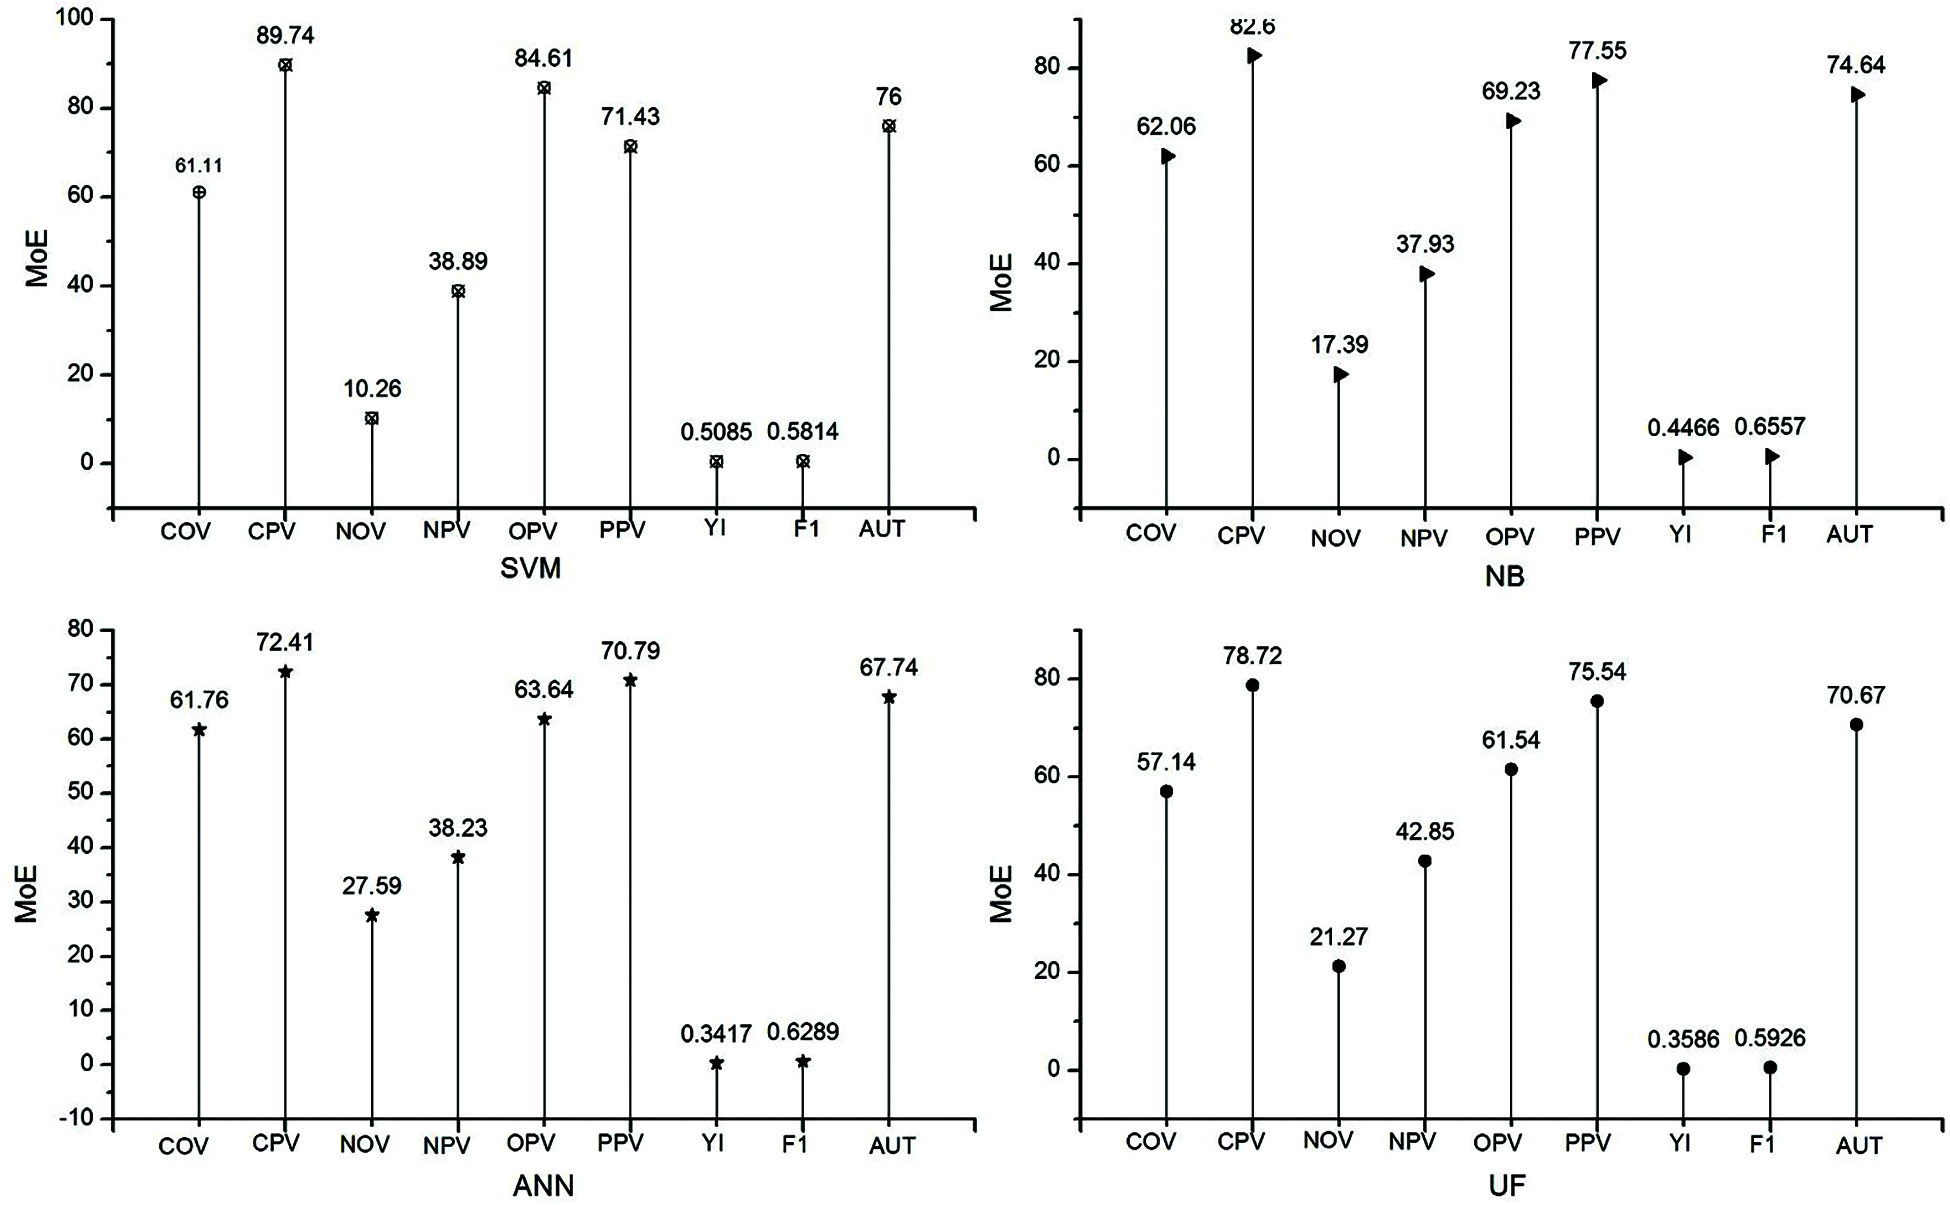
Figure 3: Efficiency of classifiers without characteristic selection
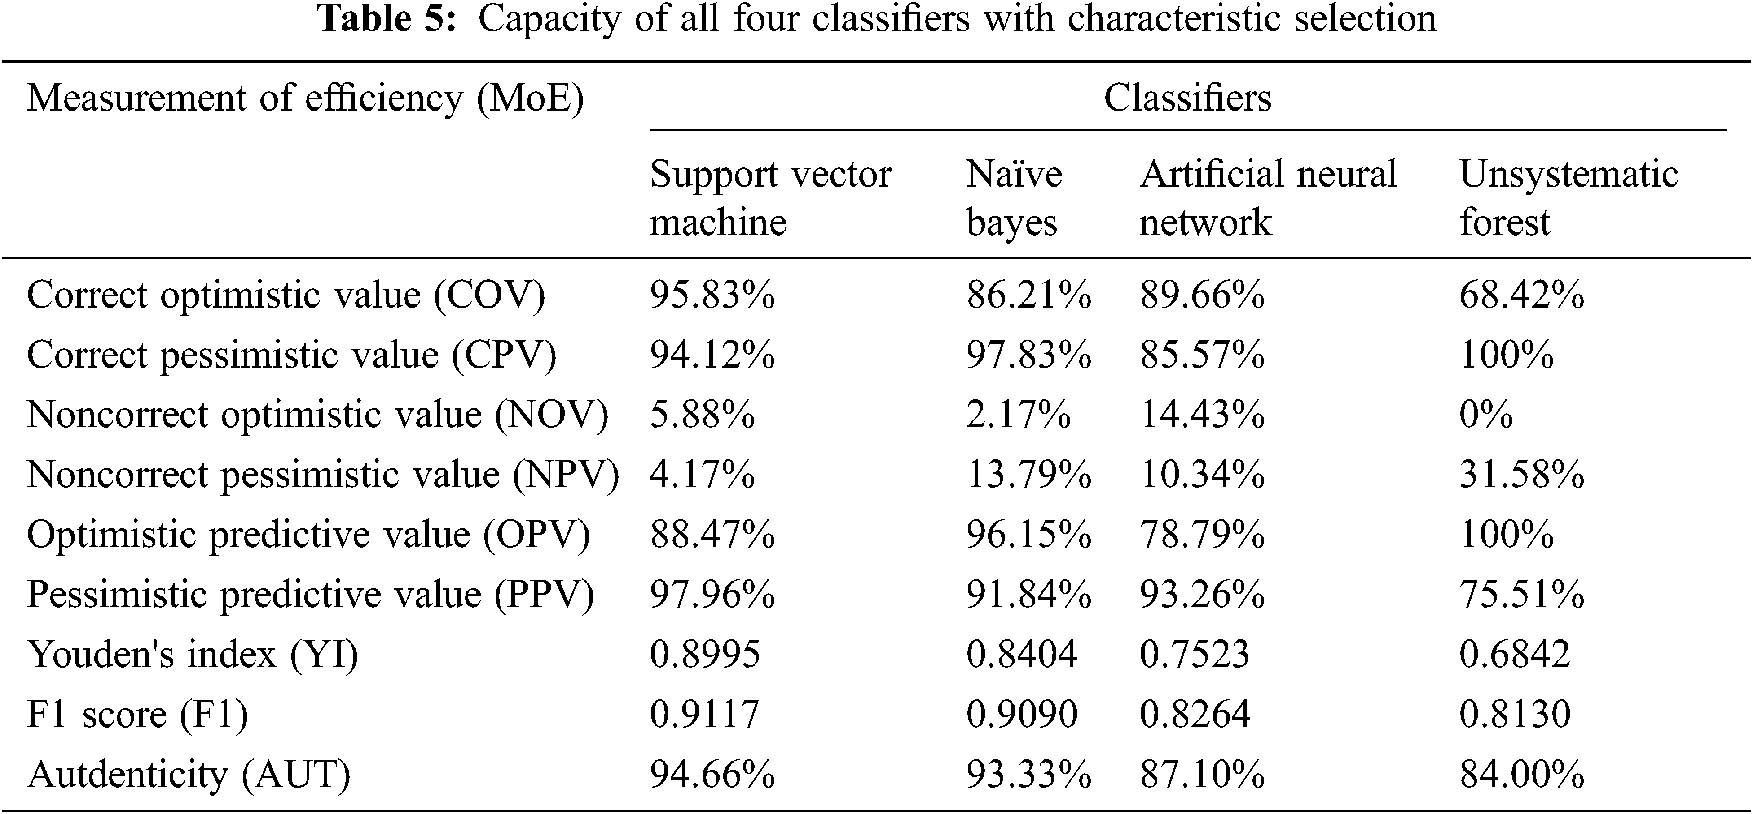
Tab. 5. and Fig. 4. represent the efficiency of the classifiers. In this table, the classifiers are written based on the preferential characteristics selected by the characteristic selection method. Similar to authenticity, characteristic selection support vector machine provides a large authenticity with 94.66%. In the characteristic selection, the minimum value for authenticity is 84%, which is higher the highest value obtained without the characteristic selection method. Similarly, in F1 score and authenticity, the classifier support vector machine ranks top in efficiency compared with the other classifiers.
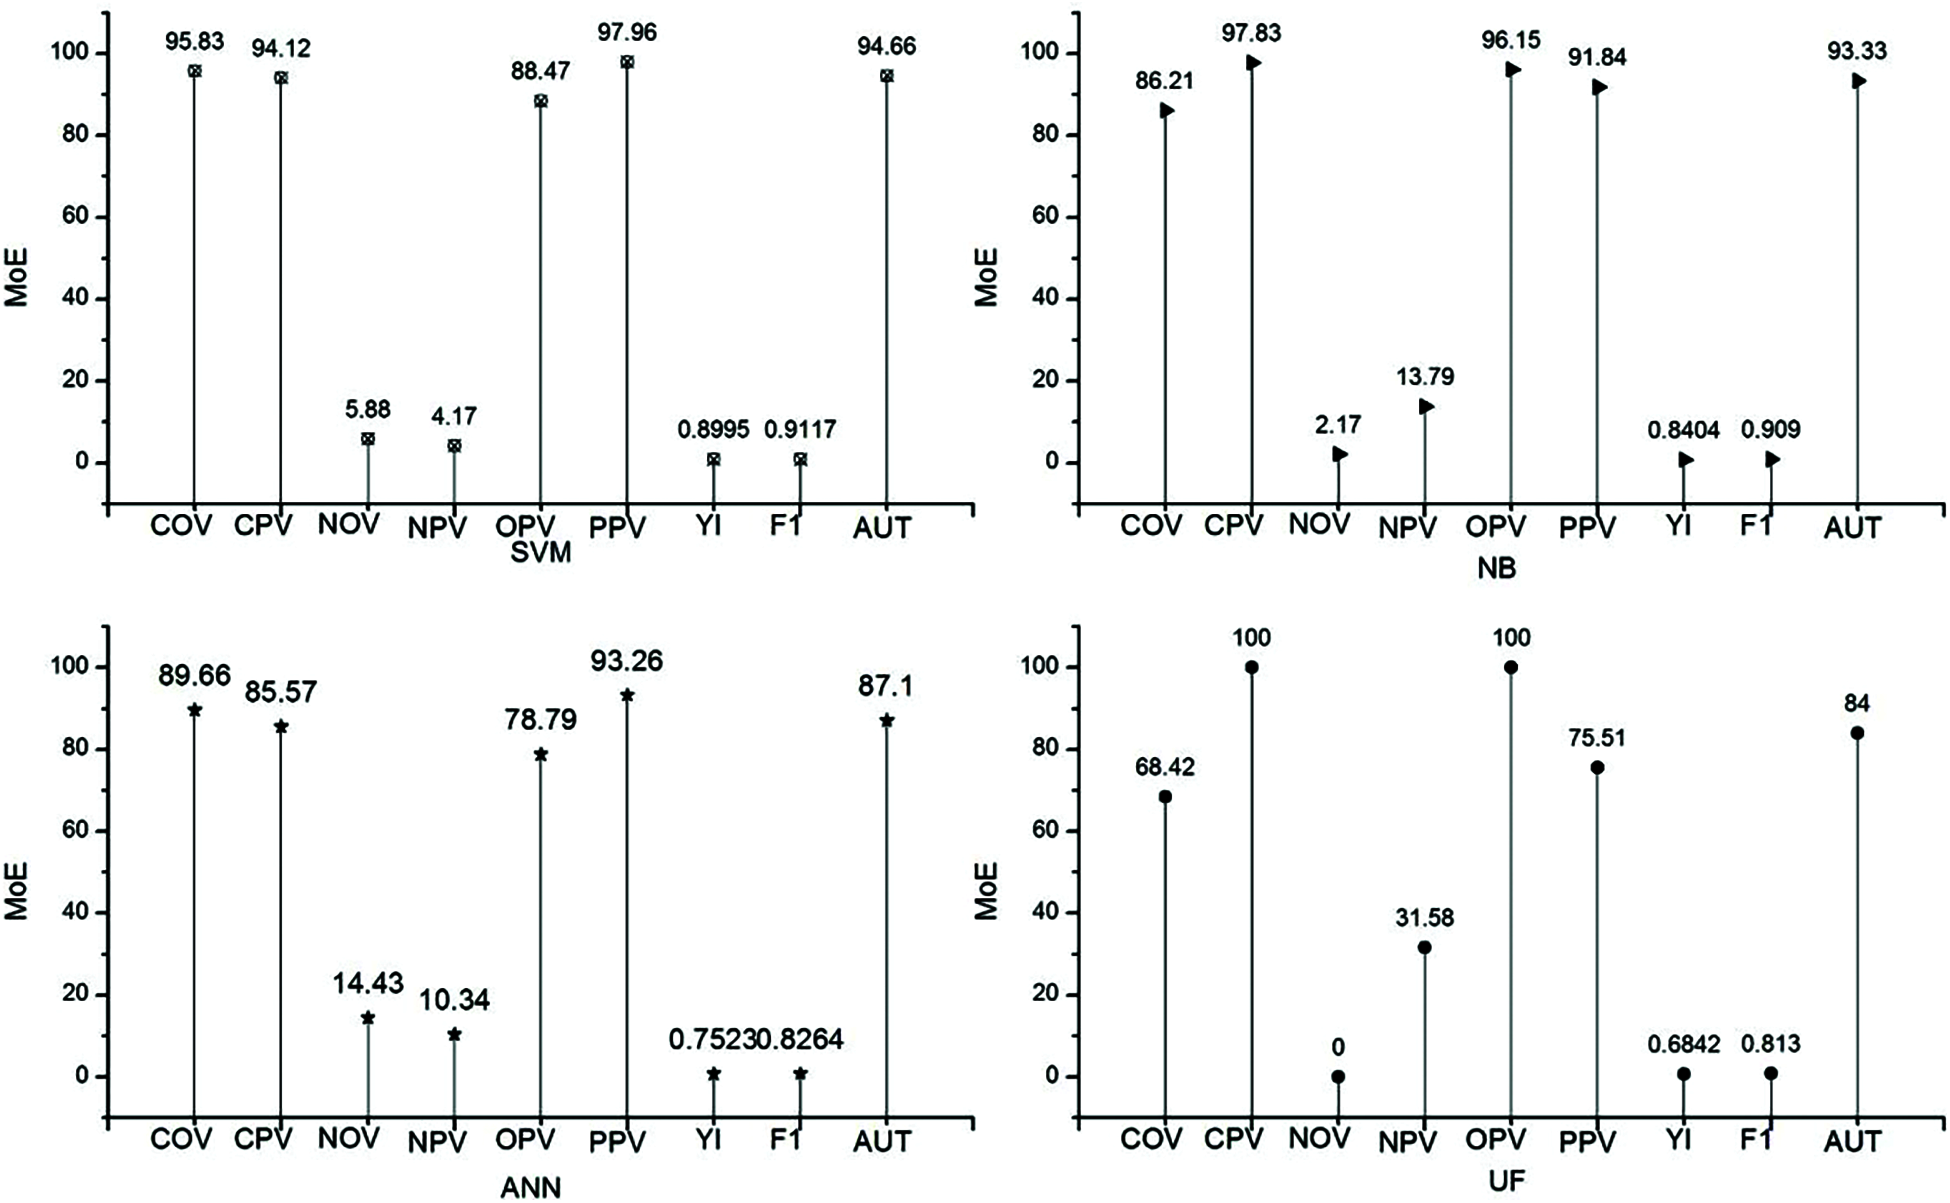
Figure 4: Efficiency of classifiers with characteristic selection
Figs. 5–7 present the chart where all the four classifiers are compared based on efficiency. All the classifiers improved much in selected characteristics. Support vector machine classifiers show the best result in the classification of open/not open groups.
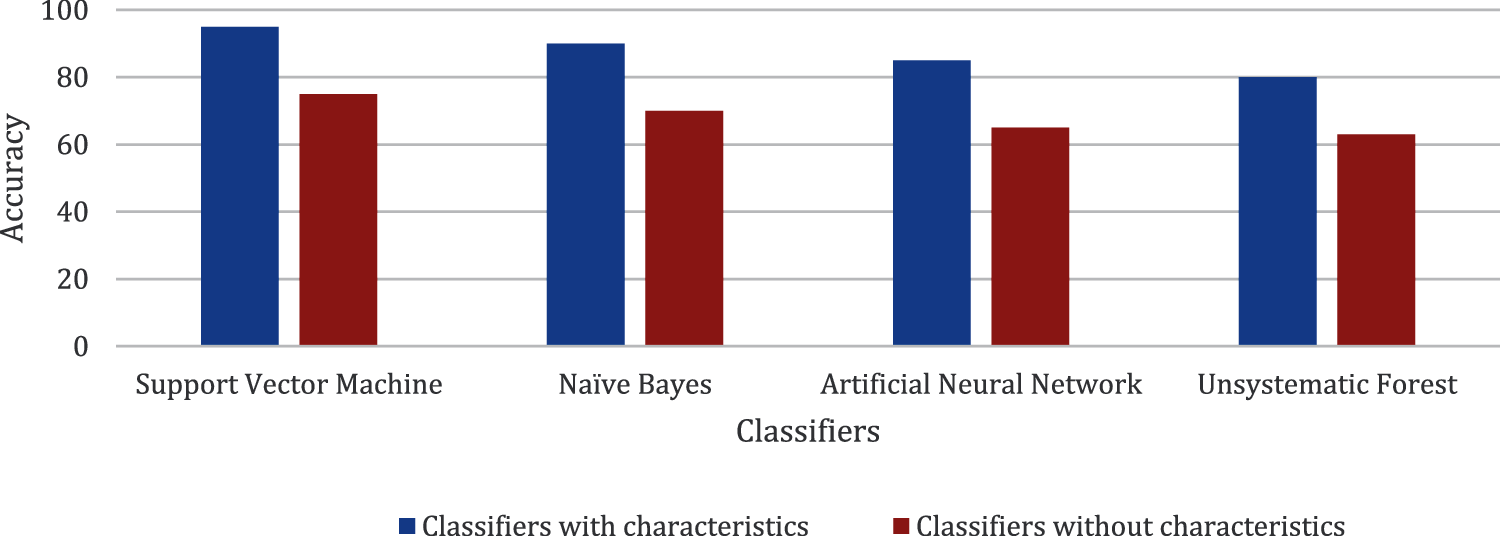
Figure 5: Comparison made for accuracy
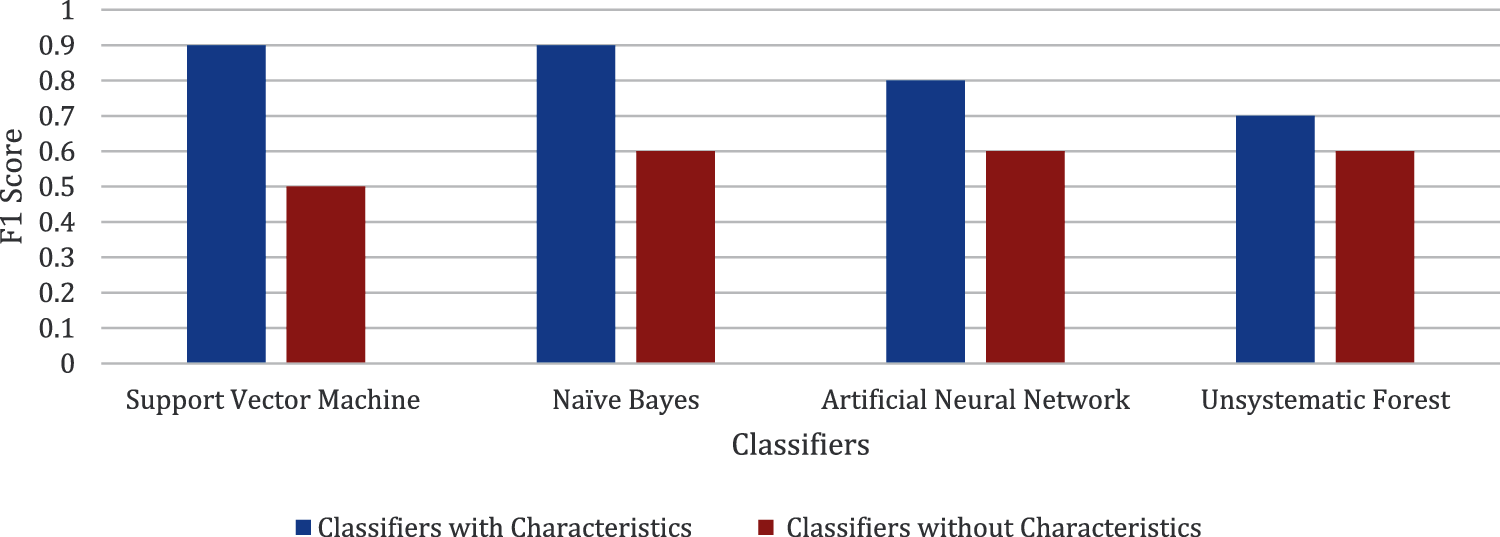
Figure 6: Comparison made for F1 score
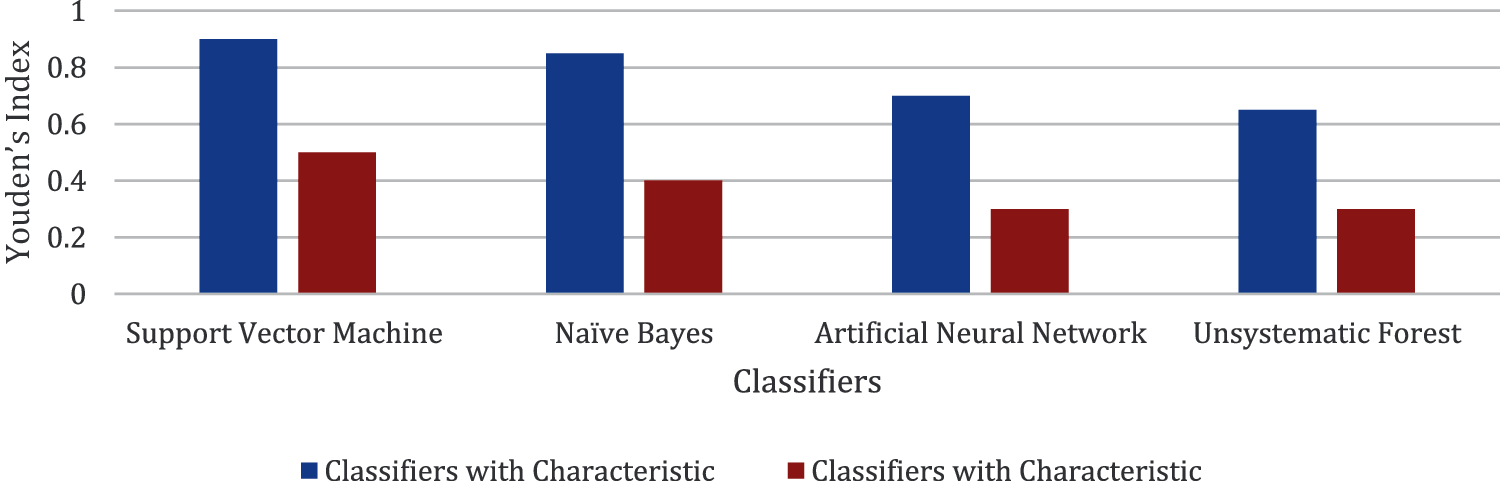
Figure 7: Comparison made for Youden's index
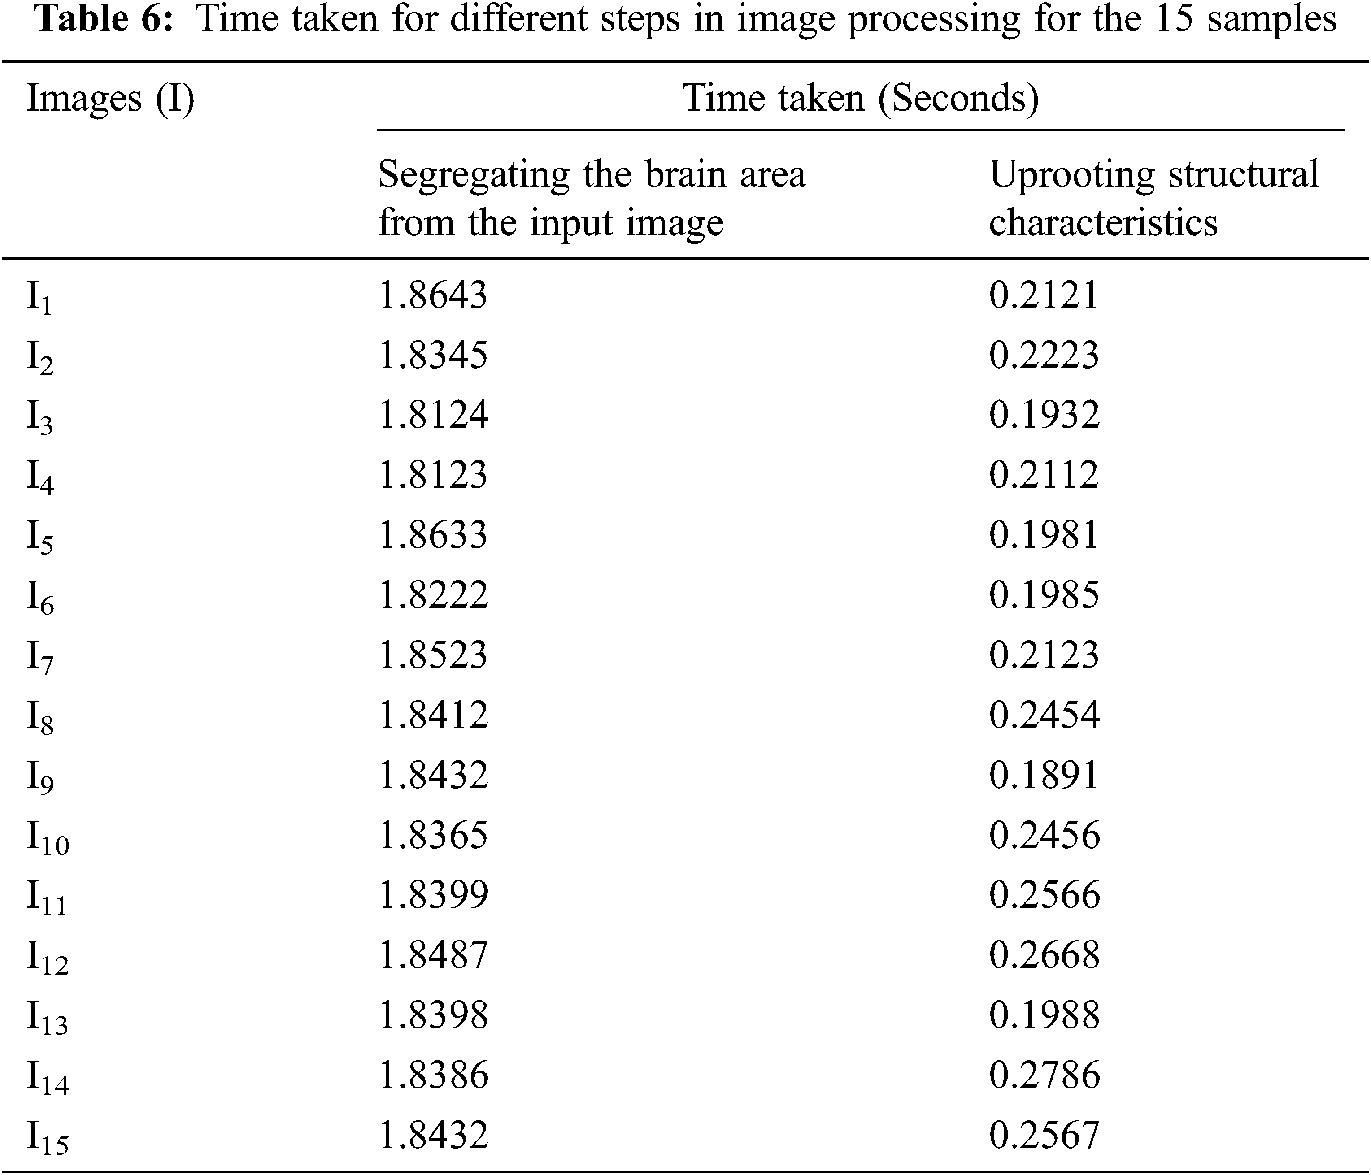
Tab. 6. presents the time taken for partitioning the brain area from the microscopic image and obtaining the structural characteristics from the partitioned brain image with randomly selected images. The times taken for partitioning the brain area from the input image are 1.84 and 0.22 s, which are very low. Hence, the proposed “Optimal broadcasting learning to detect the effect of EMF radiations on the brain using machine learning” has a very low complexity.
Through this proposed system, the microscopic image of D. Melanogaster was automatically partitioned and then obtained the structural characteristics to examine the brain morphology. The calculation of the p value ≤ 0.05 is exactly suited for preferential characteristic selection for open/not open groups. This imaging technique detected the effect of EMF radiations on the brain morphology of D. Melanogaster.
The proposed “Optimal broadcasting learning to detect the effect of EMF radiations on the brain using machine learning” describes the automatic examination of the modifications in the morphology of the specimen D. Melanogaster brain due to the vulnerabilities of EMF radiations. For this purpose, the brain of the D. Melanogaster is examined in two different ways, namely, with vulnerability of EMF radiations and without the vulnerability of EMF radiations. The analysis is made by using machine learning. The brain area is segregated from the microscopic image, the structural features of the brain are obtained from the image, and the color models are identified.
The structural characteristics are obtained from the segregated brain image. The preferable characteristics for the classification of open/non open to EMF radiations are classified based on the classifier. The classifier's efficiency increases when preferential characteristics are given to classifiers. The support vector machine, which is one of the four classifiers discussed in the proposed system, performs well and has the best authenticity. The computational time to segregate the brain image from the microscopic image is reduced by using machine language. The times for partitioning the brain and extracting the brain image are almost 1.8 and .20 s, which suit the practical applications.
Funding Statement: The authors received no specific funding for this study.
Conflicts of Interest: The authors declare no conflict of interest regarding the publication of the paper.
1. T. Saliev, D. Begimbetova, A. Masoud and B. Matkarimov, “Biological effects of non-ionizing electromagnetic fields: Two sides of a coin,” Progress in Biophysics and Molecular Biology, vol. 141, pp. 25–36, 2019. [Google Scholar]
2. E. Odaci, O. Bas and S. Kaplan, “Effects of prenatal exposure to a 900 MHz electromagnetic field on the dentate gyrus of rats: A stereological and histopathological study,” Brain Research, vol. 1238, pp. 224–229, 2008. [Google Scholar]
3. L. Hardell, “World health organization, radio frequency radiation and health-a hard nut to crack,” International Journal of Oncology, vol. 51, no. 2, pp. 405–413, 2017. [Google Scholar]
4. A. L. Mausset Bonnefont, H. Hirbec, X. Bonnefont, A. Privat, J. Vignon et al., “A cute exposure to GSM 900-MHz electromagnetic fields induces glial reactivity and biochemical modifications in the rat brain,” Neurobiology of Disease, vol. 17, no. 3, pp. 445–454, 2004. [Google Scholar]
5. Y. Lu, S. Xu, M. He, C. Chen, L. Zhang et al., “Glucose administration attenuates spatial memory deficits induced by chronic low power-density microwave exposure,” Physiology & Behavior, vol. 106, no. 5, pp. 631–637, 2012. [Google Scholar]
6. M. Razavinasab, K. Moazzami and M. Shabani, “Maternal mobile phone exposure alters intrinsic electrophysiological properties of CA1 pyramidal neurons in rat offspring,” Toxicology and Industrial Health, vol. 32, no. 6, pp. 968–979, 2016. [Google Scholar]
7. R. Paulraj and J. Behari, “Single strand DNA breaks in rat brain cells exposed to microwave radiation,” Mutation Research/Fundamental and Molecular Mechanisms of Mutagenesis, vol. 596, no. 12, pp. 76–80, 2006. [Google Scholar]
8. T. M. Koval, R. W. Hart, W. C. Myser and W. F. Hink, “A comparison of survival and repair of UV-induced DNA damage in cultured insect versus mammalian cells,” Genetics, vol. 87, no. 3, pp. 513–518, 1977. [Google Scholar]
9. A. R. Smith, “Color gamut transform pairs,” ACM Siggraph Computer Graphics, vol. 12, no. 3, pp. 12–19, 1978. [Google Scholar]
10. A. Zeileis, K. Hornik and P. Murrell, “Escaping RGB land: Selecting colors for statistical graphics,” Computational Statistics & Data Analysis, vol. 53, no. 9, pp. 3259–3270, 2009. [Google Scholar]
11. M. P. Fay and M. A. Proschan, “Wilcoxon-mann-whitney or t-test? on assumptions for hypothesis tests and multiple interpretations of decision rules,” Journal of Survey Statistics and Methodology, vol. 4, pp. 1–39, 2010. [Google Scholar]
12. R. C. Sprinthall, In Basic Statistical Analysis, 9th ed Boston: Pearson Allyn & Bacon, 2012. [Online]. Available: https://www.pearson.com/us/higher-education/program/Sprinthall-Basic-Statistical-Analysis-9thEdition/PGM163391.html. [Google Scholar]
13. H. J. Hung, R. T. Neill, P. Bauer and K. Kohne, “The behavior of the p-value when the alternative hypothesis is true,” Biometrics, vol. 52, no. 1, pp. 11–22, 1997. [Google Scholar]
14. M. Frigge, D. C. Hoaglin and B. Iglewicz, “Some implementations of the boxplot,” The American Statistician, vol. 43, no. 1, pp. 50–54, 1989. [Google Scholar]
15. I. Rish, “An empirical study of the naive Bayes classifier,” in Proc. EMAI, Seattle, USA, vol. 3, no. 22, pp. 41–46, 2001. [Google Scholar]
16. M. Van Gerven and S. Bohte, “Artificial neural networks as models of neural information processing,” Frontiers in Computational Neuroscience, vol. 11, pp. 1–8, 2017. [Google Scholar]
17. C. Cortes and V. Vapnik, “Support vector networks,” Machine Learning, vol. 20, no. 3, pp. 273–297, 1995. [Google Scholar]
18. V. Balaji, S. Maheswaran, M. R. Babu, M. Kowsigan, E. Prabhu et al., “Combining statistical models using modified spectral subtraction method for embedded system,” Microprocessors and Microsystems, vol. 73, pp. 1–12, 2020. [Google Scholar]
19. A. C. J. Malar, M. Kowsigan, N. Krishnamoorthy, S. Karthick, E. Prabhu et al., “Multi constraints applied energy efficient routing technique based on ant colony optimization used for disaster resilient location detection in mobile ad-hoc network,” Journal of Ambient Intelligence and Humanized Computing, vol. 12, pp. 1–11, 2020. [Google Scholar]
20. A. Singh, N. Singh, T. Jindal, A. Rosado-Muñoz and M. K. Dutta, “A novel pilot study of automatic identification of EMF radiation effect on brain using computer vision and machine learning,” Biomedical Signal Processing and Control, vol. 57, pp. 1–9, 2020. [Google Scholar]
21. A. Ben Hur, D. Horn, H. T. Siegelmann and V. Vapnik, “Support vector clustering,” Journal of Machine Learning Research, vol. 2, no. 1, pp. 125–137, 2001. [Google Scholar]
22. K. Mohan and B. Palanisamy, “A novel resource clustering model to develop an efficient wireless personal cloud environment,” Turkish Journal of Electrical Engineering & Computer Sciences, vol. 27, no. 3, pp. 2156–2169, 2019. [Google Scholar]
23. M. Shanmugam, A. Ramasamy, S. Paramasivam and P. Prabhakaran, “Monitoring the turmeric finger disease and growth characteristics using sensor based embedded system: A novel method,” Circuits and Systems, vol. 7, no. 8, pp. 1–13, 2016. [Google Scholar]
24. S. Paramasivam, S. Athappan, E. D. Natrajan and M. Shanmugam, “Optimization of thermal aware VLSI non-slicing floorplanning using hybrid particle swarm optimization algorithm-harmony search algorithm,” Circuits and Systems, vol. 7, no. 5, pp. 562–573, 2016. [Google Scholar]
25. T. K. Ho, “Random decision forests,” in Proc. ICDAR, IEEE, Montreal, QC, Canada, pp. 278–282, 1995. [Google Scholar]
 | This work is licensed under a Creative Commons Attribution 4.0 International License, which permits unrestricted use, distribution, and reproduction in any medium, provided the original work is properly cited. |