DOI:10.32604/csse.2022.021132
| Computer Systems Science & Engineering DOI:10.32604/csse.2022.021132 | |
| Article |
Aero-Engine Surge Fault Diagnosis Using Deep Neural Network
1School of Computer Science, Southwest Petroleum University, Chengdu, 610500, China
2Sichuan Normal University, Chengdu, 610066, China
3AECC Sichuan Gas Turbine Establishment, MianYang, 621700, China
4Brunel University London, Uxbridge, Middlesex, UB83PH, United Kingdom
*Corresponding Author: Bin Lin. Email: m15008109959_1@163.com
Received: 28 June 2021; Accepted: 29 July 2021
Abstract: Deep learning techniques have outstanding performance in feature extraction and model fitting. In the field of aero-engine fault diagnosis, the introduction of deep learning technology is of great significance. The aero-engine is the heart of the aircraft, and its stable operation is the primary guarantee of the aircraft. In order to ensure the normal operation of the aircraft, it is necessary to study and diagnose the faults of the aero-engine. Among the many engine failures, the one that occurs more frequently and is more hazardous is the wheeze, which often poses a great threat to flight safety. On the basis of analyzing the mechanism of aero-engine surge, an aero-engine surge fault diagnosis method based on deep learning technology is proposed. In this paper, key sensor data are obtained by analyzing different engine sensor data. An aero-engine surge dataset acquisition algorithm (ASDA) is proposed to sample the fault and normal points to generate the training set, validation set and test set. Based on neural network models such as one-dimensional convolutional neural network (1D-CNN), convolutional neural network (RNN), and long-short memory neural network (LSTM), different neural network optimization algorithms are selected to achieve fault diagnosis and classification. The experimental results show that the deep learning technique has good effect in aero-engine surge fault diagnosis. The aero-engine surge fault diagnosis network (ASFDN) proposed in this paper achieves better results. Through training, the network achieves more than 99% classification accuracy for the test set.
Keywords: Aero-engine; fault diagnosis; surge; vibration signal classification; deep learning
In recent years, the aviation industry has developed rapidly, and the safety of aviation aircraft has attracted widespread attention. Aero-engine is the core component of the air craft. Once the fault occurs, it will directly lead to the aircraft unable to fly normally. The problem of engine surge has been restricting the development of turbine engines, affecting the performance of the engine, and even causing serious damage. It is the most dangerous of all engine failures. Surge is the abnormal operation of the engine caused by the compressor [1]. When surge occurs, the airflow will produce low-frequency and high-amplitude airflow oscillations along the compressor axis. This low-frequency and high-amplitude airflow oscillation will drive the compressor blades to produce strong vibrations, causing serious damage to the blades in a short time even break [2]. The reverse flow of the flame in the combustion chamber is a more dangerous situation. Even if it lasts for a few tenths of a second, the high-temperature flames rushing are enough to burn all the blades of the compressor. This situation is because the compressor surges too violently, causing the high-temperature gas in the combustion chamber at the back to flow back into the compressor. Earlier, even if this process only lasted a few tenths of a second, the rushing high-temperature flame was enough to burn out all the blades of the compressor and cause the engine to be scrapped [3]. In any working state, it is necessary to avoid the compressor from entering the surge state. In order to ensure the safety of the aero engine, it is necessary to carry out a failure test on the aero engine, and to identify and classify the failure signal.
In the field of mechanical fault diagnosis, many domestic and foreign scholars use deep neural networks to process the vibration signals of mechanical equipment, and have achieved good results. In 2019, Luo et al. [4] proposed a method based on the LSTM model in the fault diagnosis of reciprocating compression machinery, the fault identification accuracy of the best model reached 93%. In order to solve the problems of traditional one-dimensional vibration signal processing methods, Huang et al. [5] proposed a 1D-CNN fault diagnosis method based on cubic spline interpolation pool. Experiments show that the proposed method has high recognition rate and one-dimensional stability. Yu et al. [6] realized the end-to-end fault diagnosis of rolling bearing based on the stack LSTM method, reaching 99% accuracy. In 2020, L. Gou, H. Li, H. Zheng, et al. proposed an intelligent fault diagnosis method for aero-engine sensors based on deep learning and time-frequency analysis. This method does not require modeling and design thresholds, and has strong robustness and accuracy of more than 97% [7]. Qiu et al. [8] proposed a rolling bearing fault diagnosis method based on an improved bidirectional long short-term memory (Bi-LSTM) based on the non-stationary characteristics and the simple logical structure characteristics of rolling bearings, which further reduced the error rate of rolling bearing fault diagnosis. Yin et al. [9] proposed a method based on Cos-LSTM neural network for the gearbox of wind turbines and proved its effectiveness.
Based on the above research, this paper applies 1D-CNN, LSTM and other neural network models which are often used to deal with vibration signal and sequence data of mechanical equipment to aero-engine surge fault diagnosis. Different network optimization algorithms are used for fault identification and classification. The experimental results of different methods are compared to verify the effectiveness of deep learning in the application of aero-engine surge fault diagnosis. Finally, this paper proposes an aero-engine surge fault diagnosis network (ASFDN). Based on1D-CNN, this network can classify normal and surge fault data by building and adjusting parameters for aero-engine surge data set.
Convolutional neural network (CNN) is widely used in the field of image processing, and the input of the network is a two-dimensional matrix such as pictures [10]. With continuous development, researchers try to apply CNN to processing one-dimensional signals, which results in1D-CNN. The 1D-CNN model mainly includes the input layer, convolutional layer, pooling layer, fully connected layer and output layer. The convolutional layer and the pooling layer are the core structures of 1D-CNN [11]. Fig. 1 shows the structure of the 1D-CNN model used in this paper.
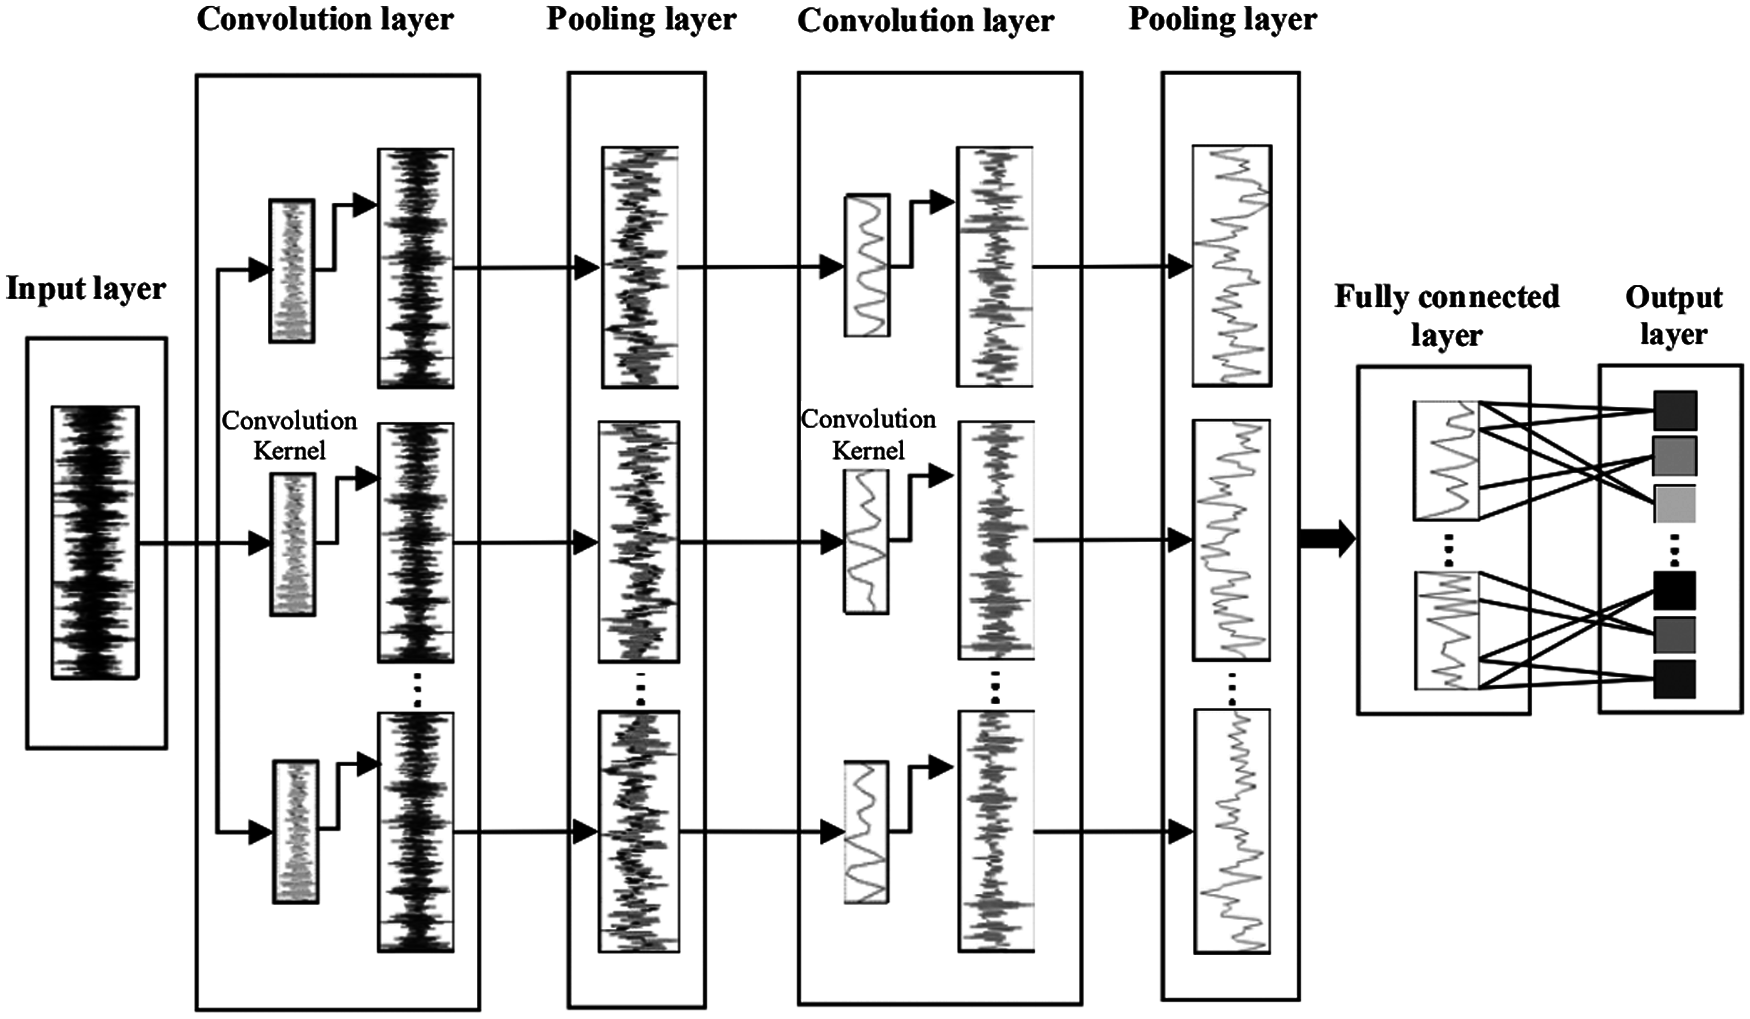
Figure 1: The structure of 1D-CNN [12]
The convolutional layer is composed of multiple convolution kernels, and the shape and number of convolution kernels directly determine the performance of the network [13]. The parameter sharing of each convolution kernel can reduce the number of network model parameters, making the trained model stronger in generalization [14]. The convolution process is described shown in Eq. (1):
where
The activation layer adds nonlinear factors through the activation function to enhance the expressive ability of the model [15]. Currently commonly used activation functions are Sigmoid, Tanh, and ReLu. Because the ReLu function has linear non-saturation characteristics and fast convergence speed, it can overcome gradient dispersion and is widely used [16]. The formula is shown in Eq. (2):
where
The pooling layer is usually added after the convolutional layer, and down-sampling is performed according to certain rules, thereby reducing the feature space size and network parameters [17]. Common pooling operations include maximum pooling (Max Pooling) and average pooling (Average Pooling). The formula is shown in Eq. (3):
where,
Max pooling takes the maximum value of the pooling area. The formula is shown in Eq. (4):
Average pooling takes the average of the pooled area. The formula is shown in Eq. (5):
The fully connected layer is to classify and recognize the signal after feature extraction [18]. This paper is a two-class classification problem of normal sequence and fault sequence, and the Sigmoid activation function can be used. The formula is shown in Eq. (6) :
where
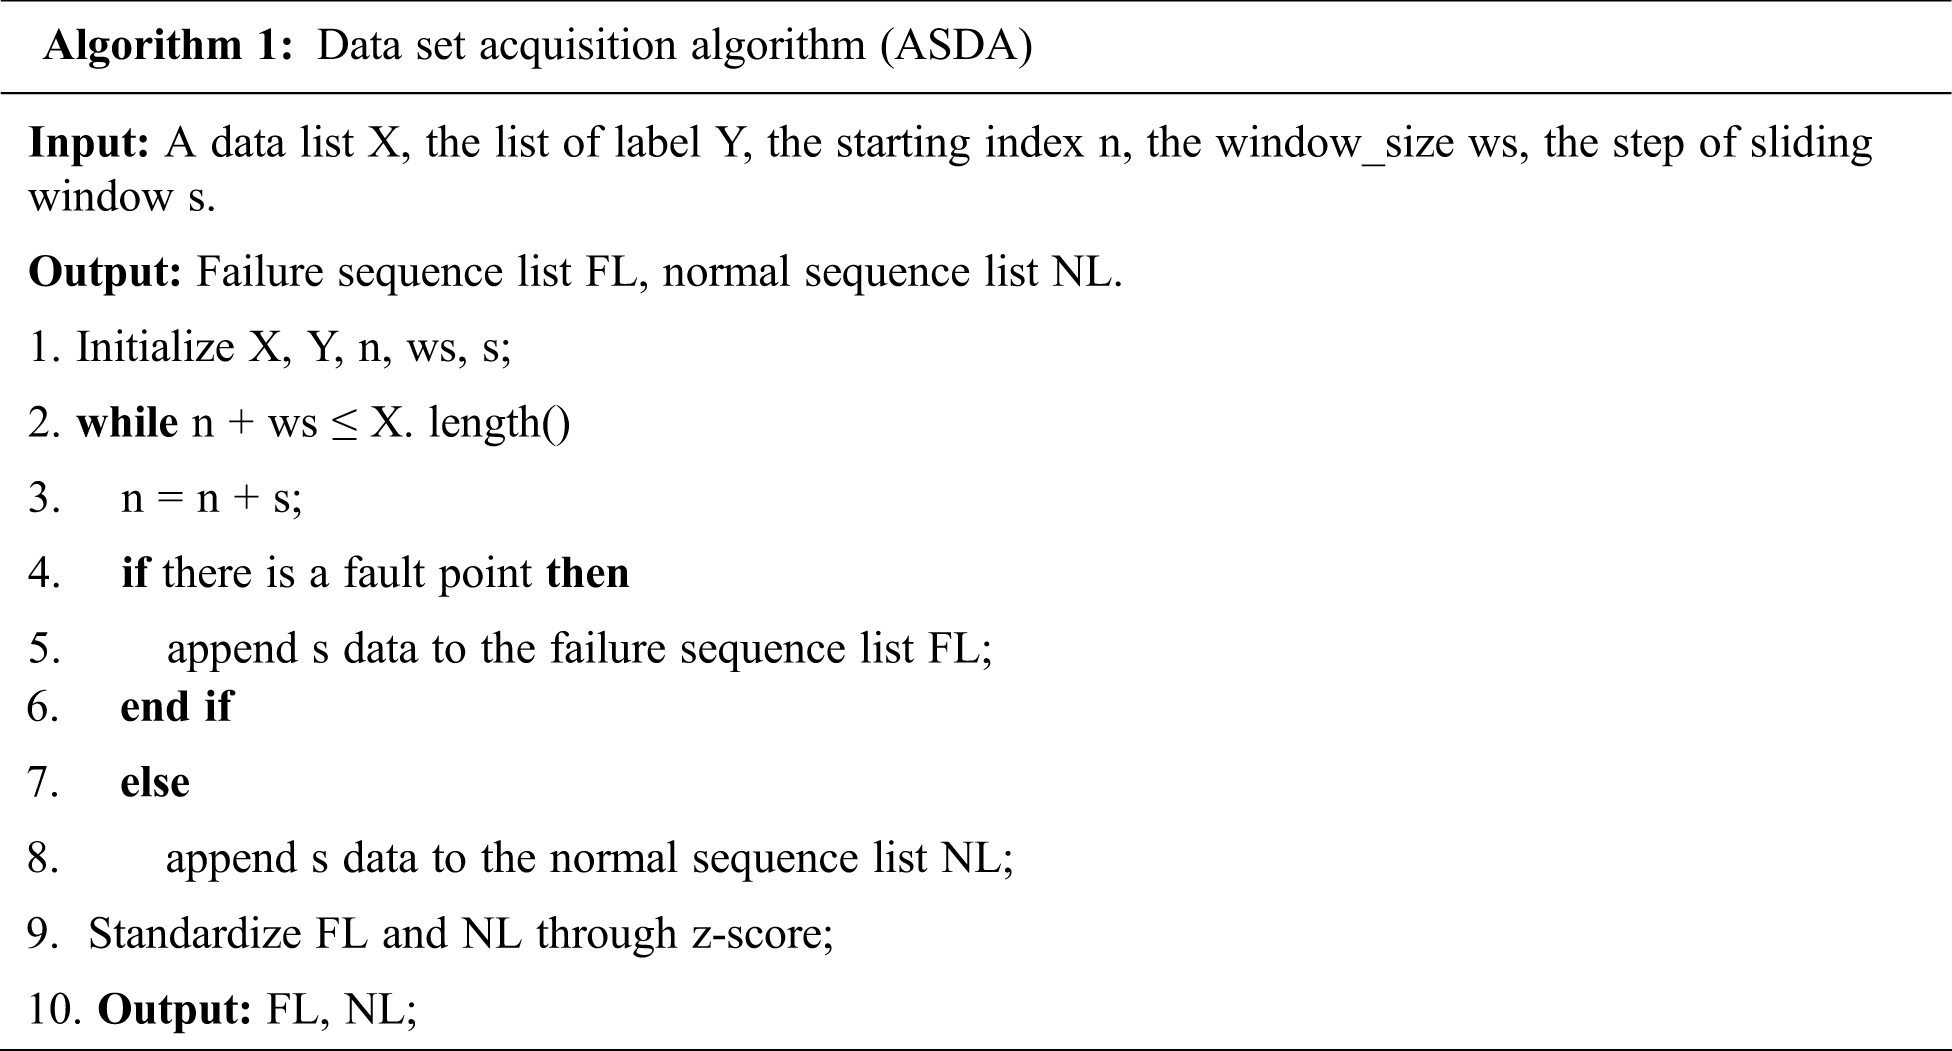
This paper uses sensor data collected by different engines during the test, and takes the largest common set of all sensor data to obtain 6 key sensors. Surge is mainly judged based on the data of two sensors, one is the sensor that artificially controls the state of the engine throttle lever (PLA), and the other is the total pressure sensor (PT3) at the compressor outlet. When the PLA data is stable, the PT3 data curve has sudden changes and severe jitter, and this interval is the surge fault interval [19]. According to this rule, this paper completes the collection of fault points and normal points. In order to generate the normal sequence and the fault sequence, this paper adopts a method similar to the principle of image processing by convolutional neural networks. The division method is from the nth point until the end of n + window_size [20]. The judgment basis is that if there is a fault point in the sequence, the sequence is a fault sequence. In this way, the original data is reshaped into a sample of a specified length for model modeling.
Due to the different nature of the sensor data, they usually have different dimensions and orders of magnitude. When the levels of the various values are very different, if the original index values are directly used for analysis, it will highlight the role of attributes with higher values and relatively weaken the role of attributes with lower values [21]. Therefore, in order to ensure the reliability of the results, the original data needs to be standardized. This experiment uses the commonly used z-score standardization, and the standardization conversion formula is shown in Eq. (7):
where
When dividing the data set, this paper considers the method of random shuffling. Because the original data set may be in order, if the positive examples are concentrated in the front and the negative examples are concentrated in the back, it will cause the validation set or test set to appear mostly negative examples. It is very likely that the training effect of negative examples is not good, and the overall performance of the model deteriorates. In addition, even if it is not orderly, disruption will appear more “fair”, and it will also give the model an opportunity to improve. Therefore, when the original data has a certain distribution law, it will cause the learning curve to be unsmooth [22]. If the amount of data is large enough, it will show a random distribution after being disrupted, and the commonality of the sample will be better reflected after learning [23]. In order to strengthen the generalization ability of the model, this article disrupts the data set (including feature data and labels), and guarantees the correspondence between the feature data and the label in each piece of data.
The scrambled data is divided into three parts: training set, validation set and test set. Firstly, the data set is divided into training set and test set. Since the model construction process also needs to check the configuration and training level of the model, the training data will be divided into two parts, one is the training set for training, and the other is the validation set for testing. The training set is used to train the neural network model, and then the validation set is used to verify the effectiveness of the model, and the model with the best effect is selected until a satisfactory model is obtained. Finally, when the model “passes” the validation set, we then use the test set to test the final effect of the model, and evaluate the precision and recall rate of the model.
This paper uses the data preprocessing method proposed in Section 3.1 to obtain the experimental data set, the selected window size is 64, the step size is 1, and the sequence length obtained is 64. This data set contains normal sequence, fault sequence, and their respective labels. Through data scrambling and division, this paper divides the obtained data set into training set, validation set and test set according to the ratio of 7:2:1.
The aero-engine surge data set acquisition algorithm (ASDA) used in this paper is described as follows:
4.1 Experimental Environment and Model Structure
The operating system used in this paper is Windows 10, and the deep learning frameworks are Tensorflow and Keras. The hardware configuration is: Intel i5 processor, GTX1650Ti graphics card, 8GB memory. The ASFDN network configuration proposed in this paper is shown in Tab. 1, where Kc is the number of convolution kernels, Si is the size of the convolution kernel, and Pw is the pooling width.
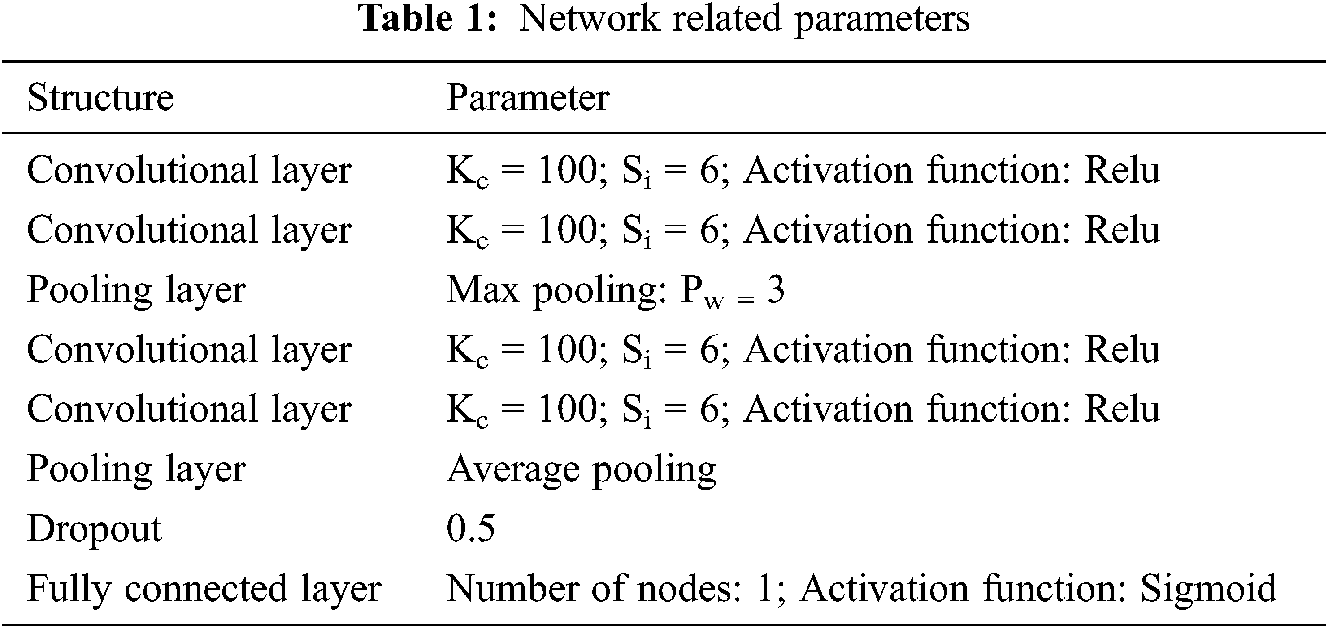
According to the network parameters shown in Tab. 1, the ASFDN in this paper for aero-engine surge fault diagnosis is shown in Fig. 2.
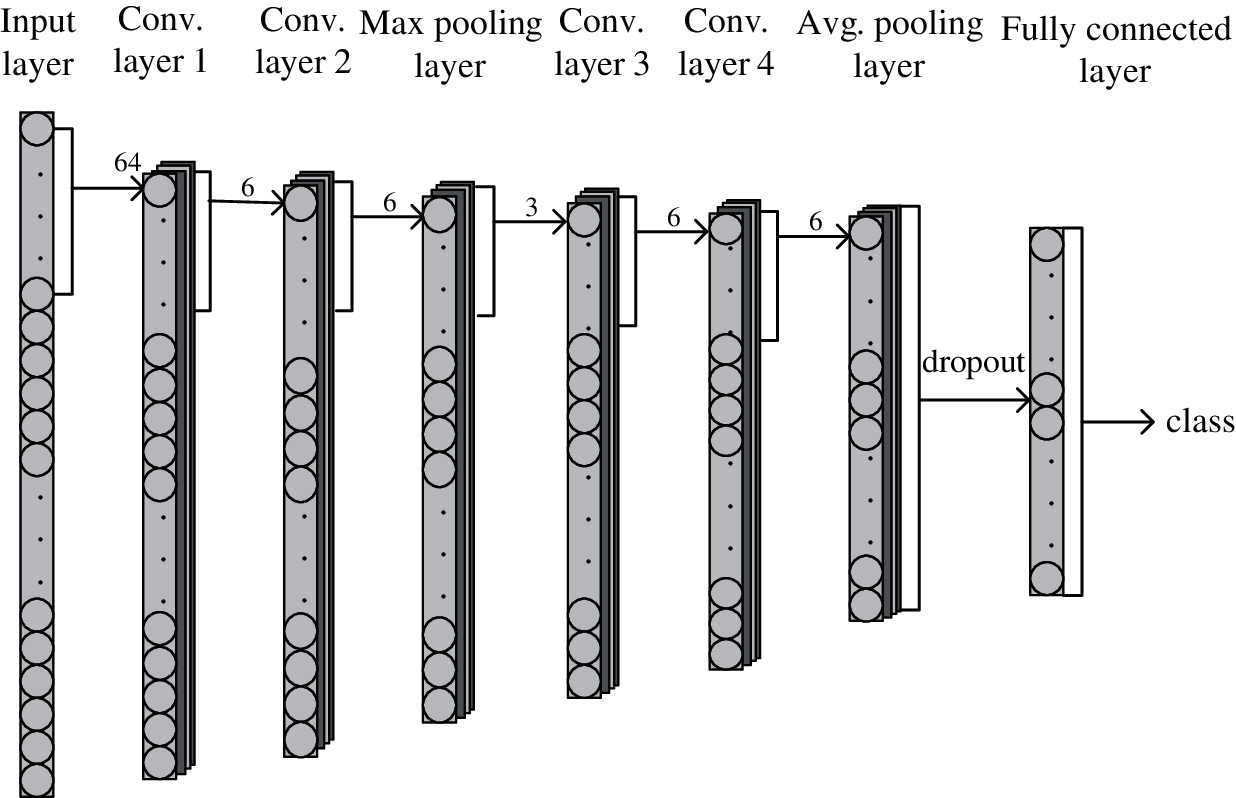
Figure 2: The structure of ASFDN
In general, the confusion matrix visualizes the performance of the algorithm in tabular form, as shown in the following table:
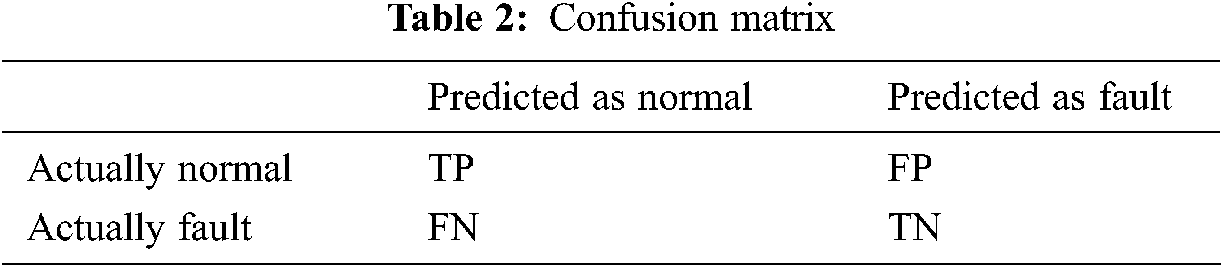
In Tab. 2, true positive (TP), false negative (FN), false positive (FP) and true negative (TN) are expressed as follows
1. True positive (TP) is the total number of samples predicted as “normal” and actually “normal”;
2. False negative (FN) is the total number of samples predicted as “normal” and actually “fault”;
3. False positive (FP) is the total number of samples predicted as “fault” and actually “normal”;
4. True negative (TN) is the total number of samples predicted as “fault” and actually “fault”.
In order to evaluate the performance of the classification model, the evaluation metric used in this paper is precision, recall, and F1 score, which can be calculated using these 4 metrics in the confusion matrix. The precision, recall and F1 score are calculated by Eqs. (8)–(10), respectively.
On the ASFDN model built in this paper, five optimization algorithms, SGD, RMSprop, Adagrad, Adadelta, and Adam, are used to optimize the network. The experimental results are shown in Fig. 3. Fig. 3 shows the effect of different optimization functions on the verification set. The left picture shows the change curve of loss value (loss), and the right picture shows the change curve of accuracy value (accuracy). It can be seen from the results that the loss value of the ASFDN model decreases rapidly and tends to be stable, and the accuracy is rapidly improved to reach a stable state, which shows the effectiveness of the model for the classification of aero-engine surge faults. Among them, when the optimization function Adam is used, the loss after the model converges reaches the lowest and the accuracy reaches the highest, and the performance is better. Next, the experiment also uses the five optimization algorithms of SGD, RMSprop, Adagrad, Adadelta, and Adam to compare the three indicators of recall, precision, and F1 score on the test set. As shown in Fig. 4, the left picture is the test result of the fault sequence, and the right picture is the test result of the normal sequence. Since this article mainly studies the classification of aero-engine surge faults, it focuses more on the fault identification. It can be seen from Fig. 4 that for the fault sequence, when the optimization function Adam is used, the accuracy and F1 score reach the highest. For normal sequences, these 5 optimization functions perform relatively evenly on these 3 metrics. The experimental results show that the ASFDN model uses the optimization function Adam to achieve better results.
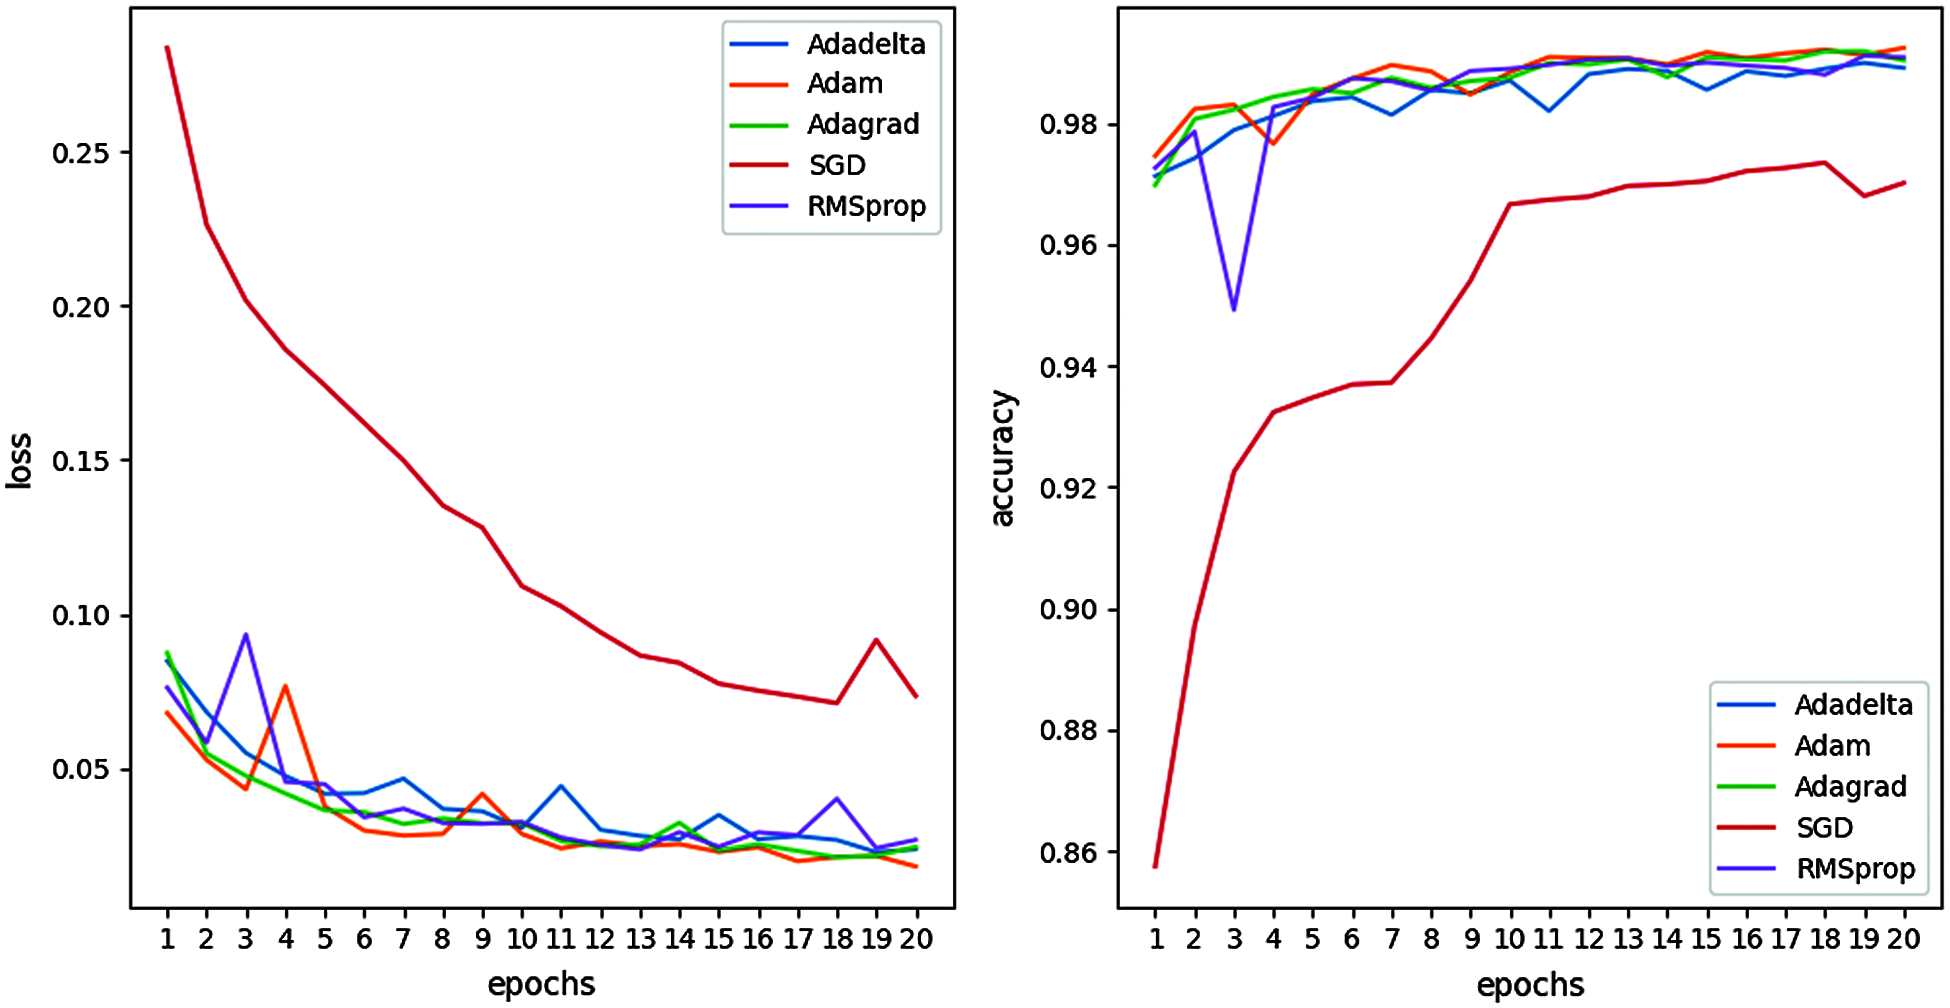
Figure 3: Comparison of results of different optimization functions
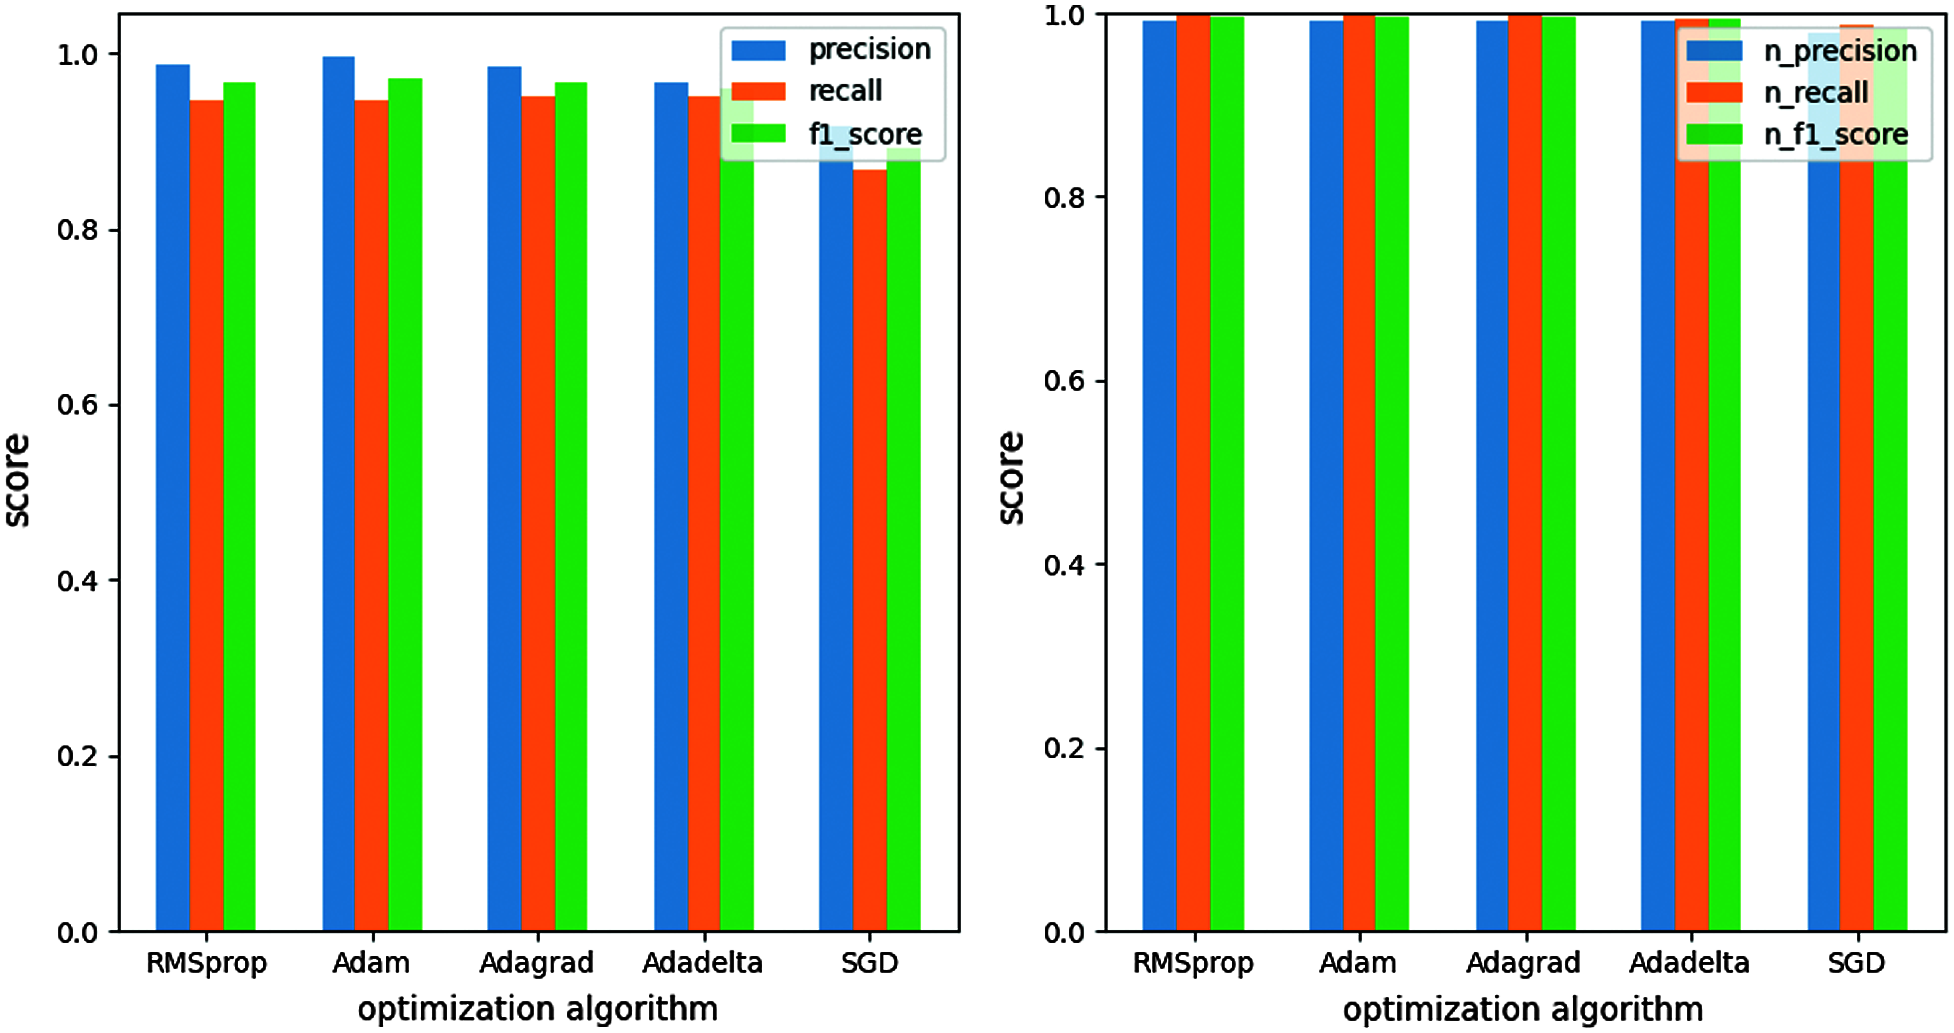
Figure 4: Different optimization function evaluation metrics
This paper uses different network model methods to conduct experiments, and compares the metrics shown in Tab. 3 on the test set.
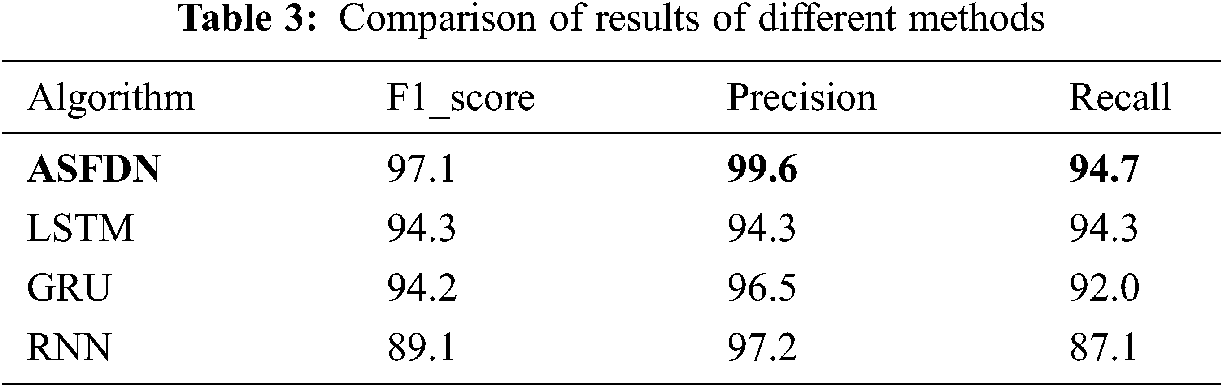
This paper mainly compares with the RNN and its improved model commonly used in sequential data processing. It can be seen from Tab. 3 that the improved model of RNN is better than the simple RNN, but the ASFDN model proposed in this article is in each evaluation index The above are better than other experimental models. The F1_score is 97.1%, the precision on the test set is 99.6%, and the recall rate is 94.7%. Through comparative experiments, the effectiveness of the ASFDN in the diagnosis of aero-engine surge faults is proved. From the results of the two classifications, the effect is outstanding.
The ASFDN model proposed in this paper is an adaptive fault diagnosis algorithm. The experimental data set is obtained from the aero-engine sensor data, and the ASFDN model is verified and tested in many aspects on this data set. The experimental results show that the ASFDN model does not need to manually extract features, and can directly use the original vibration signal as the model input to realize the aero-engine surge fault diagnosis and achieve good results. This method has strong generalization ability and robustness, and has higher accuracy and best performance than other methods in this experiment. In addition, this paper proves that ASFDN can be well applied to time series analysis of sensor data. Experiments show that there is still room for optimization and improvement of the ASFDN model. Future research can consider combining the better-performing ASFDN with LSTM to improve the classification accuracy and model generalization ability.
Funding Statement: This work was supported by Scientific Research Starting Project of SWPU [No. 0202002131604]; Major Science and Technology Project of Sichuan Province [No. 8ZDZX0143, 2019YFG0424]; Ministry of Education Collaborative Education Project of China [No. 952]; Fundamental Research Project [Nos. 549, 550]; Development of Aero-engine Test and training platform based on Simulation Technology [18ZA0030].
Conflicts of Interest: The authors declare that they have no conflicts of interest to report regarding the present study.
1. P. B. Ding and Z. S. Wang, “The research on the surge mechanism and monitoring method of aero-engine,” Science Technology and Engineering, vol. 10, no. 15, pp. 247–251, 2010. [Google Scholar]
2. J. B. Li, S. Zhang, X. Y. Sun and W. G. Xia, “SDA-RVM based approach for surge fault detection and diagnosis during aero-engine take-off process,” in Int. Symp. on Positive Systems, Cham, Springer, vol. 480, pp. 203–213, 2018. [Google Scholar]
3. W. Huang and X. H. Huang, “Adaptive acceleration control for aero-engine based on active anti-surge control,” Measurement & Control Technology, vol. 32, no. 4, pp. 61–65, 2013. [Google Scholar]
4. P. Luo and Y. Hu, “Research on rolling bearing fault identification method based on LSTM neural network,” IOP Conference Series: Materials Science and Engineering, vol. 542, no. 1, pp. 12048, 2019. [Google Scholar]
5. S. Huang, J. Tang, J. Dai, Y. Wang and J. Dong, “1DCNN fault diagnosis based on cubic spline interpolation pooling,” Shock & Vibration, vol. 2020, no. 2–3, pp. 1–13, 2020. [Google Scholar]
6. L. Yu, J. Qu, F. Gao and Y. Tian, “A novel hierarchical algorithm for bearing fault diagnosis based on stacked LSTM,” Shock & Vibration, vol. 2019, no. PT.1, pp. 2756284.1–2756284.10, 2019. [Google Scholar]
7. L. Zhao, C. Mo, T. Sun and W. Huang, “Aero engine gas-path fault diagnose based on multimodal deep neural networks,” Wireless Communications and Mobile Computing, vol. 2020, no. 6, pp. 1–10, 2020. [Google Scholar]
8. D. Qiu, Z. Liu, Y. Zhou and J. Shi, “Modified bi-directional LSTM neural networks for rolling bearing fault diagnosis,” in ICC 2019-2019 IEEE Int. Conf. on Communications (ICC). China, IEEE, pp. 1–6, 2019. [Google Scholar]
9. A. Yin, Y. Yan, Z. Zhang and C. Li, “Fault diagnosis of wind turbine gearbox based on the optimized LSTM neural network with cosine loss,” Sensors, vol. 20, no. 8, pp. 2339–2351, 2020. [Google Scholar]
10. D. Zeng, Y. Dai, F. Li, J. Wang and A. K. Sangaiah, “Aspect based sentiment analysis by a linguistically regularized CNN with gated mechanism,” Journal of Intelligent and Fuzzy Systems, vol. 36, no. 5, pp. 3971–3980, 2019. [Google Scholar]
11. C. Li, D. Zhao, S. Mu, W. Zhang, N. Shi et al., “Fault diagnosis for distillation process based on CNN-DAE,” Chinese Journal of Chemical Engineering, vol. 27, no. 3, pp. 125–131, 2019. [Google Scholar]
12. S. Huang, J. Tang, J. Dai and Y. Wang, “Signal status recognition based on 1DCNN and its feature extraction mechanism analysis,” Sensors, vol. 19, no. 9, pp. 2018–2036, 2019. [Google Scholar]
13. Y. Wang, S. Huang, J. Dai and J. Tang, “A novel bearing fault diagnosis methodology based on SVD and one-dimensional convolutional neural network,” Shock & Vibration, vol. 2020, no. 9, pp. 1–17, 2020. [Google Scholar]
14. X. Li, Q. Zhu, Q. Meng, C. You, M. Zhu et al., “Researching the link between the geometric and renyi discord for special canonical initial states based on neural network method,” Computers, Materials & Continua, vol. 60, no. 3, pp. 1087–1095, 2019. [Google Scholar]
15. Z. Ran, D. Zheng, Y. Lai and L. Tian, “Applying stack bidirectional LSTM model to intrusion detection,” Computers, Materials & Continua, vol. 65, no. 1, pp. 309–320, 2020. [Google Scholar]
16. D. Wang, J. Zeng and S. B. Lin, “Random sketching for neural networks With ReLU,” IEEE Transactions on Neural Networks and Learning Systems, vol. PP, no. 99, pp. 1–15, 2020. [Google Scholar]
17. J. Liu, Y. Cheng, X. Wang and Y. Kong, “Joint sample expansion and 1D convolutional neural networks for tumor classification,” in Int. Conf. on Intelligent Computing, Cham, Springer, pp. 135–141, 2017. [Google Scholar]
18. X. Y. Li, Q. S. Zhu, M. Z. Hunag, H. Wu, S. Y. Wu et al., “Machine learning study of the relationship between the geometric and entropy discord,” Euro Physics Letters, vol. 127, no. 2, pp. 20009–20015, 2019. [Google Scholar]
19. L. Gou, H. Li, H. Zheng, H. Li and X. Pei, “Aero engine control system sensor fault diagnosis based on CWT and CNN,” Mathematical Problems in Engineering, vol. 1, no. 3, pp. 1–12, 2020. [Google Scholar]
20. C. Jin, K. Yi, L. Chen, R. X. Yu and X. Lin, “Sliding-window top-k queries on uncertain streams,” The VLDB Journal, vol. 19, no. 3, pp. 411–435, 2010. [Google Scholar]
21. M. Z. Al-Faiz, A. A. Ibrahim and S. M. Hadi, “The effect of Z-Score standardization (normalization) on binary input due the speed of learning in back-propagation neural network,” Iraqi Journal of Information and Communication Technology, vol. 1, no. 3, pp. 42–48, 2019. [Google Scholar]
22. Z. Qu, S. Chen and X. Wang, “A secure controlled quantum image steganography algorithm,” Quantum Information Processing, vol. 19, no. 380, pp. 1–25, 2020. [Google Scholar]
23. X. Y. Li, Q. S. Zhu, Y. Huang, Y. Hu, Q. Meng et al., “Research on the freezing phenomenon of quantum correlation by machine learning,” Computers Materials & Continua, vol. 65, no. 3, pp. 2143–2151, 2020. [Google Scholar]
 | This work is licensed under a Creative Commons Attribution 4.0 International License, which permits unrestricted use, distribution, and reproduction in any medium, provided the original work is properly cited. |