DOI:10.32604/csse.2022.021606
| Computer Systems Science & Engineering DOI:10.32604/csse.2022.021606 | |
| Article |
Prediction Model Using Reinforcement Deep Learning Technique for Osteoarthritis Disease Diagnosis
1Department of Computer Engineering, King Khalid University, Abha, Saudi Arabia
2Department of Computer Science, King Khalid University-Sarat Abidha Campus, Abha, Saudi Arabia
*Corresponding Author: R. Kanthavel. Email: kanthavel2005@gmail.com
Received: 08 July 2021; Accepted: 18 August 2021
Abstract: Osteoarthritis is the most common class of arthritis that involves tears down the soft cartilage between the joints of the knee. The regeneration of this cartilage tissue is not possible, and thus physicians typically suggest therapeutic measures to prevent further deterioration over time. Normally, bringing about joint replacement is a remedial course of action. Expose itself in joint pain recognized with a normal X-ray. Deep learning plays a vital role in predicting the early stages of osteoarthritis by using the MRI pictures of muscles of the knee muscle. It can be used to accurately measure the shape and texture of biological structures can be measured consistently from X-ray images. Moreover, deep learning-based computation can be used to design framework to predict whether a given patient will develop osteoarthritis. Such a framework can identify clear biochemical changes in the focal point of ligaments of the knees of patients who have exhibit pre-indications in standard imaging. This study proposes framework to identify cases of osteoarthritis by using deep learning and reinforcement learning. It can be used as a clinical mechanism to predict the occurrence of osteoarthritis so that patients can benefit from early intervention.
Keywords: Osteoarthritis; deep learning; reinforcement learning; arthritis; early detection; training and framework
The human skeletal system is a persistent framework that plays a key role in retaining the shape of the body and enabling its movement. Joints are the points where bones are connected for Osteoarthritis Disease Diagnosis to a layer of soft tissue known as ligaments [1]. Ligaments are fibrous connective tissues that form a thin layer over the junction of joints to prevent friction between the bones and prevent abnormal movement [2]. The application of excessive stress for long periods gradually reduces the strength of the ligaments and causes arthritis. Osteoarthritis (OA) is a widely known joint disorder that occurs when soft tissues between the joints degenerate owing to prolonged stress [3]. In general, OA affects the joints in the hands, knees, spinal region, and ankles. Chronic OA consists of four stages: minor, mild, moderate, and severe [4]. Several therapeutic techniques have been developed to treat OA. The early detection of the degradation of the cartilage can prevent eventual disability in the patient [5]. Image processing is an efficient technique for identifying the different stages of osteoarthritis. Various classification processes have been developed to identify the stages of osteoarthritis of the knee. The general radiological technique, X-ray, is commonly used to visualize the knee to analyze changes in it during the early stages of OA. MRI, CT, and ultrasound have also shown promising results for the identification of OA, but X-rays are more reliable, easier to obtain, and accurate at identifying OA in joints of the knee. Fig. 1 shows the different stages of the osteoarthritis of the knee.
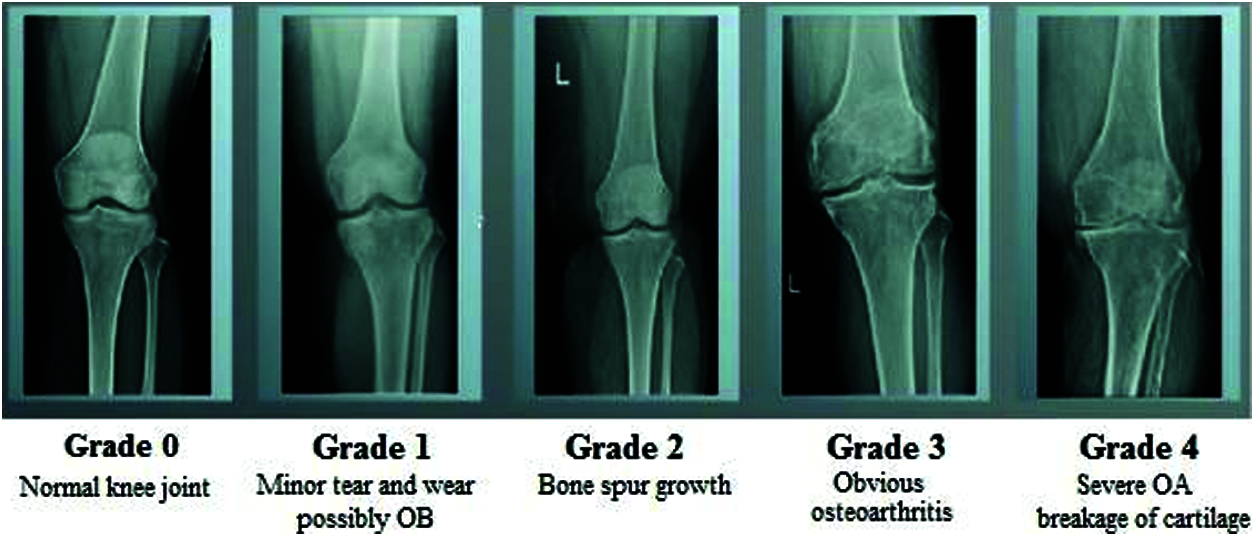
Figure 1: Different stages of osteoarthritis
Reinforcement learning (RL) has delivered promising results in a variety of fields in recent years, including medical diagnosis. Its structure is shown in Fig. 2. The essential model of reinforcement learning model combines reinforcement deep learning, and can be applied to the medical environment [6]. RL offers a statistical formalism for learning-based management and in deep reinforcement learning (DRL) makes use of neural associations through reinforcement learning to form a framework containing high-dimensional information [7]. Model-based RL makes it possible to solve difficult problems. RL consolidates organizations that empower specialists to familiarize themselves with ideal activities in a virtual climate to accomplish their objectives [8]. This enables work estimation and objective streamlining, and allows for the planning of positional activity sets to attain the expected outcomes [9]. But neural network components are intended to create AI advancements in detecting OA in an early stage [10]. In addition the machine learning techniques helps in decision making of further treatment of OA [11]. Because, the model is equipped to identify every change, RL model-based computation can provide additional oversight [12]. This has been accomplished as a result of its influential “function approximation techniques” by using neural networks. RL is a field of AI in which the user collaborates with the environment by creating moves to enhance their standard reward [13]. This study applies reinforcement learning to medical image processing to identify the stages of osteoarthritis.
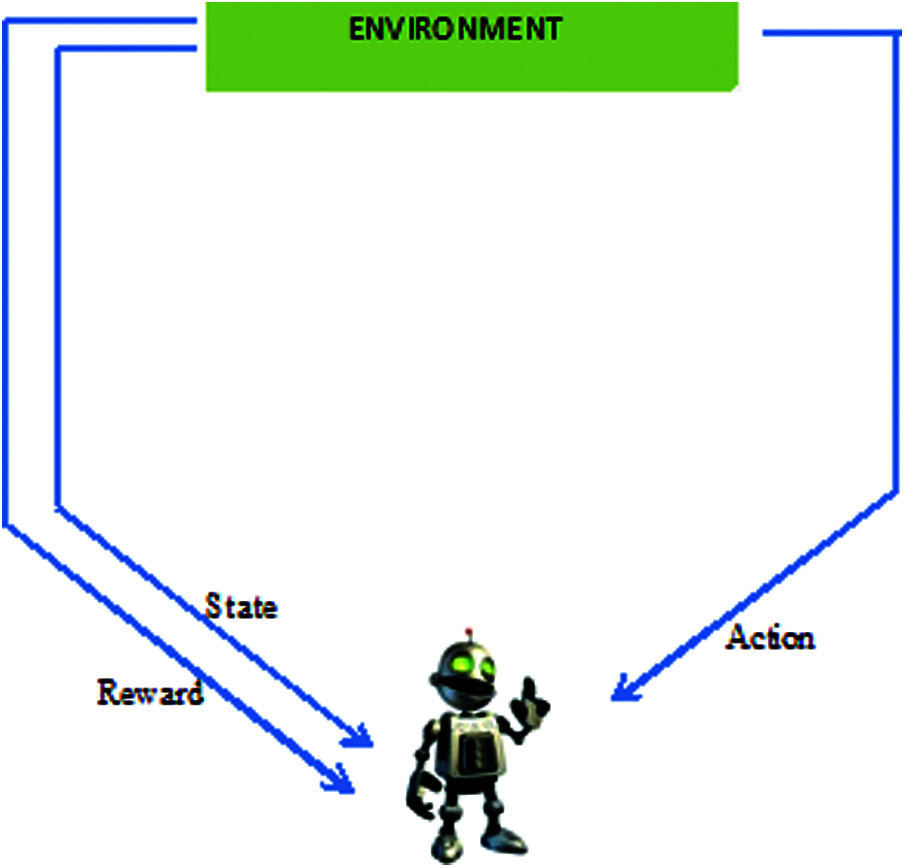
Figure 2: Infrastructure of reinforcement learning
1.1 Arthritis in Knee: Four Stages of Osteoarthritis
OA is a kind of joint disorder. Specialists claim that half of all people eventually build up some kind of suggestive OA in their lives. It can influence the hips, hands, and shoulders, and usually occurs in the knees. Fig. 3 shows a normal knee and one affected by OA. OA got progressively can be treated, where identifying it in the early stage is important for successful treatment [14]. The four phases of OA in each stage are discussed below.
• The first stage (Class 0) is considered normal with minor abnormalities. This is the most benign phase of OA, and patients experience a negligible amount of pain.
• The second stage (Class 1) is mild. This is the first stage in which bone spur enlargement can be observed through X-ray. The exaggerated region becomes rigid after extensive periods of inactivity, and becomes painful.
• The third stage (Class 2) is moderate; the cartilage in the exaggerated region begins to wear away. The joint swells up, and the patient experiences discomfort in everyday movements [15].
• The fourth stage (Class 3) is severe. The pain increases, and nearly the entire cartilage moves to create a provocative reaction that starts in the joint and causes extreme pain.
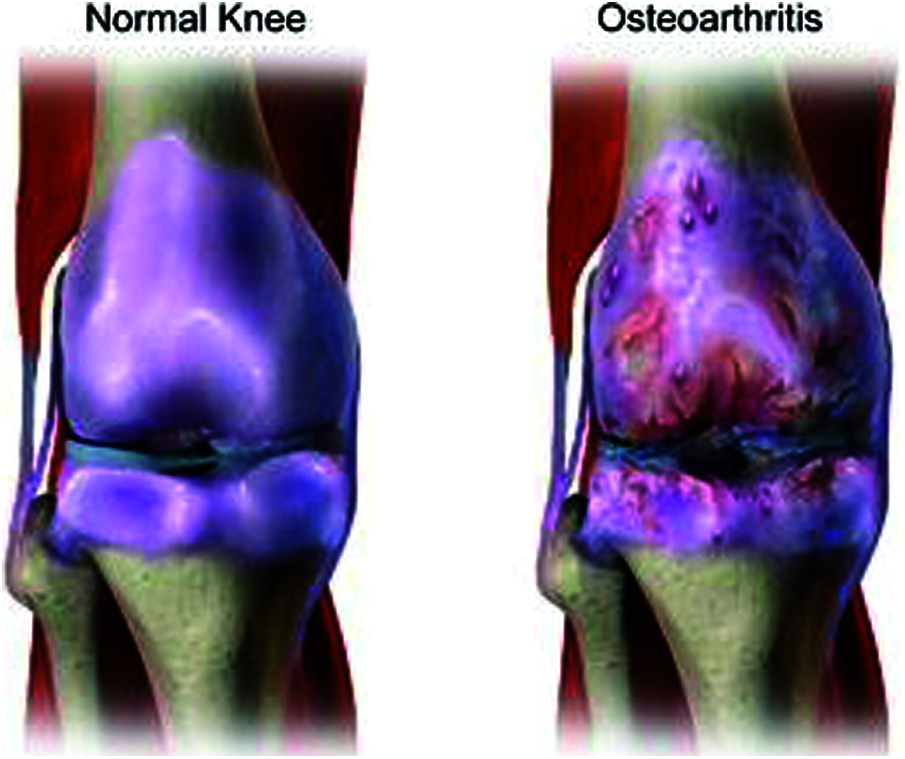
Figure 3: Normal knee and affected knee OA
X-ray is the primary means of identifying OA by detecting the loss of muscles of the joint, tightening of the joint space between adjoining bones, and bone prod development. However, X-cannot identify muscle abnormality in a timely manner in case of OA. They can provide signs of mild OA (i.e., minor irregularities) while the patient might be experiencing serious symptoms. Deep reinforcement learning is a class of man-made brainpower in the form of ML and AI where enthusiastic machines can get from their actions resembling how people get as a substance of information. Innate in this kind of AI is that a specialist is rewarded or punished based on their actions. This is used to analyze OA lesions based on their severity and classify them. The remainder of this paper is organized as follows: Section 2 reviews the relevant literature on OA, Section 3 details the proposed framework, Section 4 describes experiments to verify it and discusses the results, and Section 5 summarizes the results of this study [16].
This section reviews past research on OA, its stages, challenges in its early detection, and the need for machine learning to this end. We also explain how AI and Machine Learning (ML) techniques have been used for theearly detection and prediction of OA with high accuracy.
Kokkotisab et al. (2020) significant instructions of reviewed methods to predict the OA of the knee by using design consisting of four sections: prediction as regression, as classification, the best possible post-treatment methods, and combinations to analyze the complexity, heterogeneity, and size of the data. Tiulpin et al. (2018) presented a PC-supported technique that uses the deep Siamese CNN to detect the seriousness of OA according to the Kellgren–Lawrence scale. The network was trained on multi-center OA data with 3,000 themes from the relevant records. Atul Deodhar et al. (2020) developed a mathematical framework to predict enclosing spondylitis that outperformed a clinical model. Fang Liu et al. (2018) determined the utility of applying a completely automated deep learning method to identify lesions in the cartilage by using the sensitivity and specificity of MRI data. Qayyum et al. [17] summarized several applications in healthcare that pose challenges in terms of security and privacy, and suggested approaches to guarantee the privacy of patients when using their data for ML in medical applications. Ying Yu et al. (2019) outlined the use of deep learning to deal with clinical data by analyzing the characteristics of the data to implement precision medicine. Yangqin Feng et al. (2020) projected DNN structures to arrange mimicked DOT pictures of aggravated and non-excited joints by learning their movements. The results of experiments showed that of the three neural network-based approaches was more accurate than the support vector machine [18].
Latif et al. (2019) surveyed groups of clinical images to identify objects, recognize patterns, and consider principles of justification to enhance the accuracy of extracting meaningful patterns for specific disease. They also discussed the challenges, merits and demerits, and outstanding issues in DL methods in the context of clinical imaging. Zhu et al. (2021) examined the relationship between OA of the knee and osteoporosis in a retrospective study by analyzing medical records collected on the HSS and VAS scores of two groups of patients. Christodoulou et al. (2019) investigated deep neural networks (DNNs) to classify the difficult challenging issues in OA of the knee, and applied an efficient ML method that considers of medical factors that affect OA. Kokkotis et al. (2020) provided a data mining method that can diagnose KOA by enabling the output of the of model output model to focus on accurate predictions. Sumitra investigated the usefulness of applying ML methods to examine electromyography (EMG) patterns in the gait of arthritic patients to identify certain muscle disorders. Van Tulder et al. (2019) examined three methods for unsupervised cross-modality feature learning based on a shared auto-encoder-like convolutional network to represent multi-modal data and investigate feature normalization. Charis Ntakolia et al. (2020) proposed procedural stands on ambidextrous statistics as of the OA inventiveness record by employing a clustering development to recognize clusters, a vigorous characteristic choice procedure be composed of various methods to categorize the risk factors and a decision making procedure [19]. Yu et al. (2019) proposed a deep learning algorithm to examine multi-modal data on patients to identify the pertinent physical features, and designed software to predict the type of prosthetics highly accurately. The above review shows that although ML-based prediction algorithms have been proposed in the literature, they lack accuracy in terms of sensitivity, specificity, and prognostic cost. A prediction algorithm based on a deep neural network DNN is needed to overcome the shortcomings of previous methods for Knee OA. The proposed method uses reinforcement learning to improve the accuracy of classification of knee OA.
3 Proposed Framework and Method
In this proposal, we presented a Reinforcement method to envisage an occurrence of Knee OA for the age group of 50 years. The age group of below 50 years, the usage of statistical data has been applied to categorize by Gender, Body Mass Index, Injury history, Lifestyle, a record of chronic diseases, Smoking status, Health Status, and Physical activity. The DNN generates features from the dataset and calculates the risk of knee OA.
Dataset: The publicly available Osteoarthritis Initiative (OAI) dataset was used to train and test the proposed method. X-ray images of 4,000 patients were integrated with this dataset. Half of the patients whose data were used were over 50 years old and the other half were younger than 50 [20]. The dataset was divided into training and a testing part. Fig. 4 shows the proposed neural network architecture trained on 65% and tested on the other 35%. A data processing model based on the vector model was applied this Deep Neural network used in the DNN to generate the model. Trained Deep neural network has been based on Vector of codes to engender the deep neural network representation [21]. Fig. 5 shows the proposed DNN architecture for identifying knee OA.
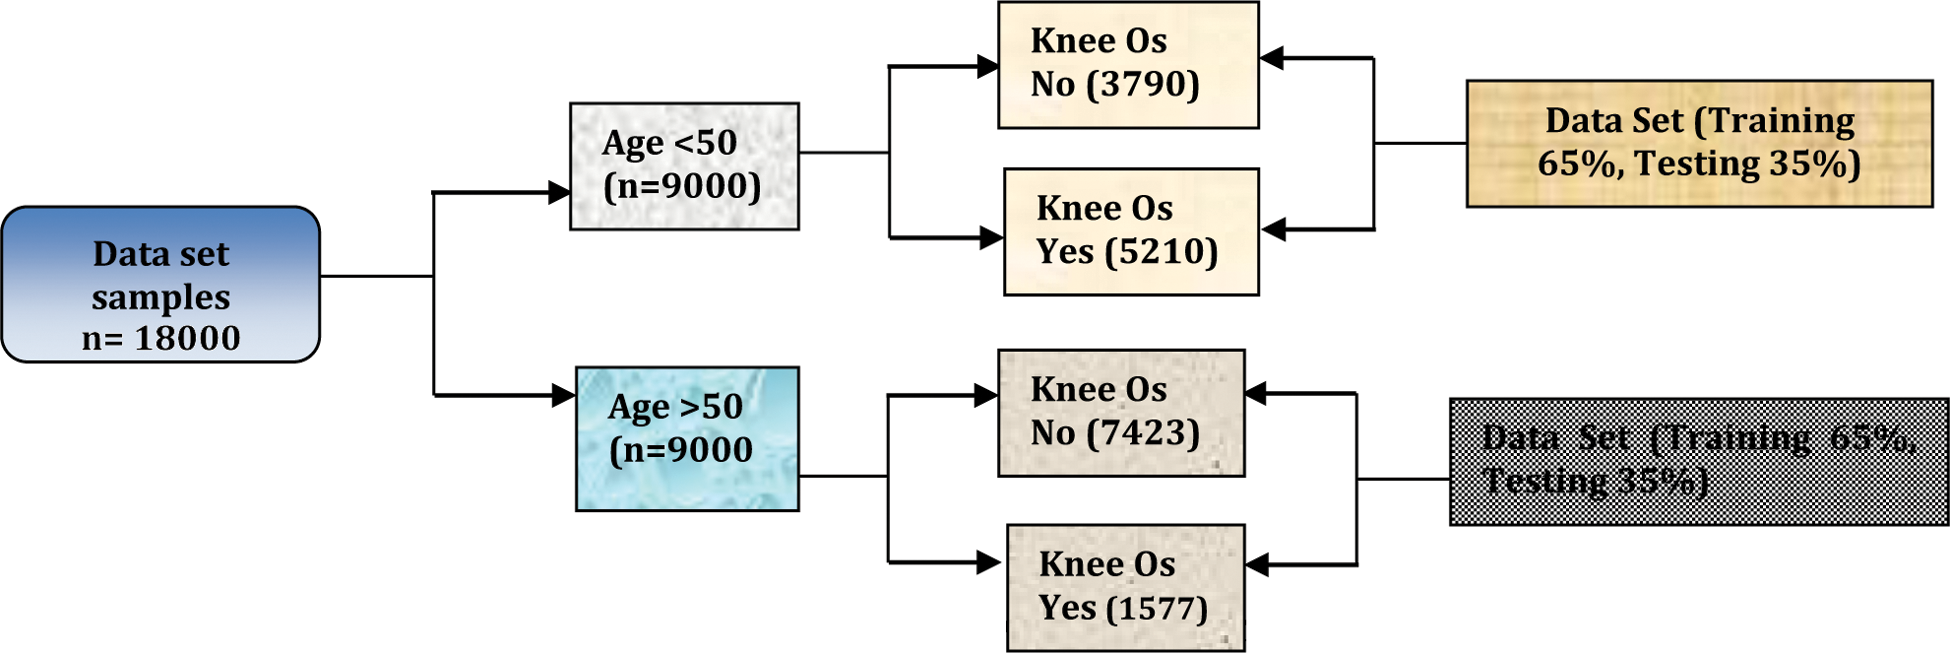
Figure 4: Investigating knee OA

Figure 5: Proposed deep neural network architecture for knee OA
Variables used: Persons with knee OA were identified and distinguished by the following:
• Gender (male/female),
• Age (>50 years, <50 years),
• BMI (underweight, normal, overweight, obese),
• Injury and lifestyle,
• Chronic diseases, such as blood pressure and diabetes, etc.
• smoking status (smoker, former smoker, non-smoker),
• Level of health status (from very poor to very good
• Physical activity (good, best, normal).
Preprocessing: The vector model of the DNN was used for the preprocessing mechanism. The vector model is an arithmetical model used for text reports as vectors of identifiers, such as terms in a list [22]. The vector model represents the dimensions of the given data and a simple slant for extracting the pertinent data from unclear datasets [23]. Fig. 6 shows X-ray images used for preprocessed preprocessing for knee OA (L & R).
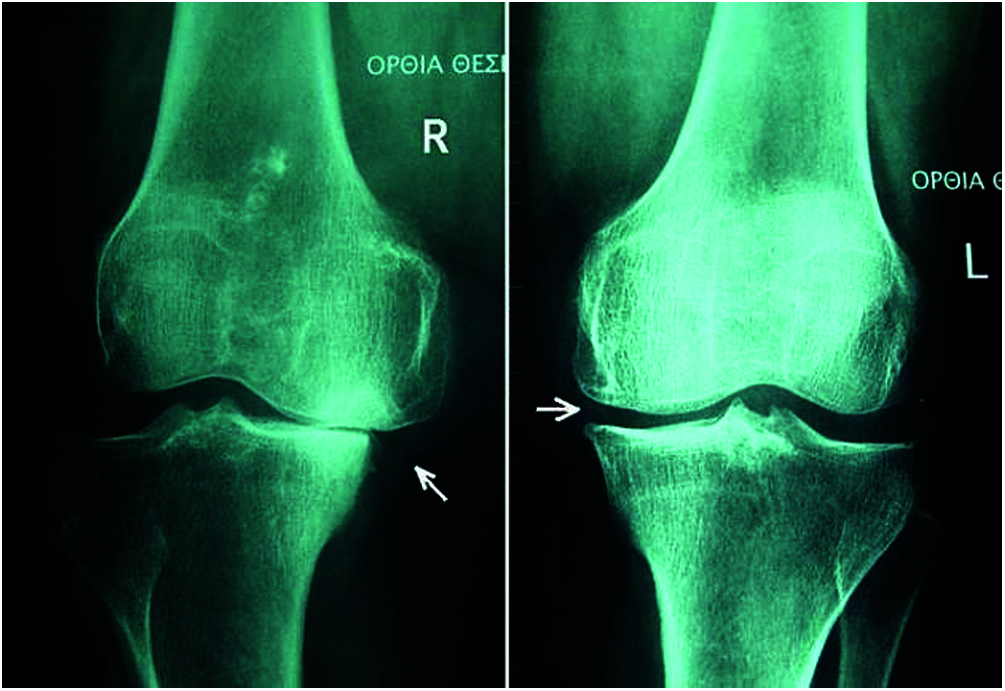
Figure 6: X-ray of preprocessed Knee OA (L & R)
Deep Neural Network (DNN): We use a DNN with forward back-propagation. For each instance of training, we use dissimilar hyper-different boundaries, numbers of hidden layers, number of neurons in each layer, and streamlining strategies [24]. The DNN that delivered the best performance had layers with 90 and 20 neurons each. RL is a certain kind of active research field through a part of ML for which mathematical sophisticated mathematical frameworks and technologies have been developed. The key aspect is to an adaptive and autonomous decision-maker that learns its decisions by trial and error in complex circumstances to meet the given objective despite environmental uncertainties. In subsequent phases (t), the agent performs an environmental status observation ((t)), chooses an appropriate action ((t)), and returns this to the environment. The In the next iteration, the user changes the condition to ((t) + 1) ((t) + 1). The representation relies on discovering appropriate measures to monitor this mechanism. This process is autonomously carried out through the RL technique [24]. It is a Markov decision process that consists of a series of environmental conditions: ((t)), the probability distribution of the starting state (s0), an action set (a(t)), a probability function P(s(t) + 1|s(t), and a(t) to map the state and the action functions. The structure of RL has three key elements: a reward, a target value, and a policy. A policy is known as a map π: S × A → [0; 1] that specifies the probability function. We follow the chosen procedure π and initialize the states using a fitness function:
The cumulative discounted reward “r” earned over an infinitely long trajectory, starting at state “s” in case the procedure is followed during the execution of the function, is known as the predicted discounted reward. The response to the system of equations can also be described as this function that delivers the optimum value. The problem is to identify the stationary policy π∗ of action π ∗ (s) (i.e., the optimal policy) that maximizes the starting states. The solution for the simultaneous equation is given by the optimal value function (F ∗ (s)) as
We may then define the optimal strategy as follows, provided the optimal policy function (2) holds:
One method of choosing the optimum policy is to calculate the optimal cost function (2), which can be solved for by using a simple iterative algorithm called value iteration. This has been shown to converge to the appropriate V∗ values. RL technology is primarily concerned with ways to obtain the optimal policy when such a model is not known in advance. The agent must interact with the environment directly to obtain information that, when used in an appropriate algorithm, can be processed to produce an optimal policy [25]. The most popular technique in RL is Q-learning, which is a model-free method used to find an optimal action—selection policy for any given (finite) Markov decision process. It works by learning an action—value function
The equation gives the expected efficacy of performing the assigned activities in a given state by following the optimal policy. Thus, F ∗ (s) = arga′ max G(s′, a′). Let Go(s, a) be an old action—value function from the experience tuple (s, a, r). The new value is
a represents the learning rate, which decreases gradually. After training, the model was tested for errors and on the sample task in a step-by-step manner. The action was repeated many times in each state for an infinite run as the learning rate decreased with the processing speed. Then, the Q value changed with the probability G∗ (s, a). The output of the training process was obtained through the precision ratio and the vector value. The training of the DNN and the vector model to generate stable features. The suitability of the proposed method for detecting knee OA in itsearly stages in case of limited data and the scalability of KOA were the other challenges in this context.
The results were processed in MATLAB2019. In this result analysis, the X-ray images from the OAI dataset were used to analyze the outputs byusing deep reinforcement DR learning, and the performance of the proposed method was analyzed and compared with prevalent techniques of classification.
From the experimental analysis, it is obvious that osteoarthritis can be analyzed and processed by this technique. In Fig. 7b, the X-Ray image is preprocessed using the histogram equalization Technique. In Fig. 7c, RL learning algorithm is implemented to section and classify joint disorder of X-Ray images and Fig. 7d is the classification output of the osteoarthritis region of knee. The experimental result of the proposed technique is compared with different existing techniques to evaluate its performance.

Figure 7: Experimental result of reinforcement learning using X-ray images: (a) Sample image; (b) Correlation histogram; (c) Reinforcement learning; (d) Output of classification
Performance analysis: The expected outcome has been calculated using real information marked by the treatment center. We also fulfilled the training data and testing data for not go beyond the patient’s statistics. The result is categorized into four parts i.e., TP, TN, FP, and FN in terms of positive and negative. Because a Deep Neural network has the value of either true or false. True Positive means accurate envisagation of Knee OA. False Positive means accurate envisagation of Non-Knee OA. False Positive means inaccurate envisagation of Knee OA. False Positive means inaccurate envisagation of Non-Knee OA. The performance calculation is measured by the rate of exactness of the given data sets (trained data and tested data). Depends on the age limit the Knee OA is varied as discussed. To find the disproportion of these findings of Knee OA, we have used supplementary values like Sensitivity, Specificity, and prognostic cost. The formulas are
where x, y, a, and B are represented by TP, TN, FP, and FN respectively.
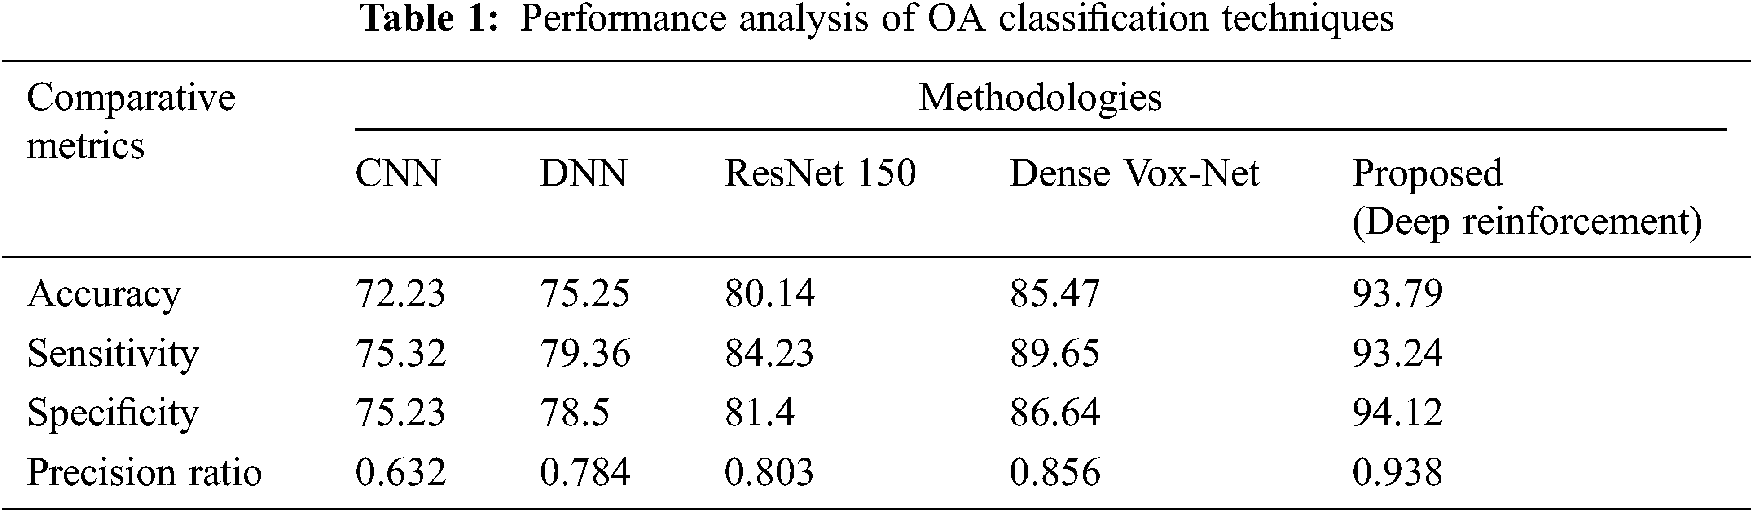
Fig. 8 shows a performance analysis of the proposed RL technique in comparison with a number of existing prevalent techniques, including the CNN, DNN, ResNet 150, and Dense VoxNet. The performance progress of accuracy attains 72%, 75%, 80% & 85% in CNN, DNN, ResNet 150, and Dense VoxNet respectively and 94% in proposed RL. Similarly the sensitivity is 75% in CNN, 79% in DNN, 84% in ResNet 150%, 90% in Dense VoxNet and 93% in proposed RL. Similarly, the specificity is 75% in CNN, 78% in DNN, 81% in ResNet 150%, 86% in Dense VoxNet, and 94% in proposed RL. The precision ration of CNN, DNN, ResNet 150 and Dense VoxNet are 0.62, 0.78, 0.83 & 0.85 respectively and 0.94 proposed RL It is clear that the proposed RL-based method delivered better results than prevalent methods.

Figure 8: Graphical analysis of the proposed RL classification with existing techniques (a) Accuracy (b) sensitivity (c) specificity (d) precision ratio
Training data with vector scalar: All reproductions were executed using Keras in the TensorFlow framework. The twofold fractious entropy has been received like the misfortune work to undertake of ordering the event of knee OA because of the unwarranted dataset, division heaviness contrive to fasten this concern. Using the class weight, the alternative lessons turned out to be more significant.
Figs. 9 and 10 illustrate the primary and subsequent mechanisms into dissimilar stages, respectively counting the training data with the vector–scalar and vector models using the min./max with the scalar as a pretrial with the grouping of the neural network and the vector model.
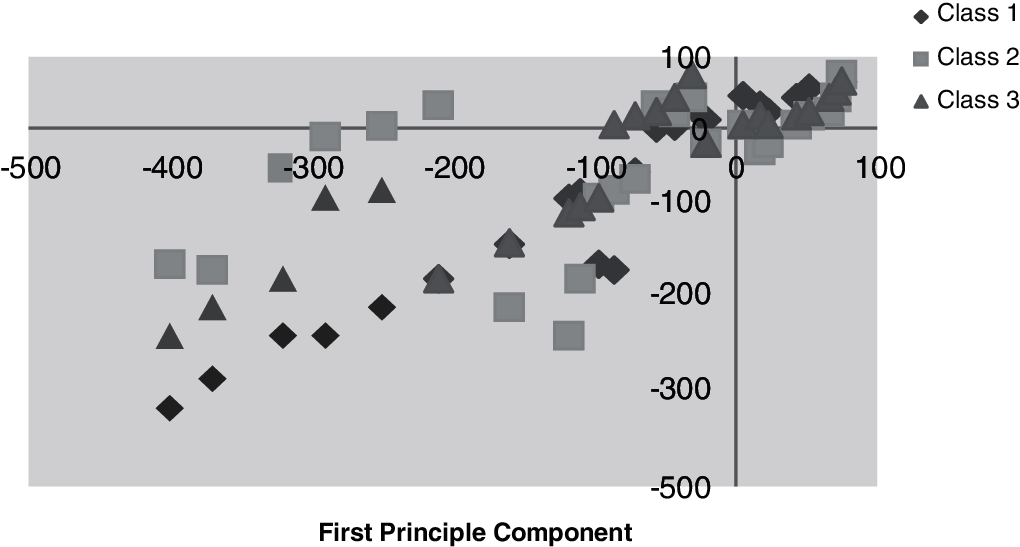
Figure 9: Training data with vector scalar
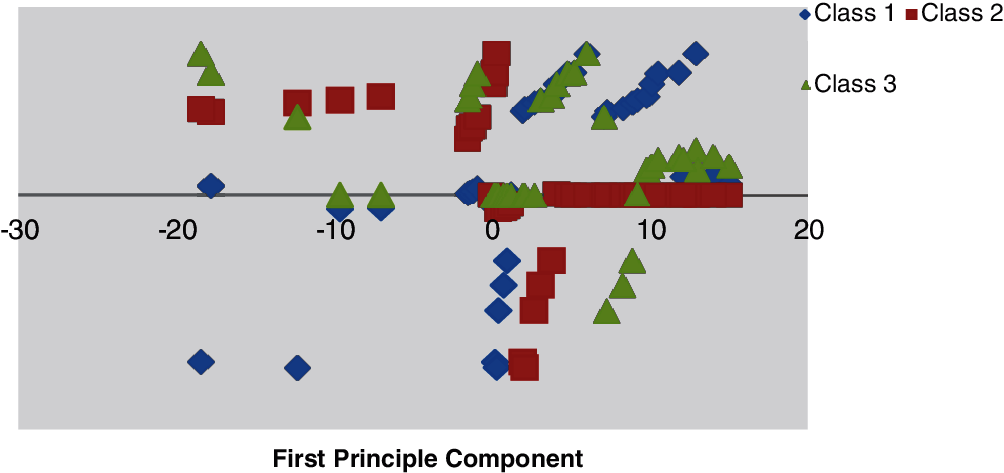
Figure 10: Minimum–maximum scaling data with vector scalar
A dataset consisting of 20,000 OA records was used. Among 4867 and 2451 samples have been divided into data and training sets respectively. Out of the training set, 30% of preparation models were considered as a confirmation illustration. Amid a variety of investigational situations, the greatest DNNs structural design was unseen with neurons. 500 and 100 were considered as batch and epoch size training correspondingly. Tab. 1 supplies the uncertainty matrix consequences through the DNN algorithms besides Vector pre-processing. We considered each successful model factor, and calculated 0.42 as the appropriate likelihood threshold of OA. The accuracies of classification were 75.97%, 68.27%, 75.65%, and 41.52% for sensitivity, specificity, and positive prognostic value. The vector scaling method was found to be superior to the other methods considered, with an accuracy of 79.28%. Fig. 11 shows the ROC curve as an indicator of the performance of the DNN with the vector scalar. Tab. 2 lists the indecision template of the proposed technique.
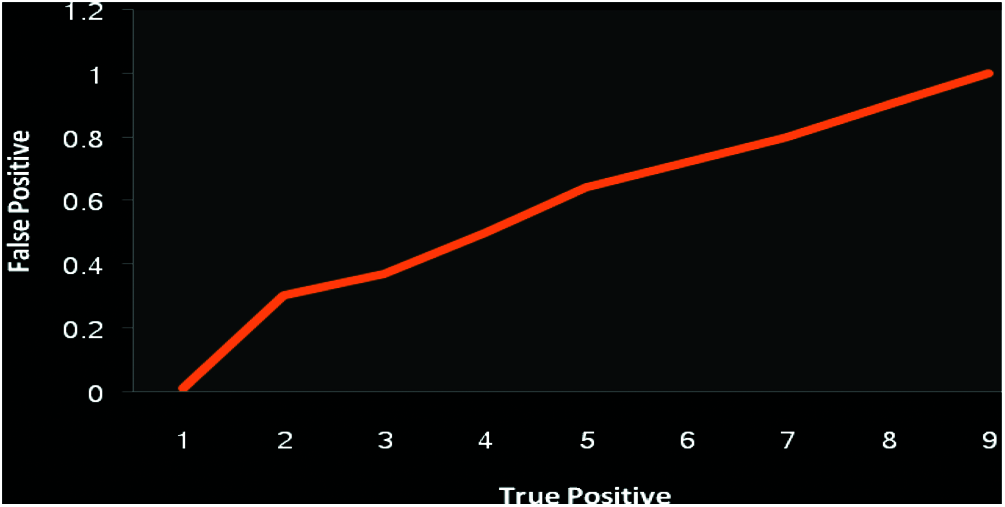
Figure 11: Performance analysis of DNN receiver characteristic with vector model (Exactness 79.28)
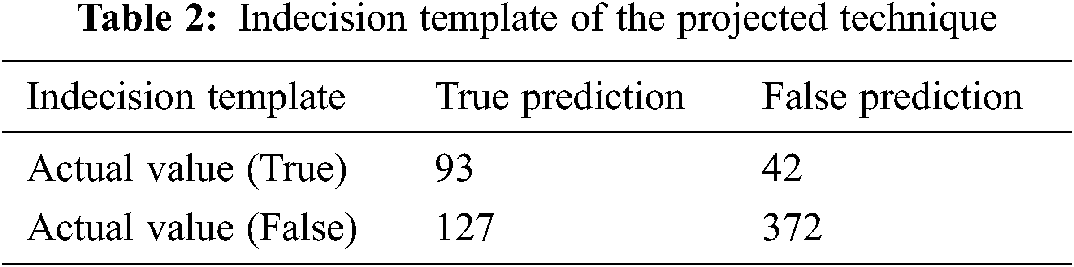
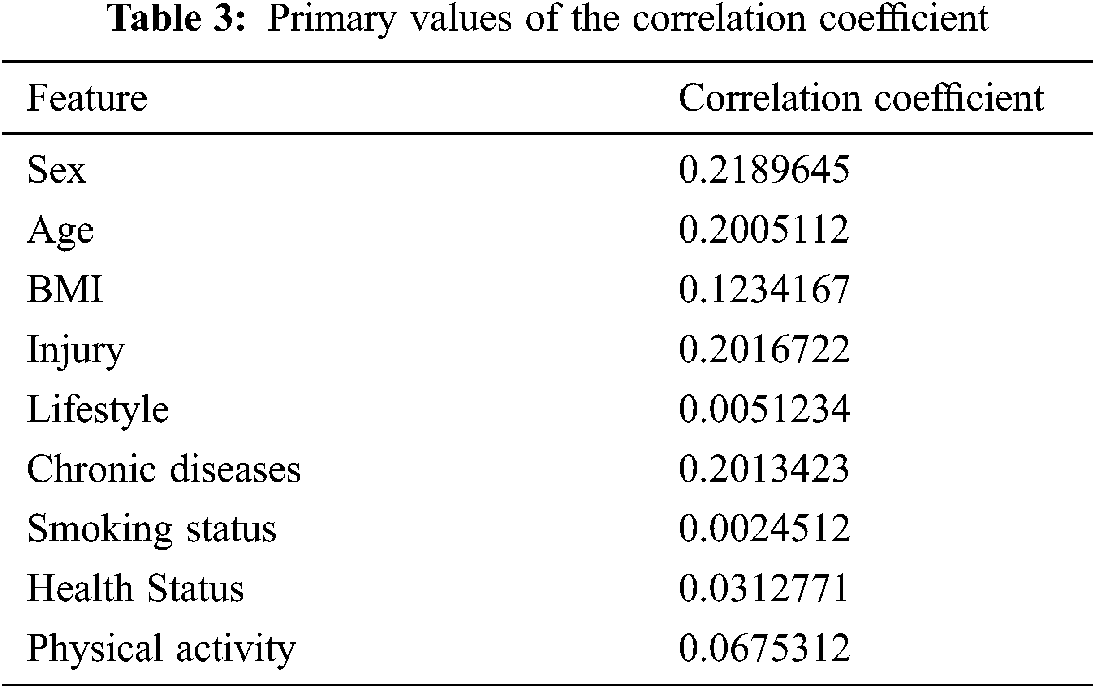
The combination of the vector-trained model data and the DNN were used to predict the occurrence of KOA. It is further evaluated the parallel connection among all characteristics of numerical skin texture and KOA. On the other hand, thorough links among components and KOA have not been demonstrated. Tab. 3 shows the correlation coefficients with the initial features and its best correlation values. The proposed RL-based was tested in terms of its accuracy, sensitivity, specificity, and precision ratio. The indecision template, true prediction, and false prediction were the key parameters representing the outcome of the experiments.
Knee OA has been predicted by using a limited amount of data, including behavioral and clinical data. Even though vector models were used here to divide the data more accurately, extra inputs were needed to reduce the large inaccuracy of prediction. The limitations in conventional models included unreliability, because they did not consider hostile environment, and few QoS parameters. Both these problems were solved by the proposed model.
Discussion: When a patient visits a medical specialist, the latter needs to choose measures to control the relevant disease or issue. When the patient returns, the treatment recently controlled influences their status the choice of future treatment. This course of action can be successfully modeled by using RL. It offers an attractive selection, in contrast to similar frameworks, given the timely outcome of treatment as well as the advantage to the patient. Despite the capability of RL in medication, there has been a range of prevention mechanisms to be relevant RL estimation in the treatment center. Furthermore, RL computation generally learns by experimentation and examination of treatment systems that are clearly not possible from the oral words. Hence, RL calculations on a clinical background would be useful to treat the patients further cost-effectively.
This study proposed a model to predict OA in people by using reinforced deep learning. We discussed the technique to prepare the DRL in this context as well. The strength arrives from the use of comfortable prediction fault for the duration of the learning process. In addition, the configuration of DRL was understood in the way of getting effective prediction of the stage of osteoarthritis. A DNN model combined with a vector model was proposed to predict KOA. The aim was to identify patients at high risk of knee OA. AI can be used in this way to save the patient the time and energy required for unnecessary visits to hospital. Owing to the usage of simple input datasets with a low resolution of the images, the proposed DNN has been made to be trained the features and vector model to Produce improved constant characteristics. Therefore, the proposed method is suitable for predicting and detecting knee OA in its early stage by using a limited amount of data. We would intend to examine the scalability of KOA features in the future work by using the DNN with high accuracy.
Funding Statement: This research work was supported by King Khalid University, Abha, Kingdom of Saudi Arabia through a General Research Project under Grant Number GRP 119/42.
Conflicts of Interest: The authors declare that they have no conflicts of interest to report regarding the publication of this study.
1. V. A. Kumar and A. K. Jayanthy, “Classification of mri images in 2d coronal view and measurement of articular cartilage thickness for early detection of knee osteoarthritis,” in IEEE Int. Conf. on Recent Trends in Electronics, Information & Communication Technology (RTEICTBangalore, India, pp. 1907–1911, 2016. [Google Scholar]
2. C. Von Tycowicz, “Towards shape-based knee osteoarthritis classification using graph convolutional networks,” in IEEE 17th Int. Symposium on Biomedical Imaging (ISBIIowa City, IA, USA, pp. 750–753, 2020. [Google Scholar]
3. K. Antony, J. McGuinness, N. E. O’Connor and K. Moran, “Quantifying radiographic knee osteoarthritis severity using deep convolutional neural networks,” in 23rd Int. Conf. on Pattern Recognition (ICPRCancun, Mexico, pp. 1195–1200, 2016. [Google Scholar]
4. Q. Liu, Q. Wang, L. Zhang, Y. Gao and D. Shen, “Multi-atlas context forests for knee mr image segmentation,” Int. Workshop on Machine Learning in Medical Imaging, Munich,Germany, pp. 186–193, 2015. [Google Scholar]
5. L. Anifah, T. L. R. Mengko, M. H. Purnomo and I. K. E. Purnama, “Osteoarthritis classification using self organizing map based gray level run length matrices,” in Int. Conf. on Instrumentation, Communications, Information Technology, and Biomedical Engineering (ICICI-BMEBandung, Indonesia, pp. 26–30, 2017. [Google Scholar]
6. S. Sumitra Nair, M. Robert French, D. Laroche and E. Thomas, “The application of machine learning algorithms to the analysis of electromyography patterns from arthritic patients,” IEEE Transactions on Neural Systems and Rehabilitation Engineering, vol. 18, no. 2, pp. 174–84, 2010. [Google Scholar]
7. M. Bany Muhammad, A. Moinuddin, M. Ta Michael Lee, Y. Zhang, V. Abedi et al., “Deep ensemble network for quantification and severity assessment of knee osteoarthritis,” in IEEE Int. Conf. on Machine Learning and Applications, Boca Raton, FL, USA, pp. 951–957, 2019. [Google Scholar]
8. M. Anam, V. A. Ponnusamy, M. Hussain, M. W. Nadeem, M. Javed et al., “Osteoporosis prediction for trabecular bone using machine learning: A review,” Computers, Materials & Continua, vol. 67, no. 1, pp. 89–105, 2021. [Google Scholar]
9. A. V. Bernstein and E. V. Burnaev, “Reinforcement learning in computer vision,” in Int. Conf. on Machine Vision (ICMV 2018Long Beach, CA, vol. 10696, pp. 1–7, 2018. [Google Scholar]
10. A. J. Aljaaf, A. J. Hussain, P. Fergus, A. Przybyla and G. J. Barton, “Evaluation of machine learning methods to predict knee loading from the movement of body segments,” in IEEE Int. Joint Conf. on Neural Networks (IJCNNVancouver, BC, Canada, pp. 5168–5173, 2016. [Google Scholar]
11. M. Hugle, P. Omoumi, J. M. Van Laar, J. Boedecker and T. Hugle, “Applied machine learning and artificial intelligence in rheumatology,” Rheumatology Advances in Practice, vol. 4, no. 1, pp. 1–26, 2020. [Google Scholar]
12. E. Christodoulou, S. Moustakidis, N. Papandrianos, D. Tsaopoulos and E. Papageorgiou, “Exploring deep learning capabilities in knee osteoarthritis case study for classification eirini christodoulou” in IEEE Int. Conf. on Information, Intelligence, Systems and Applications (IISAPatras, Greece, pp. 1–6, 2019. [Google Scholar]
13. C. Kokkotisab, S. Moustakidiscd, E. Papageorgiouac, G. Giakasb and D. E. Tsaopoulosa, “Machine learning in knee osteoarthritis: A review,” Osteoarthritis and Cartilage Open, vol. 2, no. 3, pp. 1–14, 2020. [Google Scholar]
14. A. Tiulpin, J. Thevenot, E. Rahtu, P. Lehenkari and S. Saarakkala, “Automatic knee osteoarthritis diagnosis from plain radiographs: A deep learning-based approach,” Scientific Reports, vol. 8, no. 1, pp. 1–10, 2018. [Google Scholar]
15. A. Deodhar, M. Rozycki, C. Garges, O. Shukla, T. Arndt et al., “Use of machine learning techniques in the development and refinement of a predictive model for early diagnosis of ankylosing spondylitis,” Clinical Rheumatology, vol. 39, pp. 975–982, 2020. [Google Scholar]
16. F. Liu, Z. Zhou, A. Samsonov, D. Blankenbaker, W. Larison et al., “Deep learning approach for evaluating knee mr images: Achieving high diagnostic performance for cartilage lesion detection,” Radiology, vol. 289, no. 1, pp. 160–169, 2018. [Google Scholar]
17. A. Qayyum, J. Qadir, M. Bilal and A. Al-Fuqaha, “Secure and robust machine learning for healthcare: A survey,” IEEE Reviews in Biomedical Engineering, vol. 14, pp. 156–180, 2021. [Google Scholar]
18. Y. Yu, M. Li, L. Liu, Y. Li and J. Wang, “Clinical big data and deep learning: Applications, challenges, and future outlooks,” Big Data Mining and Analytics, vol. 2, no. 4, pp. 288–305, 2019. [Google Scholar]
19. H. Dehghani, Y. Feng, D. Lighter, L. Zhang, and Y. Wang, “Deep neural networks improve diagnostic accuracy of rheumatoid arthritis using diffuse optical tomography,” in Clinical and Preclinical Optical Diagnostics II, Vol. EB101 of SPIE Proceedings (Optical Society of America, 2019Munich, Germany, pp. 1–7, 2019. [Google Scholar]
20. J. Latif, C. Xiao, A. Imran and S. Tu, “Medical imaging using machine learning and deep learning algorithms: A review,” in Int. Conf. on Computing, Mathematics and Engineering Technologies, Sukkur, Pakistan, pp. 1–5, 2019. [Google Scholar]
21. B. Zhu, S. Liu and S. Chen, “Clinical study of knee osteoarthritis and osteoporosis based on case history analysis,” Journal of Medical Imaging and Health Informatics, vol. 11, no. 4, pp. 1158–1164, 2021. [Google Scholar]
22. C. Kokkotis, S. Moustakidis, E. Papageorgiou, G. Giakas and D. Tsaopoulos, “A machine learning workflow for diagnosis of knee osteoarthritis with a focus on post-hoc explain ability,” in Int. Conf. on Information, Intelligence, Systems and Applications, Piraeus, Greece, pp. 1–7, 2020. [Google Scholar]
23. G. van Tulder and M. de Bruijne, “Learning cross-modality representations from multi-modal images,” IEEE Transactions on Medical Imaging, vol. 38, no. 2, pp. 99–101, 2019. [Google Scholar]
24. C. Ntakolia, C. Kokkotis, S. Moustakidis and D. Tsaopoulos, “A machine learning pipeline for predicting joint space narrowing in knee osteoarthritis patients,” in IEEE Int. Conf. on Bioinformatics and Bioengineering, Cincinnati, USA, pp. 934–941, 2020. [Google Scholar]
25. Y. Yue, X. Wang, M. Zhao, H. Tian, Z. Cao et al., “Preoperative prediction of prosthetic size in total knee arthroplasty based on multimodal data and deep learning,” in IEEE Int. Conf. on Computer and Communications, Chengdu, China, pp. 2077–2081, 2019. [Google Scholar]
 | This work is licensed under a Creative Commons Attribution 4.0 International License, which permits unrestricted use, distribution, and reproduction in any medium, provided the original work is properly cited. |