DOI:10.32604/csse.2022.021964
| Computer Systems Science & Engineering DOI:10.32604/csse.2022.021964 | |
| Article |
Autonomous Unbiased Study Group Formation Algorithm for Rapid Knowledge Propagation
1Department of Computer Science, Babcock University, Ogun, Nigeria
2Department of Computer Science, Admiralty University, Delta, Nigeria
3Department of Computer Science, National Open University, Nigeria
4Department of Computer Science and Informatics, Alex-Ekwueme Federal University, Ebonyi, Nigeria
5Department of Cyber Security, Admiralty University, Delta, Nigeria
6Department of Computer Science, Caleb University, Imota, Lagos, Nigeria
7Department of Computer Science and Information Technology, Petroleum Training Institute, Delta, Nigeria
8Department of Computer Science, Tai Solarin University of Education, Ogun, Nigeria
*Corresponding Author: Monday Eze. Email: ezem@babcock.edu.ng
Received: 22 July 2021; Accepted: 23 August 2021
Abstract: Knowledge propagation is a necessity, both in academics and in the industry. The focus of this work is on how to achieve rapid knowledge propagation using collaborative study groups. The practice of knowledge sharing in study groups finds relevance in conferences, workshops, and class rooms. Unfortunately, there appears to be only few researches on empirical best practices and techniques on study groups formation, especially for achieving rapid knowledge propagation. This work bridges this gap by presenting a workflow driven computational algorithm for autonomous and unbiased formation of study groups. The system workflow consists of a chronology of stages, each made of distinct steps. Two of the most important steps, subsumed within the algorithmic stage, are the algorithms that resolve the decisional problem of number of study groups to be formed, as well as the most effective permutation of the study group participants to form collaborative pairs. This work contributes a number of new algorithmic concepts, such as autonomous and unbiased matching, exhaustive multiplication technique, twisted round-robin transversal, equilibrium summation, among others. The concept of autonomous and unbiased matching is centered on the constitution of study groups and pairs purely based on the participants’ performances in an examination, rather than through any external process. As part of practical demonstration of this work, study group formation as well as unbiased pairing were fully demonstrated for a collaborative learning size of forty (40) participants, and partially for study groups of 50, 60 and 80 participants. The quantitative proof of this work was done through the technique called equilibrium summation, as well as the calculation of inter-study group Pearson Correlation Coefficients, which resulted in values higher than 0.9 in all cases. Real life experimentation was carried out while teaching Object-Oriented Programming to forty (40) undergraduates between February and May 2021. Empirical result showed that the performance of the learners was improved appreciably. This work will therefore be of immense benefit to the industry, academics and research community involved in collaborative learning.
Keywords: Knowledge propagation; collaborative study group; unbiased matching; twisted round robin; exhaustive multiplication
The three key concepts that make up the title as well as content of this work are rapid knowledge propagation [1], autonomous and unbiased matching [2,3], and study group formation [4,5]. Thus, this research presents innovative algorithms, and carefully evaluated techniques for creating and managing collaborative study groups that enhances fast knowledge propagation. One major deliverable of this work is that it is expected to fast track knowledge propagation in a learning community, majorly because it enforces the mixing of the participants, known as pairing, based on their estimated knowledge gaps in an autonomous and unbiased manner. Collaborative learning [6] in a contact network setting involves sharing knowledge by people who interact in groups. While modern researches and establishments acknowledge the strength of collaborative learning, there are some obvious challenges to resolve. One is the question of how many collaborative study groups should be formed for an arbitrary integer population P of learners. Another issue is how best to pair the participants in the collaborative study groups, in order to make the best impacts in achieving very rapid knowledge propagation. There is also the question of which computational algorithms [7] will be used to achieve the required goal. Moreover, there is also a necessity to ensure that the methodology is evaluated [8] scientifically. These and many other related issues constitute the focus of this research. One of the interesting attributes of this research is that the selection of the collaborative study group participants is based on autonomous and unbiased technique, purely dependent on the person’s performance, rather than trial and errors or external factors. A practical experimental run of this research was in the teaching of an undergraduate course titled Object Oriented Programming [9] with course code INSY 404 in Babcock University between February and May, 2021. This work is organized into five sections. First is an introduction, and then an exploration of related works. This is followed by detailed presentation of the system workflow. The eleven stages and four steps of the workflow, as well as four puzzles or challenges tackled in this research were discussed. This is followed by the proofs and evaluation of work, and then the presentation of findings and conclusion. One of the peculiarities of this work is that it is focused on even number of participants, mainly because of the need for pairing. Future research will tackle cases of odd number of participants.
A research by [10] underlined the need for active research on study group formation, where the learners have varied abilities, such that some academically weak ones can learn from more intelligent colleagues, a concept termed as heterogenous mixing. Another research by [11] uses a technique called automated group decomposition, based on k-means clustering to build study groups. Extensive discussion on how cooperative learning impacted positively on accounting students was presented in [12], however, the work was silent on evolution of techniques for group formation. Furthermore, the managerial expertise for making the best out of study group comes handy in the research [13]. An extensive analytical research on the performance measures, and justification of use of study groups is a research by [14]. It is necessary to state that none of the literatures highlighted above, apart from [11] attempted to build any unique computational strategy for study group formation, Obviously, none of these works have used autonomous and unbiased selection for study group formation and pairing, thus the reason for this current research.
As already stated, the major aim of this work is to present a new computational algorithm for rapid domain knowledge propagation through precision-based study groups formation. This implies that the resulting study groups enforce autonomous and unbiased mixing or permutation of the participants, such that for any two learners Lx and Ly in a collaborative pair (Lx, Ly), there is synergy, such that the perceived knowledge gap of one partner is filled by the colleague. The general workflow [15] of this research is shown in Fig. 1. As shown in the diagram, there are a total of eleven chronological steps, all of which were labeled numerically from inception to conclusion. Step 11 is a looping point [16], where the workflow control could be switched back to Step 3, as long as further iteration is necessary. Before going into detailed explanation of the workflow, it is necessary to mention two important points. One is that a number of the chronological steps involved are procedural [17] in nature. Secondly, there are two stages that constitute the major algorithmic implementations in this research. These are steps 6 and 7, at which point the creation of study groups, as well as the autonomous and unbiased study group pair formations are achieved. All these will be explained further in appropriate sections of this work.
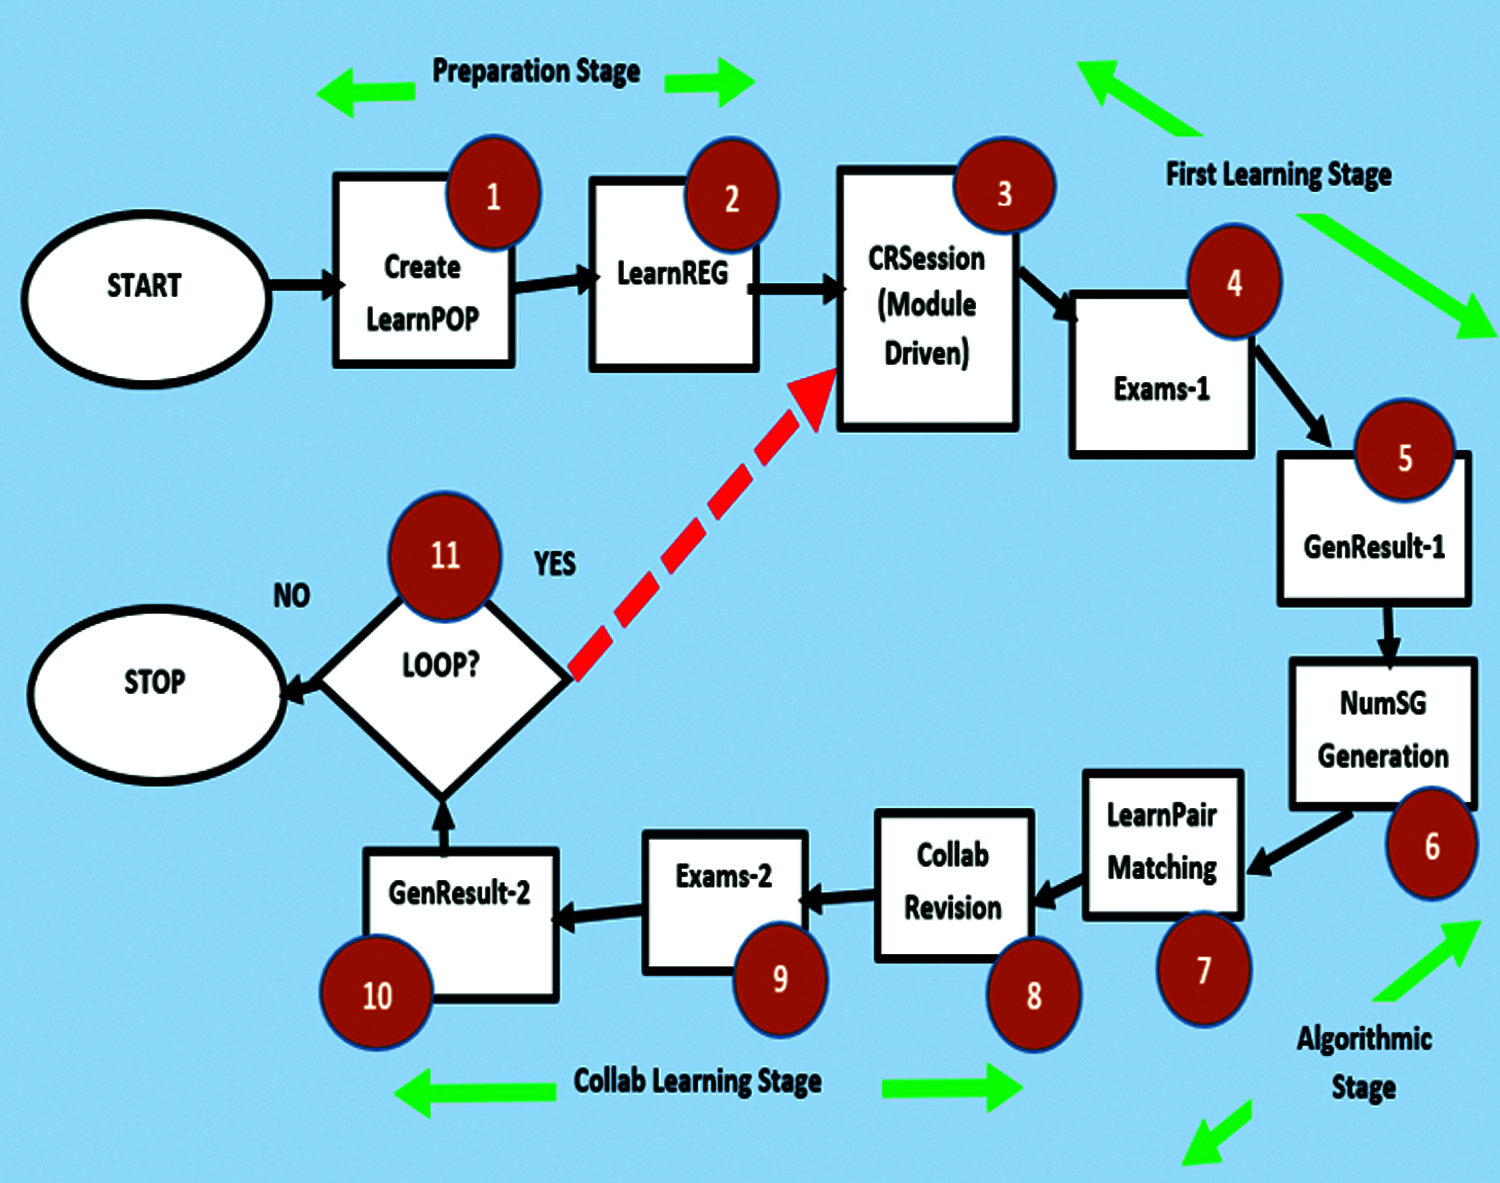
Figure 1: General workflow for the system
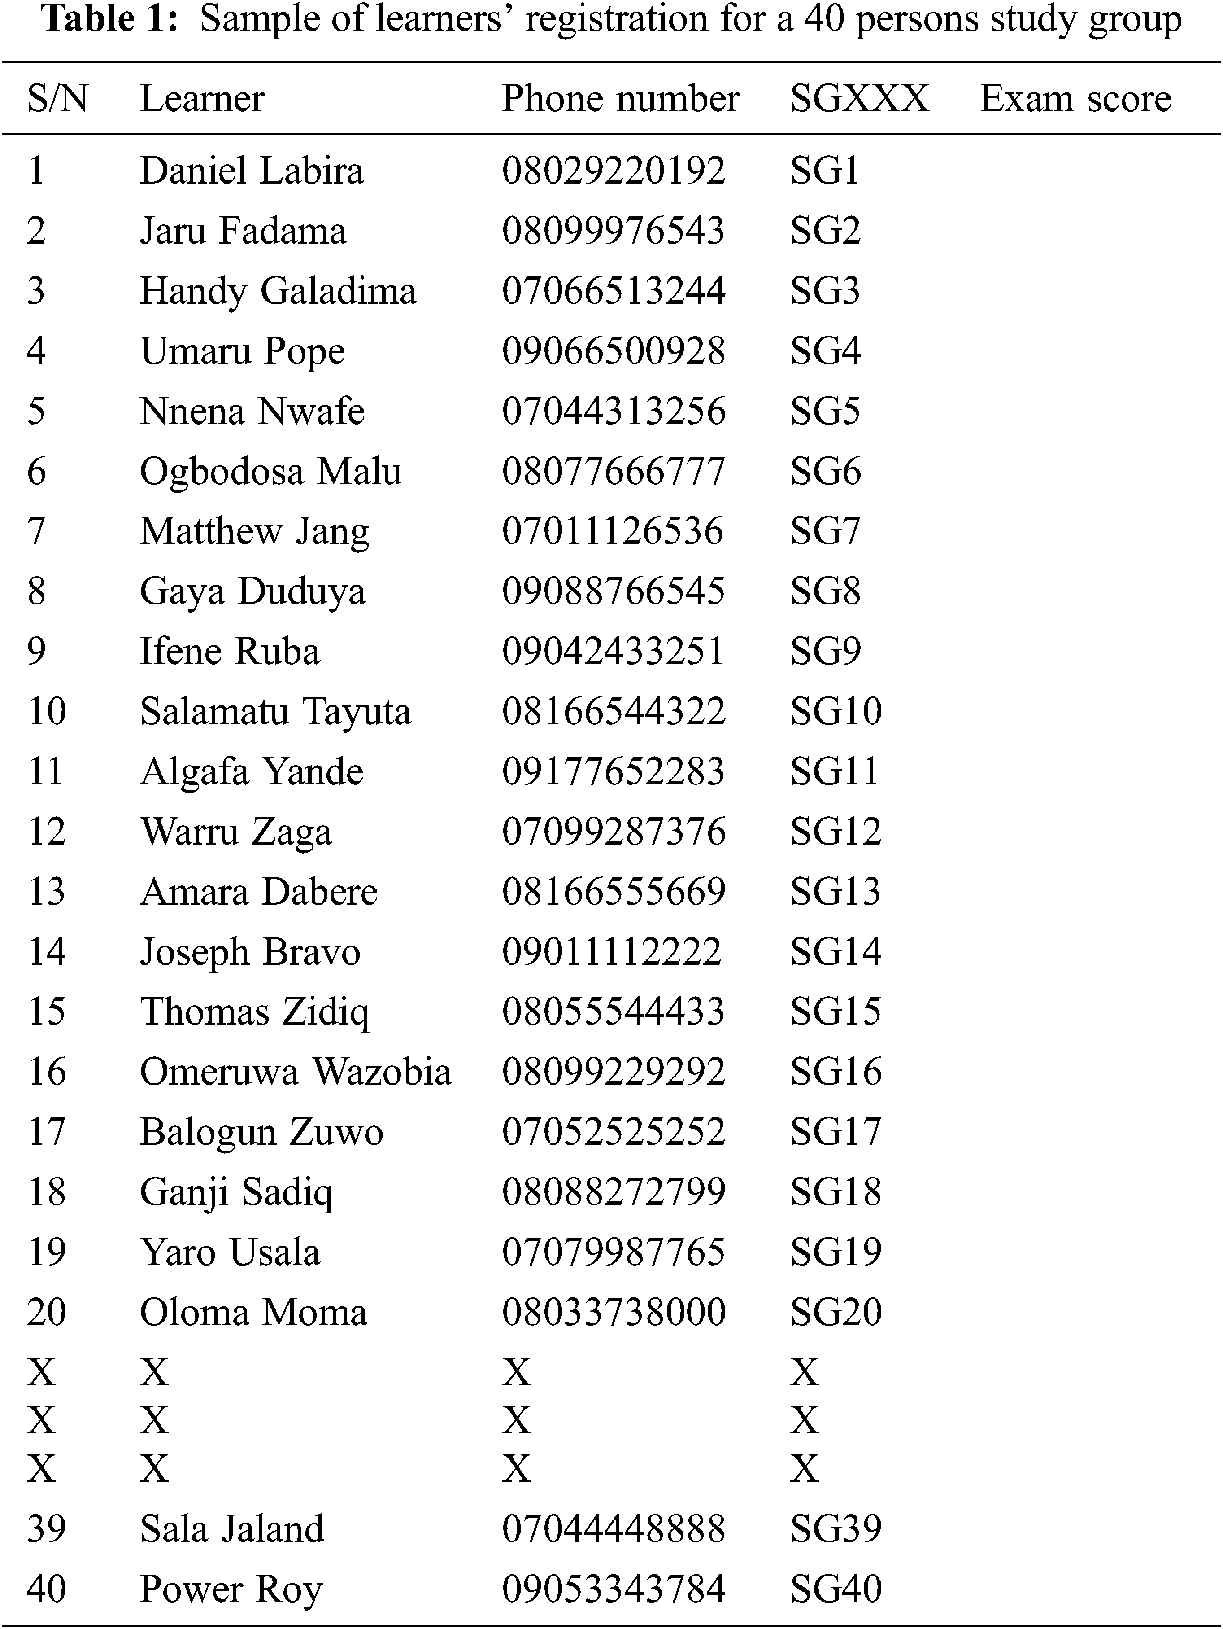
The algorithmic Steps 1 and 2 constitute the preparatory stage, since they involve putting strategic procedures in place before the actual learning is kick-started. The essence of Step 1 which is tagged [18] as Create LearnPOP in the system workflow is to create a learning population. This is a procedural step which involves gathering details of the students that make up the learning population, just like in any normal or conventional classroom. The minimum dataset [19] could be as simple as the full names of the students presented in a spreadsheet, which will be used to track the expected physical attendance of the students to class activities. Obviously, because of the fact that the collaborative learning at the lowest level is in pairs, the learning population should be an even integer [20] and not an odd number. The Step 2 of the workflow is the registration of the learning participants, titled as LearnREG. This involves implementing a simple registration of the study group participants. The standard registration number adopted in the experiment is SGXXX where SG stands for study group, and XXX represents an integer, though other alternative nomenclatures could also be adopted. The next column after SGXXX is the space reserved for storing the examination scores. It is also possible to increase the number of columns, by capturing such information as phone number, matriculation number (in the case of university students), among others, though for the sake of this work, such an extension was not implemented. Tab. 1 shows a sample LearnREG dataset for a 40 learners experimental study group, where the study group members SG21 to SG38 were purposely hidden so as to conserve table space in this report.
The algorithmic Steps 3, 4 and 5 consists of the first learning stage of the system workflow. During Step 3 tagged the CRSession, which stands for class room session, all members of the learning community are taught by an expert [21], for instance, a class teacher, a facilitator, or university lecturer as the case may be. As shown in the workflow diagram, this stage is module driven. This implies that it follows a very organized module-driven course outline [22]. In testing this work, a university approved course outline for Object-Oriented Programming was used. During the normal class room teaching, the lecturer could cover one to two modules before launching into the next step. However, for a more thorough and evaluation-based learning, it is advisable to restrict coverage to only one module before launching into the first examination. The first examination, which is Step 4 tagged Exams-1 follows. The main essence of the examination is to have an empirical measure of the academic capabilities of the participants emanating from the just concluded teaching. Step 5 tagged GenResult-1 involves the generation of the examination scores of the learners, an outcome which marks the conclusion of first learning stage of the workflow.
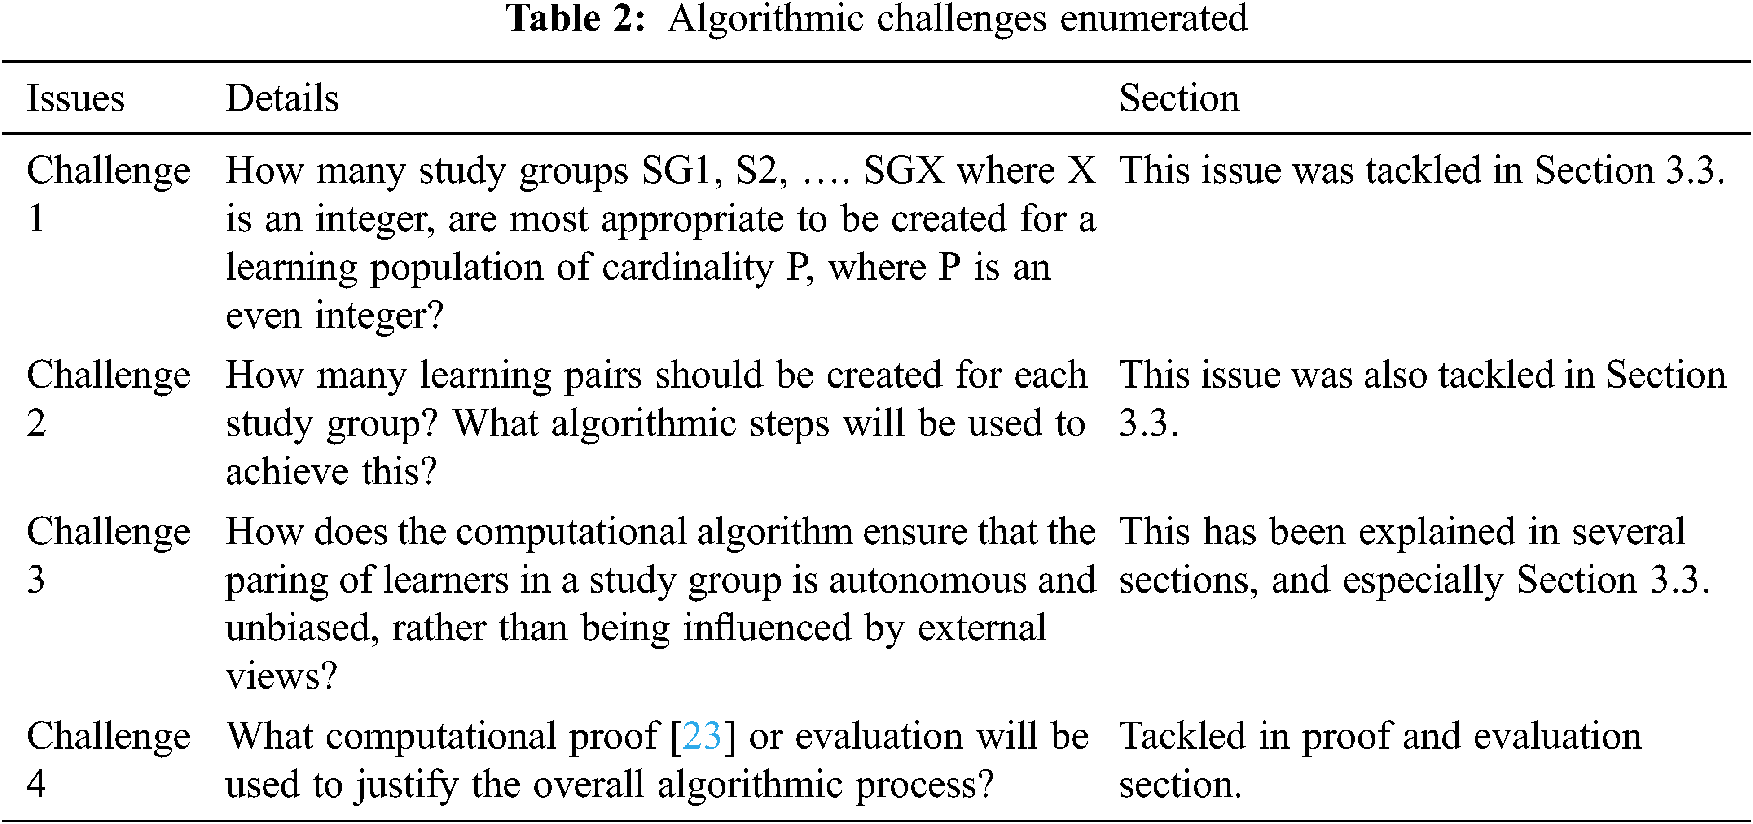
The workflow Steps 6 and 7 tagged NumSG Generation and LearnPair Matching mark the core deliverables of this research. Incidentally, the earlier stages of the workflow lead to an examination result, which is an output from the first learning stage. Importantly, this initial output becomes the input to the core algorithmic stage as will be carefully outlined here. It is necessary to again recount the major problem statement of this research in more specific terms. Given the earlier learning community of size P = 40 participants shown in Tab. 1, there are a number of algorithmic challenges that need to be tackled, some of which are stated in Tab. 2.
To tackle the enumerated challenges as part of workflow Steps 6 and 7, a sample architecture [24] generated for a study group of 40 learners is shown in Fig. 2. The goal is to develop an algorithm for generating the number of study groups, as well as creating the pairs that make up a study group, and proving that the resulting outcome has scientific merit.
The first challenge is to decide on number of study groups to create, and to create same. This is part of the Step 6, tagged NumSG Generation in the general workflow.
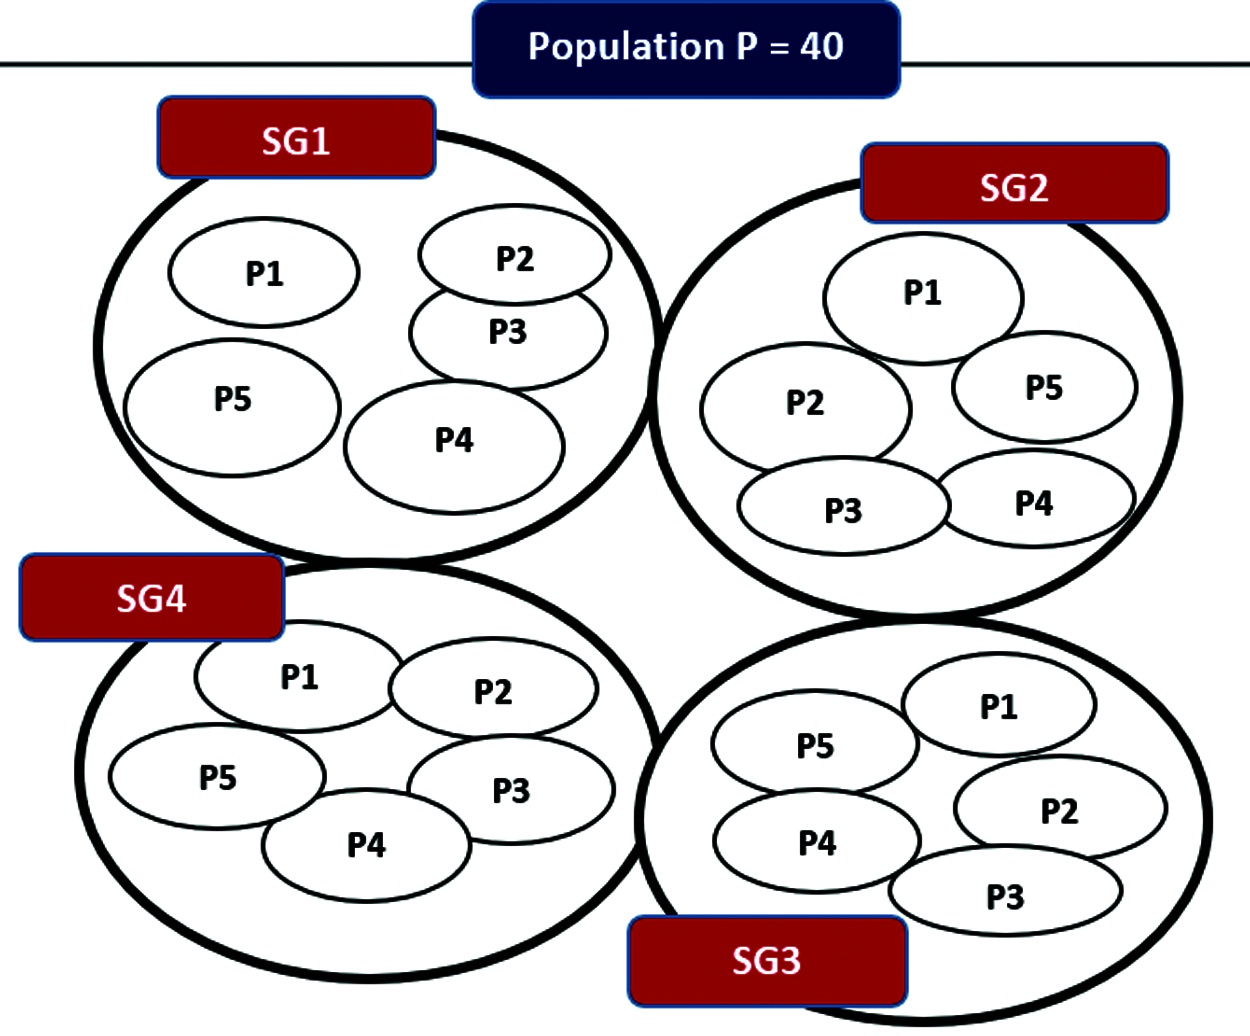
Figure 2: Sample study group architecture
The decision on number of study groups is achieved through a technique termed exhaustive multiplication [25].
3.3.1 Exhaustive Multiplication Implementation
Given the population size P of learners to be organized into a study group, then first and foremost, P must be an even integer, since only an even number is divisible by 2 (pairing) without a remainder. The next step is to create an exhaustive multiplication table of P, consisting of four columns as shown in Fig. 3. For instance, the integer 40 = 2 × 2 × 10 = 2 × 10 × 2 = 2 × 5 × 4 = 2 × 4 × 5 and so on, till all possibilities are covered.
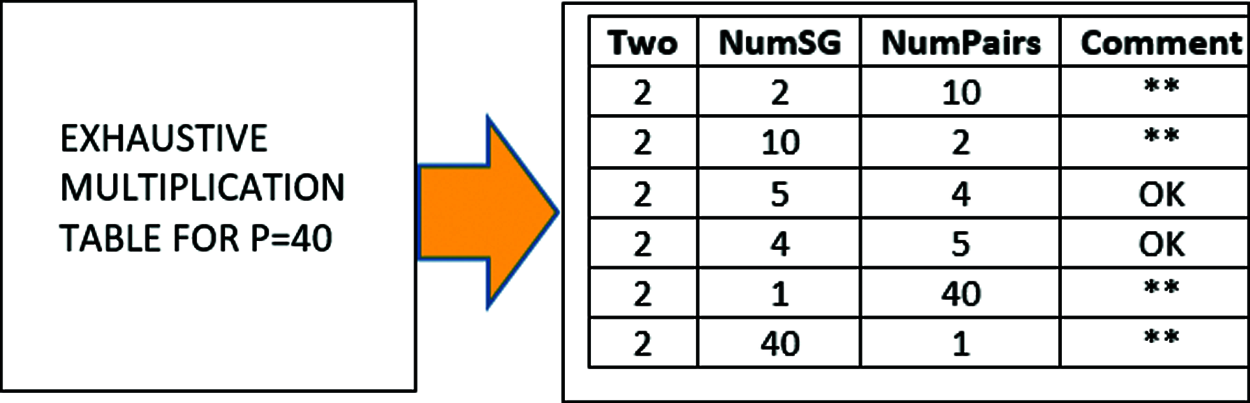
Figure 3: Exhaustive multiplication table for P = 40
In a similar way, the exhaustive multiplication tables for P = 50, P = 60 and P = 80 respectively are shown in Fig. 4.
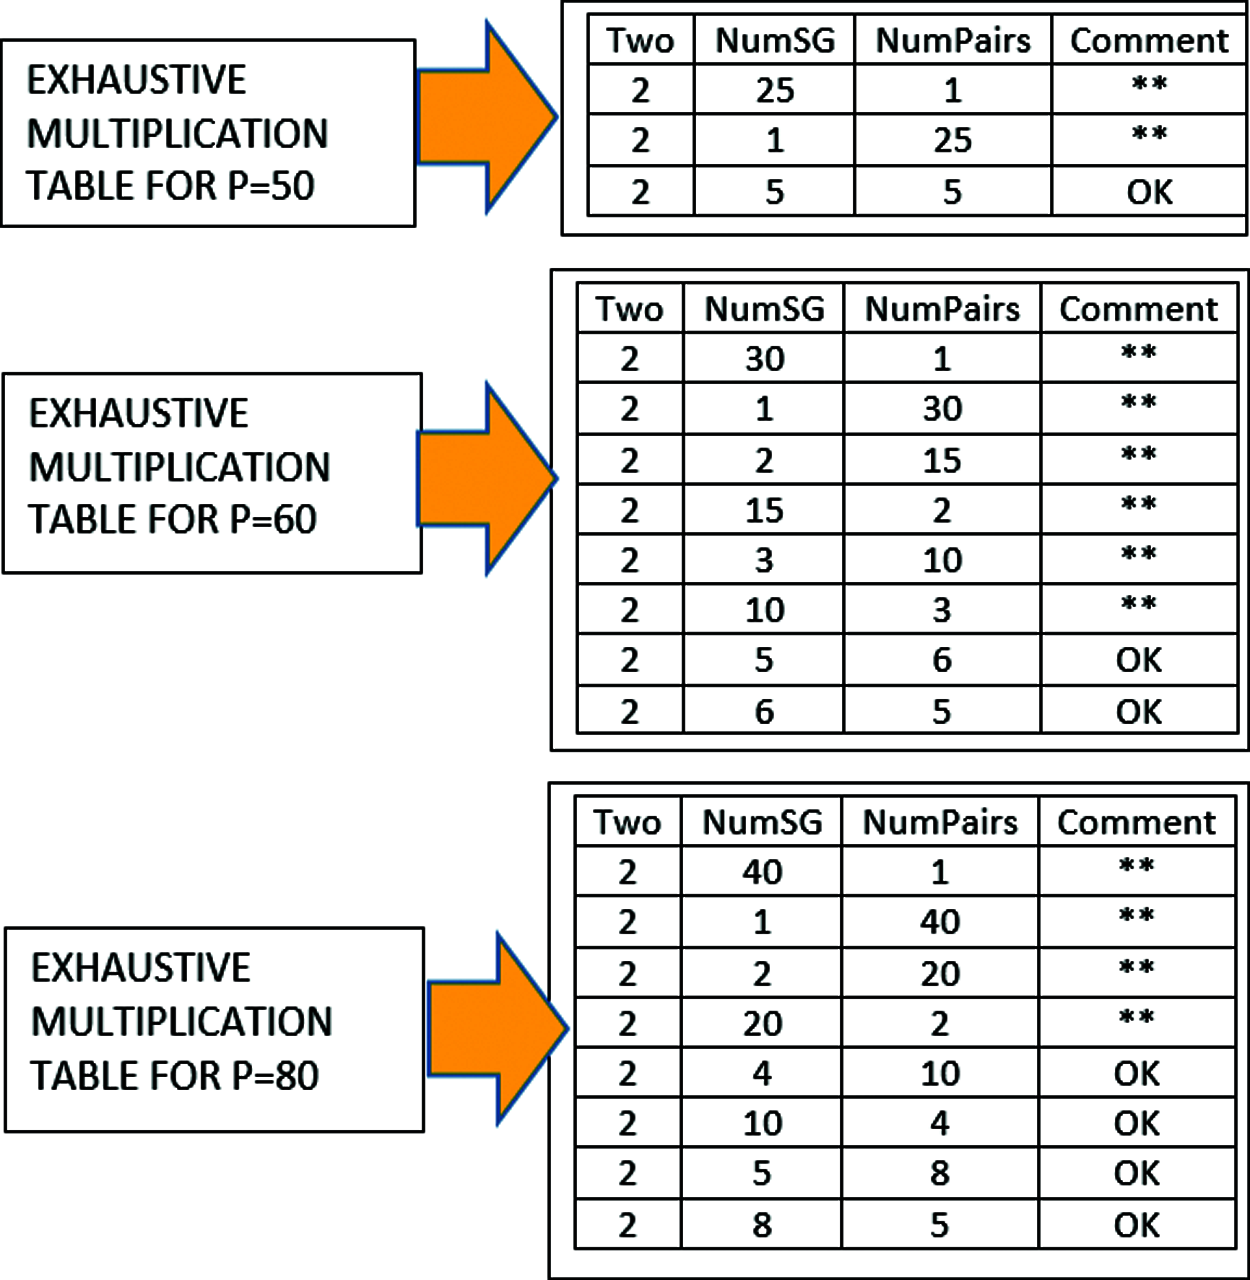
Figure 4: Exhaustive multiplication table for P = 50, 60 and 80
A further and more detailed explanation of the use of exhaustive multiplication table will be based on study group population P = 40. As shown in Fig. 3, the fourth column of the table is the comment field used to indicate rejection or acceptance criteria [26]. The double asterisk (**) shows that particular option is rejected, while ‘OK’ signifies it as one of the acceptable options. An important criteria for rejection is where the value of NumSG is in the extreme, that is being either too low, or too high compared to others, as such options may lead to creating either too many or too little number of study groups. Thus, the rejected cases are for the set of values NumSG = {2, 10, 1, 40}. Thus, the selected values for possible number of study groups to be created are for set of values NumSG = {4, 5}. Suppose the value of 4 is selected in line with study group architecture shown earlier in Fig. 2, then the next task in the NumSG Generation step as shown in the workflow is to create the contents of each of the four study groups.
3.3.2 Study Group Structural Creation
The algorithmic steps for achieving this is as follows. To create S study groups out of P learners, then the number of learners L per study group is given by Eq. (1).
Therefore, for P = 40 and S = 4, the number of learners in each study group is L = 40/4 which is 10. First, create 4 arrays, SG1, SG2, SG3 and SG4 as shown in Fig. 5. The members of the learning community are then arranged in ranking positions [27], from 1 to 40 in ascending order of their performances (scores) in the first exams result earlier generated in workflow Step 5. Where two or more persons have same score, example 50, 50, 50, for three persons, such persons should simply be arranged in consecutive order such as 10th, 11th, 13th, and so on without prejudice.
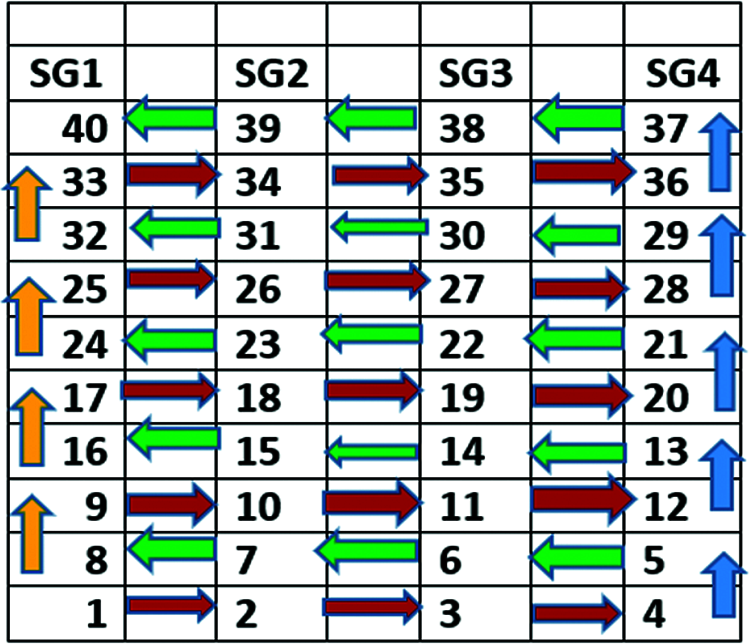
Figure 5: Twisted round robin traversal
The assigned rankings are then used to generate the study groups by filling the four arrays in a twisted round robin pattern shown in Fig. 5. As shown in the figure, the twisted round robin [28] makes use of four major movements tagged as HR4, VU1, HL4 and VU1 coloured as RED, BLUE, GREEN and YELLOW respectively. The movement patterns are defined using the following rules:
At this point, the Challenge 1 in Tab. 2 is already answered, while Challenge 2 is tackled as part of the Step 7, tagged as LearnPair Matching in the general workflow.
3.3.3 Study Group Contents Creation
It is obvious that based on Eq. (1), if there are L = (P/S) number of learners in a study group, then after pairing [29], there will be a total of L/2 which is the same as P/2S number of pairs in each study group. Therefore, for P = 40, S = 4, the number of pairs is 10/2 which is 5. The details of the LearnPair Matching algorithm are as follows. To create pairs for a study group, first pick the array that represents the study group, for example, study group SG1. Next, locate the max-end and min-end of the array. In this research, the max-end of an array is defined as the array content having the highest index, while the min-end is the one with least index [30]. First match the max-end with the min-end. This operation is repeated again and again for the remaining part of the array until the entire array is used up. A practical demonstration of the evolution of SG1 pairs is shown in Fig. 6.
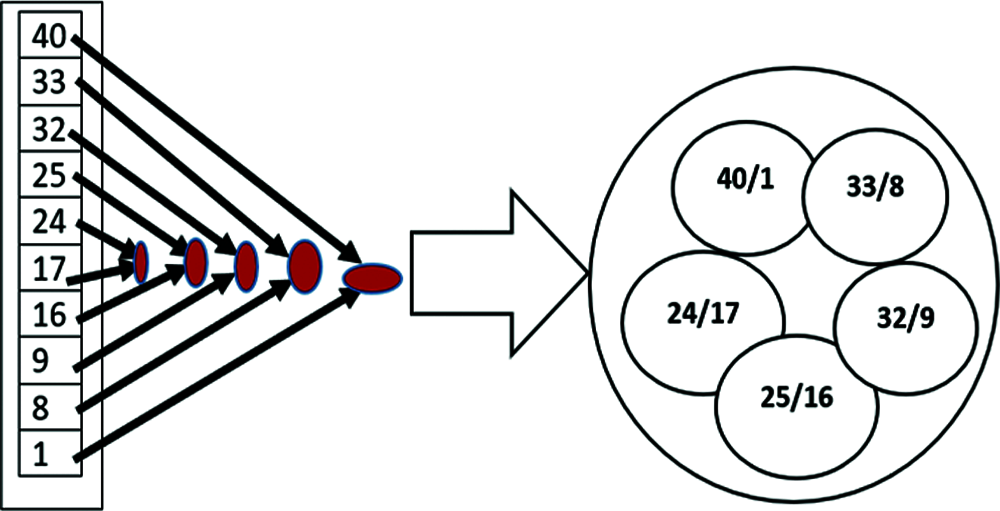
Figure 6: Demonstration of study pairs creation for SG1
In a similar way, the pairs are created for all the study groups SG1, SG2, SG3 and SG4 using the LearnPair Matching algorithm, and the final output is shown in Fig. 7. Thus, the Challenge 2 has been tackled. Again, the answer to Challenge 3 is obviously available. The process of pairing is purely based on the performance of each learner in an examination. It is the score per learner that determine the ranking of the student, and not necessarily based on any other external reason. Thus, the pairing is autonomous and unbiased. Further discussions will be made on how the paring arrangement leads to rapid knowledge propagation, which is the major goal of this work.
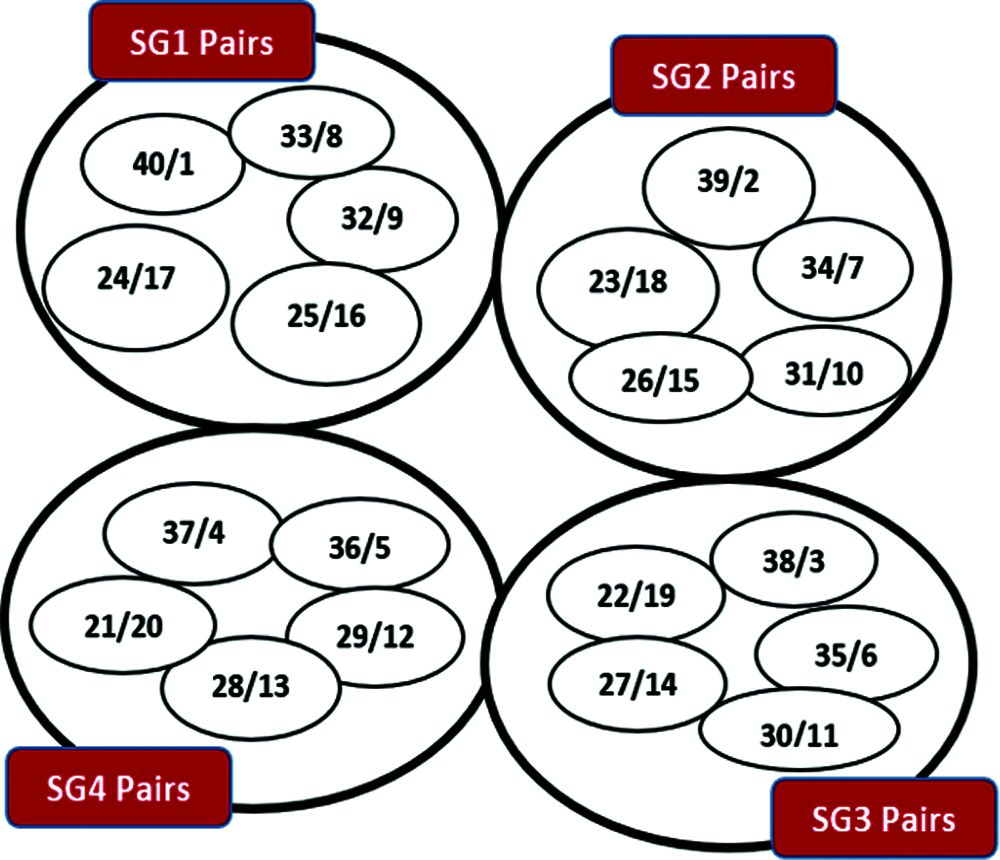
Figure 7: Pairs for all the study groups
After the formation of study groups and learning pairs, then comes the Collab Learning Stage of the system workflow, where “Collab” is short for “Collaborative”. This consist of Steps 8, Step 9 and Step10 respectively. This stage begins with a collaborative revision. This stage brings to reality the very essence of creating study groups, and learning pairs. So, the next question is what is the significance of collaborative learning pairs as projected in this research? The answer is that the autonomous and unbiased selection of the study groups and learning pairs ensures that there is synergy between the learners. Thus, a learner is paired with another learners, based purely on their learning quotients. This is why the learner with rank high 40 is paired with the person of low rank 1, learner with rank 39 paired with another with rank 2, and so on. This is based on the assumption that the learner of high academic quotient 40 will teach the person of low academic quotient of rank 1. Through such collaborative learning, all the learners will gain knowledge in a faster way. In other words, the collaborative learning pairing ensures that a learner is complemented by a partner. This is the concept of rapid knowledge propagation, which is the goal of this research. Thus Step 8 involves collaborative revision, Step 9 involves a second examination while Step 10 involves the generation of the examination result. Note that the collaborative revision is also module-based, so that students will be guided on what to discuss or revise in their collaborative pair learning sessions. It is important to mention that the second examination in Step 9 is a form of evaluator, to be sure there is significant positive impact since after the first examination. The outcomes of the two examinations were used to create performance evaluation graph and bar chart at the conclusion part of this work.
The final stage in the general workflow is the loop stage. This is a point where the moderator, who is the overall lecturer, may decide to either continue with further sessions, or may terminate the workflow.
The evaluation of this work is based on two perspectives. One is through what is termed as equilibrium summation, and another is through the use of statistical correlation [31].
The major goal of this work is to ensure that learners are arranged in such a way that every learner with academic performance rating X is grouped with another learner with academic performance Y, such that there are visible equilibria in the summation for the entire study groups. This ensures that collaborative pairing enhances rapid knowledge propagation. The two important rules on summation in study groups are outlined as follows.
The sum of the positional constituents of every study group give an equal value. This is what is termed the equilibrium sum. For instance, for study group population P = 40, consisting of four distinct study groups, the value is 205 for all study groups. The flowchart for computing this value is shown in Fig. 8.
Thus, the outcome from the implementation of the flowchart is as follows:
It is important to mention that a new flowchart symbol in form of solid cuboid was introduced in this work in order to effectively represent program loop. This is shown in Figs. 8 and 9 respectively.
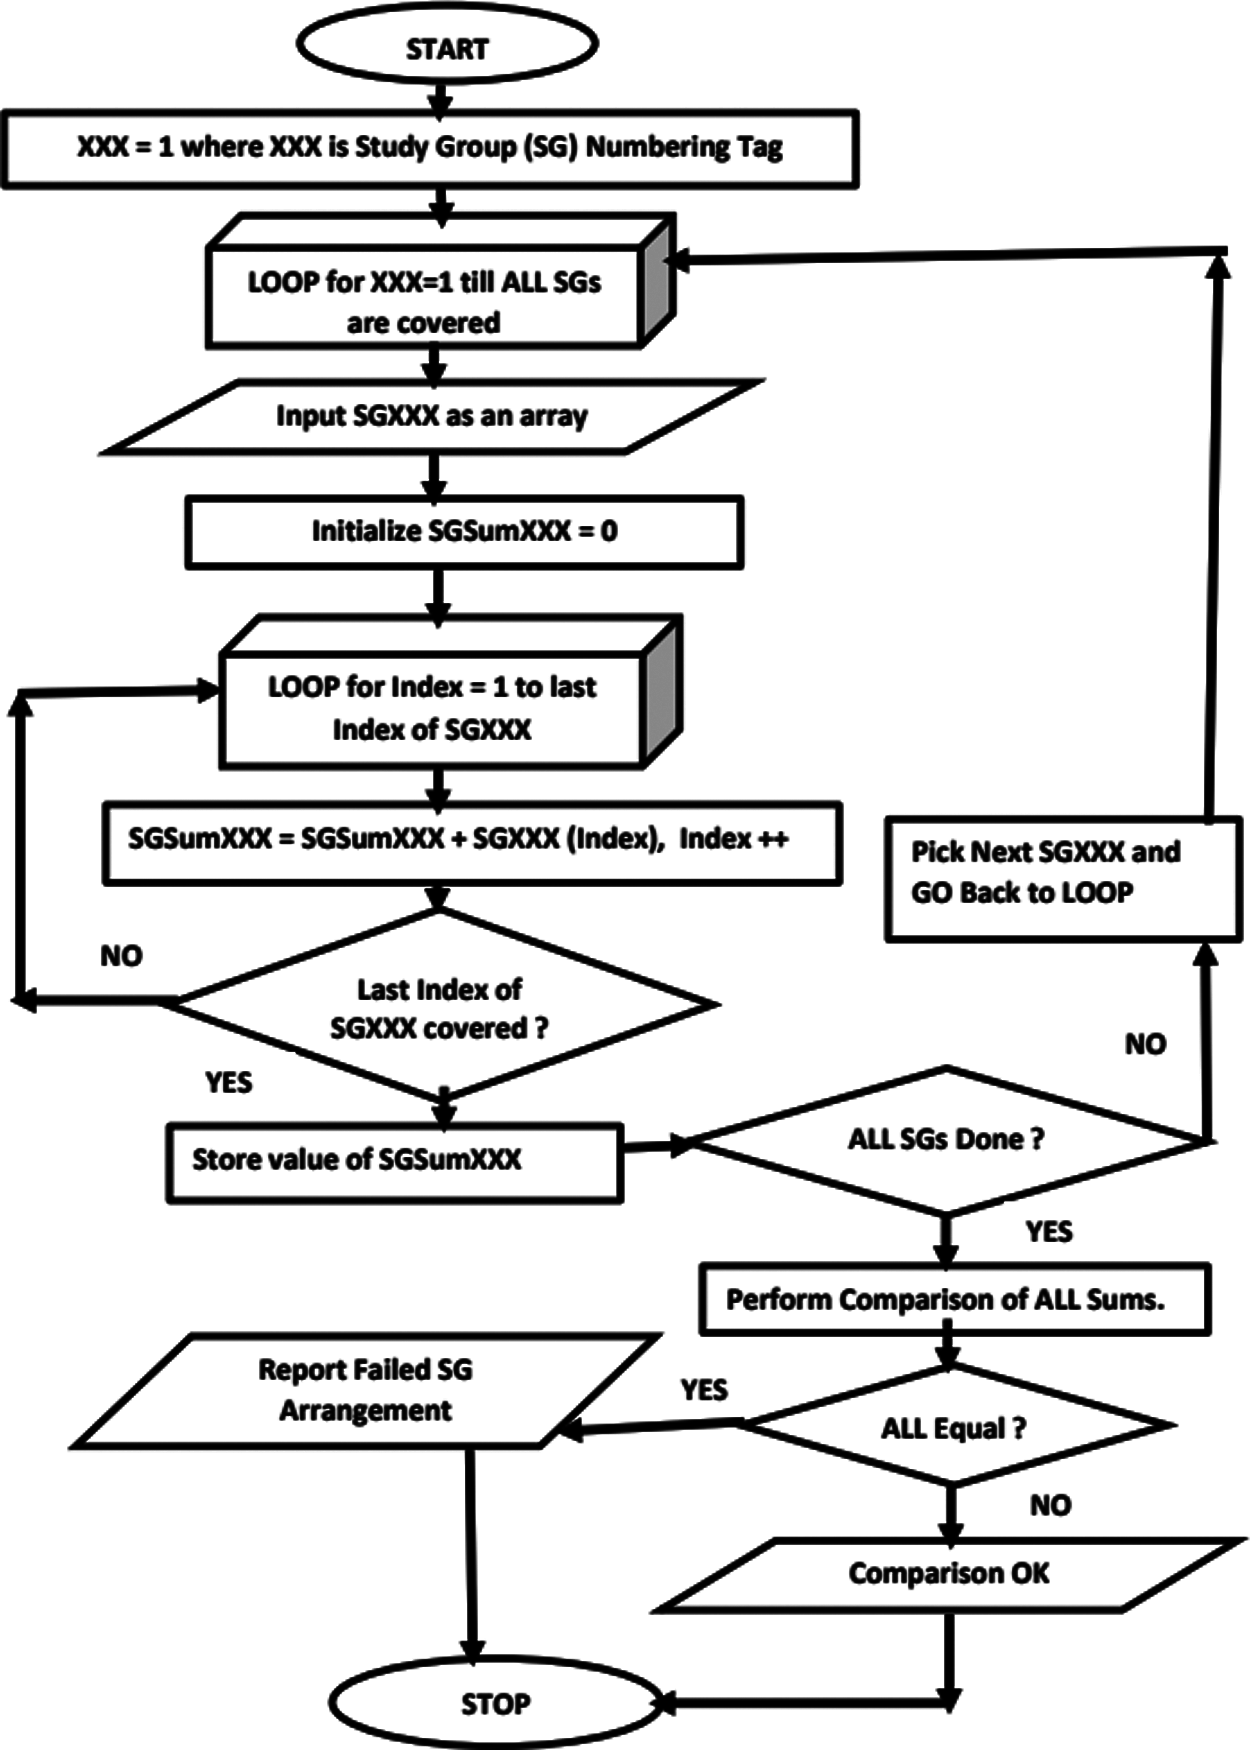
Figure 8: Flowchart for computing equilibrium sum
Apart from equilibrium at the study group level, there is also a unique sum of each of the pairs. The rule states that the sums of the positional contents of each pair in every study group in the entire population should be equal. For instance, for study group population P = 40, consisting of 4 study groups as shown in Figs. 6 and 7, the values of all of the possible pair sums is 41. The flowchart for computing this value is shown in Fig. 9.
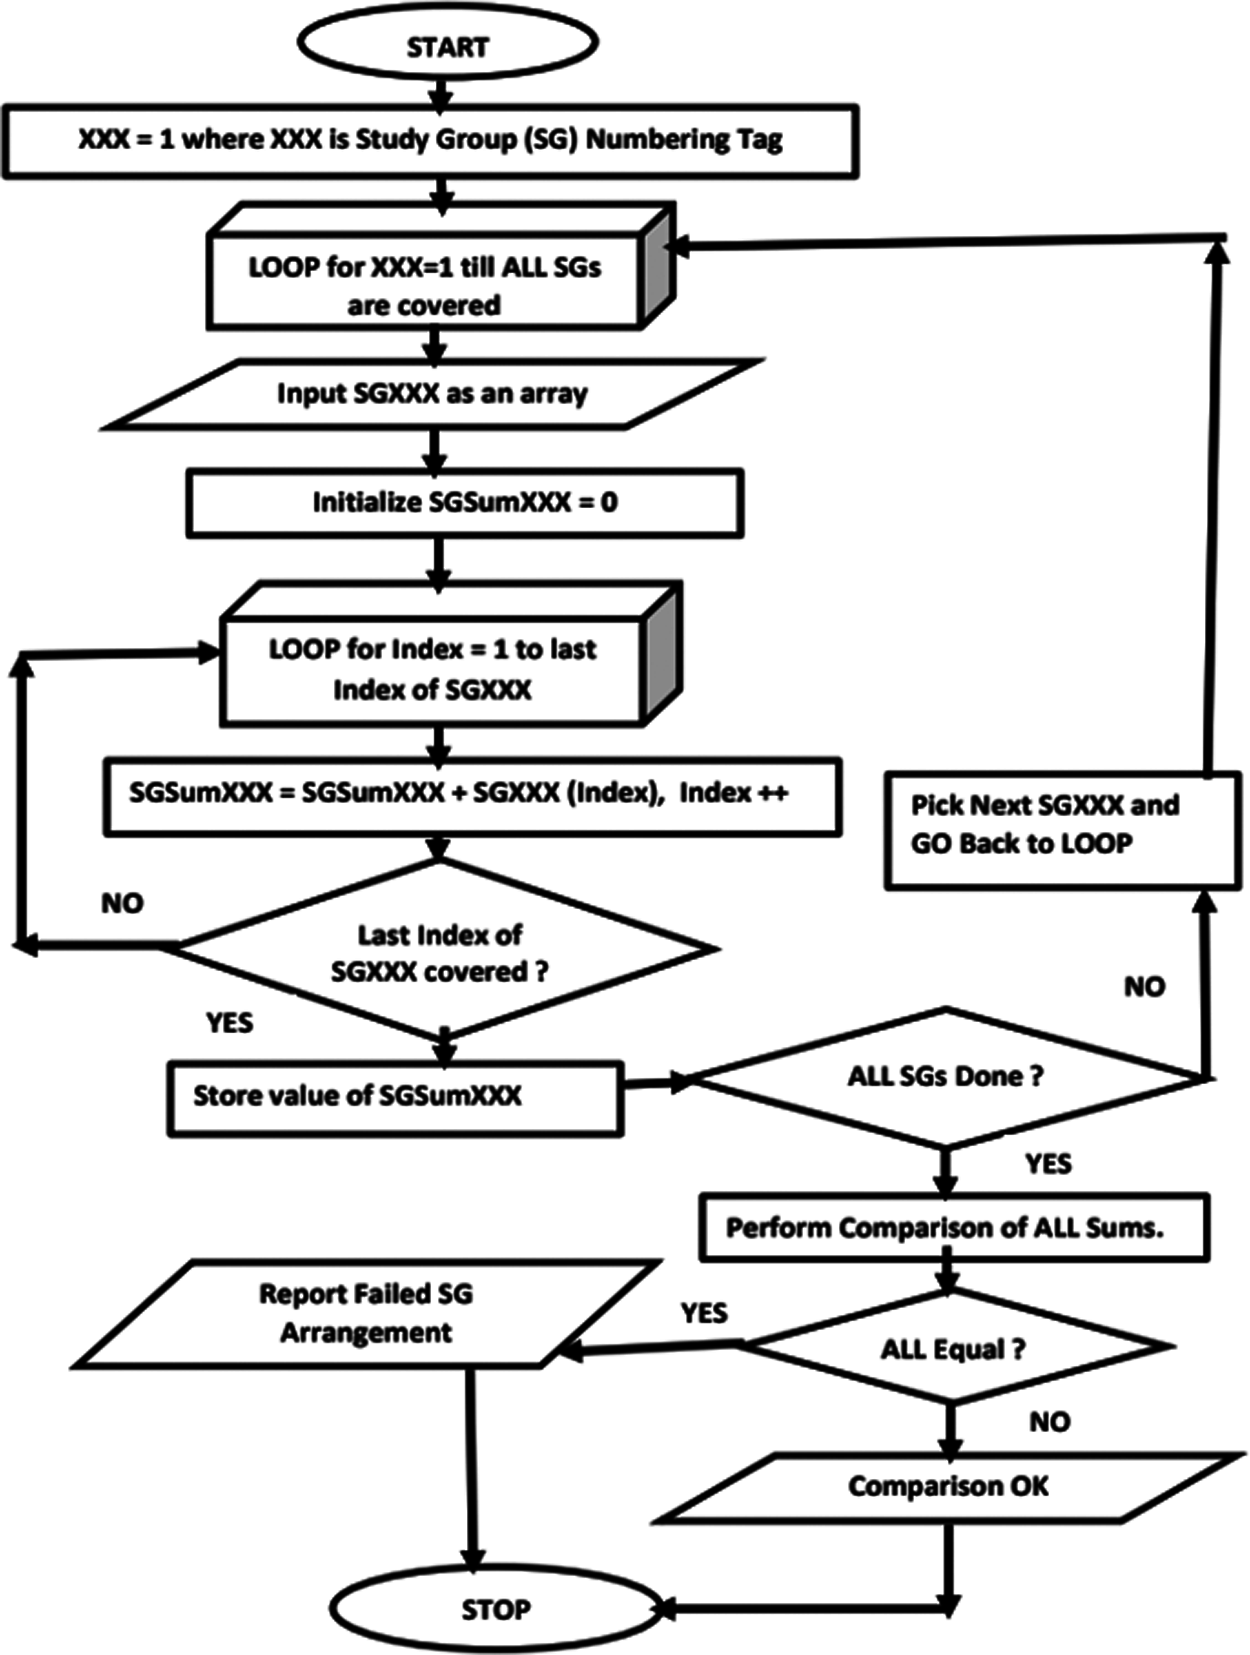
Figure 9: Flowchart for computing unique pair sum
Thus, the outcome from the implementation of the flowchart is as follows:
Correlation is a statistical measure of linear relationship between variables. A presentation technique known as scatter plot [32] can also be programmed to visualize such linear relationships. The value of correlation coefficient [33] lies within the range R in [−1, …, 0,…, +1], where three possibilities hold as shown in Eq. (2):
One of the ways to prove that the constitution of the study groups is near perfection is to compare the correlation coefficients of each study group with the rest of others, and to be sure that all resulting the correlation coefficients are close to +1. The Pearson Correlation Coefficient PC is given by Eq. (3):
where PC (X,Y) = Pearson Correlation Coefficient between variables X and Y,
Xk = values of the X variable, MX = the mean values of variable X.
YK = values of the Y variable, MY = the mean values of variable Y.
The computation table for correlation PC (SG1, SG2) is shown in Tab. 3.
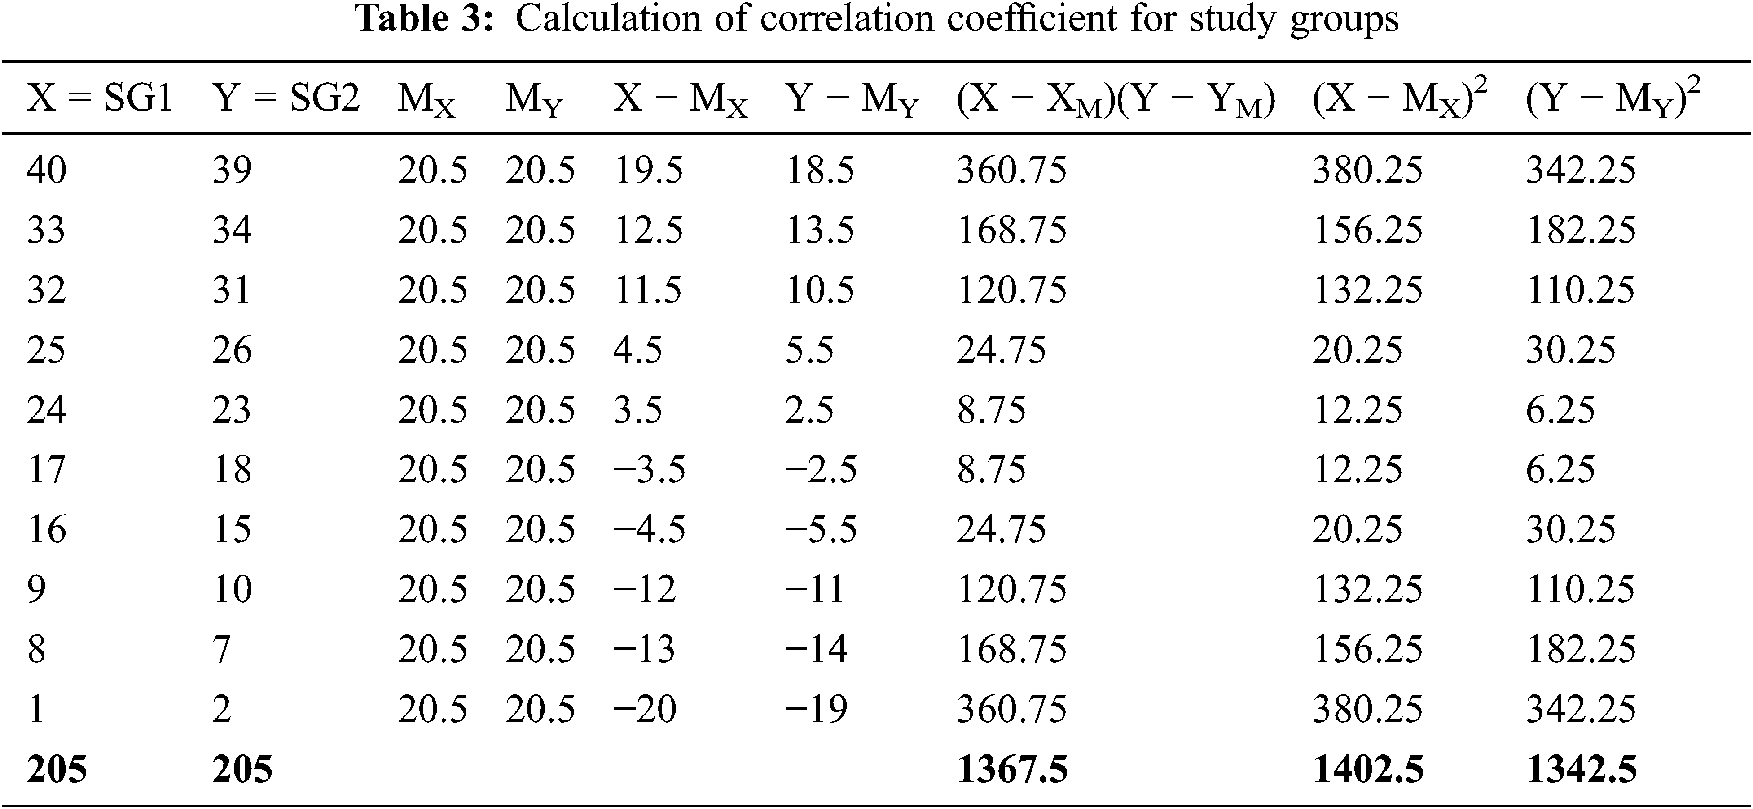
Therefore,
Furthermore, it can also be shown that PC(SG1,SG3) = 0.9858, PC(SG1,SG4) = 0.9674, PC(SG2,SG3) = 0.9963, PC(SG2,SG4) = 0.9850 and PC(SG3,SG4) = 0.9961, all of which are very close to +1.
Furthermore, the Spearman’s Rank Correlation Coefficient SC is given by Eq. (4):
where D = difference in ranks of the two variables representing the two study groups being analyzed and n = number of participants in each study group.
It can be shown that D = 0 in each case, thus the resulting Spearman’s Rank Correlation Coefficient [34] is exactly 1 for every comparison of one study group to another. Thus, SC(SG1, SG2) = 1, SC(SG1,SG3) =1, SC(SG1,SG4) = 1, SC(SG2,SG3) = 1, SC(SG2,SG4) = 1 and SC(SG3,SG4) = 1 respectively.
Based on the results of correlation coefficients, it implies that there is a very strong correlation coefficient between all the arrangements of the individual study groups SG1, SG2, SG3 and SG4. Similar correlation tests have been done after generating study groups for learners of populations size 50 with 5 study groups, 60 leaners with 3 study groups, 80 learners with 4 study groups, using this algorithm, and the resulting correlation coefficients were all very close to +1.
This research has presented a very unambiguous algorithm for achieving a rapid domain knowledge propagation using autonomous and unbiased matching based study groups. The result of the experiment was visualized [35] using a comparative performance graph [36] shown in Fig. 10, and a comparative bar chart shown in Fig. 11. As shown in the figures, the X-axis represents the standard registration formats SGX where X is in the range 1 to 40. Two examinations Exam1 and 2 were taken in line with the system workflow. The results were used to plot the performance graphs and barcharts [37] respectively.
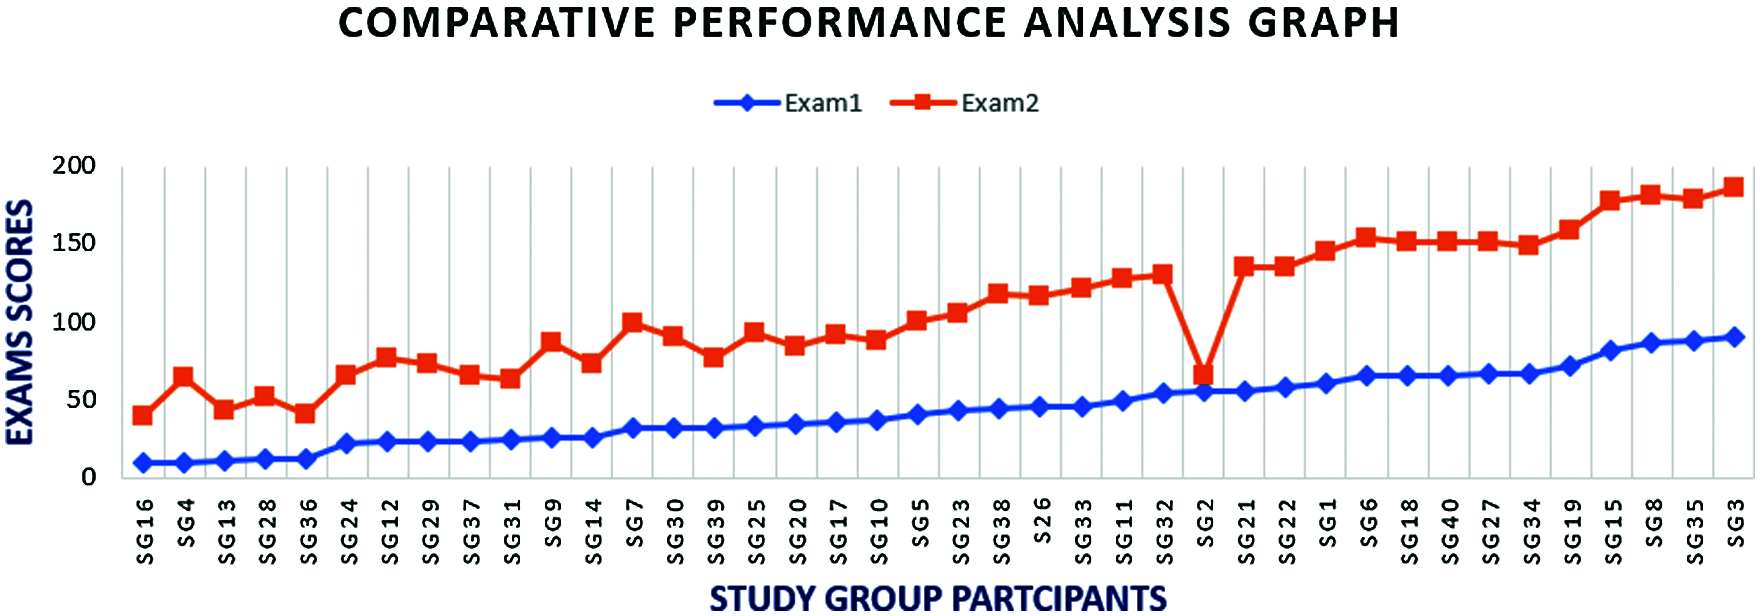
Figure 10: Comparative performance analysis graph
There was a very significant [38] positive displacement for all the participants, especially those who had low grades at the first examination. The only exception was a participant with registration number SG2, who had a score deviation, where score in Exam1 was 55, while score in Exam2 was 20. Thus, the failure rate [39] of this experiment is estimated as 1/40 which is about 2.5% only.
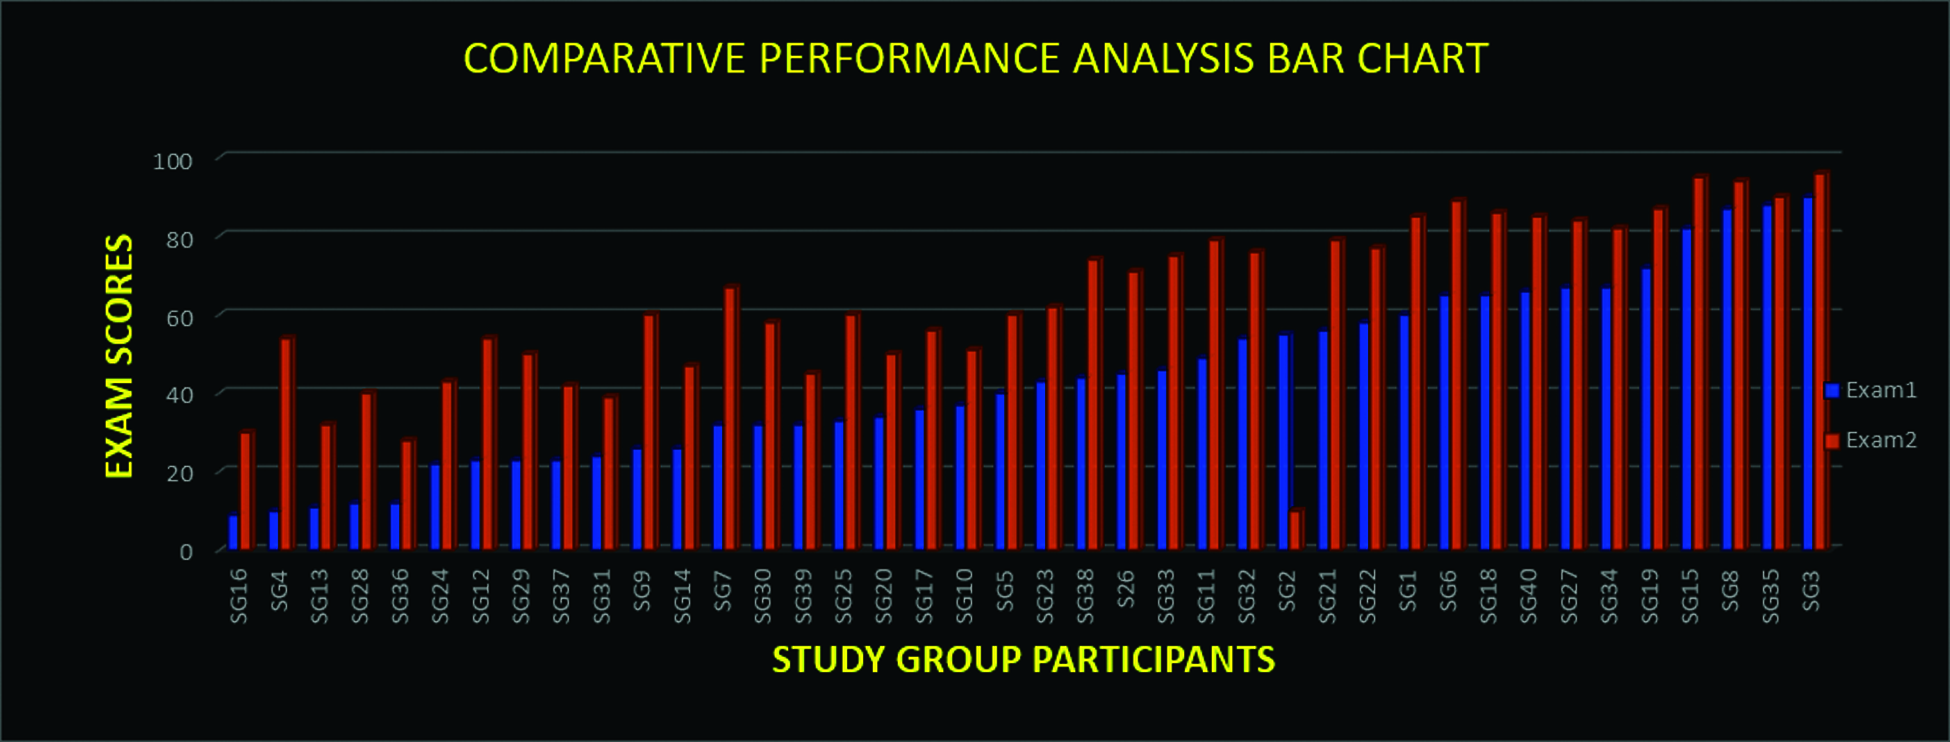
Figure 11: Comparative performance analysis bar chart
In conclusion, this work has presented an innovative algorithm on how to create study groups, and pairs so as to achieve rapid knowledge propagation. A number of new concepts and computational techniques have evolved from this work, as contributions to knowledge. The work has been presented in a very unambiguous manner, with explicit and annotated workflows, flowcharts, among others. Mathematical proofs as well statistical correlations were also exploited for further evaluation of the work, with very impressive outcomes. The outcome of the final experimental run in this research shows about 97.5% success and 2.5% failure. Consequently, future research will focus on performing further investigative study on other factors that affect performance in collaborative study groups, especially in respect of the 2.5% of the participant such as SG2, who failed to perform as brilliantly as others. Future research will also involve running the experiment in a large scale [40], for participants P > 40, and possibly, covering an entire course outline, or taking up other courses apart from Object–Oriented Programming used as a case study in this work. Spearman’s rank correlation is also recommended for future studies in that regard. The algorithms, techniques, concepts and overall content of this research is expected to be very useful to stakeholders in the world of knowledge propagation. Three recent multi-disciplinary works on knowledge propagation are [41–43]. Finally, the dataset for Exams 1 and 2 is shown in Fig. 12.

Figure 12: Dataset used for research
Funding Statement: The authors received no specific funding for this study.
Conflicts of Interest: The authors declare that they have no conflicts of interest to report regarding the present study.
1. S. Chen and W. He, “Study on knowledge propagation in complex networks based on preferences, taking wechat as example,” Abstract and Applied Analysis, vol. 14, no. 543734, pp. 1–11, 2014. [Google Scholar]
2. T. Braunl, A. Boeing, L. Gonzalez, A. Koestler and M. Nuyen, “Design, modeling and simulation of autonomous underwater vehicle,” International Journal of Vehicle Autonomous Systems, vol. 4, no. 2, pp. 106–121, 2006. [Google Scholar]
3. K. Rajashekharaiah, C. Babu and S. Raju, “Parallel string-matching algorithm using grid,” International Journal of Distributed and Parallel Systems, vol. 3, no. 3, pp. 21–28, 2012. [Google Scholar]
4. M. Joseph, H. Arrow and J. Berdahl, “The study of groups: Past, present and future,” Personality and Social Psychology Review, vol. 4, no. 1, pp. 95–105, 2000. [Google Scholar]
5. G. Hendry, S. Hyde and P. Davy, “Independent student study groups,” Medical Education, vol. 39, no. 7, pp. 672–679, 2005. [Google Scholar]
6. N. Annamalai, V. Mazeikiene, B. Tangiisuran and G. Valunaite, “How do students really interact? an investigation of Lithuanian students’ interactions via smartphone apps,” Malaysian Journal of Learning and Instruction, vol. 18, no. 1, pp. 65–83, 2021. [Google Scholar]
7. N. Yanofsky, “Towards a definition of an algorithm,” Journal of Logic and Computation, vol. 21, no. 2, pp. 253–286, 2011. [Google Scholar]
8. M. Sutter and M. Kocher, “Tools for evaluating research output: Are citation-based rankings of economics journals stable?,” Evaluation Review, vol. 25, no. 25, pp. 555–566, 2001. [Google Scholar]
9. A. Ifeanyi, A. Chukwuemeka, A. Uzoma, A. Chioma and O. Henry, “Technological advancement in object-oriented programming paradigm for software development,” International Journal of Applied Engineering Research, vol. 14, no. 8, pp. 1835–1841, 2019. [Google Scholar]
10. S. Graf and R. Bekele, “Forming heterogeneous groups for intelligent collaborative learning systems with ant colony optimization,” Lecture Notes in Computer Science, vol. 40, no. 53, pp. 217–226, 2006. [Google Scholar]
11. A. Sarkar, D. Seth, K. Basu and A. Acharya, “A new approach to collaborative group formation,” International Journal of Computer Applications, vol. 128, no. 3, pp. 7–14, 2015. [Google Scholar]
12. J. Smitha and R. Spindle, “The impact of group formation in a cooperative learning environment,” Journal of Accounting Education, vol. 25, no. 4, pp. 153–167, 2007. [Google Scholar]
13. A. Burke, “Group work: How to use groups effectively,” The Journal of Effective Teaching, vol. 11, no. 2, pp. 87–95, 2011. [Google Scholar]
14. S. Pociask, D. Gross and M. Shih, “Does team formation impact student performance, effort and attitudes in a college course employing collaborative learning?,” Journal of the Scholarship of Teaching and Learning, vol. 17, no. 3, pp. 19–33, 2017. [Google Scholar]
15. H. A. Reijers, I. Vanderfeesten and W. Aalst, “The effectiveness of workflow management systems,” International Journal of Information Management, vol. 36, no. 1, pp. 126–141, 2016. [Google Scholar]
16. E. Makri, N. Choudhary and C. Hava, “Computer programming: A case study of teaching loop statement by using an interactive educational game,” International Journal of Digital Society, vol. 10, no. 2, pp. 1497–1504, 2019. [Google Scholar]
17. E. Eiriksdottir and R. Catrambone, “Procedural instructions, principles and examples how to structure instructions for procedural tasks to enhance performance, learning and transfer human factors,” The Journal of the Human Factors and Ergonomics Society, vol. 53, no. 6, pp. 749–770, 2011. [Google Scholar]
18. S. Golder and B. Huberman, “Usage patterns of collaborative tagging systems,” Journal of Information Science, vol. 32, no. 2, pp. 198–208, 2006. [Google Scholar]
19. K. Verbert, N. Manouselis, H. Drachsler and E. Duval, “Dataset-driven research to support learning and knowledge analytics,” Educational Technology and Society, vol. 15, no. 3, pp. 133–148, 2012. [Google Scholar]
20. A. M. Ramasamy, “Applications of number theory in statistics,” Bonfring International Journal of Data Mining, vol. 2, no. 3, pp. 7–11, 2012. [Google Scholar]
21. A. Mirzapour, “A psychology expert system to determine the level of stress in subjects,” European Journal of Medical and Health Sciences, vol. 1, no. 2, pp. 1–5, 2019. [Google Scholar]
22. C. Butcher, C. Davies and M. Highton, Designing learning: From Module Outline to Effective Teaching, Routledge. New York: Taylor and Francis Group, pp. 20–50, 2006. [Google Scholar]
23. J. Cai, P. Lu and M. Xia, “A computational proof of complexity of some restricted counting problems,” Theoretical Computer Science, vol. 412, no. 23, pp. 2468–2485, 2011. [Google Scholar]
24. K. Singh, P. Kumar, D. Kaur and M. Rai, “Analysis of various computer architectures,” International Journal of Innovation Technology and Exploring Engineering, vol. 8, no. 8S2, pp. 1113–1118, 2019. [Google Scholar]
25. B. Dickman, “Problem posing with the multiplication table,” Journal of Mathematics Education at Teachers College, vol. 5, no. 1, pp. 47–50, 2014. [Google Scholar]
26. Z. Gunnur, A. Pinar and F. Akbiyik, “Specimen rejection in laboratory medicine: Necessary for patient safety?,” Biochemia Medica, vol. 25, no. 3, pp. 377–385, 2015. [Google Scholar]
27. K. Ritzberger, “A ranking of journals in economics and related fields,” German Economic Review, vol. 9, no. 4, pp. 402–430, 2008. [Google Scholar]
28. A. Singh, P. Goyal and S. Batra, “An optimized round robin scheduling algorithm for CPU scheduling,” International Journal on Computer Science and Engineering, vol. 2, no. 7, pp. 2383–2385, 2010. [Google Scholar]
29. R. Otienoh, “Implementation of pair work and group work for creation of interaction opportunities for learners in large classes: The viability of the two strategies,” Journal of Education and Practice, vol. 6, no. 10, pp. 171–179, 2015. [Google Scholar]
30. S. I. Orakwue and R. Ngah, “Two-dimensional switched beam antenna based on cascaded butler matrix beamforming network,” Nigerian Journal of Technology, vol. 38, no. 4, pp. 1003–1009, 2019. [Google Scholar]
31. A. Garcia, A. Sayago and G. Gonzalez, “The correlation coefficient: An overview,” Critical Reviews in Analytical Chemistry, vol. 36, no. 1, pp. 41–59, 2006. [Google Scholar]
32. D. Keima, M. Haob, U. Dayalb, H. Janetzkoa and P. Baka, “Generalized scatter plots,” Information Visualization, vol. 9, no. 4, pp. 301–311, 2009. [Google Scholar]
33. M. M. Mukaka, “Statistics corner: A guide to appropriate use of correlation coefficient in medical research,” Malawi Medical Journal, vol. 24, no. 3, pp. 69–71, 2012. [Google Scholar]
34. T. Gauthier, “Detecting trends using spearman's rank correlation coefficient,” Environmental Forensics, vol. 2, no. 4, pp. 359–362, 2001. [Google Scholar]
35. K. Jayasudha, G. Mohan and H. Sawant, “Review of visualization techniques in computer graphics,” International Journal of Recent Development in Engineering and Technology, vol. 3, no. 1, pp. 76–85, 2014. [Google Scholar]
36. N. Arman, “Graph representation: Comparative study and performance evaluation,” Information Technology Journal, vol. 4, no. 4, pp. 465–468, 2005. [Google Scholar]
37. D. Whitaker and T. Jacobbe, “Students' understanding of bar graphs and histograms: Results from the locus assessments,” Journal of Statistics Education, vol. 25, no. 2, pp. 90–102, 2017. [Google Scholar]
38. A. McCluskey and A. Lalkhen, “Interpreting the results of statistical tests, continuing education in Anaesthesia,” Critical Care and Pain, vol. 7, no. 6, pp. 208–212, 2007. [Google Scholar]
39. J. F. Candido and S. P. Santos, “Strategy implementation: What is the failure rate?,” Journal of Management and Organization, vol. 21, no. 2, pp. 237–262, 2015. [Google Scholar]
40. M. Gall, M. Hauschildt and R. Hernandez, “Large-scale statistical analysis of early failures in Cu electromigration, part ii: Scaling behavior and short-length effects,” Journal of Applied Physics, vol. 108, no. 1, pp. 4–6, 2010. [Google Scholar]
41. D. Soeprapto, “Correlation between knowledge exchange and combination and leader member exchange,” International Journal of Research in Business and Social Science, vol. 10, no. 4, pp. 169–182, 2021. [Google Scholar]
42. S. Kim, “Influential indicators and measurement of mediating and moderating roles on sme performance,” International Journal of Knowledge Management, vol. 18, no. 1, pp. 1–18, 2021. [Google Scholar]
43. M. Russ and A. Cofrin, “Knowledge management for sustainable development in the era of continuously accelerating technological revolutions: A framework and models,” Sustainability, vol. 13, no. 6, pp. 1–32, 2021. [Google Scholar]
 | This work is licensed under a Creative Commons Attribution 4.0 International License, which permits unrestricted use, distribution, and reproduction in any medium, provided the original work is properly cited. |