DOI:10.32604/csse.2022.022206
| Computer Systems Science & Engineering DOI:10.32604/csse.2022.022206 | |
| Article |
RDA- CNN: Enhanced Super Resolution Method for Rice Plant Disease Classification
1Department of Computer Science and Engineering, Coimbatore Institute of Technology, Coimbatore, 641014, India
2Department of Information Technology, Coimbatore Institute of Technology, Coimbatore, 641014, India
*Corresponding Author: K. Sathya. Email: sathya.k@cit.edu.in
Received: 29 July 2021; Accepted: 30 August 2021
Abstract: In the field of agriculture, the development of an early warning diagnostic system is essential for timely detection and accurate diagnosis of diseases in rice plants. This research focuses on identifying the plant diseases and detecting them promptly through the advancements in the field of computer vision. The images obtained from in-field farms are typically with less visual information. However, there is a significant impact on the classification accuracy in the disease diagnosis due to the lack of high-resolution crop images. We propose a novel Reconstructed Disease Aware–Convolutional Neural Network (RDA-CNN), inspired by recent CNN architectures, that integrates image super resolution and classification into a single model for rice plant disease classification. This network takes low-resolution images of rice crops as input and employs the super resolution layers to transform low-resolution images to super-resolution images to recover appearance such as spots, rot, and lesion on different parts of the rice plants. Extensive experimental results indicated that the proposed RDA-CNN method performs well under diverse aspects generating visually pleasing images and outperforms better than other conventional Super Resolution (SR) methods. Furthermore, these super-resolution images are subsequently passed through deep classification layers for disease classification. The results demonstrate that the RDA- CNN significantly boosts the classification performance by nearly 4–6% compared with the baseline architectures.
Keywords: Super-resolution; deep learning; interpolation; convolutional neural network; agriculture; rice plant disease; classification
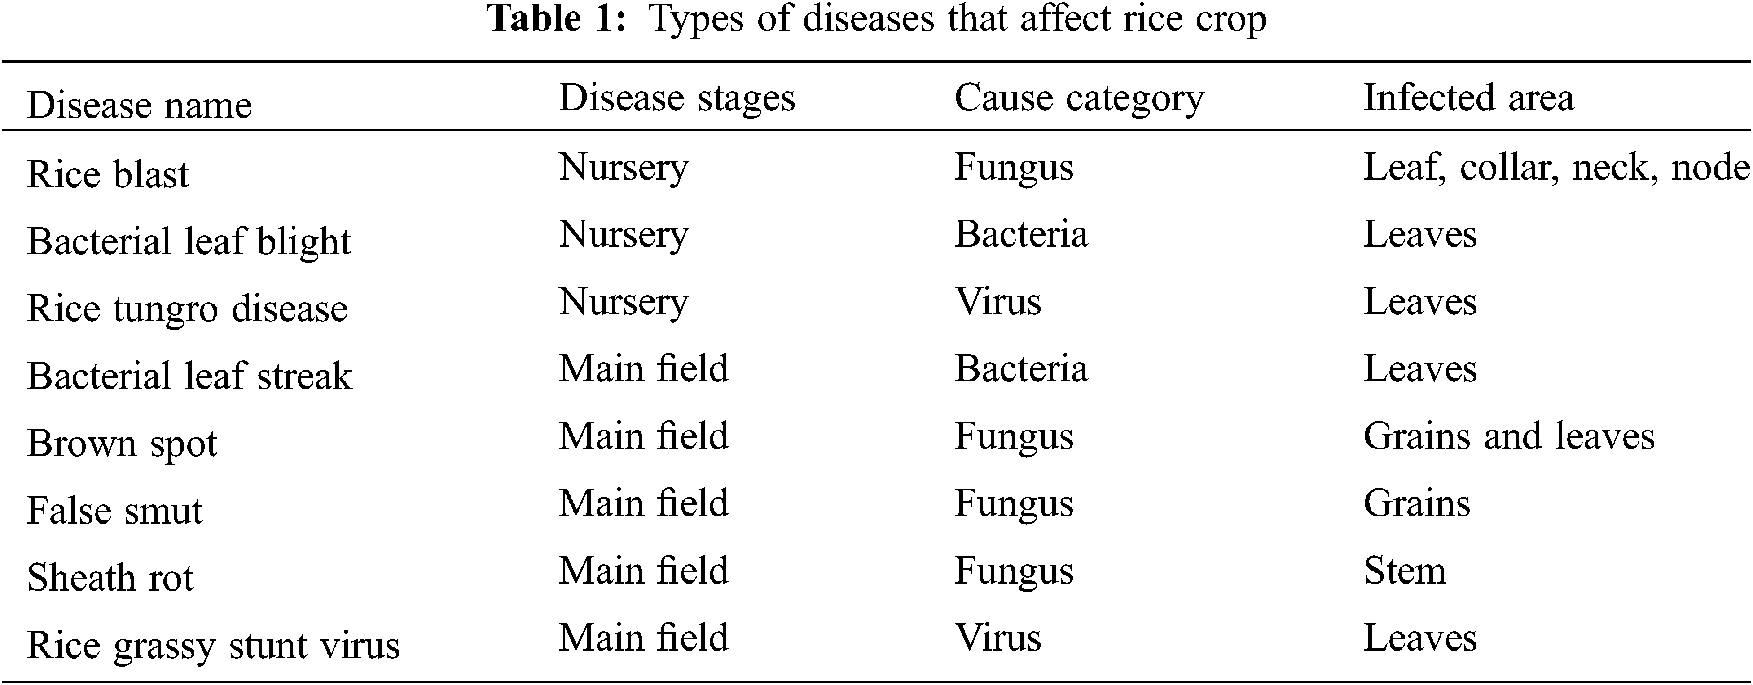
Rice (Oryza sativa L.) being the primary source of nutrition and the major consumed food crop, demands constant increase with respect to the equivalent growth in population. Depending upon the environmental factors and variety, rice plants take around 3–6 months duration to obtain their yield. The growth stages of rice plant such as vegetative, reproductive, ripening is monitored and production may be affected by diseases which result in yield loss. These diseases are caused by various pathogens like bacteria, fungus or viruses and can affect different parts of crops at any of the stages [1]. Here the study considered most commonly affected different diseases of rice in Asian countries listed in Tab. 1.
Identifying and diagnosing rice plant diseases and pests is one of the major challenges in the agriculture sector. Timely detection is generally carried out through visual inspection by experts. Thus, it is often time-consuming, detection is not accurate and may lead to misdiagnosis, overuse of pesticides etc. Hence, there is a need for an automatic early disease diagnostics system for classification. This system helps the researcher to monitor the plant growth and also detect the disease symptoms at earlier stages through deep learning and computer vision algorithms.
In recent years, many researchers showed optimistic results in improving the accuracy of plant disease classification using deep learning techniques [2,3]. Similarly, the images acquired in real-time are typically unclear and thus reduces the accuracy of the image classification algorithms. In order to enhance the low-image quality (blur, noise, poor camera focus), SR algorithm needs to be incorporated to reconstruct the quality of input images. Although super-resolution is concerned, the early research on the contribution of deep learning is Super-Resolution Convolutional Neural Network (SRCNN). SRCNN, which aims to restore missing information from low-resolution images and acts as a mapping function between input low resolution (ILR) and reconstructed high-resolution images (ISR) [4]. Deep learning-based image SR techniques are in increased demand in the field of agricultural imaging which enhances the overall performance of disease recognition and classification through computer vision techniques.
The scarcity of images with high resolution becomes challenging, recovering texture details from input images, poor diagnostic performance are few limitations identified in the related works. In order to overcome this, SR methods generate higher image resolution achieves better disease classification. The proposed RDA-CNN method uses two main architectures to recover the high resolution of input images by integration of CNN-based super resolution layers with the deep classification layers.
During this exploration, the key contributions of this paper can be summarized as follows;
1. A Novel Reconstructed Disease Aware–Convolutional Neural Network (RDA-CNN) is the combination of super resolution layers and classification layers.
2. RDA-CNN uses convolutional layers to improve fine-grained low-resolution images with different scaling factors for image classification.
3. In addition, experimental results of verified RDA-CNN outperform state-of-the-art deep learning CNN architectures are used in terms of visual image quality and classification accuracy on a publicly available rice disease image dataset.
Recently, many researchers have extensively explored deep learning techniques for super resolution imaging for computer vision tasks that could become very popular and have also achieved significant performance improvements compared to traditional super resolution methods [4,5]. In this section, a short overview of deep neural networks in the context of super-resolution tasks and image recognition is discussed. In many application domains, real-time input images were provided with a lack of resolution used for experimental study. The use of these images seems to be the primary reason for a relatively low diagnostic performance and therefore, low image quality has been highlighted as an essential aspect that affects classification accuracy [6,7]. The objective is to improve low resolution image quality and a crucial step in the emerging research domain such as security surveillance, agriculture, medical diagnostics, remote sensing, ultrasound imaging, astronomical observation and biometric recognition and so on [8]. Image SR techniques aim to enhance the resolution of images from either single or multiple images. In recent times, SR based on a single image as Single Image Super Resolution (SISR) has shown significant performance using learning and reconstructed methods [9,10]. Dong et.al uses pre- upsampling SR techniques and proposed Convolutional Neural Network based Super Resolution techniques referred to as SRCNN model, which further shows significant prediction performance on mapping of low resolution and reconstructed high-resolution images. Furthermore, use of larger filter size in CNN layers are better and the performance of SRCNN is compared with conventional methods.
SRCNN was employed first in the agricultural sector for automated disease diagnosis of tomato leaf images [10]. Here, SRCNN is designed to enhance the spatial resolution of an image where, interpolated low resolution images are taken as input. it showed promising results when compared to conventional interpolated methods such as bilinear, nearest neighborhood, bicubic, cubic, and lanczos4. In addition, the accuracy of disease classification using AlexNet architecture increased by 20% between low and super resolution images whereas the accuracy by 90%. Few other research papers focused on classical work to explore further details on SRCNN and have shown improved performance in significant research fields such as plant disease diagnosis [11–13], cytogenetics [14], blood cell count [15], CT scan [16], and vehicle detection [17], agricultural pest detection [18,19], etc.
SRGAN is the Generative Adversarial Network (GAN) based super resolution method which combines conventional SRCNN with deep learning-based image classification proposed to generate super resoluted images and perceptual loss function [20]. Although GAN showed better ability in super resolution tasks for disease classification in plants. Recently, Enhanced Super-resolution GAN (ESRGAN) was used to resolve low resolution crop image and generates its corresponding SR images based on GAN method. Due to inadequate data, transfer learning is applied to fine-tune the ESRGAN model to avoid underfitting problems. The experiments using this model recovered more realistic image crop information and improved the classification accuracy of tomato plants. Images obtained from real environment are typically not clear and of low quality which results in significant impact on disease identification and classification accuracy. To overcome this issue, Dual Attention and Topology Fusion GAN (DATFGAN) was proposed to convert into high resolution images which improve classification accuracy nearly by 2–3% using different transfer learning models. Similarly, SR method for diagnosing cucumber leaf disease named Leaf Artifact-Suppression Super Resolution (LASSR) was proposed to generate images with high quality which achieved 2% better classification performance compared with ESRGAN [21].
In recent years, plant disease recognition and crop stress using deep learning models are the major challenges for the agricultural industry. A lot of intensive studies on factors affecting crop production and identification of specific plant diseases were developed using the current advancement in the field of deep learning and computer vision. More recently, 60% of the researchers uses conventional deep convolutional neural networks for plant disease classification model that works efficiently on different crops such as wheat, paddy, banana, mango, tomato, maize, soybean sugarcane and cassava plant leaves [22–24]. Different kinds of CNN-based models are being used in field of disease recognition in plants. Earlier, few researchers explored the CNN model as a feature extractor in which features are extracted in last convolution layer. Initially, CNN with SoftMax and CNN with Support Vector Machines (SVM) results were compared in terms of efficiency to investigate the CNN deep features [25]. Popularly CNN based transfer learning models such as VGG16, ResNet50, InceptionV3, InceptionResNetV2, Xception have been used to recognize crop diseases and pests, and the performance of these models was compared in terms of fine tuning, transfer learning and training from scratch of rice crop diseases [26]. In addition, VGG16 performed high accuracy for the classification of various diseases in different datasets [27,28]. The author proposed novel a DENS-INCE which is the combination of pre-trained DenseNet and Inception network for disease identification in rice plants and achieved better performance when compared to other pre-trained models [29].
According to these research studies, deep learning-based classification methods are useful for analyzing plant disease and successful results have been obtained. The challenges based on the limitation of existing methods for disease classification are as follows: i) lack of availability of high-resolution image data, ii) recovery of texture details from low- quality images, iii) images collected from a controlled environment, iv) data scarcity, and v) complex background in real conditions. However, the images retrieved from the farms (both healthy and diseased images) are usually unclear which causes a significant impact on plant disease image classification. Therefore, it is crucial to improve the disease classification accuracy using SR methods. The proposed RDA-CNN extremely useful in real-time applications especially in the agricultural sector help the researchers to make a plant disease diagnosis and classification at an early stage.
The proposed network named RDA-CNN integrates the super resolution layers and classification layers are the major contribution addressed in this paper as shown in the Fig. 1. It includes three distinctive phases of techniques: i) initial feature extraction, ii) super resolution layers and iii) classification layers for disease classification. Image quality distortion uses a conventional image scaling algorithm for resizing the input image dataset. Finally, low resolution image can be reconstructed to super resolution image and performance of the different image classifier models is improved. The overview of the proposed methodology is discussed in this section.
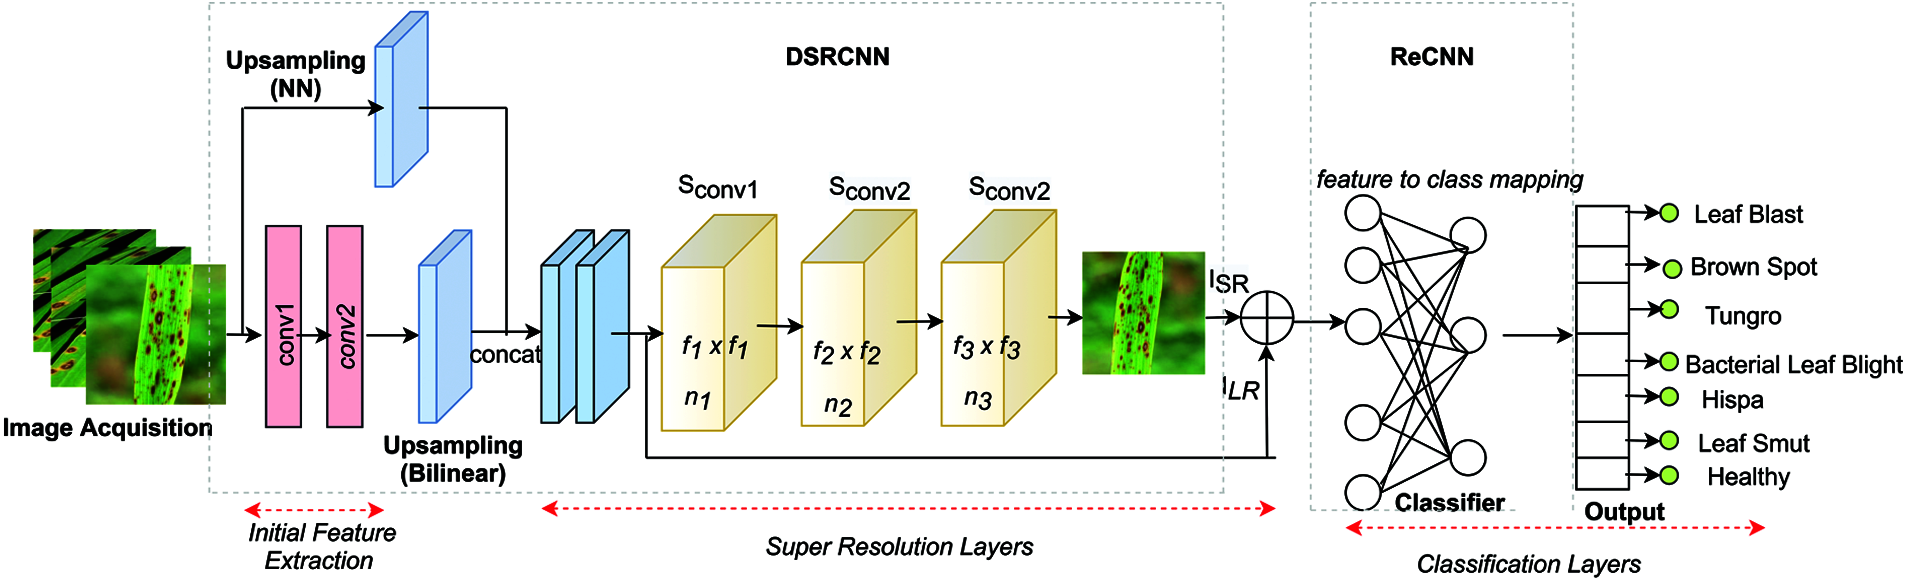
Figure 1: Architecture of reconstructed disease aware–convolutional neural network (RDA-CNN)
3.1 Initial Feature Extraction
Consider the input dataset with high resolution images IHR = {I1, I2, I3……IN} of each class in a rice disease samples. Generally, the low-resolution image (ILR) is obtained by IHR using Eq. (1).
where F denotes a degradation function and σ degradation parameter as scaling factor (r) or a noise. In general, the process of image degradation is unknown and only ILR images are provided. Several works implement downsampling operation with scaling factor (r) as a degradation process, where r is always greater than 1 and as discussed in Eqs. (2) and (3).
The ILR is the low-resolution representation of IHR image, which would be retrieved by resizing the downscaled images using interpolation methods.
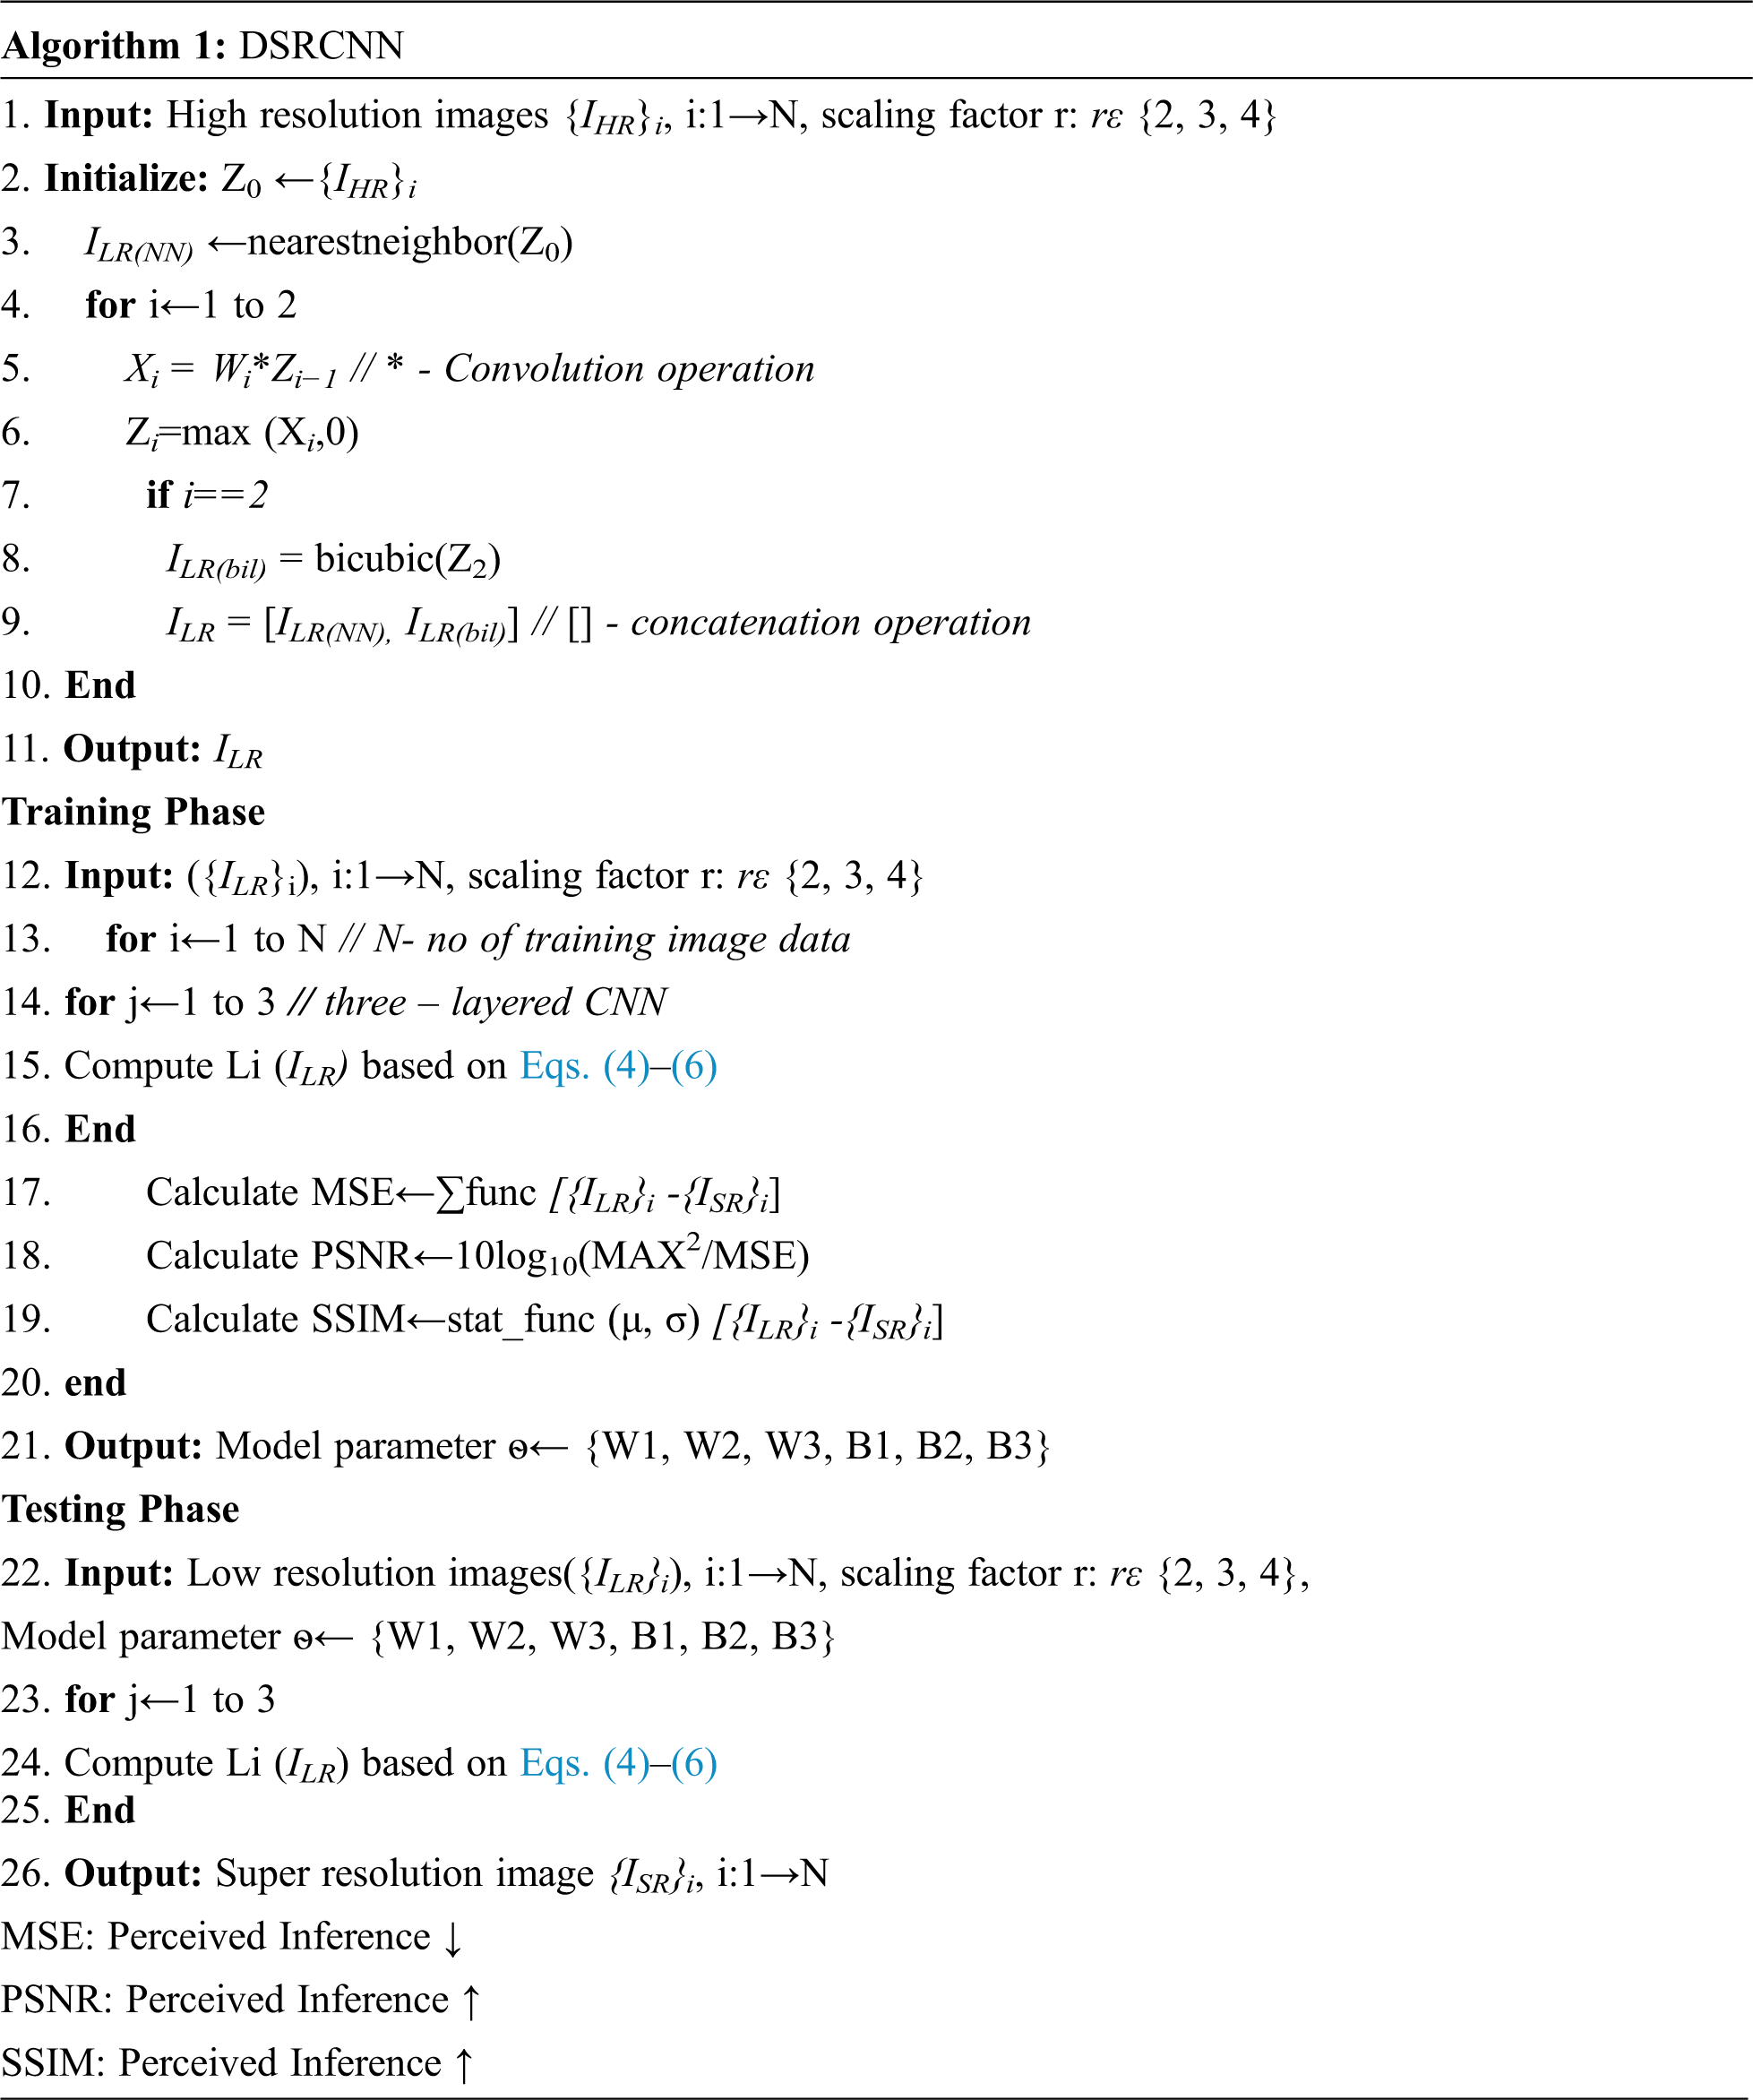
The ultimate goal of this work is to reconstruct a super-resolution image ISR from the low-resolution image ILR and learn a function mapping between ILR and IHR. To recover quality of the image, Dong et.al considered a Convolutional Neural Network (CNN) and proposed a model named SRCNN for SISR. The proposed Deformed SRCNN (DSRCNN) uses a three-layer convolution network, and the upsampling layer is applied before the convolutional layers to upscale the ILR image to the ISR size. The architecture of the DSRCNN is shown in Fig. 1.
Given an input color image ILR is the low-resolution version of IHR which includes tensor size as width (w), height (h) and RGB channel (c). In the upsampling layer, image size is scaled to rh × rw × c, where r is the scaling factor, rε {2, 3, 4} and c is the color channel. This can be expressed as follows in Eq. (3).
Generally, upsampling methods such as interpolation (bilinear, bicubic, nearest neighborhood, cubic, and lanczos4), deconvolution, and unpooling are used in computer vision is employed with CNN. The original SRCNN uses bicubic interpolation for upscaling the image to its desired size. In the proposed work, upsampling layers uses bilinear and nearest neighbor interpolation methods to achieve better results for the rice disease dataset. The output of bilinear interpolated images is concatenated with the nearest neighbor interpolated input before being fed to the convolutional block.
This section explores the concepts of convolutional neural networks that are applied to super resolution problem. Consider the input image in which the RGB color space is converted to YCbCr and the DSRCNN network trains the luminescence (Y) channel exclusively. With an input low-resolution image, final super resoluted image is the output resulting from three layered convolutional network includes the phases of operation such as feature extraction, non-linear mapping and reconstruction as follows.
The upscale low-resolution image as ILR will be used as an input for first layer Convolution Neural Network. Consider the input image ILR has size w, h represents the width and height respectively. ILR is convoluted with kernels of the size f1 × f1 and the depth of this layer is n1, i.e., the number of filters in this layer represents n1. Formally, the first layer is given in Eq. (4) as follows.
where W1 denotes kernels in filters, B1is the bias vector with n1 dimensions and ‘*’ represents the convolution operation. The W1 is applied to each filter and size of the W1 is c× f1×f1×n1, where c is the channel (c = 1), f1 ×f1 is the spatial size of filter (f1 = 9), n1 is the number of filter (n1 = 128) and B1 is n1. A Rectified Linear Unit (ReLU, max (0, x)) used as an activation function on each filter response.
3.4.2. Non-Linear Mapping
The first layer in the network is initially scaled down and then scaled up to the input RGB image using bilinear interpolation technique. This layer extracts n1 dimensional features maps (n1 = 128) using the 9 × 9 kernel function. Similarly, second layer maps n1 to n2 dimensional features maps with n2 filters and kernel sizes such as f2 × f2. The second layer operation is specified in Eq. (5) as follows
W2 and B2 are the kernels size and bias vector respectively in the second layer, L1(ILR) is the feature maps from the first layer. The size of the W2 is n1 × f2 × f2 as f2 = 3 and bias vector n2 where n2 = 64. The output of second layer is considered as n2-dimensional vectors and thus represents the high-resolution patch that to be used for image reconstruction.
The third layer in the network aggregates the high-resolution patches from the previous output that results in generating a final super resoluted image. The operation of this layer is expressed in Eq. (6) as
Here W3 represents kernel size in filter n3 and size is given as n2 × f3 × f3 × c where f3 = 5 and B3 is c- dimensional vector size and c = 1.
Mean Square Error, Peak Signal-to-Noise Ratio and Structural Similarity can be used to evaluate the quality of an image. The performance of the super-resolution method is evaluated between high-resolution images (IHR) and low-resolution images (ILR) and super-resolution images (ISR) for quantitative evaluation.
3.5.1 Peak Signal-to-Noise Ratio (PSNR)
Given the high-resolution image IHR and a reconstructed super resolution image ISR with N pixels, the PSNR between IHR and ISR is defined as maximum pixel value of gray scale (MAX- ranges to 255) and Mean Squared Error between images. As shown below in Eqs. (7) and (8), MSE and PSNR are derived between the reference and reconstructed image of N pixels and PSNR computation is associated with the pixel-level MSE.
where ISR, IHR and N are super resolution image, high resolution image and image size respectively. Here the PSNR is measured in terms of Decibel (dB).
3.5.2 Structural Similarity (SSIM)
For the assessment of structural similarity between images, the structural similarity index (SSIM) is proposed based on independent comparisons of an image with N pixels in terms of luminance (μ) as mean, contrast (σ) as standard deviation of image intensity and structures are calculated using Eq. (8) as follows.
where
The third phase of the classification layers is combinational of convolutional and fully connected layers with high quality images from the previous super–resolution layers. For image classification, the number of CNN frameworks have been proposed. Furthermore, the five popular Convolutional Neural Networks are used for the rice crop disease classification. All CNN's architecture with different depths typically consists of Convolutional, ReLU, pooling and fully-connected layers.
Consider the input dataset with high-resolution, low-resolution, and super-resolution images {(IHR)i, (ILR)i, (ISR)i}, where i = 1 to N images and class labels (C1–C7). In these Rice Plant Disease (RPD) classification, input dataset is divided into training and testing data with ratio of 0.8 and 0.2 respectively. The architecture of Reformed CNN (ReCNN) for RPD classification has convolutional, pooling and fully connected layers connected with ReLU activation function as shown in Fig. 2. The performance of the proposed model is compared with traditional deep learning models such as AlexNet, Inception_ModelV3, ResNet-50 and VGGNet. The number of epochs used to train ReCNN is 150, Adam optimizer with learning rate of le−3 and remaining parameters are set to default values. The loss function of this model uses Cross entropy. The algorithm for the classification layers is given as below.
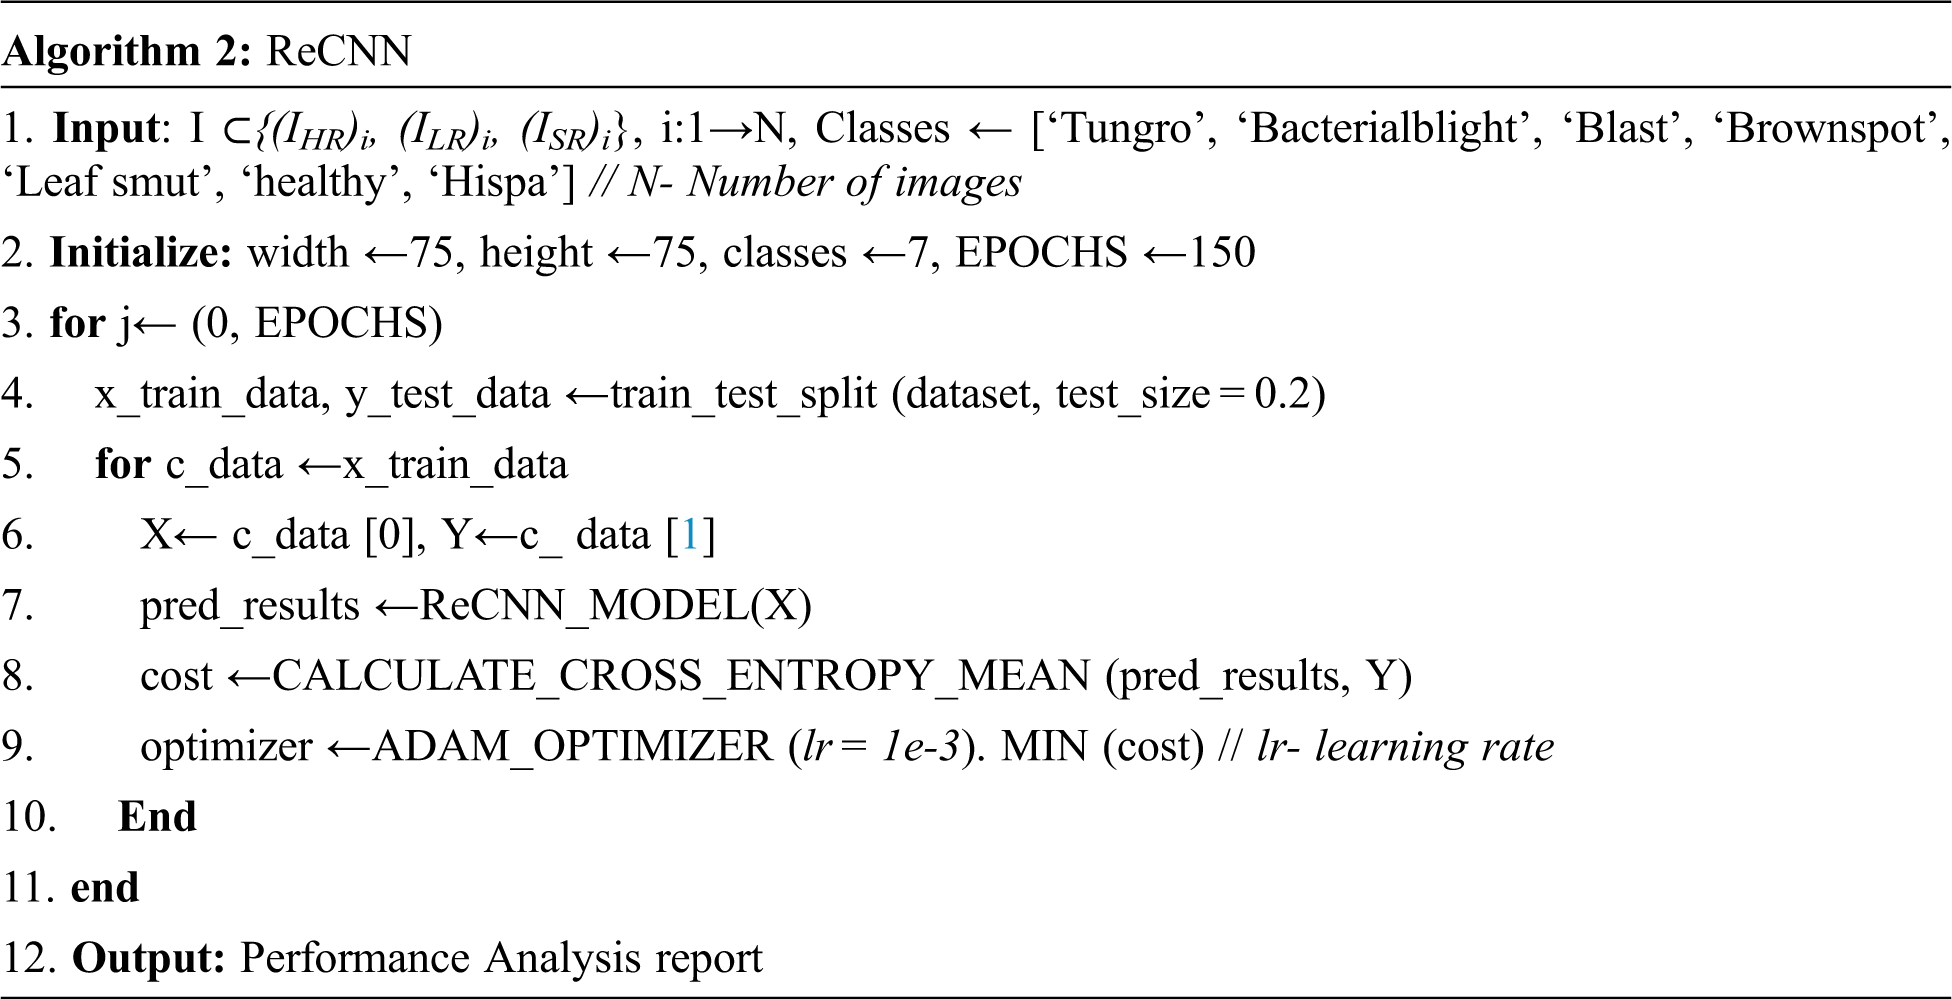
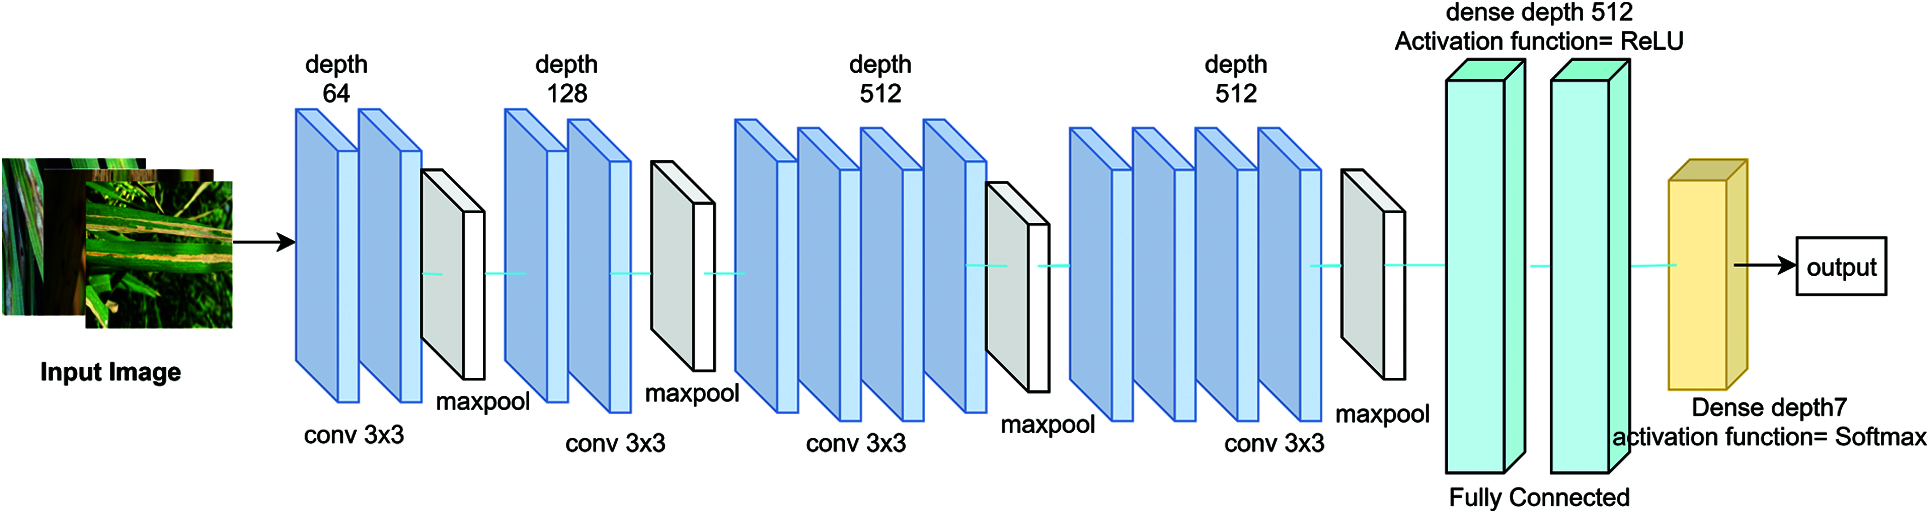
Figure 2: Proposed ReCNN network architecture
4 Experimental Results and Analysis
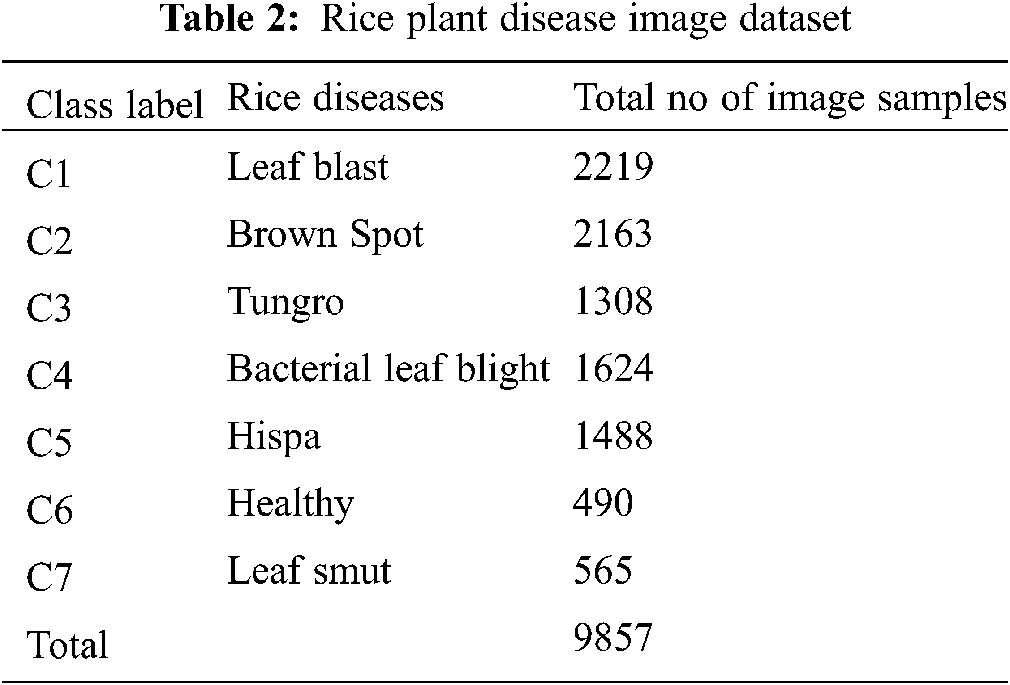
Rice Crop disease images were acquired from sources extracted from papers authored by [29,30]. This work encompasses seven classes of rice disease images in the dataset which includes i) Blast (Pyricularia grisea (P. oryzae), ii) Brown Spot (Helminthosporium oryzae), iii) Bacterial Leaf Blight (Xanthomonas oryzae pv. oryzae), iv) Sheath Blight (Rhizoctonia Solani), v) Rice Tungro virus (RTSV, RTBV), vi) Hispa, vii) False Smut (Ustilaginoidea virens) and viii) Healthy. The number of images of each disease class of different dataset is shown in Tab. 2.
The images of rice plant affected with above mentioned diseases are shown in Fig. 3.

Figure 3: Sample images of healthy and disease affected rice plant (a) rice blast (b) bacterial blight (c) brownspot (d) leaf smut (e) tungro (f) healthy (g) hispa
The performance of proposed RDA-CNN super-resolution over conventional methods and thus results in improving the spatial resolution of both healthy and diseased images of rice plants are discussed in this section. However, the experimental results show better performance of generated super-resolution images and also analyze the importance of SR images for rice disease classification.
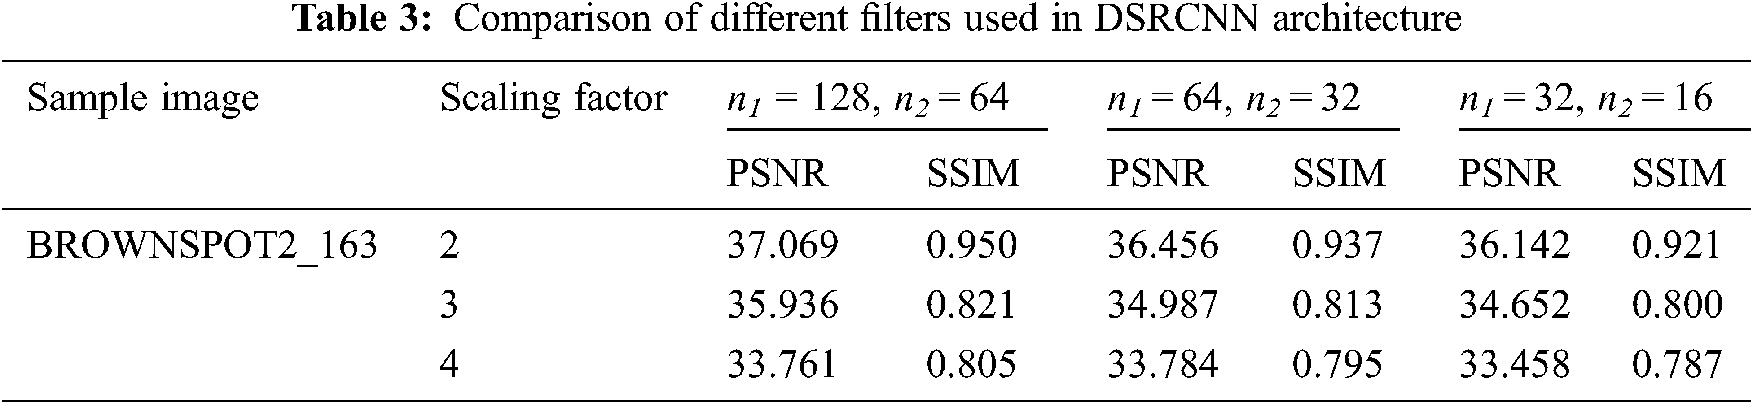
Experimental analysis of the proposed super-resolution method for improving the resolution of low-quality input images is considered and image quality assessment measures like PSNR and SSIM are analyzed. The experiment conducted on different classes of rice plant diseases clearly depicts that DSRCNN successfully reconstructed the low-resolution images. On the other hand, reconstructed SR images helps the researchers to recognize detailed characteristics of a diseased images like lesion, rust and spots on different parts of the plant. The images of rice plant dataset are split into two sets using 80% for training and 20% for testing as a spilt ratio. During this training phase, low resolution images are generated by downsampling method. Then these interpolated images are up sampled by using nearest neighbor with two skip connections and bilinear interpolation with varying upscaling factor 2–4 respectively. In training phase, proposed DSRCNN model is trained for 200 epochs with batch size of 128. Next, in testing phase DSRCNN model is to produce the super–resolution images of rice plant images. In addition, the performance of super resolution network architecture is examined based on the factors like number of filters, layer depth and filter sizes. Generally, adding more filter would improve the performance of the network. For the experimental analysis, the network model is trained with varying number of filters are shown in Tab. 3 and results indicates that increasing the width would result in better performance. The architecture of DSRCNN is modelled with three layers depth, filter numbers as n1 = 128, n2 = 64 and filter size (9-3-5) to greater results.
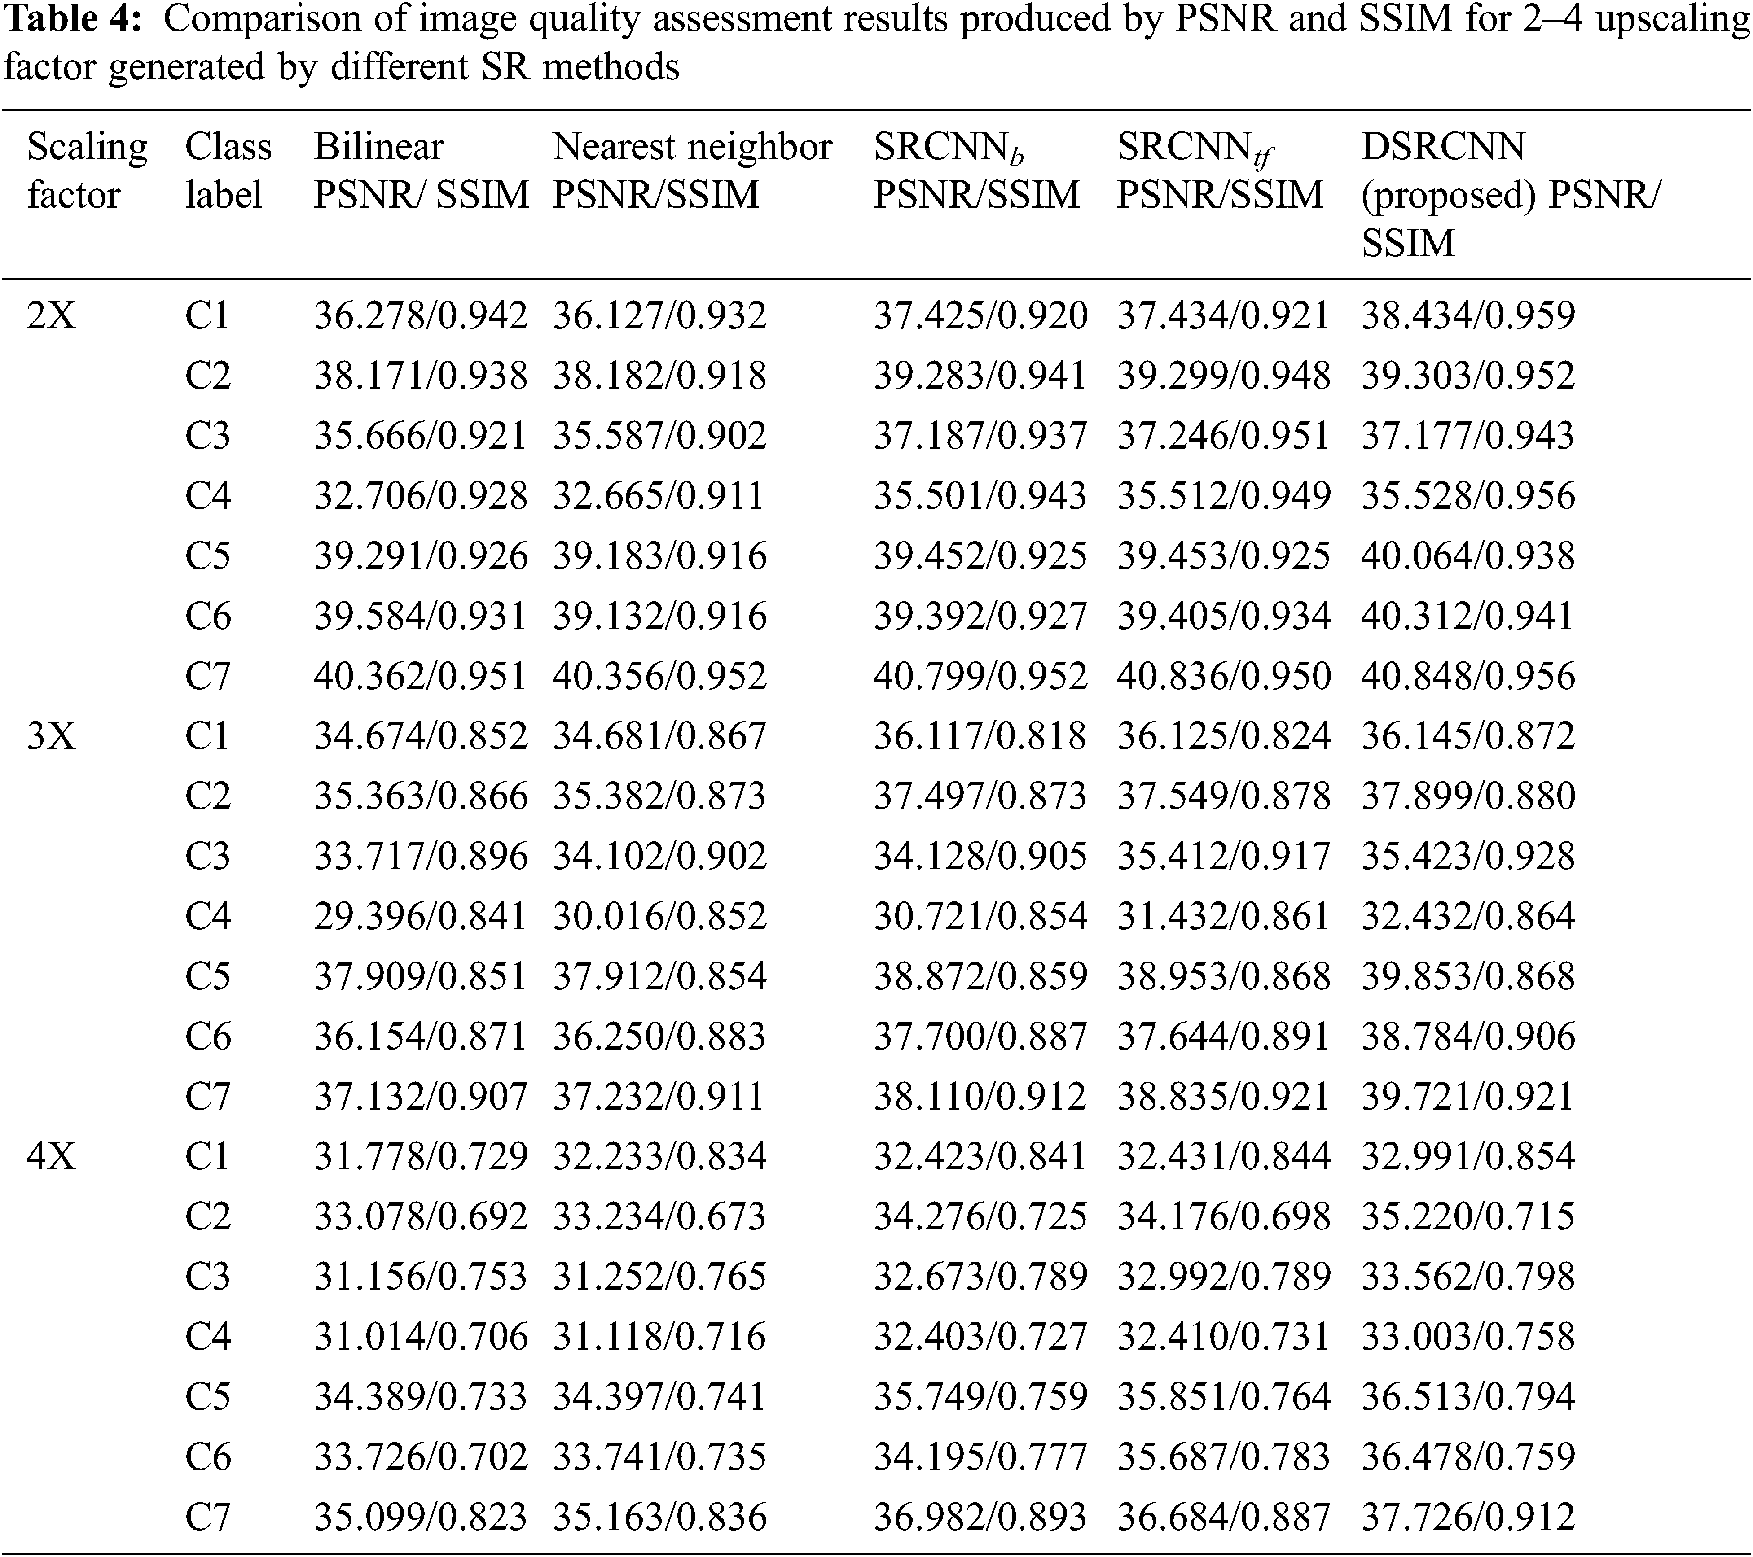
The performance of DSRCNN model is evaluated between high-resolution, low resolution and super resolution images of different diseases using PSNR and SSIM. These measures are analyzed and also compared with conventional interpolation and SR methods as shown in the Tab. 4. Although the results of DSRCNN deep learning-based method outperforms for all the classes (C1–C7) with scaling factor (2–4). The generated SR images of the DSRCNN model resulted in higher PSNR and SSIM than low resolution images.
The average results of performance metrics like MSE, PSNR and SSIM for the evaluation of image quality assessment with different scaling factor (2X, 3X and 4X) are shown in the Fig. 4.

Figure 4: Comparison of MSE, PSNR, and SSIM for different magnification scales a) MSE b) PSNR c) SSIM
In Fig. 4, the graph provides insights average values of MSE, PSNR and SSIM for different SR algorithms over seven different classes of RPD with 2X scaling shows better results compared to other scaling factors. These results indicate that DSRCNN outperformed all other methods in terms of PSNR and SSIM at all magnification scales. In DSRCNN, PSNR were higher by at least 1.5 to 2 dB with conventional methods and 0.5 to 1 dB with baseline and transfer learning based SRCNN. Similarly, SSIM also increased by average of 0.01 to 0.025. Although the proposed super-resolution method performed very well, less than 2–3% of the test images resulted in lower performance measure than the other low-resolution images.
4.2.2 Evaluation on Disease Classification
In disease classification experiment, the input image samples (high, low and super resolution image) are chosen randomly with spilt into train and test sets with a split ratio of 80% and 20%. The proposed model RDA- CNN with ReCNN shows the overall better accuracy of rice disease classification using low, high and super resolution images with different scaling factor is discussed in. Furthermore, classification accuracy on super resolution images is quite higher compared with low resolution images for all scaling factor. These results clearly indicates that the low classification accuracy on LR images and reveals these images holds less detailed information for RPD classification.
The overall classification accuracy of RPD classification using deep learning-based CNN classification models for the images with 2–4 scaling factor is shown in Fig. 5. This graph indicates the clear perception that classification accuracy for super resolution images with 2X scaling is always higher than all CNN models and super – resolution images outperform for all scaling factor. In terms of deep learning CNN models ReCNN shows greater results for all kind of images along with varying scaling factors.
The average RPD classification accuracy for all categories of images with conventional CNN architectures such as AlexNet, Inception_ModelV3, ResNet-50, VGG16 and VGG19 are analyzed and results are discussed in Tab. 5.
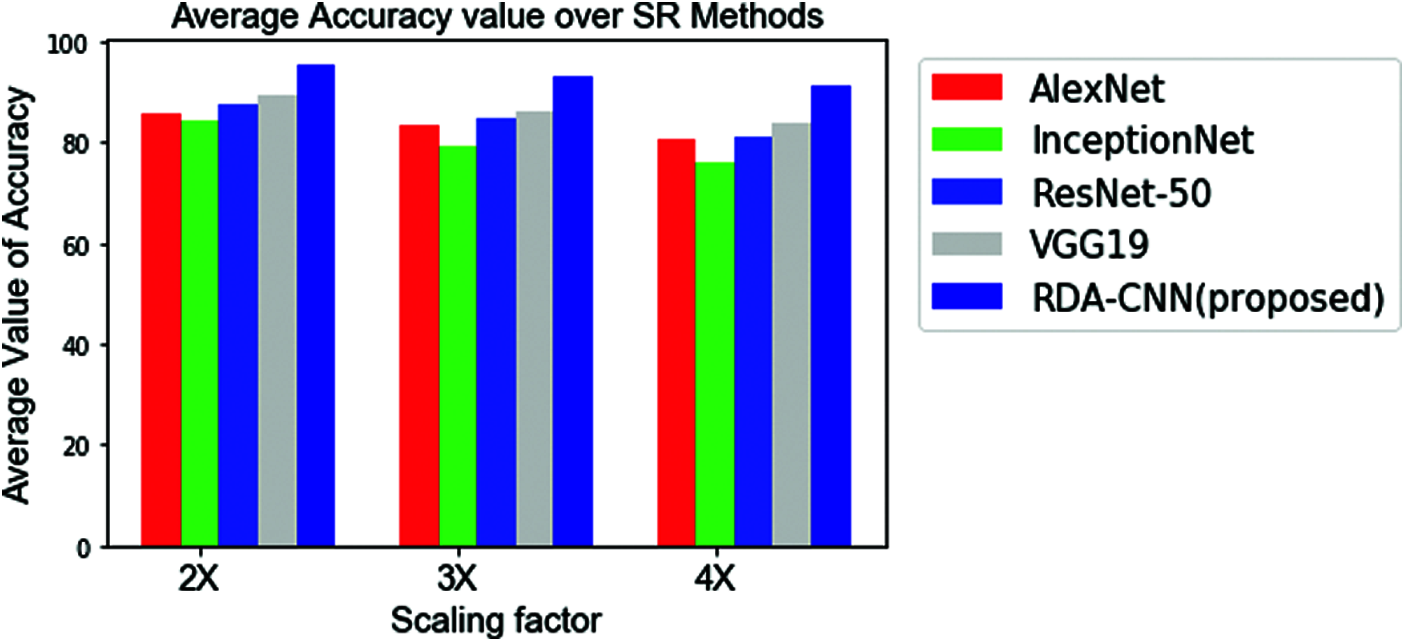
Figure 5: Comparison of average accuracy value over different classification models with varying scaling factors (2–4)
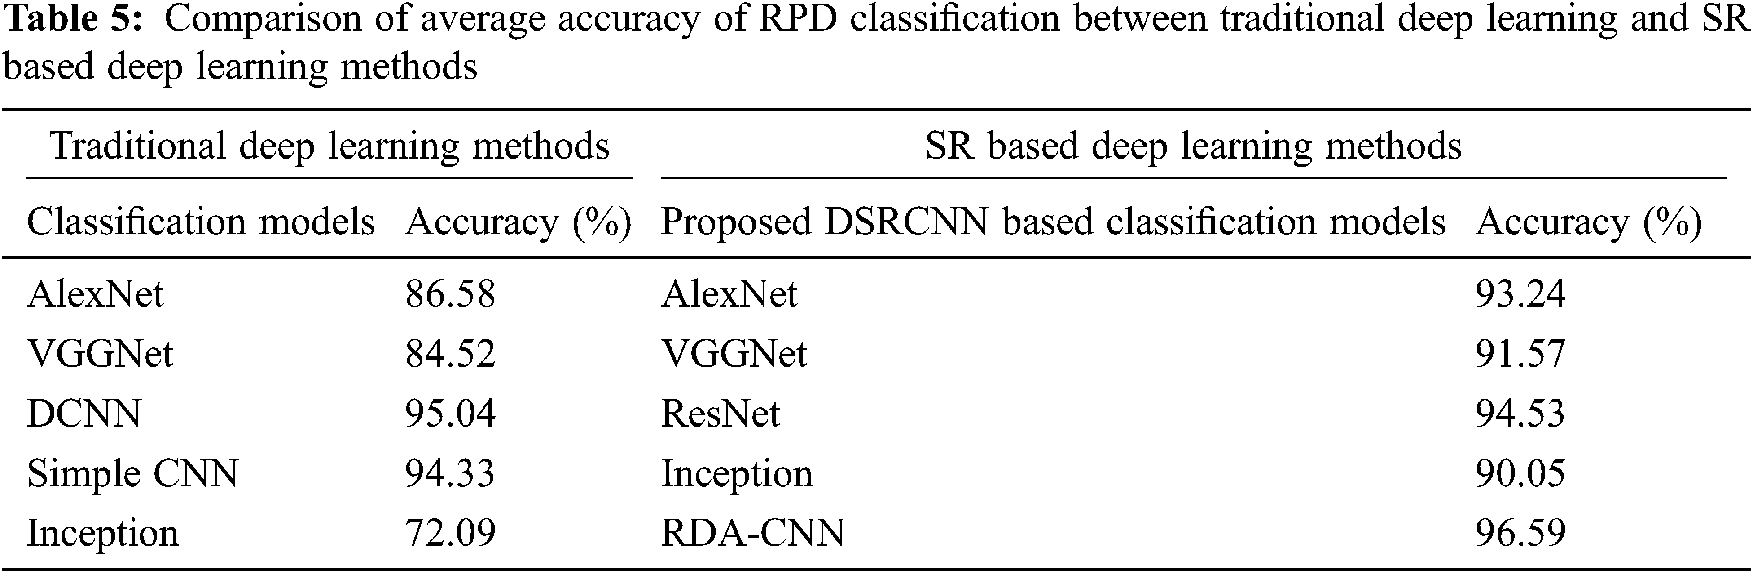
Subsequently, the integration of convolution based super-resolution layers before the traditional convolution layers shows better improvement in terms of classification accuracy results. Therefore, proposed RDA- CNN method motivates to use the super resolution layers prior to any CNN based network architectures (convolution layers) for automatic rice plant disease classification with detailed identification of disease global characteristics (lesions, spots, and rot so on). Finally, the performance of RDA-CNN with VGG19 architecture achieves the highest disease classification accuracy of 93.257% and thereby compares with the different deep learning architectures for automatic RPD classification.
This paper proposes and verifies the effective Reconstructed Disease Aware–Convolutional Neural Network (RDA- CNN) to accelerate the image-based plant disease classification in rice plants. First, RDA- CNN highlighted the importance of super-resolution layers to enhance the quality of the image. The results of super-resolution layers indicated that DSRCNN has significantly outperformed for the magnification scales of 2X, 3X and 4X in terms of various image quality assessments like MSE, PSNR and SSIM for all seven classes of rice diseases. Experimental analysis shows that the proposed DSRCNN can improve the PSNR value by 2%, SSIM value by 0.05% and similarly MSE value also reduced compared to conventional SR methods. Next, classification layers perform disease classification using ReCNN and results are compared with different CNN architectures. In addition, RDA-CNN outperforms with the average classification accuracy of 96.595% and thus helps the experts to detect lesions, discoloration, rust and spots and so on in earlier stages of the rice plants. These results indicate that the classification accuracy of generated super-resolution images can be significantly improved for the proposed network architecture. Although RDA-CNN has several advantages compared to baseline SR methods, application of proposed method to detect multiple diseases in a single leaf is still a limitation that needs redressal. In future, super-resolution algorithm can be integrated with object detection, segmentation of blobs etc. with pest identification applications for optimizing yield.
Funding Statement: The authors received no specific funding for this study.
Conflicts of Interest: The authors declare that they have no conflicts of interest to report regarding the present study.
1. Y. Lu, S. Yi, N. Zeng, Y. Liu and Y. Zhang, “Identification of rice diseases using deep convolutional neural networks,” Neurocomputing, vol. 267, pp. 378–384, 2017. [Google Scholar]
2. S. P. Mohanty, D. P. Hughes and M. Salathe, “Using deep learning for image-based plant disease detection,” Frontiers in Plant Science, vol. 7, pp. 1419, 2016. [Google Scholar]
3. K. P. Ferentinos, “Deep learning models for plant disease detection and diagnosis,” Computers and Electronics in Agriculture, vol. 145, pp. 311–318, 2018. [Google Scholar]
4. C. Dong, C. C. Loy, K. He and X. Tang, “Learning a deep convolutional network for image super-resolution,” in Proc. European Conf. on Computer Vision, Springer, Cham, United States, pp. 184–199, 2014. [Google Scholar]
5. J. Yang, J. Wright, S. T. Huang and Y. Ma, “Image super-resolution via sparse representation,” IEEE Transactions on Image Processing, vol. 19, no. 11, pp. 2861–2873, 2010. [Google Scholar]
6. D. Cai, K. Chen, Y. Qian and J. K. Kamarainen, “Convolutional low-resolution fine-grained classification,” Pattern Recognition Letters, vol. 119, pp. 166–171, 2019. [Google Scholar]
7. M. Koziarski and B. Cyganek, “Impact of low resolution on image recognition with deep neural networks: An experimental study,” International Journal of Applied Mathematics and Computer Science, vol. 28, no. 4, pp. 735–744, 2018. [Google Scholar]
8. L. Yue, H. Shen, J. Li, Q. Yuan, H. Zhang et al., “Image super-resolution: The techniques, applications, and future,” Signal Processing, vol. 128, pp. 389–408, 2016. [Google Scholar]
9. W. Yang, X. Zhang, Y. Tian, W. Wang, J. H. Xue et al., “Deep learning for single image super-resolution: A brief review,” IEEE Transactions on Multimedia, vol. 21, no. 12, pp. 3106–3121, 2019. [Google Scholar]
10. K. Yamamoto, T. Togami and N. Yamaguchi, “Super-resolution of plant disease images for the acceleration of image-based phenotyping and vigor diagnosis in agriculture,” Sensors, vol. 17, no. 11, pp. 2557, 2017. [Google Scholar]
11. J. Wen, Y. Shi, X. Zhou and Y. Xue, “Crop disease classification on inadequate low-resolution target images,” Sensors, vol. 20, no. 16, pp. 4601–1615, 2020. [Google Scholar]
12. Q. Dai, X. Cheng, Y. Qiao and Y. Zhang, “Crop leaf disease image super-resolution and identification with dual attention and topology fusion generative adversarial network,” IEEE Access, vol. 8, pp. 55724–55735, 2020. [Google Scholar]
13. Q. H. Cap, H. Tani, H. Uga, S. Kagiwada and H. Iyatomi, “Super-resolution for practical automated plant disease diagnosis system,” in Proc. 53rd Annual Conf. on Information Sciences and Systems, MD, USA, pp. 1–6, 2019. [Google Scholar]
14. M. Sharma and L. Vig, “Automatic classification of low-resolution chromosomal images,” in Proc. 15th European Conf. on Computer Vision, Munich, Germany, pp. 1–14, 2018. [Google Scholar]
15. X. Huang, Y. Jiang, X. Liu, H. Xu, Z. Han et al., “Machine learning based single-frame super-resolution processing for lensless blood cell counting,” Sensors, vol. 16, no. 11, pp. 1836, 2016. [Google Scholar]
16. K. Umehara, J. Ota and T. Ishida, “Application of super-resolution convolutional neural network for enhancing image resolution in chest CT,” Journal of Digital Imaging, vol. 31, no. 4, pp. 441–450, 2018. [Google Scholar]
17. H. Ji, Z. Gao, T. Mei and B. Ramesh, “Vehicle detection in remote sensing images leveraging on simultaneous super-resolution,” IEEE Geoscience and Remote Sensing Letters, vol. 17, no. 4, pp. 676–680, 2019. [Google Scholar]
18. Y. Yue, X. Cheng, D. Zhang, Y. Wu, Y. Zhao et al., “Deep recursive super resolution network with laplacian pyramid for better agricultural pest surveillance and detection,” Computers and Electronics in Agriculture, vol. 150, pp. 26–32, 2018. [Google Scholar]
19. Q. Dai, X. Cheng, Y. Qiao and Y. Zhang, “Agricultural pest super-resolution and identification with attention enhanced residual and dense fusion generative and adversarial network,”, IEEE Access, vol. 8, pp. 81943–81959, 2020. [Google Scholar]
20. C. Ledig, L. Theis, F. Huszar, J. Caballero, A. Cunningham et al., “Photo-realistic single image super-resolution using a generative adversarial network,” in Proc. Computer Vision and Pattern Recognition, IEEE, Honolulu, HI, USA, pp. 4681–4690, 2017. [Google Scholar]
21. Q. H. Cap, H. Tani, H. Uga, S. Kagiwada and H. Iyatomi, “LASSR: Effective super-resolution method for plant disease diagnosis,” Computers and Electronics in Agriculture, vol. 187, pp. 106271–106284, 2021. [Google Scholar]
22. M. Brahimi, M. Arsenovic, S. Laraba, S. Sladojevic, K. Boukhalfa et al., “Deep learning for plant diseases: Detection and saliency map visualization,” in Proc. Human and Machine Learning, Springer, Cham, United States, pp. 93–117, 2018. [Google Scholar]
23. M. G. Selvaraj, A. Vergara, H. Ruiz, N. Safari, S. Elayabalan et al., “AI-Powered banana diseases and pest detection,” Plant Methods, vol. 15, no. 1, pp. 1–11, 2019. [Google Scholar]
24. X. E. Pantazi, D. Moshou and A. A. Tamouridou, “Automated leaf disease detection in different crop species through image features analysis and one class classifiers,” Computers and Electronics in Agriculture, vol. 156, pp. 96–104, 2019. [Google Scholar]
25. W. J. Liang, H. Zhang, G. F. Zhang and H. X. Cao, “Rice blast disease recognition using a deep convolutional neural network,” Scientific Reports, vol. 9, no. 1, pp. 1–10, 2019. [Google Scholar]
26. C. R. Rahman, P. S. Arko, M. E. Ali, M. A. Iqbal Khan, S. H. Apon et al., “Identification and recognition of rice diseases and pests using convolutional neural networks,” Biosystems Engineering, vol. 194, pp. 112–120, 2020. [Google Scholar]
27. M. Arsenovic, M. Karanovic, S. Sladojevic, A. Anderla and D. Stefanovic, “Solving current limitations of deep learning-based approaches for plant disease detection,” Symmetry, vol. 11, no. 7, pp. 939, 2019. [Google Scholar]
28. J. Chen, D. Zhang, Y. A. Nanehkaran and D. Li, “Detection of rice plant diseases based on deep transfer learning,” Journal of the Science of Food and Agriculture, vol. 100, no. 7, pp. 3246–3256, 2020. [Google Scholar]
29. P. K. Sethy, N. K. Barpanda, A. K. Rath and S. K. Behera, “Deep feature-based rice leaf disease identification using support vector machine,” Computers and Electronics in Agriculture, vol. 175, pp. 105527, 2020. [Google Scholar]
30. H. B. Prajapati, J. P. Shah and V. K. Dabhi, “Detection and classification of rice plant diseases,” Intelligent Decision Technologies, vol. 11, no. 3, pp. 357–373, 2017. [Google Scholar]
 | This work is licensed under a Creative Commons Attribution 4.0 International License, which permits unrestricted use, distribution, and reproduction in any medium, provided the original work is properly cited. |