DOI:10.32604/csse.2022.021645
| Computer Systems Science & Engineering DOI:10.32604/csse.2022.021645 | |
| Article |
Covid-19’s Pandemic Relationship to Saudi Arabia’s Weather Using Statistical Analysis and GIS
1GIS Department, Faculty of Social Sciences, Jeddah University, Jeddah, Saudi Arabia
2School of Survey, Faculty of Engineering, Sudan University of Science and Technology, Khartoum, Sudan
*Corresponding Author: Ranya Fadlalla Elsheikh. Email: rfelshiekh@uj.edu.sa
Received: 09 July 2021; Accepted: 09 August 2021
Abstract: The eruption of the novel Covid-19 has changed the socio-economic conditions of the world. The escalating number of infections and deaths seriously threatened human health when it became a pandemic from an epidemic. It developed into an alarming situation when the World Health Organization (WHO) declared a health emergency in MARCH 2020. The geographic settings and weather conditions are systematically linked to the spread of the epidemic. The concentration of population and weather attributes remains vital to study a pandemic such as Covid-19. The current work aims to explore the relationship of the population, weather conditions (humidity and temperature) with the reported novel Covid-19 cases in the Kingdom of Saudi Arabia (KSA). For the study, the data for the reported Covid-19 cases was secured from 11 March 2020, to 21 July 2020 (132 days) from the 13 provinces of KSA. The Governorate level data was used to estimate the population data. A Geographic information system (GIS) analysis was utilised to visualise the relationship. The results suggested that a significant correlation existed between the population and Covid-19 cases. For the weather conditions, the data for the 13 provinces of KSA for the same period was utilised to estimate the relationship between the weather conditions and Covid-19 cases. Spearman’s rank correlation results confirmed that the humidity was significantly linked with the reported cases of Covid-19 in Makkah, Aseer, Najran, and Al Baha provinces. The temperature had a significant relation with the reported Covid-19 cases in Al-Riyad, Makkah, Al-Madinah, Aseer, Najran, and Al-Baha. The inconsistency of the results highlighted the variant behavior of Covid-19 in different regions of the KSA. More exploration is required beyond the weather-related variables. Suggestions for future research and policy direction are offered at the end of the study.
Keywords: Covid-19; GIS; temperature; spearman correlation; humidity; Saudi Arabia
In January 2020, the Director-General of the World Health Organization (WHO) declared the outbreak of Covid-19 to be a public health emergency of international concern and issued a set of temporary recommendations [1]. WHO confirmed that a novel coronavirus was culpable for respiratory syndrome in a group of people in the city of Wuhan, Hubei in China, which was reported to the WHO in December 2019 [1,2]. The case-fatality ratio for Covid-19 and its transmission has been significantly more prominent, with a significant total death toll. Covid-19 became a pandemic and the fastest spreading infection harming more than 20,000,000 people resulting in thousands of deaths worldwide [3].
A pandemic such as Corona hinders global developments, as the accelerated urbanisation and amplified concentration of population increases the complexity and changes within the infections [3,4]. The shortage of health facilities meant the medical authorities were unable to match the spread of the pandemic [5]. The interaction of the general public and the shortage of health workers were considered the primary cause of the increase in reported Covid-19 cases worldwide [4,5]. Furthermore, the general public and geographic conditions prompted increased movement that posed the threat of Covid-19 [3].
With GIS technology, the information system empowers spatial analysis and excellent mapping tools to understand the epidemic map analysis [6]. GIS is a critical tool to track and evaluate the association between population concentration and the spread of the epidemic [7]. GIS has been utilised to understand the spread of cholera, a waterborne disease, etc. Generally, the viruses originated from animals and are transmitted to humans [6,7]. The weather conditions such as temperature and humidity also impact the spread of pandemics like Covid-19 [7,8]. Weather conditions facilitate the reproduction and spread of viruses, which can lead to the cause of severe health conditions of the general public [9,10]. Previous literature reported an inconsistent relationship between temperature and Covid-19 reported cases [11]. The humidity also significantly affects the spread and mortality caused by the viruses [8–10].
Till now, in the Kingdom of Saudi Arabia (KSA), health officials registered 2,00,000 cases, with more than 3000 deaths [5]. The government responded briskly, and in February 2020, the government set forth temporary deferment in the Holy sites of Muslims in Mecca and Medina as a precautionary measure [5,12]. The repatriation of Saudi citizens from foreign countries and quarantining them for a certain period was implemented [11]. Curfews were implemented in the cities of Al-Riyad, Tabouk, Jaddah, Taif with restricted movement [5]. Socioeconomic situations were drastically reduced. The pandemic created a prudent spending culture in Saudi Arabia, and the transport was halted with schools and universities closed for an undefined period as took place in other parts of the world [12].
Saudi Arabia Vision 2030 is a programme that plans to reduce the dependence of Saudi Arabia on oil sales, diversify its economy, and move the wheels of public service sectors such as education, tourism, infrastructure, and health towards sustainability and progress [13]. The public sector will promote preventive care by reducing infectious diseases and providing a healthy life for all, aiming to end all communicable diseases by 2030 [5,13]. Covid-19 will restrict the goals mentioned above to achieve better health conditions in KSA and affect the realisation of social and economic development objectives. The Saudi government has taken many important decisions to confront the economic recession [5].
Geographic information systems (GIS) have played a vital role in determining the relationship between the geographic information of the region, and this current contagion [14]. The greater the reproduction values for the virus, the greater the infected geographic area [15]. Hence, weather conditions and population affect the virus reproduction value [14,15]. Weather variables, including temperature and humidity, directly relate to the Covid-19 reproduction and infection rate [16–18]. Meteorological parameters, GIS, and population affect the disease cases, social media reaction to disease spread, and its upward movement of trajectories help shape the response to tackling the epidemic [18–22]. Epidemiologists are taking a keen interest in the climatic variables that may influence the epidemic, such as severe acute respiratory syndrome coronavirus 2 (SARS-2) and other infections [14,23–26].
The influenza virus grows more rapidly in the cold when humidity and air-speed decrease, as well as in winter which causes the spread of respiratory diseases [9,10]. The influenza-like diseases have high transmission and are rapidly spread by the air and human touch. Increased reproduction values of respiratory diseases cause the spread and greater mortality in many cases [10,17]. The population and weather conditions require exploration to understand the spread of the virus in recent times.
The current study aims to analyse the relationship of the Covid-19 pandemic reported cases with the population and weather parameters (i.e., temperature and humidity) at the regional level of KSA. Unlike other studies, the study period was long (11th March 2020, to 21st July 2020). The average temperature (°C) and the average humidity (%) were considered as weather parameters, and population infection maps were created. GIS was utilised for visualisation and mapping of the study results.
Saudi Arabia is the largest country in the Arabian Peninsula and the second-largest in the Arab world. The KSA is divided into 13 administrative regions. Each region is further divided into many Governorates, the number of which varies from one province to another.
For the study, data from 11th March 2020, to 21st July 2020, in each Saudi Arabia Province were collected, including daily confirmed cases of Covid-19 from the Saudi Arabian official website of the Ministry of Health. The daily average temperature (°C) and the average humidity (%) level were obtained from the General Authority of Meteorology and Environmental Protection in Jeddah. Population data of the 13 administrative regions were collected from the General Authority for Statistics.
The data was not normally distributed. Therefore, the Spearman rank correlation test was employed to examine the relationship between the accumulated infection cases of Covid-19 from the first cases till 5th June 2020, and the population of 118 Governorates. GIS helped to illustrate the relationship in maps. GIS offers the opportunity to use spatial data. Spearman's rank correlation coefficient was adopted to determine the correlation between the other variables. The following equation was utilised to calculate the coefficient.
where: ‘di’ is the difference between the two ranks of each observation, ‘n’ represents the number of observations.
The significance of the relationship was tested using the following equation.
The rank coefficient measures the degree of similarity between the rankings of the variables under study. Rank correlation suits the data with non-normality to detect the strength and direction of the relationship between variables with a significance level.
3.1 Population Density and Covid-19 Cases
In Saudi Arabia, Covid-19 has taken over three thousand lives and more than two hundred thousand cases registered by health officials [5]. GIS and geo-spatial data were used to visualise and analyse the ground realities and epidemiological phenomenon, instances of infected Covid-19 from the first case till 5th June 2020, and the population diffusion in 2016 of 118 Governorates as depicted in Fig. 1. The high-density areas are highlighted with red and the highest number of cases reported indicated, such as Al-Riyadh. The yellow colour area shows the mild effect of the epidemic in that region due to low population density. Riyadh, Jeddah, Makkah Al Mokerma, and AlMadina are the most crowded cities. The highest number of cases was registered in Al-Riyadh that followed by Makkah Al Mokerma, Jeddah, and AlMadina, respectively. At the same time, Ash-Shimasiyahan Al-Kharkhir was the least crowded and had zero cases till the particular date. As expected from the map visualisation and results of the Spearman correlation (Fig. 2), there was a significant positive association between the population of each region and the number of its cases (r = 0.66, p < .001). It illustrated that an increased population in a Governorate had a greater chances of increased registered Covid-19 cases.
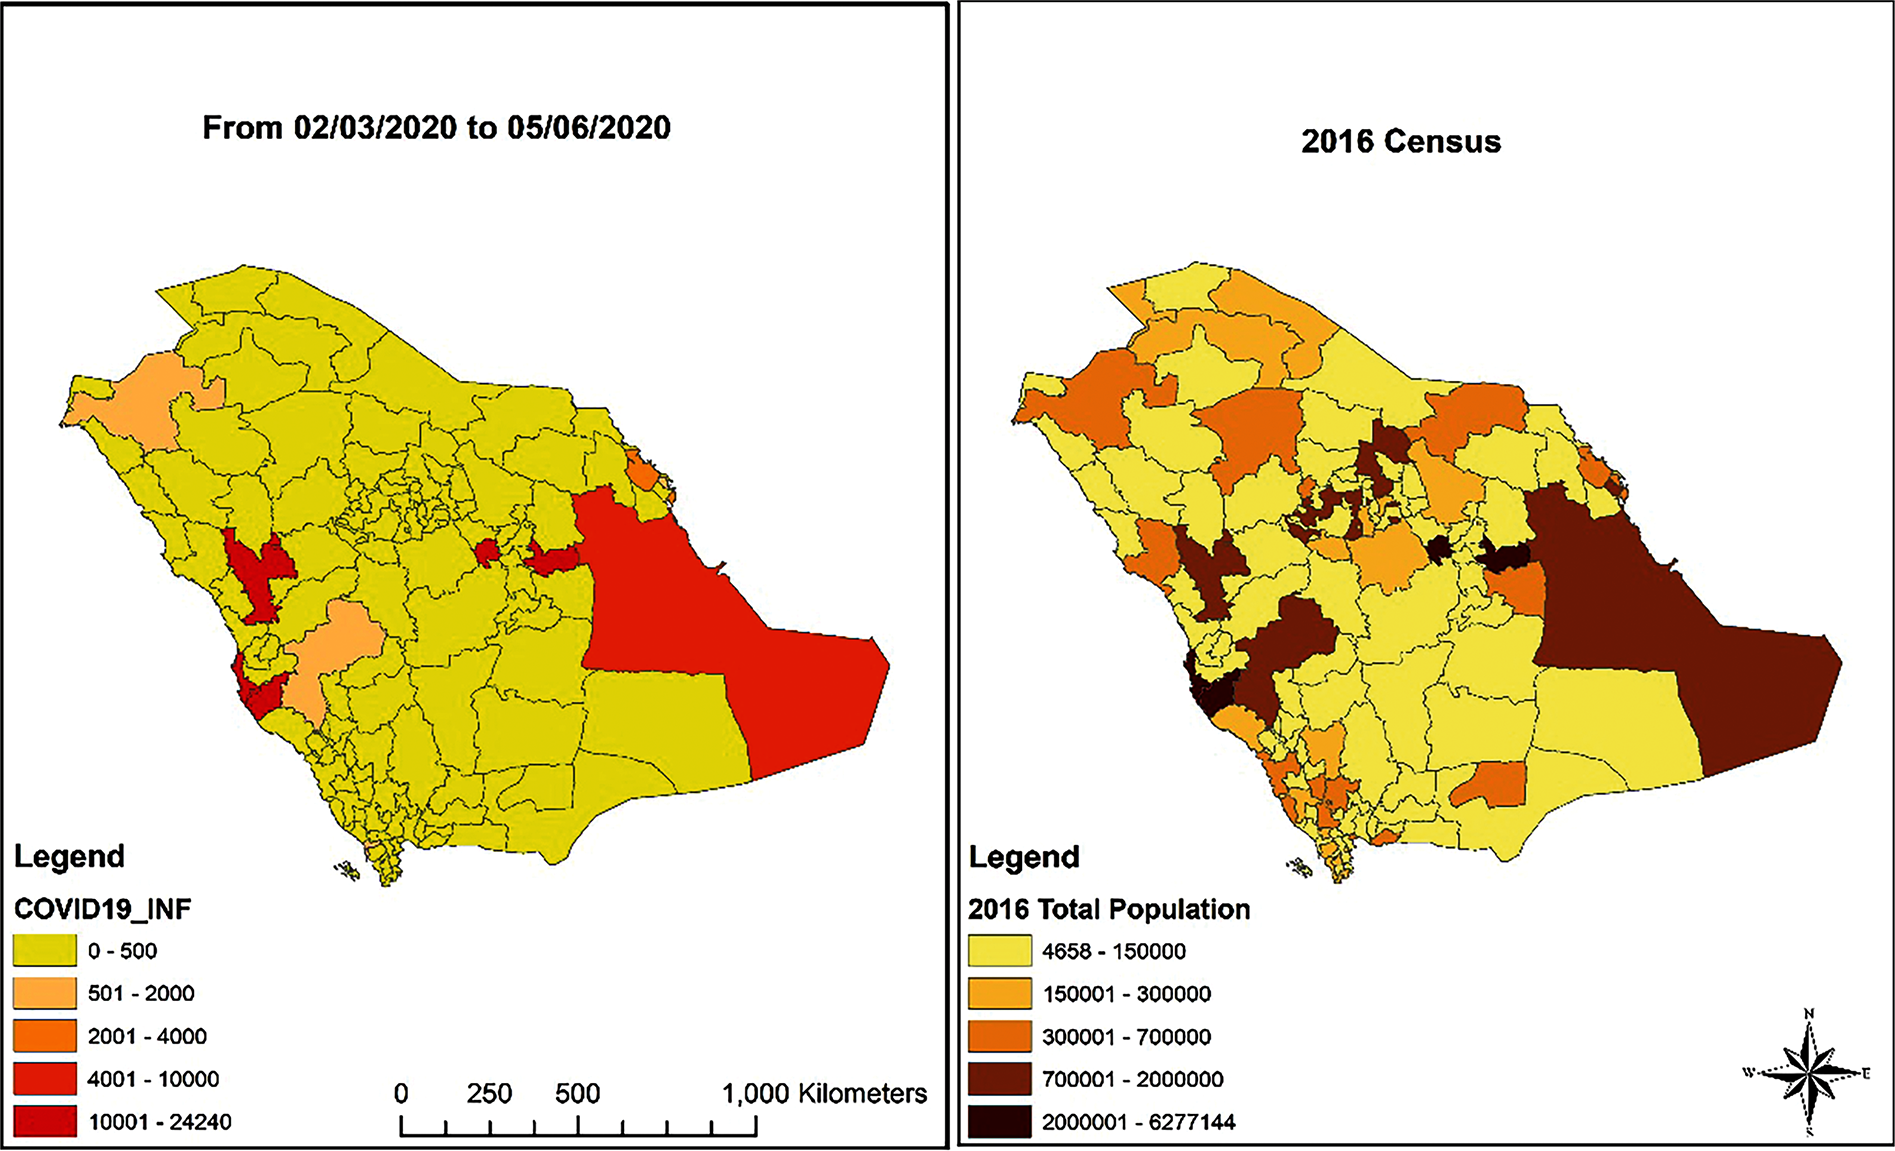
Figure 1: Population vs. Covid-19 infections (KSA)
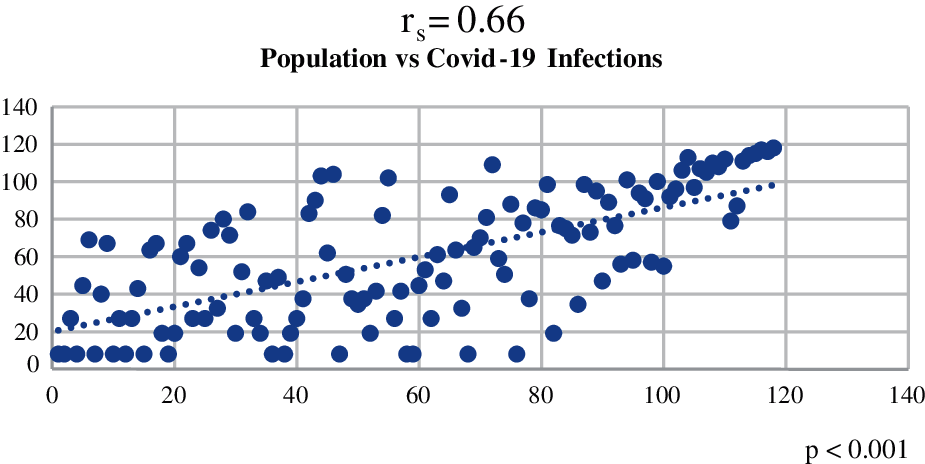
Figure 2: Relationship between the population and number of Covid cases considering 118 governorates
3.2 Weather Condition and Reported Cases of Covid-19
The daily infected cases of Covid-19 and weather variables data were collected for 132 days. The Spearman rank correlation coefficient was calculated at the province level for the other variables, as shown in Fig. 3 (average humidity and average temperature per day). Tab. 1 shows that among 13 provinces, the temperature average (°C) was significantly positively correlated with Covid-19 in five Provinces (Riyadh, Mecca Al Mokerma, Jeddah, and AlMadina, Najran and Albaha). In contrast, the humidity average (%) was significantly negatively correlated with Covid-19 in Najran and Albaha (p < .001). The graphical representation clearly reliability depicted the research results, proved the inverse proportion of temperature and humidity, and directly related the population density and Covid-19 cases in the crowded cities.
The result of the Spearman rank correlation coefficient for humidity and reported cases of Covid-19 in Al-Riyad showed (r = −0.048, p = 0.978) an insignificant negative correlation between the humidity and Covid-19 cases. The results suggested no significant correlation between the humidity and registered cases of Covid-19. Otherwise, the temperature and reported cases of Covid-19 had a positive significant Spearman rank correlation (r = 0.575, p = 0.000). The results highlight the change in temperature change was positively linked with the recorded number of cases of Covid-19 in Al-Riyad, as shown in Tab. 1.
The analysis of the spearman rank correlation coefficient for humidity and Covid-19 cases reported in Mecca indicated (r = 0.463, p = 0.015) a positive but significant correlation between the humidity and the reported cases of Covid-19. It showed a significant positive association between the change in humidity and the reported case of Covid-19. Likewise, the temperature and reported Covid-19 cases (r = 0.460, p = 0.016) indicated a significant positive association with each other. The result exhibited a direct relationship of Covid-19 with the temperature change, as revealed in Tab. 1.
The Spearman rank correlation coefficient for humidity and the reported cases of Covid-19 in AlMadina displayed (r = 0.307, p = 0.465) a positive but insignificant correlation between the humidity and the Covid-19 cases in Al-Madina. Similarly, the temperature and reported Covid-19 cases had (r = 0.540, p = 0.027) a significantly positive Spearman rank correlation. The result disclosed that the temperature variance affected the number of Covid-19 cases, as shown in Tab. 1.
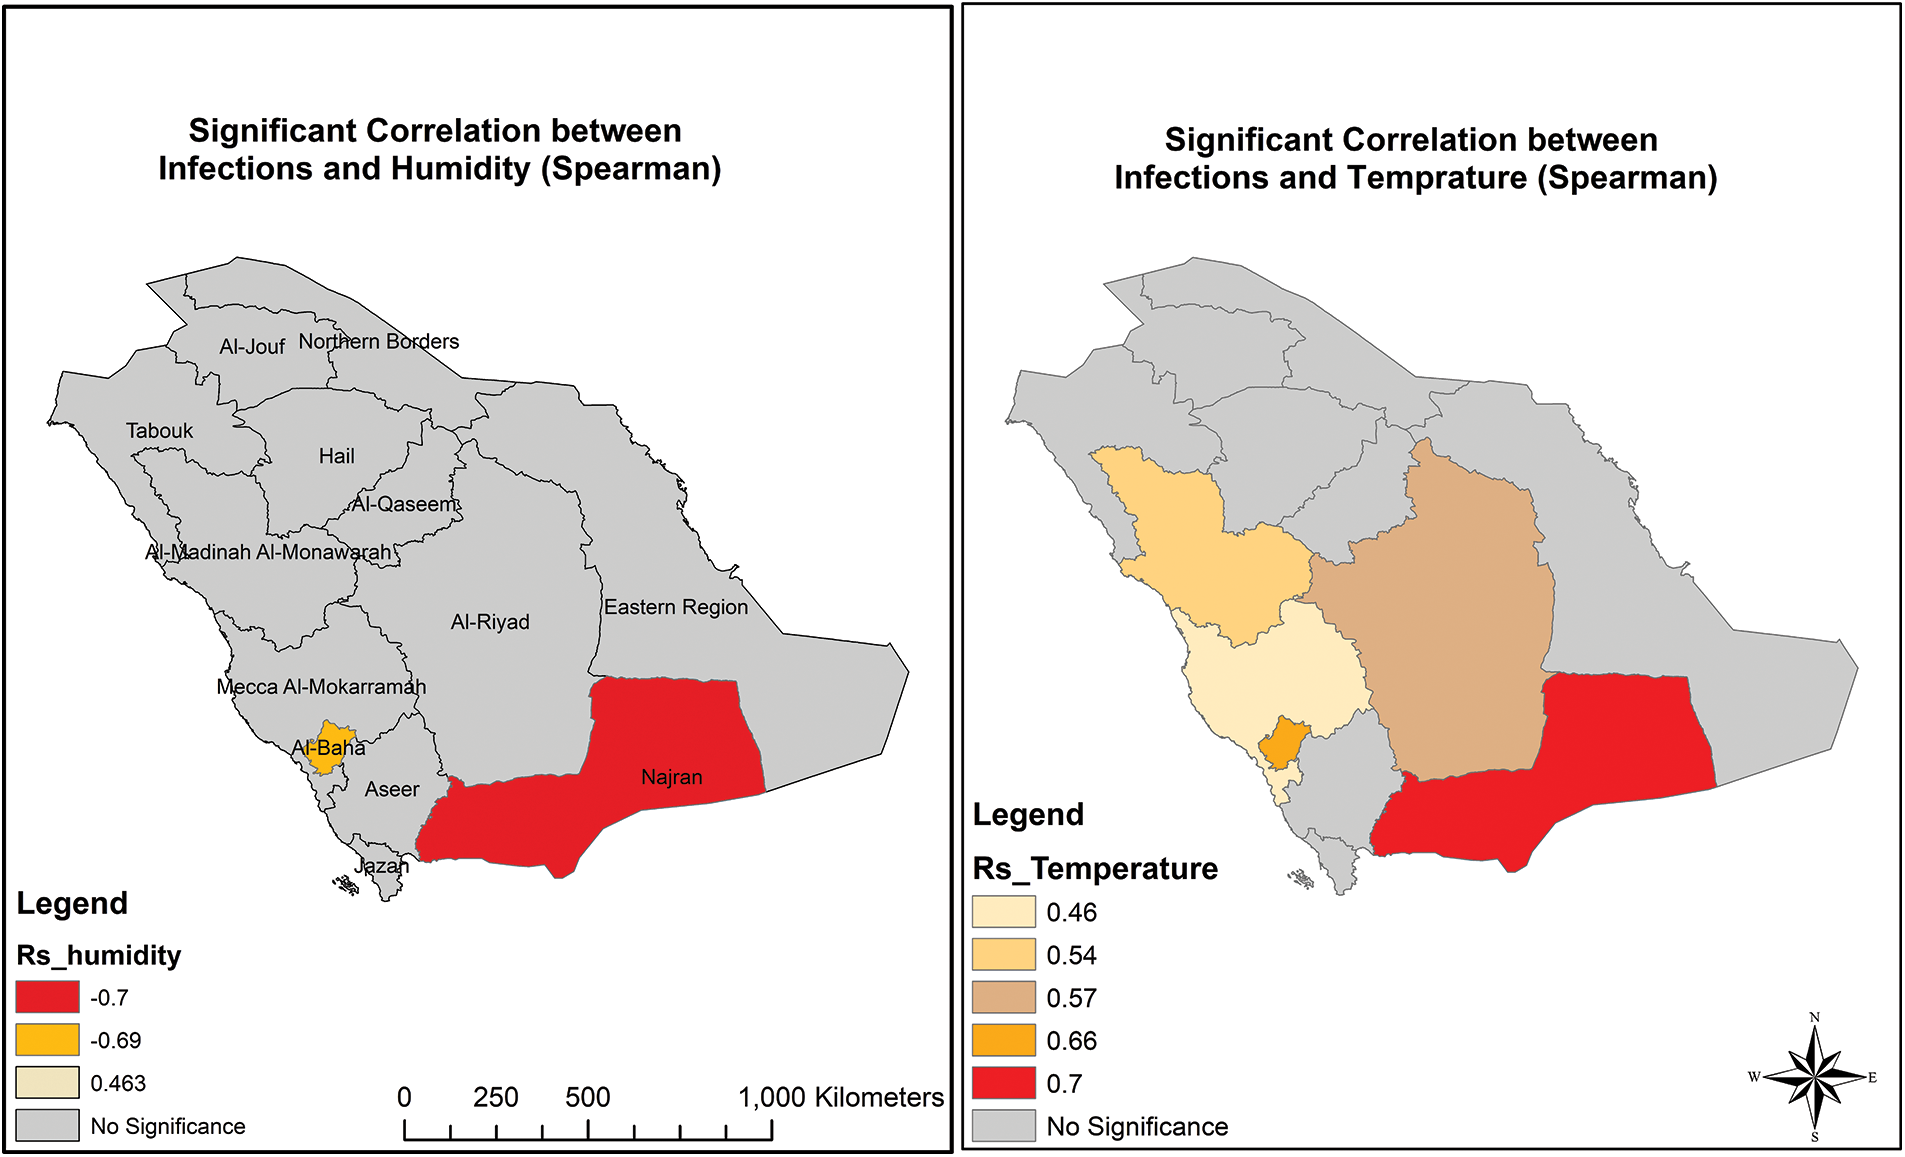
Figure 3: Humidity/temperature vs. Covid-19 infections (KAS)
The Spearman rank correlation coefficient for humidity and the reported cases of Covid-19 in Al-Qaseem showed (r = −0.412, p = 0.192) a negative and insignificant correlation between the humidity and the Covid-19 cases reported in the state. Then, the temperature and reported cases for Covid-19 had a positive insignificant Spearman rank correlation (r = 0.352, p = 0.340). The results highlighted the rise of temperature was positively linked with the reported number of cases of Covid-19 in Al-Qaseem as indicated in Tab. 1.

The humidity analysis and the reported number of cases of Covid-19 in the Eastern region showed a Spearman rank correlation of (r = −0.437, p = 0.143) that depicted an insignificant negative correlation between the humidity and the Covid-19 cases. Correspondingly, the temperature and reported Covid-19 cases had a positive significant Spearman rank correlation (r = 0.371, p = 0.290) that displayed the temperature positively associated with the registered number of cases in the Eastern region as shown in Tab. 1.
The Spearman’s rank correlation coefficient for humidity and Covid-19 reported the number of cases in Aseer showed (r = −0.065, p = 0.000) as a negative and significant correlation between the humidity and the reported Covid-19 cases. Contrarily, the temperature and reported Covid-19 cases had a positive significant Spearman rank correlation (r = 0.661, p = 0.001) and the result led to the fact that the temperature was positively related to the reported number of cases in Aseer, as shown in Tab. 1, Figs. 4, and 5.
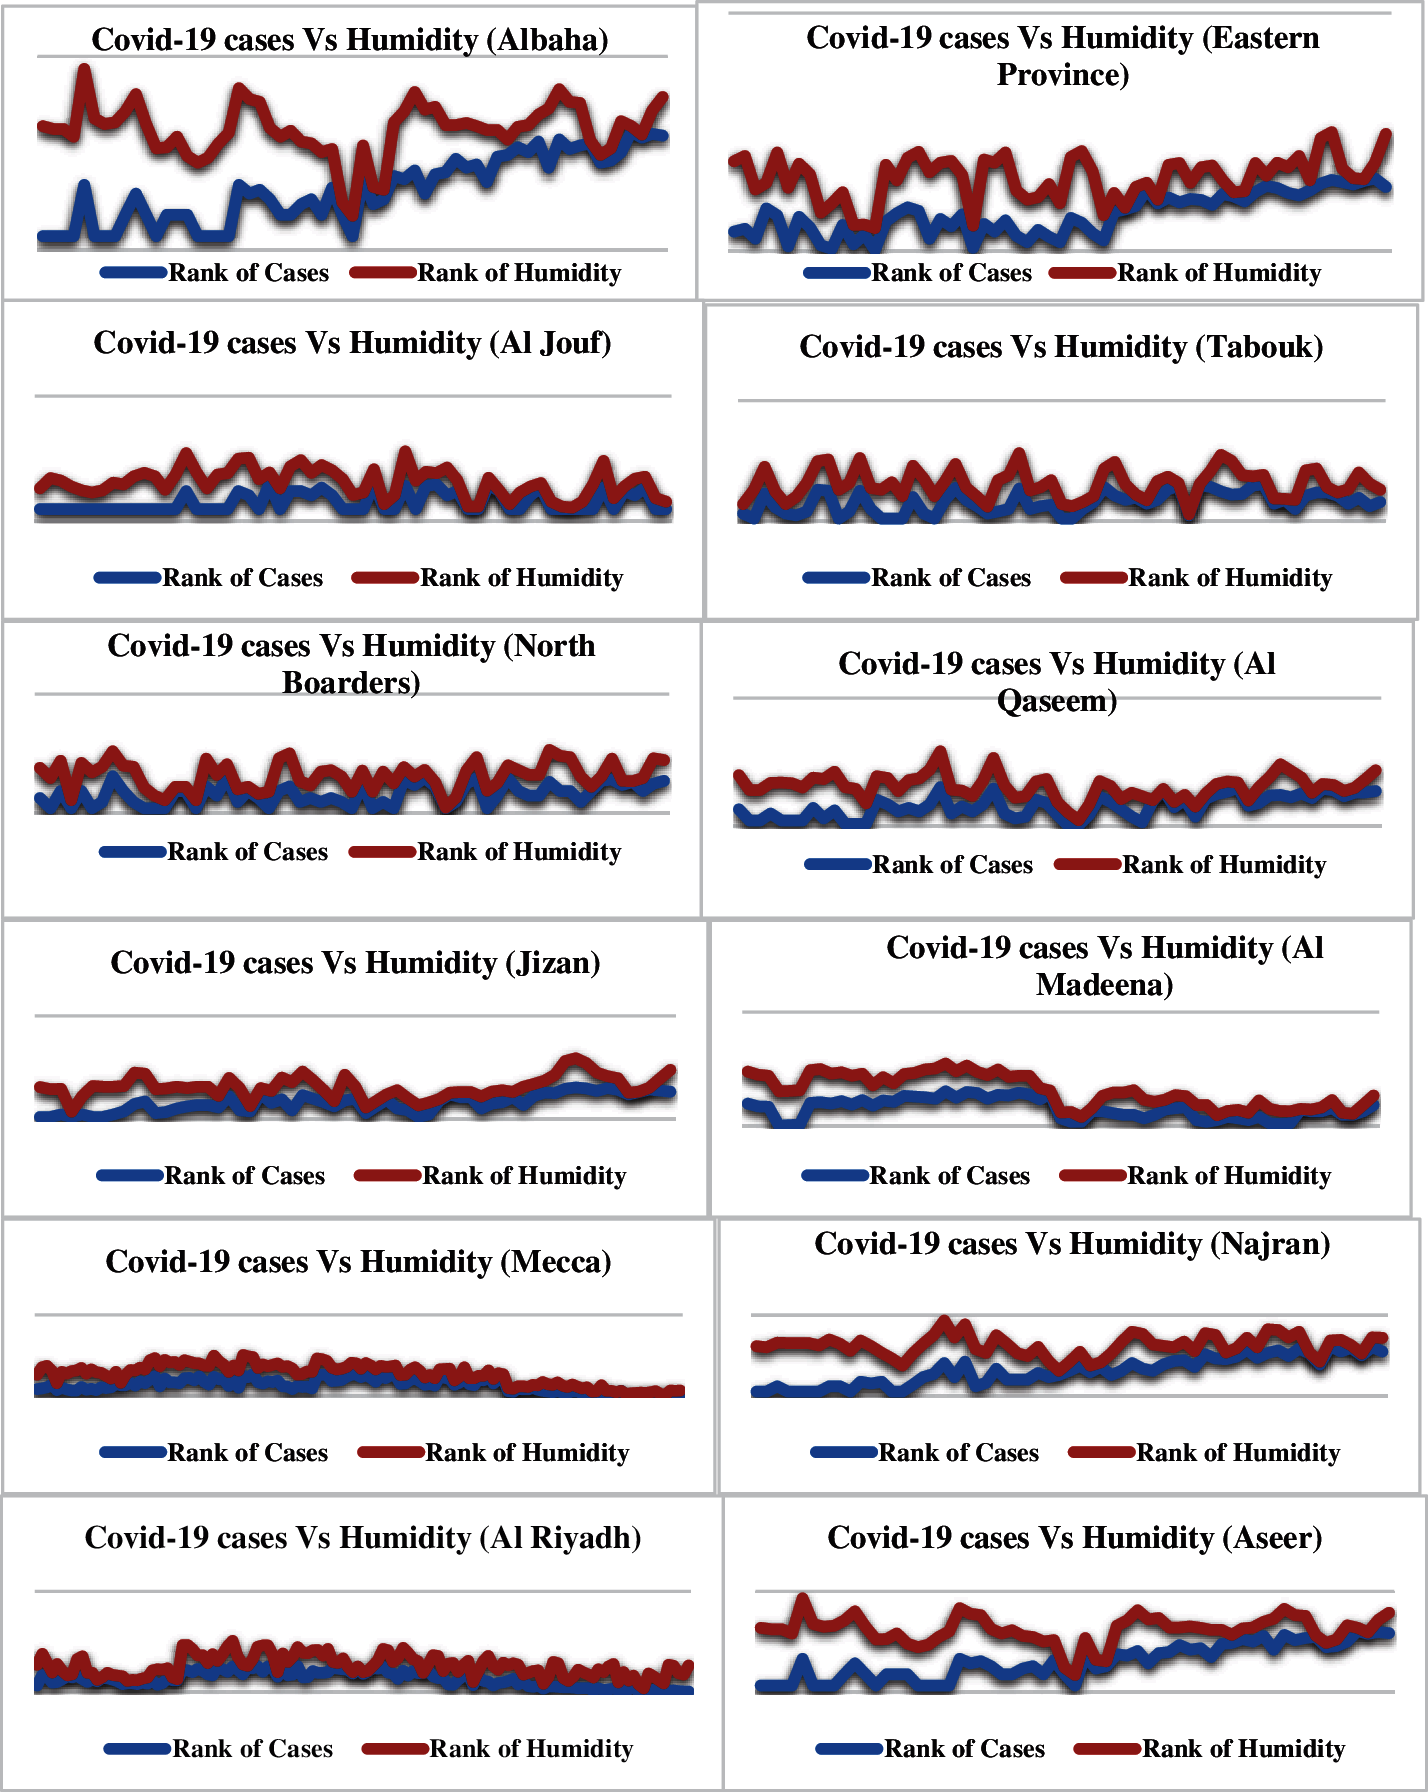
Figure 4: Humidity vs. Covid-19 infections (KSA)
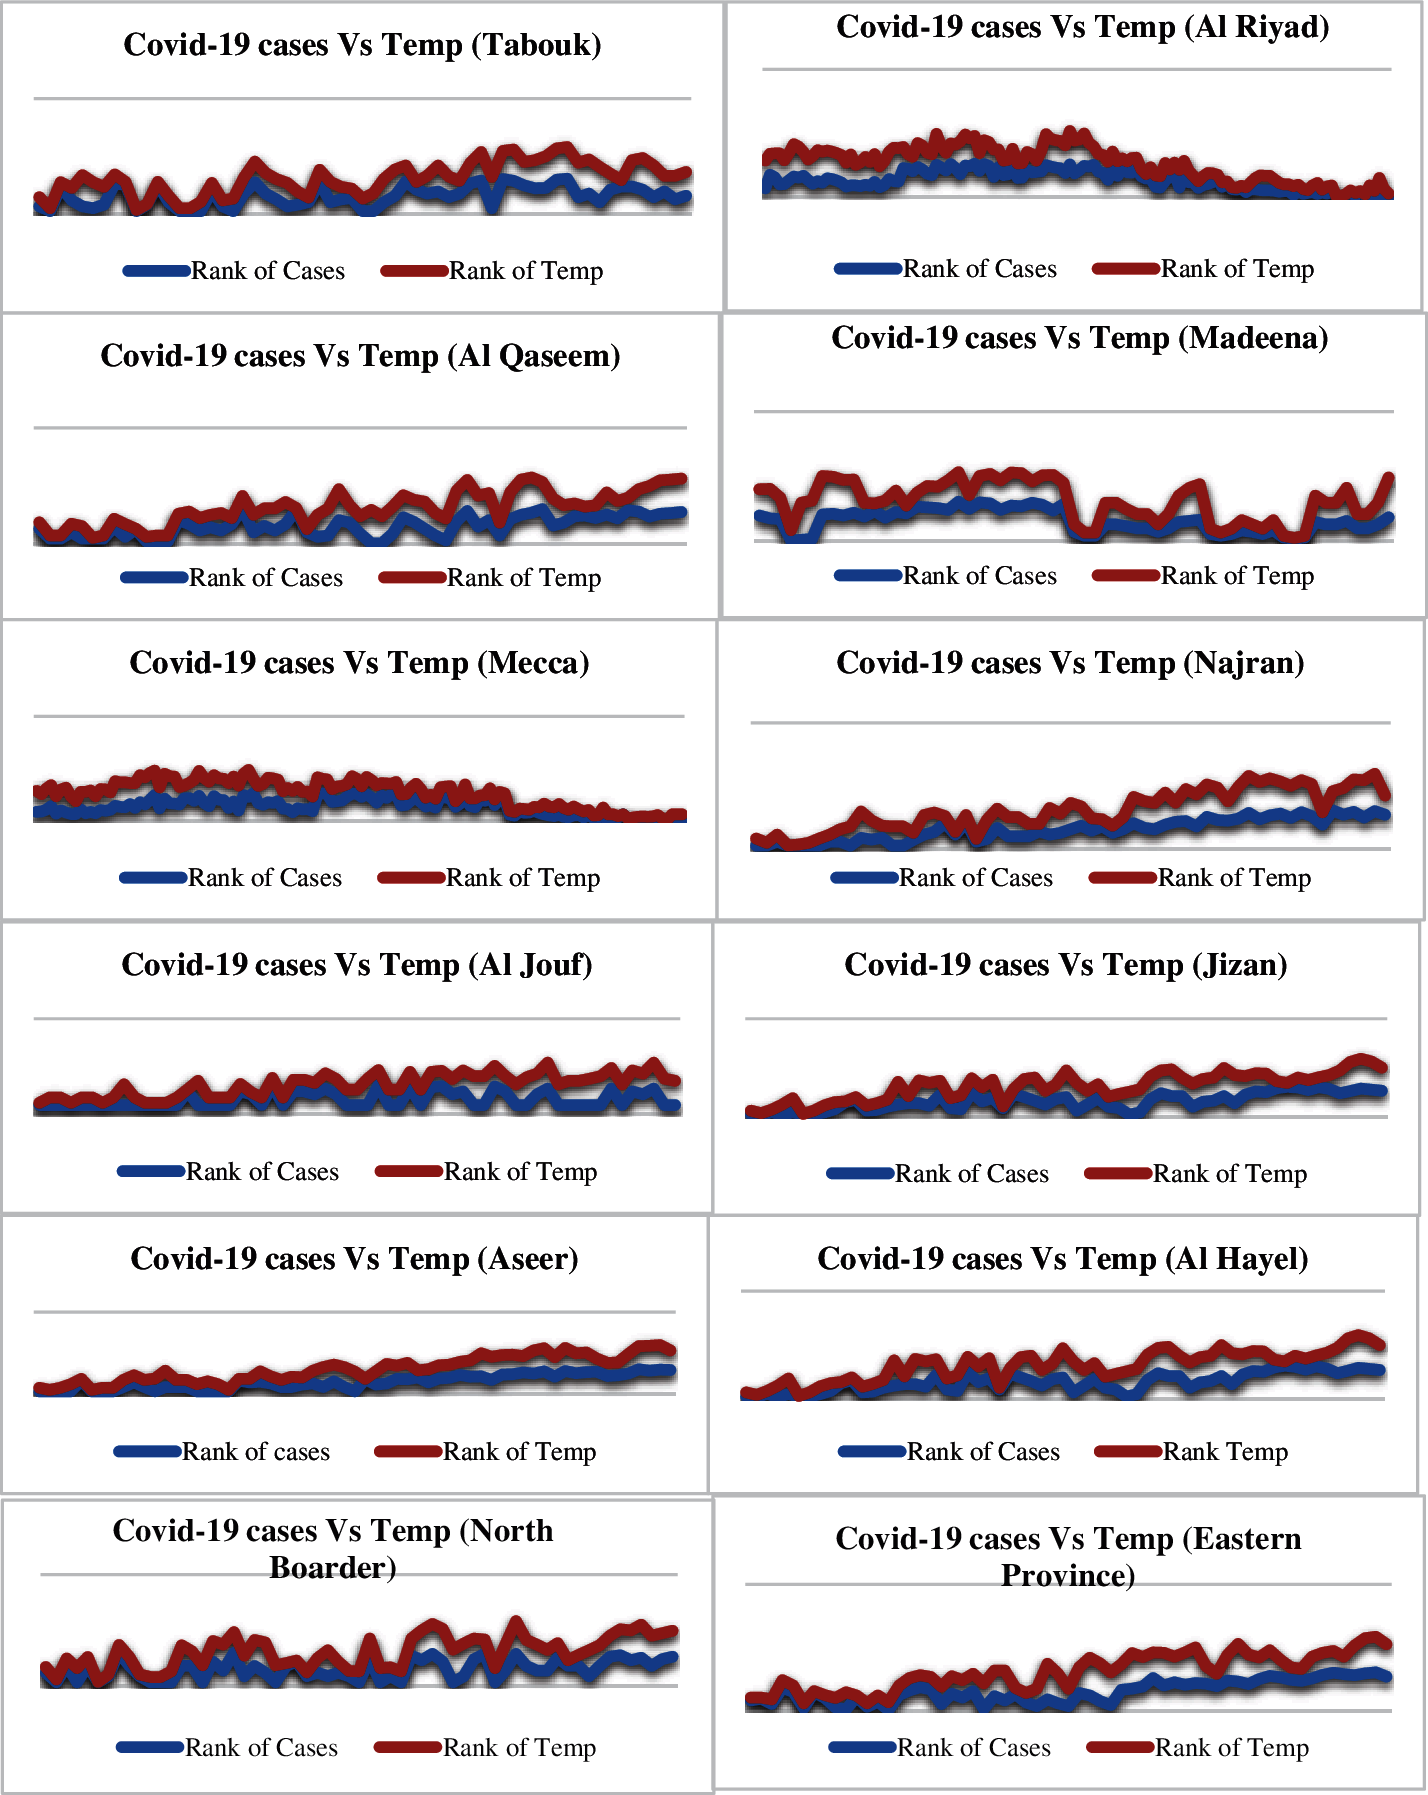
Figure 5: Temp vs. Covid-19 infections (KSA)
The result of the Spearman rank correlation coefficient for humidity and the reported number of cases of Covid-19 in Tabouk illustrated (r = −0.070, p = 0.969) as a negatively insignificant correlation between the humidity and the Covid-19 cases. However, the temperature and reported Covid-19 cases had a positive significant Spearman rank correlation (r = 0.286, p = 0.528) and the results indicated that temperature and reported Covid-19 cases correlated in Tabouk, as clearly shown in Tab. 1.
The result of the Spearman rank correlation coefficient for humidity and the reported number of Covid-19 cases in Hail showed (r = −.267, p = 0.581) a negatively insignificant correlation between the humidity and the Covid-19 cases. On the other hand, the temperature and reported Covid-19 cases had a positive significant Spearman rank correlation (r = 0.319, p = 0.432) and the result expressed that temperature showed many relations with the reported number of cases in Hail as shown in Tab. 1.
The Spearman rank correlation coefficient for humidity and the reported number of Covid-19 cases in the Northern Borders showed (r = −0.108, p = 0.972) a negatively insignificant correlation between the humidity and the Covid-19 cases. Contrarily, the reported temperature and reported Covid-19 cases had a positive significant Spearman rank correlation (r = 0.359, p = 0.319) and the result pinpointed the temperature association with the rising number Covid-19 reported cases in the Northern Borders as seen in Tab. 1.
The result of the Spearman rank correlation coefficient for humidity and the reported number of Covid-19 cases in Jazan showed (r = −0.267, p = 0.581) a negatively insignificant correlation between the humidity and the Covid-19 cases. The reported temperature and reported Covid-19 cases had a positive significant Spearman rank correlation (r = 0.319, p = 0.432) and the result hit the temperature connection with the registered number of Covid-19 cases in Jazan as depicted in Tab. 1.
The Spearman rank correlation coefficient for humidity and the reported number of cases of Covid-19 in Najran showed (r = −0.740, p = 0.000) a negatively significant correlation between the humidity and the Covid-19 cases. The reported temperature and reported Covid-19 cases had a positive significant Spearman rank correlation (r = 0.705, p = 0.000) and the result highlighted that the temperature change affected the reported Covid-19 cases in Najran, as shown in Tab. 1.
The Spearman rank correlation coefficient for humidity and the reported number of Covid-19 cases in Al-Baha showed (r = −0.693, p = 0.000) a negatively significant correlation between the humidity and the Covid-19 cases. Further, the reported temperature and reported Covid-19 cases had a positive significant Spearman rank correlation (r = 0.661, p = 0.001) and the result showed that the temperature change was related to the reported cases of Covid-19 in Al-Baha as seen in Tab. 1.
The result of the Spearman rank correlation coefficient for humidity and the reported number of Covid-19 cases in Al-Jouf showed (r = −0.075, p = 0.965) a negatively insignificant correlation between the humidity and the Covid-19 cases. Correspondingly, the temperature and reported Covid-19 cases had a positive insignificant Spearman rank correlation (r = 0.067, p = 0.971) and the result revealed that the temperature change had no significant relation with the Covid-19 cases in Al-Jouf as seen in Tab. 1.
The study illustrates the effects of three types of variables on Covid-19 cases, namely population density, average humidity, and average temperature. The regions considered were all 13 provinces in KSA, which included 118 Governorates. The growth rate of cases was observed over 132 days. One of the significant factors that greatly influenced the epidemic was the density of the area. The highly crowded cities of Saudi Arabia were highly infected due to their dense population. Al-Riyad, the highly infected region shown on the map, had a high number of Covid-19 cases. A GIS tool was utilised to illustrate the study results. Geospatial data indicated that the higher the population rate the higher the ratio of Covid-19 cases in the study area [22,25]. Population movement was also a significant factor in virus transmission. The concentration of population was significant for the spread of Covid-19.
Humidity affected viral transmission in three ways including droplet size. Viral-loaded aerosols float for hours, and the virus stays on the landing surfaces [20,21,23]. In humid places, the Covid-19 grows and drops faster, providing fewer chances for others to breathe in the infectious viral droplets. In the dry indoors, air microdroplets become lighter and stay adrift which forms an optimal route for viruses to be inhaled by others or to settle on surfaces where they can last for a long time [21,23,26]. Study results offer support that the regions with higher humidity levels show a significantly negative association with Covid-19 reported cases in two provinces. Maintaining humidity between 40% and 60%, by opening windows, can also reduce the virus absorption by the nasal passage [22,25]. The personal preventative action of the individual also helps to reduce the spread of Covid-19.
Although the temperature is one of the factors that influence the prevalence of Covid-19, in KSA, the temperature is the key factor that worsened the situation in heavily populated regions [21,23]. The results of the KSA provinces indicated the province temperature was associated with the reported cases of Covid-19 as experienced in five provinces. Saudi Arabia utilised a distinguished mechanism of early mitigation measures, GIS, and big data techniques to contain the pandemic from its source [5]. However, the inconsistency found in the results highlights that every region has unique weather conditions and Covid-19 behaves differently in various KSA regions [25,26]. Future research is needed to incorporate more weather variables with the social variables to understand the movement of the Covid-19. This can help to take preventative action to reduce the spread of Covid-19.
The current study has determined the impact of meteorological factors on the contagion rate of Covid-19. A direct association was found between the meteorological parameters with the spread of Covid-19 in KSA. Therefore, the results of the study suggest that the health authorities should implement specific measures against the spread of this global pandemic based on weather patterns. Many challenges remain to be studied as yet.
Acknowledgement: Acknowledged with thanks to Deanship of Scientific Research (DSR), University of Jeddah, for the technical and financial support.
Funding Statement: This work was funded by the DSR, University of Jeddah, Jeddah, under Grant Number (UJ-20-DR-149) Ranya Fadlalla Elsheikh.
Conflicts of Interest: The authors declare that they have no conflicts of interest to report regarding the present study.
1. S. A. Ali, M. Baloch, N. Ahmed, A. A. Ali and A. Iqbal, “The outbreak of Coronavirus disease 2019 (COVID-19)—an emerging global health threat,” Journal of Infection and Public Health, vol. 13, no. 4, pp. 644–646, 2020. [Google Scholar]
2. E. Shim, A. Tariq, W. Choi, Y. Lee and G. Chowell, “Transmission potential and severity of COVID-19 in South Korea,” International Journal of Infectious Diseases, vol. 93, pp. 339–344, 2020. [Google Scholar]
3. Z. Arab-Mazar, R. Sah, A. A. Rabaan, K. Dhama and A. J. Rodriguez-Morales, “Mapping the incidence of the COVID-19 hotspot in Iran-implications for travellers,” Travel Medicine and Infectious Disease, vol. 34, no. 101630, 2020. https://doi.org/10.1016/j.tmaid.2020.101630. [Google Scholar]
4. C. Zhou, F. Su, T. Pei, A. Zhang, Y. Du et al., “COVID-19: Challenges to GIS with big data,” Geography and Sustainability, vol. 1, no. 1, pp. 2666–6839, 2020. [Google Scholar]
5. Ministry of Health, “Coronavirus disease 19 (COVID-19) guidelines february 2020 V1.1,” 2020. [Online]. https://www.moh.gov.sa/CCC/healthp/regulations/Documents/Coronavirus%20Disease%202019%20Guidelines%20v1.1.pdf. [Google Scholar]
6. M. N. K. Boulos and E. M. Geraghty, “Geographical tracking and mapping of Coronavirus disease COVID-19/severe acute respiratory syndrome Coronavirus 2 (SARS-CoV-2) epidemic and associated events around the world: How 21st century GIS technologies are supporting the global fight against outbreaks and epidemics,” International Journal of Health Geographics, vol. 19, no. 8, pp. 1–12, 2020. [Google Scholar]
7. G. J. Musa, P. H. Chiang, T. Sylk, R. Bavley, W. Keating et al., “Use of GIS mapping as a public health tool-from cholera to cancer,” Health services insights, vol. 6, pp. 111–116, 2013. [Google Scholar]
8. A. H. Auchincloss, S. Y. Gebreab, C. Mair and A. D. Roux, “A review of spatial methods in epidemiology, 2000–2010,” Annual Review of Public Health, vol. 33, no. 1, pp. 107–122, 2012. [Google Scholar]
9. T. Kistemann, F. Dangendorf and J. Schweikart, “New perspectives on the use of geographical information systems (GIS) in environmental health sciences,” International Journal of Hygiene and Environmental Health, vol. 205, no. 3, pp. 169–181, 2002. [Google Scholar]
10. M. Norstrøm, “Geographical information system (GIS) as a tool in surveillance and monitoring of animal diseases,” Acta veterinaria Scandinavica, vol. 42, pp. 1–7, 2001. [Google Scholar]
11. I. Franch-Pardo, B. M. Napoletano, F. Rosete and L. Billa, “Spatial analysis and GIS in the study of COVID-19. A review,” Science of the Total Environment, vol. 739, no. 1, pp. 140033, 2020. [Google Scholar]
12. C. Wang, P. W. Horby, F. G. Hayden and G. F. Gao, “A novel Coronavirus outbreak of global health concern,” Lancet, vol. 395, no. 10223, pp. 470–473, 2020. [Google Scholar]
13. M. S. Al Surf and L. A. Mostafa, “Will the Saudi’s 2030 vision raise the public awareness of sustainable practices?,” Procedia Environmental Sciences, vol. 37, pp. 514–527, 2017. [Google Scholar]
14. S. Hamid, M. Y. Mir and G. K. Rohela, “Novel Coronavirus disease (COVID-19A pandemic (epidemiology, pathogenesis and potential therapeutics),” New Microbes New Infect, vol. 35, no. 100679, 2020. [Google Scholar]
15. J. Riou and C. L. Althaus, “Pattern of early human-to-human transmission of Wuhan 2019 novel Coronavirus (2019-nCoVDecember 2019 to January 2020,” Euro surveillance, vol. 25, no. 4, pp. 2000058, 2020. https://doi.org/10.2807/1560-7917.ES.2020.25.4.2000058. [Google Scholar]
16. R. A. A. Neto and G. C. Melo, “Correlation between weather, population size and COVID-19 pandemic: A study of Brazilian capitals,” Journal of Health & Biological Sciences, vol. 8, no. 1, pp. 1–5, 2020. [Google Scholar]
17. Z. Zhang, T. Xue and X. Jin, “Effects of meteorological conditions and air pollution on COVID-19 transmission: Evidence from 219 Chinese cities,” Science of the Total Environment, vol. 741, no. 140244, 2020. https://doi.org/10.1016/j.scitotenv.2020.140244. [Google Scholar]
18. J. F. W. Chan, S. Yuan, K. H. Kok, K. K. W. To, H. Chu et al., “A familial cluster of pneumonia associated with the 2019 novel coronavirus indicating person-to-person transmission: A study of a family cluster,” Lancet, vol. 395, no. 10223, pp. 514–523, 2020. [Google Scholar]
19. R. H. L. Pedrosa, “The dynamics of Covid-19: Weather, demographics and infection timeline,” medRxiv, 2020. https://doi.org/10.1101/2020.04.21.20074450. [Google Scholar]
20. S. Adeyemi, U. Yakutcan and E. Demir, “A statistical assessment of association between meteorological parameters and COVID-19 pandemic in 10 countries: The devil is in the detail,” Journal of Global Health Reports, vol. 4, 2020. https://doi.org/10.29392/001c.13693. [Google Scholar]
21. S. A. Meo, A. A. Abukhalaf and A. A. Alomar, “Effect of temperature and humidity on the dynamics of daily new cases and deaths due to COVID-19 outbreak in Gulf countries in middle east region,” European Review for Medical and Pharmacological Sciences, vol. 24, pp. 7524–7533, 2020. [Google Scholar]
22. M. Şahin, “Impact of weather on COVID-19 pandemic in Turkey,” Science of the Total Environment, vol. 728, no. 138810, 2020. https://doi.org/10.1016/j.scitotenv.2020.138810. [Google Scholar]
23. B. Oliveiros, L. Caramelo and N. C. Ferreira, “Role of temperature and humidity in the modulation of the doubling time of COVID-19 cases,” medRxiv, 2020. [Google Scholar]
24. M. Wang, A. Jiang, L. Gong, L. Luo, W. Guo et al., “Temperature significant change COVID-19 transmission in 429 cities,” medRxiv, 2020. https://doi.org/10.1101/2020.02.22.20025791 [Google Scholar]
25. C. Wang, P. W. Horby, F. G. Hayden and G. F. Gao, “A novel coronavirus outbreak of global health concern,” The Lancet, vol. 395, no. 10223, pp. 470–473, 2020. [Google Scholar]
26. Y. Zhu, J. Xie, F. Huang and L. Cao, “Association between short-term exposure to air pollution and COVID-19 infection: Evidence from China,” Science of the Total Environment, vol. 727, no. 138704, 2020. https://doi.org/10.1016/j.scitotenv.2020.138201. [Google Scholar]
 | This work is licensed under a Creative Commons Attribution 4.0 International License, which permits unrestricted use, distribution, and reproduction in any medium, provided the original work is properly cited. |