DOI:10.32604/csse.2022.022003
| Computer Systems Science & Engineering DOI:10.32604/csse.2022.022003 | |
| Article |
Evaluation of Deep Learning Models for Person Authentication Based on Touch Gesture
1Computer Science Department, Faculty of Computing and Information Technology, King Abdulaziz University, Jeddah, Saudi Arabia
2Electrical Engineering Department, Faculty of Engineering at Shoubra, Benha University, Cairo, 11629, Egypt
*Corresponding Author: Asrar Bajaber. Email: abajaber0014@stu.kau.edu.sa
Received: 25 July 2021; Accepted: 13 September 2021
Abstract: Touch gesture biometrics authentication system is the study of user's touching behavior on his touch device to identify him. The features traditionally used in touch gesture authentication systems are extracted using hand-crafted feature extraction approach. In this work, we investigate the ability of Deep Learning (DL) to automatically discover useful features of touch gesture and use them to authenticate the user. Four different models are investigated Long-Short Term Memory (LSTM), Gated Recurrent Unit (GRU), Convolutional Neural Network (CNN) combined with LSTM (CNN-LSTM), and CNN combined with GRU(CNN-GRU). In addition, different regularization techniques are investigated such as Activity Regularizer, Batch Normalization (BN), Dropout, and LeakyReLU. These deep networks were trained from scratch and tested using TouchAlytics and BioIdent datasets for dynamic touch authentication. The result reported in terms of authentication accuracy, False Acceptance Rate (FAR), False Rejection Rate (FRR). The best result we have been obtained was 96.73%, 96.07% and 96.08% for training, validation and testing accuracy respectively with dynamic touch authentication system on TouchAlytics dataset with CNN-GRU DL model, while the best result of FAR and FRR obtained on TouchAlytics dataset was with CNN-LSTM were FAR was 0.0009 and FRR was 0.0530. For BioIdent dataset the best results have been obtained was 84.87%, 78.28% and 78.35% for Training, validation and testing accuracy respectively with CNN-LSTM model. The use of a learning based approach in touch authentication system has shown good results comparing with other state-of-the-art using TouchAlytics dataset.
Keywords: Touch authentication system; touch gestures; behavioral biometric; deep learning; classification; CNN; RNN; LSTM
Touch-based authentication system is the way to identify the user based on his touch behavior done on touch devices [1,2]. Moreover, this system has many helpful features over the other types of biometrics authentication system. Such these features are: the touch-based authentication has high level of security compared with other authentication methods [3], Also, we can change the touch behavior rather than other biometric systems as we cannot change the biometric characteristics when it has been attacked. Transparency is another feature provided by touch-based authentication system, for this; the user authenticated without his knowledge and done in the background and in parallel with a user's common activities on his device [2]. Also, it is performed by using existing embedded sensors in user mobile phone [4]. So, it is relatively having lower cost than other biometrics authentication systems.
A touch-based authentication system like other biometric authentication system contains two main phases: Enrollment and Authentication phase [5] as shown in Fig. 1, the Enrolment phase which enroll the user into the system by his biometric, this phase consists of three sub phases, start with scanning the biometric sample and in the next sub phase the biometric data will be extracted by the system and the last phase; the biometric template will be created and stored in the system storage for the purpose of authentication. The authentication phase is the phase where the new set of biometric data re-collected in order to verify the user, in this phase the data with fresh samples of the same person in the same manner will be collected again and compered with the biometric data that stored in the database. If the authentication system finds the user template in the database match with the one acquired in the authentication phase, it would give the output as matched [5,6].
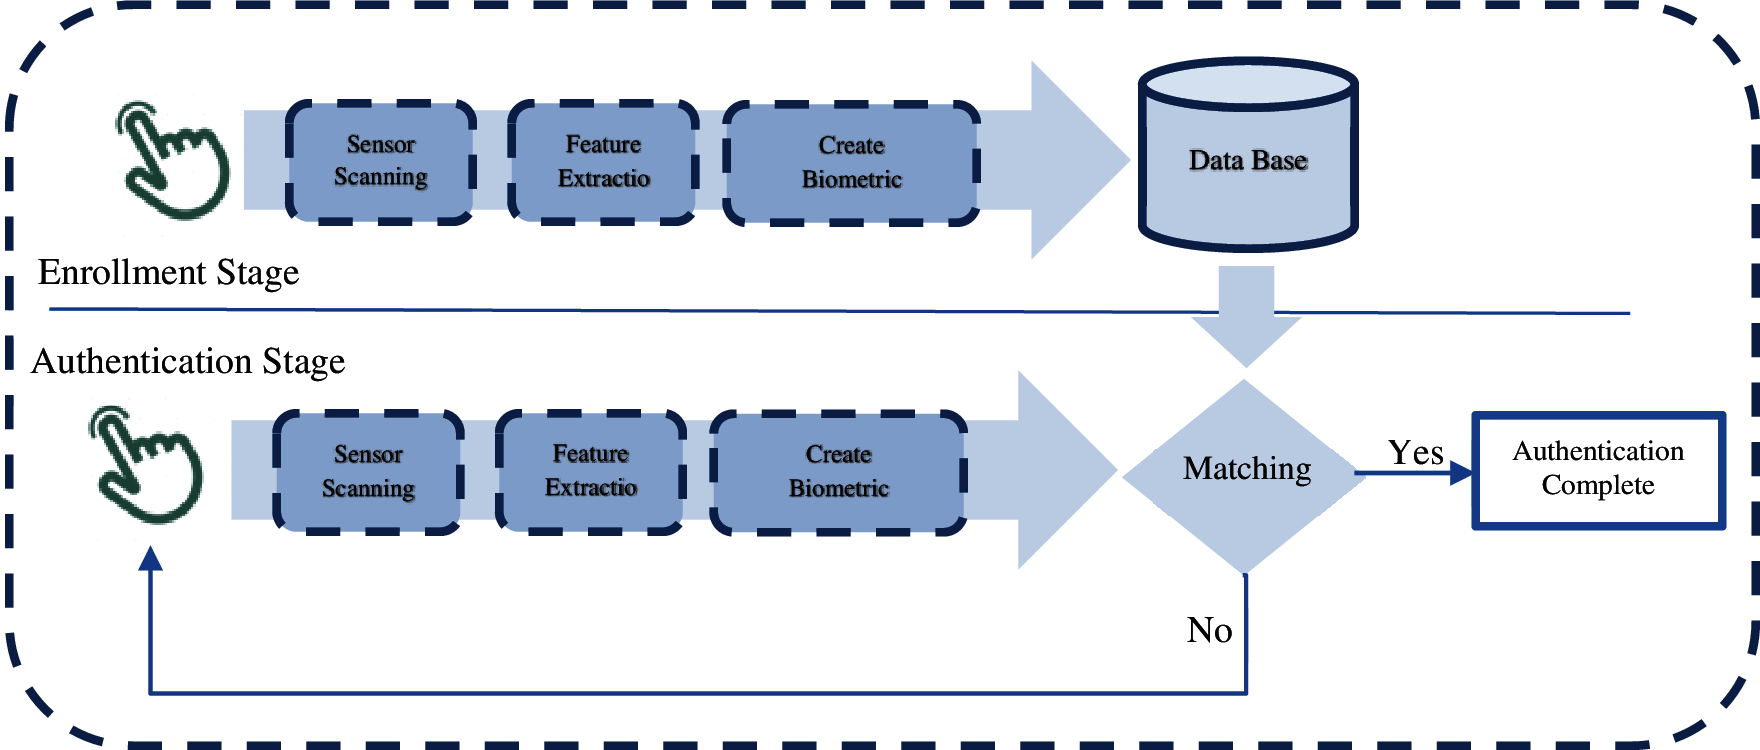
Figure 1: A biometric authentication system [5]
A touch authentication system done in two modes either static or dynamic, a static authentication mode refers to authenticate the user at specific time, either on login session or pre-defined session, while in dynamic or continuous authentication mode the intervals of authentication are not pre-defined and this type of authentication is always done after the login session [3].
There are two feature extraction approaches have been proposed to extract touch features: hand-crafted feature extraction approach which is based on calculation of raw data to come up with touch features and learning -based feature extraction approach which uses DL models to automatically extracts the features. Using hand crafted approaches are widely used in dynamic touch authentication systems [2,4,7–12] while there are limited works used DL to automatically extract the touch features [13].
In this paper we propose a touch authentication system based on DL. We investigate the performance of the system using different DL models and testing on different touch datasets. Moreover, we investigate in our work if learning-based approach could enhance feature extraction in touch authentication system and thus enhance the system performance.
The main objectives of this work are:
• Evaluate different RNN and CNN-RNN network architectures to authenticate the user using his touch gestures.
• Illustrate if CNN based on RNN could enhance the feature extraction process and thus the system performance rather than using only RNN.
• Examined different model depth by adding different regularization layers to investigate their adequacy and effectiveness on the touch authentication system performance.
The remainder of the paper is organized as follows: Section 2 summarizes related works in touch-based gesture authentication system. Section 3 provides the materials and methods used in our proposed system. The experiments and results introduced in Section 4, and comparison with stat-of-the art presents on Section 5. While the conclusion and feature work are shown in Section 6.
Many researches propose an authentication system based on a user touch behavior. In this section we will introduce these works.
Using more than one touch gestures to authenticate the users could enhance the system performance. Tapping, scrolling, dragging and zooming touch gestures used in [7] to authenticate the users. The aim from this study is to explore which combinations of touch gestures could authenticate the user. By applying hand-crafted feature extraction approach, they extract eleven features from tap gesture, sixteen features from scrolling and dragging gestures, and fifteen features from zooming gesture using their own datasets which contains 20 users. They use medians vector proximity (MVP), k-nearest neighbor (k-NN) and Random Forest (RF) as classifiers. The best result they have been obtained was for two gestures; the EER with k-NN was 1.85%, and for three or more gestures the EER with k-NN was 0%.
Antala et al. [12] used horizontal swiping to authenticate the users. Different number of features and classifiers investigated to obtain best performance. Nearest-neighbor, Gaussian Mixture Models (GMM) and support Vector Data Description (SVD), RF, Bayes Net and k-NN with three, eight and eleven features. They obtain best result with two-class classifier and with three features as EER was 0.004 ± 0.001 for the 3-feature set on dataset recorded by 40 users using Android application.
Ellavarason et al. [14] proposed another authentication system which based on different modalities: swipe gestures, signature (finger and stylus), keystroke, accelerometer and gyroscope. They collect their data while the user sitting, walking, treadmill, travelling on a bus and perform his touch behavior on the mobile. 28 features have been extracted using hand-crafted feature extraction. Support vector machine (SVM), KNN and naive Bayes (NB) have been used as classification. The result they have been obtained was 1% ERR with their own dataset collected from 50 users.
Shen et al. [2] used sliding touch behavioral to continuously identify the user. They extract 57 features. They address the features variability of active behavioral of touch gestures by calculating the probability density function (PDF) of one feature and compare it with all features’ PDF. Moreover, the classifiers were used K-NN, SVM, Backward propagation neural network (BPNN) and RF. The Best EER was around 1.8% with RF classifier on touch dataset collected by 71 users.
Zou et al. [8] used horizontal and vertical stroke to authenticate the user. They extract 32 features from complete touch gesture-from start to end touch interaction. Only 29 most significant features used by applying the correlation analysis. Also, they apply Conditional Mutual Information Maximization (CMIM) to select the top 5 features. The classifier used was Import Vector Domain Description IVDD and based on probabilistic threshold generated by IVDD the user will be ether accepted or rejected. The result they have been obtained was FAR3.56% and mean FRR of 2.14% on TouchAlytics dataset.
Alariki et al. [4] improved the touch-based authentication system by applying feature selection algorithm to select most significant features. Sequential forward selection (SFS) wrapper algorithms used to select 11 features out of 13. They use RF classifier, and 10-fold cross validation on 504 user's records. The result they have been obtained was EER = 0.0833, Accuracy = 91.67% on dataset collected by 84 users.
Ooi et al. [15] exposed the user's temporal touch behavior using temporal regression forest. The main idea used was touch feature temporalization, in which the touch feature vectors are flattened based on the observed successive n time-step before the regression has been done. The result obtained for EER was ∼4.0% and ∼2.5% using two datasets Serwadda dataset and TouchAlytics dataset, respectively.
Lee et al. [16] enhanced the touch authentication system performance by extracting session based features in addition to stroke touch features, the total number of features have been extracted were 40 features. Also; they used RF and Deep Belief Networks (DBN) for classification. The result they have been obtained was EER of 2.58% using the RF. And EER of 9.93% with DBN on TouchAlytics dataset.
Tolosana et al. [10] authenticated the user by his touch behavior while he draw password digits by his hand. For each digit; they extracted 21 features. Also; They used two models: Bidirectional Long-Short Term Memory (BLSTM) and Dynamic Time Warping (DTW). They used Sequential Forward Floating Search (SFFS) algorithm in order to choose best set of features. The best result they have been obtained was EER of 17.4% for BLSTM model with digit 5 on e-Bio Digit dataset.
Martinez-Diaz et al. [11] statically authenticated the user based on his free-form sketches which use same set of features and pre-processing used by [10], they extracted the features using GMM. They applied two model for classification GMM and DTW. The best result they have been obtained was EER of 21% with GMM and 3% with DTW on DooDB dataset that contains free-form doodles collected from 100 users.
Tolosana et al. [17] enhanced the performance of the authentication system by applying Bidirectional Recurrent Neural Network (BRNN) to access both past and future context. They used LSTM and GRU based on Siamese architecture to verify an on-line signature. A number of 23 features were extracted from user signature. They build two RNN models LSTM and GRU as normal architecture also each with Siamese architecture BRNN. The best result they have been obtained was 2.92% for EER with BGRU on BiosecurID dataset.
So far all the presented related works have been applied hand-crafted feature extraction approaches in their proposed systems. One other work done by Krzemiński et al. [13] which tries to find user's touch patterns from user's touch data and no hand-crafted feature extraction applied to their proposed system. The input to their system was raw data of long stroke. The long stroke is the touch gestures over 13 rows from TouchAlytics dataset raw data. They split the data into different windows of size n then they fuse all windows for multiple strokes of the same user. They used for their work deep multilayer perceptron (MLP). The best result they have been obtained was 96.64% for the accuracy and ERR was 0.065 of the fusion of 10 touch strokes on TouchAlytics dataset.
These works confirm that touch-gestures behavior has a good possibility for authentication on smartphones. The aim of these works on touch gesture authentication system is developing a scheme to enhance the system performance of users’ identification based on their touch gestures behavioral. Compared with these works; our study investigates on enhancing touch authentication system using RNN and RNN based on CNN models to automatically extracts the touch features from any length of touch stroke rather than using hand crafted approaches used in existing related works.
Touch data is a time series data, and the excellent DL model deal with time series data is RNN [18]. In our proposed system, sequential RNN DL and RNN based on CNN models have been built to be trained on touch data. The input is touch raw data and the output is the probability of each class (user). In this section we will introduce the design of our DL models of the touch authentication system.
3.1 Long-Short Term Memory (LSTM)
LSTM is a type of RNN and used in our proposed system as baseline model [19], as it is dedicated to being applied on time series forecasting. This model illustrated in Fig. 2.
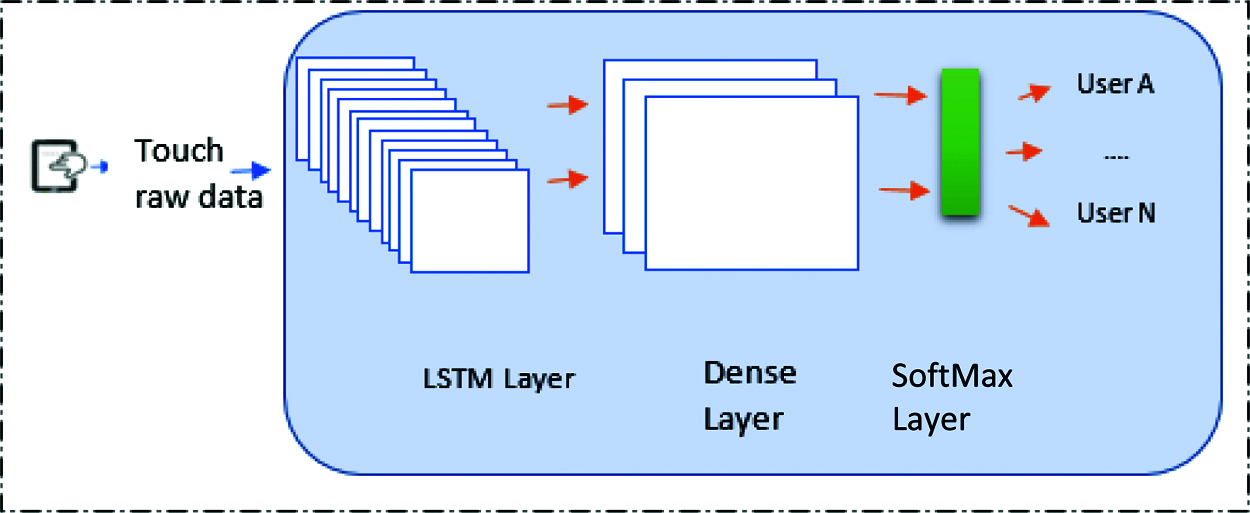
Figure 2: RNN baseline model
The layers used in the proposed LSTM are:
Input layer: this layer takes the raw touch data as input and feed forward them into the next layer in our DL model by considering each row in the data as one sample.
Long Short-Term Memory LSTM Layer
LSTM is a type of RNN, that works on feedback connection within the layer, which hold the input and output information of the previous neurons [20]. Therefore; the LSTM use the current information with previous one in its learning [21]. LSTM has smarter neurons which has a memory inside it [22]. Each cell (neurons) in LSTM has three gaits to manage the network. Input Gait, Forget Gait, and Output Gait.
Input Gait: this gait adds the input data x to cell state by first, decide which data should be updated using Sigmoid function (Eq. (1)) [22] and then create a vector for the candidate information to be added to the cell state using tanh [23,24].
Forget Gait: this gait used for removing the less important or undesired information from the cell state. It takes the new input and the output of the previous cell and apply Sigmoid function (Eq. (1)) to output values ranged from 0 to 1, 0 means the information is removed and 1 means the information is required [22,23].
Output Gait: this gait determines which will be the output using the Sigmoid Function (Eq. (1)). Then, it takes the new information updated by the input and forget gaits, applies a tanh function, and multiplies it by the result of the sigmoid function [22,23].
At every time step in LSTM these process will be performed, while each time step; the LSTM cell takes the new data and the previous data (which is the output from previous state) and then pass the updated data to the next state, and at the same time it predicts the actual data [22,23].
Dense layer: all neurons in this layer connected with all neurons in the previous layer and receives the input. this layer performs matrix-vector multiplication to generate m-dimensional vector, so this layer changes the feature vector dimension [25].
Because we deal with multi class classification problem, each sample will have a Likelihood value of 1.0 for the correct class and 0.0 for other class values [26], Softmax activation function has been applied on the last layer to calculate the Likelihood (probability) of each class using Eq. (2) [24].
where K is the number of classes in touch authentication system. Categorical-cross entropy has been used as loss function to observe the training process.
3.2 Gated Recurrent Unit (GRU)
Another line of investigation, which is called GRU model, is to repeat the same architecture designed in LSTM baseline model but replacing LSTM layer in Fig. 2 by GRU layer, where GRU is a sampler version of LSTM in its computation and implementation [17,27,28]. The main difference between LSTM and GRU RNNs is the number of gaites used to control the flow of information. The GRU RNN unit has only two gaits called reset gait r and update gate z. For each time step t in GRU:
where w∗ and U∗ are the weight matrices and b ∗ is the bias vector. The output of Sigmoid layer σ between 0 and 1. The GRU can add new information from t time also can remove old information from t – 1. The reset gate rt oversees keeping in the current cell state (i.e., het) the information of the previous time step ht−1 or reset it with the information of only the current input xt. The update gate zt filters how much information from the previous time step and current cell state will flow to the current output of the memory block ht[17].
3.3 Recurrent Neural Network Based on Convolutional Neural Network CNN-RNN
Here another two models are investigated by adding CNN to RNN DL models; LSTM based on CNN and GRU based on CNN [18]. In this way we have two another different models CNN-LSTM and CNN –GRU.
The architecture of CNN-RNN models is shown in Fig. 3 which contains CNN and Maxpooling layer with RNN model where the Convolution layer used in the proposed system is one dimensional convolution network because touch data is a sequential- time series-data. This layer has been used to extracts the local features from the touch raw data. These features are passed to the RNN network to generate temporal features. The Max-Pool Layer reduces the dimension of the feature to decreases the computation complexity. It reduces the height and width of a given feature map, but depth (number of channels) remain the same. It is like a moving window with an operation selecting the maximum element within it [29].
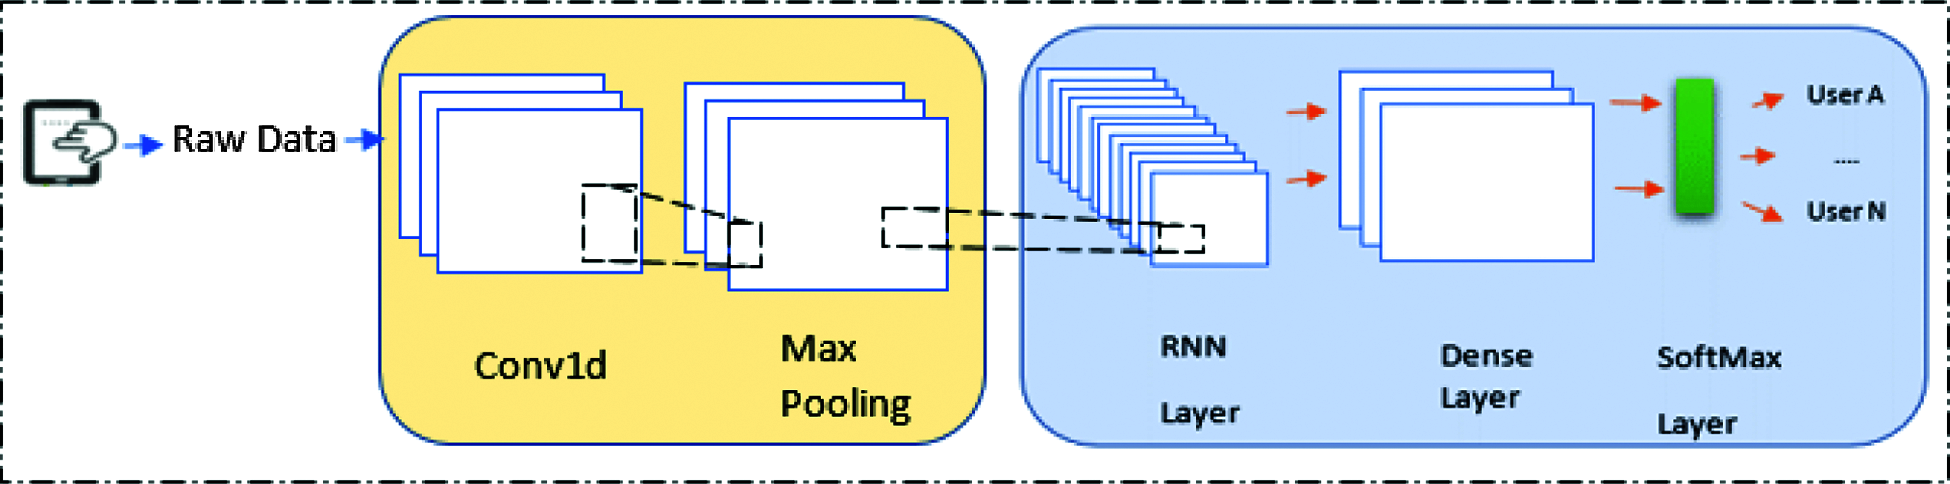
Figure 3: CNN-RNN model
To eliminate model overfitting there are many techniques used for regularization. The regularization techniques used in this work are Activity Regularization, Dropout, BN and Leaky-ReLU.
Dropout layer: this layer is to decrease the model overfitting by setting the weights to zero with probability p [30].
Activity Regularization: it is another regularization technique, which is the sum over all squared weight values of a weight matrix. In our system we use activity regularizer L2 which called L2 norm of weight matrices, and calculated as Eq. (7):
where w is the weight matrix [31].
Batch Normalization (BN) which used to regularize the model and make it more stable. BN layer takes the output of the preceding activation layer and normalizes it by subtracting the mini-batch mean and dividing by the mini-batch standard deviation. Also, BN layer reduces the network dependency on the initialization of each layer, which allows to use a higher learning rate [26,32].
Leaky-ReLU Activation Function: A Rectified Linear Unit (ReLU) has output zero if the input is negative, and raw output (same as input) otherwise (Eq. (8)). Therefore, the derivative of ReLU has two values ether 1 if the input was positive or 0 if the input was negative (Eq. (8)). Thus neuron having negative input does not participate in back propagation to update the parameter of the model as their gradient is zero. This issue is known as a dying-ReLU problem. Leaky-ReLU is one of the solutions to this issue. Instead of the derivative is zero for negative input, a small slope α is assigned. The function computes the corresponding activation is given by Eq. (9), and its derivative is given by Eq. (10) [29].
We build our model using Python with Anaconda Jupiter tool. Also, Keras DL library with TensorFlow backend used. Another python libraries used such as Numpy, Pandas and sklearn. Dell device-intel® Core ™ i7–7500U CPU 7500 GHz-was used to implement our work. In this section we introduce the datasets used to test our work and evaluation metrics followed by experimental result.
Two touch datasets used in our proposed system: TouchAlytics [33], dataset and-BioIndent dataset [34].
TouchAlytics has been used to evaluate our proposed system. It contains touch stroke for 41 users. It has been collected using Android smartphones. They develop an android mobile application and allow the user to read Wikipedia documents and determine the differences between two images. At the time while the user interacts with their application the mobile recorded user id, phone id, document id, time, action, device orientation, X and Y coordinates, pressure, area covered and phone orientation. The phone_id can take one value of 1–5 which is refer to the phone type used while the user interacts with the application and experimenter who did the experiment. There are five types of phones used while collecting the data and five experimenters, Nexus 1 Experimenter E, Nexus S Experimenter M, Nexus 1 Experimenter R, Samsung Galaxy S Experimenter I and Droid Incredible, Experimenter E. the column doc_id can take 7 values which are refer to what the user interact with; and there are 4 Wikipedia articles and 3 Image comparison game. The action column has three values 0, 1, and 2 which are referred to touch down, touch up, touch move, respectively. When the user start interacting with the application; the action value be 0, then if the user moves on the screen; the action value be 2, and if the user stop his interaction, the action value be 1. And the phone_orian column can take 2 values 0 or 1 refer to landscape or portrait respectively [33]. There are two versions of this dataset, the first one (version 1) contains touch raw data which has 10 column recorded by phone and the second version (version 2) contains 31 calculated features. In our experiment we use both versions of this dataset as an input to the proposed touch authentication system.
This dataset has been collected from 71 users from Android smartphones. By developing a client- server android mobile application and allow the user to read a text and answer the questions about the text has been read and select an image from the gallery. Eight different devices were used, including tablets, with varying screen sizes. Moreover; The data was obtained during 4 weeks (not separated in sessions in the database). At the time while the user interacts with their application the mobile recorded four main interactions Up, Down, Left and Right. when the user read a document; “Up” and “Down” operations occurred frequently by doing vertical strokes, and when the user browsing an image “Left” and “Right” operations have been occurred by doing a horizontal stroke. The raw data extracted from these four operations are: device Id, user id, document type, time, action, phone ordination X and Y coordinates pressure and finger area [34].
Data pre-processing has been used to reduce the noise and thus reduce overfitting. In this context, the data normalization and data standardization have been used in our proposed system.
- Data Normalization: Due to unbalanced values in the data and the data have different values ranges; data normalization technique address this problem by making the data have the same value range [35]. In our proposed system, a method called the min–max Normalization have been used; where the data are scaled so that their ranges are confined to a predefined lower l and upper boundary u. Let F denotes a dataset of feature sets, Fij, i ∈ {1, 2, …a}, j ∈ {1, 2, …d}, represented in the form of an a − by − d matrix, where a refers to the number of column in the dataset and d refers to the dimensions of the feature sets. The matrix can be represented as Eq. (11):
Then, the normalized dataset
where Fij is the dataset before data Normalization, u is the upper boundary and l is the lower boundary [35].
- Data Standardization:
Another data preprocess technique used in this work is data Standardization which transforms data to have a zero mean as in Eq. (13):
where
Also, by considering touch authentication system as multi class classification, the class Y should be converted to one hot encoding Y ∈ {0, 1} K where K is the number of classes. Also, each user in touch dataset has different number of observation than others; from this, it is better to split the dataset into train and test sets in a way that saves the same ratio of examples in each class as observed in the dataset. To address this problem, we use train_test_split ( ) by setting the “stratify” argument to the y component of the touch dataset.
Performance of our work were measured using different metrics to validate the proposed model. In this section we provide the performance metrics used in our proposed system.
- False Acceptance Ratio (FAR): It is the metric to measure the security of biometric system and calculated as Eq. (14):
where FP means false positive and TN means true negative obtained from confusion matrix [36].
- False Rejection Ratio (FRR): It is a part of correct samples that are incorrectly rejected and calculated as Eq. (15) [36]:
where FP means false positive, TP means true positive, and FN means false negative obtained from confusion matrix.
- Equal Error Rate: This metric is achieved when FAR and FRR are equal. However, if more than one values in two rates are equal, we find the mean EER [28].
- Accuracy: which calculated as Eq. (16):
- Cross-Loss Entropy: The cross entropy of multi class classification calculated by Eq. (17):
where p(k) is the probability of target class and q(k) is the predicted class [37].
In our experiments; we studied different DL models architectures to obtain best result and construct the most proper structure that can design the touch authentication system. We did many experiments for both RNN and RNN based on CNN and we use 11 different DL architectures. The difference between the architectures in Tab. 1 comes from using different numbers of neurons and/or adding one or more regularization techniques as shown in Fig. 4 and Fig. 5. As data preprocess we encode the classes to one hot encoding, and we normalize the data using MinMaxScaler and standardize data using StandardScaler.

Figure 4: RNN DL model after regularization

Figure 5: CNN-RNN model after regularization

After conducting number of experiments with different values of the training's parameters, we adjusted the values of these parameters for all datasets as follows: epochs = 100, batch size = 500, split ratio= (70% training, 10% validation, 20% testing). Adam has been used as an optimizer with its default learning rate.
This subsection summarizes the results that were obtained from our experiments. Different types of data used as an input to the DL models: the touch raw data and the second version of TouchAlytics dataset that use hand crafted feature extraction approach to extract touch features [33].
4.5.1 The Result of Using Raw Data as an Input to the DL Models
Touch raw data used as the input to DL models for both TouchAlytics and BioIdent datasets, and the result of this experiments analyzed here. The results will have presented in Tab. 2 for TouchAlytics dataset and Tab. 3 for BioIdent dataset in term of training, validation and testing accuracies, training and validation loss, and FAR, FRR and ERR.


4.5.2 Result of Touchalytics Dataset
From Tab. 2 we see in general, model 10 obtain the best result on TouchAlytics dataset version 1: 96.73%, 96.07% and 96.08% for training accuracy, validation accuracy and testing accuracy respectively. Also model 4 obtain same result on training accuracy 96.73%, and the minimum of training loss of TouchAlytics dataset equal to 0.0888 obtained also with model 4. The minimum FAR has been obtained with model 5 and 10 while the minimum FRR we have been obtained was with model 5 Fig. 6a presents the confusion matrix of TouchAlytics Dataset of CNN-GRU (model 10). Adding the Activity Regularization L2 in LSTM or GRU layer in model 2 and 7; improved the accuracy in a negligible way. While adding CNN to GRU leads to enhance the system accuracy. GRU based on CNN perform better than LSTM based on CNN. Moreover; adding the regularization techniques did not improve the results on TouchAlytics dataset and it should be used carefully with more experiments [38,39].

Figure 6: Confusion Matrix of the best result (a) TouchAlytics dataset on CNN-GRU model (model 10), (b) BioIdent Dataset on CNN-LSTM model (model 5)
4.5.3 Result of Bioident Dataset
As we can see from Tab. 3; in general LSTM based on CNN doing best result 84.88%, 77.68% and 78.07% for Training, validation and testing accuracy respectively, and obtain best result with training and validation loss: 0.4144 and 0.7300 respectively. FAR and FRR: model 5 obtain best result too Fig. 6b presents the confusion matrix of BioIdent dataset of CNN-LSTM model (model 5). Replacing LSTM with GRU did not enhance system accuracy with BioIdent dataset. Also, adding regularization to the model did not act well.
4.5.4 The Result of Using the Hand Crafted Extracted Features as an Input to the DL Models
In this section we provide the result we have been obtained from our proposed system with hand crafted approach for dynamic touch authentication system with TouchAlytics Dataset. Since we obtain best result on model 10-CNN-GRU model-with TouchAlyatics dataset version 1; we try to use TouchAlyatics dataset version 1 [33] as an input to CNN-GRU model. However; we use all the features extracted on dataset and we replace Nan or infinity values by zero. Tab. 4 shows the result that we have been obtained while using hand-crafted extracted features as the input to CNN-GRU model. As we can see, the accuracy was 96.94%, 75.77% and 75.39% for training, validation and testing accuracy respectively.

5 Comparison with the-State-of-the-Art
Corresponding to the conducted experiments, touch authentication system with learning-based approach for feature extraction can enhance the system performance and reduce the error. In this section, we describe the comparison of the results for the proposed touch authentication system with the-state-of-the-art. Tab. 5 summarizes the results of touch authentication system on the constrained TouchAlytics dataset with the-state-of-art.

The works proposed by [8,16] used hand-crafted features extraction approach to extract touch features from the touchscreen raw data. Also they use fusion techniques to fuse many touch strokes for authentication. The result they have been obtained were: EER equal to 0.0258 and 0.0993 for RF and DBN respectively [16] and 0.0356, 0.0214 for FAR and FRR respectively using IVDD classifiers [8]. On the contrary, in our proposed system when we use the second version of TouchAlytics dataset as an input to our model we obtain 0.0061 and 0 for FAR and EER respectively which is better than their result. And we obtain best result when the input is touch raw data to our DL model.
A touch authentication system proposed by Krzemińsk et al. [13] gave comparable result with us. The MLP DL used in their work, and the input was long stroke from touch raw data. The main difference between the proposed touch authentication system and their work are the use of different DL models that deals with time series data for authentication as well as using one row from touch raw data as the input to our models. They obtain 96.64% and 0.065 for accuracy and EER respectively and we have been obtaining from our system 96.08% for accuracy which is comparable result with their work and our EER we have been obtained better than the work EER.
The presented results show that the learning based approach with using one touch gesture can be successfully used in user authentication task and can outperform state-of-the-art methods.
This paper has investigated the feasibility and effectiveness of using touch dynamics biometrics for user authentication on mobile devices. Also, study if feature extraction using learning based approach give better result than hand-crafted feature extraction approach or not. We did many experiments for both RNN and RNN based on CNN and we use 11 different DL architectures. The difference between the architectures comes from using different numbers of neurons and/or adding one or more regularization techniques. The data preprocess has been applied to touch raw data; encode categorical data to one hot encoding, and then we normalize the data using MinMaxScaler and standardize data using StandardScaler. The data splitting ratio was 70%, 10% and 20% for training, validation and testing respectively. The deep networks were trained from scratch and tested using TouchAlytics and BioIndent datasets for dynamic touch authentication. The best results we have been obtained were 96.73%, 96.07% and 96.08% for training, validation and testing accuracy respectively with dynamic touch authentication system on TouchAlytics dataset with CNN-GRU DL model, while the best result of FAR and FRR obtained on TouchAlytics dataset was with LSTM-CNN were FAR was 0.0009 and FRR was 0.0530. For BioIndent dataset the best results have been obtained were 84.87%, 78.28% and 78.35% for Training, validation and testing accuracy respectively with CNN-LSTM DL model. The result shows that the learning based approach gives best result than hand crafted approach.
Touch-based authentication systems still need to be improved, whether in security or in the availability of dataset to validate the system, as well as these systems need to develop the processes of template protection, and there is a limited number of research that secure touch template of the user rather than stored directly into database. As the feature work; we will collect balance, cleaned and accurate touch dataset and enhance the security of touch template in touch authentication system.
Funding Statement: The authors received no specific funding for this study.
Conflicts of Interest: The authors declare that they have no conflicts of interest to report regarding the present study.
1. Z. Ali, J. Payton and V. Sritapan, “At your fingertips: considering finger distinctness in continuous touch-based authentication for mobile devices,” in Proc. of IEEE Security and Privacy Workshops (SPW), San Jose, CA, USA, 2016. [Google Scholar]
2. C. Shen, Y. Zhang, X. Guan and R. Maxion, “Performance analysis of touch-interaction behavior for active smartphone authentication,” IEEE Transactions on Information Forensics and Security, vol. 11, no. 3, pp. 498–513, 2016. [Google Scholar]
3. P. Teh, N. Zhang, A. Teoh and K. Chen, “A survey on touch dynamics authentication in mobile devices,” Computers and Security, vol. 59, pp. 210–235, 2016. [Google Scholar]
4. A. Alariki, A. Abdul Manaf and S. Mousavi, “Features extraction scheme for behavioural biometric authentication in touchscreen mobile devices,” International Journal of Applied Engineering Research, vol. 11, no. 18, pp. 9331–9344, 2016. [Google Scholar]
5. V. Gaikawad and S. Kini, “A survey of multi-biometric cryptographic security system,” International Journal of Science and Research (IJSR), vol. 4, no. 12, pp. 1090–1094, 2015. [Google Scholar]
6. A. Bali, S. Goswami and S. Sharma, “Biometrics security in mobile application development & its applications,” International Journal of Scientific and Technical Advancements (IJSTA), vol. 5, no. 1, pp. 51–60, 2019. [Google Scholar]
7. S. Alghamdi and L. Elrefaei, “Dynamic authentication of smartphone users based on touchscreen gestures,” Arabian Journal for Science and Engineering, vol. 43, no. 2, pp. 789–810, 2018. [Google Scholar]
8. B. Zou and. Y. Li, “Touch-based smartphone authentication using import vector domain description,” in Proc. of IEEE, 29th Int. Conf. on Application-Specific Systems, Architectures and Processors (ASAP), Milan, Italy, 2018. [Google Scholar]
9. A. Salem and M. Obaidat, “A novel security scheme for behavioral authentication systems based on keystroke dynamics,” Security and Privacy, vol. 2, no. 2, pp. 1–12, 2019. [Google Scholar]
10. R. Tolosana, R. Vera-Rodriguez and J. Fierrez, “Biotouchpass: Handwritten passwords for touchscreen biometrics,” IEEE Transactions on Mobile Computing, vol. 19, no. 7, pp. 1532–1543, 2019. [Google Scholar]
11. M. Martinez-Diaz, J. Fierrez and J. Galbally, “Graphical password-based user authentication with free-form doodles,” IEEE Transactions on Human-Machine Systems, vol. 46, no. 4, pp. 607–614, 2016. [Google Scholar]
12. M. Antala and L. Szabó, “Biometric authentication based on touchscreen swipe patterns,” Procedia Technology, vol. 22, pp. 862–869, 2016. [Google Scholar]
13. M. Krzemiński and J. Hernando, “End-to-end user recognition using touchscreen biometrics,” arXiv preprint arXiv:2006.05388, 2020. [Google Scholar]
14. E. Ellavarason, R. Guest and F. Deravi, “Evaluation of stability of swipe gesture authentication across usage scenarios of mobile device,” EURASIP Journal on Information Security, 17 March 2020. [Google Scholar]
15. S. Ooi and A. Teoh, “Touch-stroke dynamics authentication using temporal regression forest,” IEEE Signal Processing Letters, vol. 26, no. 7, pp. 1001–1005, 13 May 2019. [Google Scholar]
16. Y. Lee, W. Hetchily, J. Shelton, D. Gunn, K. Roy et al., “Touch based active user authentication using deep belief networks and random forests,” in Proc. of 6th Int. Conf. on Information Communication and Management (ICICM), Hatfield, UK, 2016. [Google Scholar]
17. R. Tolosana, R. Vera-Rodriguez, J. Fierrez and J. Ortega-Garcia, “Exploring recurrent neural networks for on-line handwritten signature biometrics,” IEEE Access, vol. 6, pp. 5128–5138, 2018. [Google Scholar]
18. L. Xiaofenga, Z. Shengfeia and Y. Shengweib, “Continuous authentication by free-text keystroke based on CNN plus RNN,” ScienceDirect, vol. 147, pp. 314–318, 2019. [Google Scholar]
19. J. Brownlee, “How to develop LSTM models for time series forecasting,” 14 11 2018. [Online]. Available: https://machinelearningmastery.com/how-to-develop-lstm-models-for-time-series-forecasting/. [Accessed 1 12 2019]. [Google Scholar]
20. J. Brownlee, “Time series prediction with LSTM recurrent neural networks in python with keras,” July 2016. [Online]. Available: https://machinelearningmastery.com/time-series-prediction-lstm-recurrent-neural-networks-python-keras/. [Accessed Nov. 2019]. [Google Scholar]
21. E. Hellström, “Feature learning with deep neural networks for keystroke biometrics: A study of supervised pre-training and autoencoders,” M.S. thesis, Dept. Computer Science, Electrical and Space Engineering, Lulea University of Technology, pp. 68, 2017. [Google Scholar]
22. E. Torres, J. Kalita, J. Ventura, R. Lewis and A. Alzubaidi, “Authentication of legitimate users of smartphone based on app usage sequences,” M.S., Univercity of Colorado Colorado Springs, 2018. [Google Scholar]
23. F. Gers, J. Schmidhuber and F. Cummins, “Learning to forget: continual prediction with LSTM,” in Proc. of ICANN'99 Int. Conf. on Artificial Neurals Networks, Edinburgh, Scotland, 2000. [Google Scholar]
24. A. Singh, “Anomaly detection for temporal data using long short-term momory (LSTM),” 2017. [Online]. Available: https://www.elen.ucl.ac.be/Proceedings/esann/esannpdf/es2015-56.pdf. [Accessed 29 2 2020]. [Google Scholar]
25. P. Sharma, “Keras dense layer explained for beginners,” 20 Oct 2020. [Online]. Available: https://machinelearningknowledge.ai/keras-dense-layer-explained-for-beginners/. [Accessed Des 2020]. [Google Scholar]
26. A. Al-Shannaq, and L. Elrefaei, “Age estimation using specific domain transfer learning,” Jordanian Journal of Computers and Information Technology (JJCIT), vol. 6, no. 2, pp. 123–140, 2019. [Google Scholar]
27. L. Sun, Y. Wang, B. Cao, P. Yu, W. Srisa-an et al., “Sequential keystroke behavioral biometrics for mobile user identification via multi-view deep learning,” in Proc. of Joint European Conf. on Machine Learning and Knowledge Discovery in Databases, Cham, 2017. [Google Scholar]
28. L. Sun, B. Cao, J. Wang, W. Srisa-an, P. Yu et al., “KOLLECTOR: Detecting fraudulent activities on mobile devices using deep learning,” Transactions on Mobile Computing, vol. 20, no. 1, pp. 1465–1476, 2020. [Google Scholar]
29. A. Handa, R. Agarwal and N. Kohli, “A Multimodel Keyword Spotting System Based on lip Movement and Speech Features,” Multimedia Tools and Applications, Dordrecht, Vol. 79, no. 27–28, pp. 20461–20481, 2020. [Google Scholar]
30. A. S. Jaffe, “Long short-term memory recurrent neural networks for classification of acute hypotensive episodes,” MIT, 6 2017. [Online]. Available: https://dspace.mit.edu/bitstream/handle/1721.1/113146/1018306404-MIT.pdf?sequence = 1. [Accessed 2 3 2020]. [Google Scholar]
31. A. Oppermann, “Regularization in deep learning — L1, L2, and dropout,” Towards data science, 19 Feb 2020. [Online]. Available: https://towardsdatascience.com/regularization-in-deep-learning-l1-l2-and-dropout-377e75acc036. [Google Scholar]
32. J. Brownlee, “How to accelerate learning of deep neural networks with batch normalization,” 18 Jan 2019. [Online]. Available: https://machinelearningmastery.com/how-to-accelerate-learning-of-deep-neural-networks-with-batch-normalization/. [Accessed 1 Des 2020]. [Google Scholar]
33. M. Frank, R. Biedert, E. Ma, I. Martinovic and D. Song, “Touchalytics,” http://www.mariofrank.net/touchalytics/index.html, 2013. [Google Scholar]
34. M. Antal, Z. Bokor and L. Szabo, “Bioident - touchstroke based biometrics on android platform,” 2014. [Online]. Available: https://ms.sapientia.ro/∼manyi/bioident.html. [Accessed 1 Jan 2020]. [Google Scholar]
35. P. S. Teh, N. Zhang, S. Tan, Q. Shi, W. Khoh et al., “Strengthen user authentication on mobile devices by using user's touch dynamics pattern,” Journal of Ambient Intelligence and Humanized Computing, pp. 4019–4039, 2019. [Google Scholar]
36. K. Vasavi and Y. Latha, “RSA cryptography based multi-modal biometric identification system for high-security application,” International Journal of Intelligent Engineering and Systems, vol. 12, no. 1, pp. 10–22, 2019. [Google Scholar]
37. V. Martinek, “Cross-entropy for classification,” Towards Data scince, 2020. [Online]. Available: https://towardsdatascience.com/cross-entropy-for-classification-d98e7f974451. [Accessed 2020]. [Google Scholar]
38. M. Al-Kharraz, L. Elrefaei and M. Fadel, “Automated system for chromosome karyotyping to recognize the most common numerical abnormalities using deep learning,” IEEE Access, vol. 8, pp. 157727–157747, 2020. [Google Scholar]
39. C. Garbin and X. Zhu, “Dropout vs. batch normalization: An empirical study of their impact to deep learning,” Multimedia Tools and Applications, vol. 79, pp. 12777–12815, 2020. [Google Scholar]
 | This work is licensed under a Creative Commons Attribution 4.0 International License, which permits unrestricted use, distribution, and reproduction in any medium, provided the original work is properly cited. |