DOI:10.32604/csse.2022.022319
| Computer Systems Science & Engineering DOI:10.32604/csse.2022.022319 | |
| Article |
The Double Edge Sword Based Distributed Executor Service
1Department of Information Technology, Hazara University, Mansehra, 21300, Pakistan
2Hamdard Institute of Engineering and Technology, Islamabad 44000, Pakistan
3College of Computing and Information Technology, The University of Bisha, Bisha, Saudi Arabia
*Corresponding Author: Faisal Bahadur. Email: faisal@hu.edu.pk
Received: 03 August 2021; Accepted: 06 September 2021
Abstract: Scalability is one of the most important quality attribute of software-intensive systems, because it maintains an effective performance parallel to the large fluctuating and sometimes unpredictable workload. In order to achieve scalability, thread pool system (TPS) (which is also known as executor service) has been used extensively as a middleware service in software-intensive systems. TPS optimization is a challenging problem that determines the optimal size of thread pool dynamically on runtime. In case of distributed-TPS (DTPS), another issue is the load balancing b/w available set of TPSs running at backend servers. Existing DTPSs are overloaded either due to an inappropriate TPS optimization strategy at backend servers or improper load balancing scheme that cannot quickly recover an overload. Consequently, the performance of software-intensive system is suffered. Thus, in this paper, we propose a new DTPS that follows the collaborative round robin load balancing that has the effect of a double-edge sword. On the one hand, it effectively performs the load balancing (in case of overload situation) among available TPSs by a fast overload recovery procedure that decelerates the load on the overloaded TPSs up to their capacities and shifts the remaining load towards other gracefully running TPSs. And on the other hand, its robust load deceleration technique which is applied to an overloaded TPS sets an appropriate upper bound of thread pool size, because the pool size in each TPS is kept equal to the request rate on it, hence dynamically optimizes TPS. We evaluated the results of the proposed system against state of the art DTPSs by a client-server based simulator and found that our system outperformed by sustaining smaller response times.
Keywords: Software-intensive systems; distributed executor service; load balancing; overload monitoring; multi-threading; thread pool; performance
The drastic revolution of computing world in the era of Internet and www revealed new server side architectures that travelled from concurrency to parallelism to distributed, grid and cloud computing architectures. In this whole journey, the most desirable factor has been performance that is mostly dependent on the middleware that drives server-side applications. It is the middleware that makes server-side applications scalable, highly available and highly performant. The most vital approach used by the middleware to improve system performance is TPS that is a multithreading architecture that handles incoming requests or events simultaneously. TPS is also known as executor service. A TPS architecture consists of a request queue, a pool of threads (workers) and most important, the optimization policy, that dynamically optimizes pool size to give better performance. Smaller than the optimal pool size wastes processing resources and requests wait most of the time for the availability of thread, that suffers response times and throughput. On the other hand, large pool size than system’s capacity increases thread related overheads that suffer response times. These overheads ultimately make the system busy most of the time to manage these overheads instead of letting threads execute requests, thus degrade system performance. These overheads include context switching overhead, scheduling overhead and synchronization overhead. Furthermore, if there are more shared resources between threads, then more synchronization causes additional scheduling overhead that further reduces system performance. Thus, the key concern in TPS-based systems is the dynamic optimization of thread pool size that avoids too small or too large pool size in order to elude execution time overhead. The experimental studies have proved that it is the most significant factor that effects the overall performance of applications.
Determining the optimal size of thread pool dynamically on runtime is a challenging problem. Therefore, majority of the commercial server applications use bounded TPS, where thread pool size is specified empirically by minimum and maximum limits at server initialization time and the optimization policy makes the size float between these limits on system demand. However, when system demands more threads beyond the maximum limit then requests are ultimately queued up and experience large wait times. The unbounded TPS on the other hand, avoids specifying upper limit and keeps thread pool size equal to the request rate. However, high load condition may result in very large thread pool size (than system capacity) that suffers system performance. Thus, dynamically setting an appropriate upper bound of thread pool size in unbounded TPS is significant to avoid overload condition.
The diversity of target servers where TPSs are deployed makes optimization policy more challenging, as there are different characteristics of the deployment system with a different nature of tasks. Thus, the TPS has been evolved into DTPS [1] (also called distributed executor service) where a central server distributes incoming client’s requests to all instances of TPS running in backend servers. There are two main issues in DTPS. First, maintaining an optimal thread pool size at each instance of TPS is significant to prevent the overload condition, otherwise it suffers response times. Second, the load balancing between TPSs is another critical issue where a fast overload recovery procedure of TPS is needed. In this regard, resource level load balancing is used in DTPS presented in [2], where unbounded TPSs used memory utilization as an overload detection metric. The load balancer supervises the memory resources of all TPSs and distributes requests according to the available memory in TPS. However, memory utilization is a low level metric that cannot be used as an actual pointer to the overload condition, because some other resource may be the cause of bottleneck even on efficient memory utilization, hence it has been reported in [3] that resource level metrics are too coarse to locate the overload condition. Moreover, resource level metrics are not directly related to end user experience, thus memory-utilization metric does not provide reliable response-time outage [4]. On the contrary, the application level metrics indicate top-level health of server that are more important for observability and these metrics quickly detect the problem and internal health of the system. In this regard, a round robin load balancing is used in DTPS presented in [5] that utilized throughput decline to detect the overload in unbounded TPS. The DTPS used a heuristic overload recovery by restoring the size of thread pool to the last stable state on which the TPS was running gracefully. The objective of keeping the throughput parallel to the request rate was achieved in [5], however, throughput may result in either resource over-provisioning or lack of responsiveness due to non-uniform traffic load in multi-tier applications [6]. Furthermore, higher throughput does not mean reliable response times for all clients [7,8]. Regarding load balancing strategy, no consideration is taken in the load balancing policies of [2,5] to overcome the overload quickly by reducing the request rate on overloaded TPS based on the intensity of overload and shift the load towards other gracefully running nodes.
In order to overcome the aforementioned limitations of DTPSs, we present a new DTPS that uses collaborative round robin load balancing. Our new DTPS uses a robust application level metric (queue average wait) to detect the overload condition in unbounded TPS. The average-wait of the requests (waiting in the queue for the availability of thread) is periodically calculated. The value of average-wait beyond a threshold specifies large number of threads in the pool than system capacity that indicates an overload condition. Thus, the current request rate at TPS is passed as an overload point to the load balancer. Consequently, the collaborative round robin scheduler in the load balancer adopts a collaborative policy with overloaded TPS. Its robust load-deceleration technique, which is applied to the overloaded TPS has the effect of a double-edge sword. On the one hand, it adopts such a load on the overloaded TPS which is according to its capacity, on the other hand, it sets an appropriate upper bound of thread pool size of overloaded TPS, because the pool size at each TPS is kept equal to the request rate on it. The scheduler decelerates the request rate on overloaded TPS proportional to the intensity of overload point, hence recovers overload condition quickly and improves response times. The remaining workload is shifted towards other gracefully running TPSs. The request rate on overloaded TPS is decelerated by specific percentage which is based on the overload point of TPS. The higher the overload point, the more the request rate is decelerated. This research work assumes that the load balancer is reliable, while the mechanism to ensure reliability is out of scope of this work.
The rest of the paper is organized as follows. Related work is given in Section 2. Design of the proposed system is presented in Section 3. Section 4 is a validation of the proposed system. And finally, the conclusion and future work are presented in Section 5.
The first mathematical model for dynamic optimization of TPS was presented in [9]. This model presented a relationship between the request rate, pool size and the costs of thread creation, destruction and context switching. In practical however, thread-related costs are very difficult to estimate accurately by server applications. For example, the context switch places at the operating system level, hence a server application might need in-kernel latency profiling tool that further consumes system resources and effects system capacity.
The fundamental theorem in queuing theory known as Little’s law [10] is the most basic way to configure thread pool size. Thus, this law has been used in the research works [11–13] to optimize thread pool size. The queuing law considers the request arrival rate and the service time of requests to configure pool size. In [11], a multiple request queue scheme is utilized where a single pool of thread serves multiple request queues and each queue stores particular type of requests. URL is used to classify the type of request. Each request arrived at the server is pushed to its corresponding queue by using a lookup table. Each queue is allotted specific number of threads in the pool based on its weight that is calculated by average service time of waiting requests and request arrival rate. Similarly, the Little’s law is used in the dynamic thread pools of a real-time middleware [12], that is developed for IoT environment. This work uses different thread pools to receive, process and retransmit requests that are running in distributed IoT environment. It optimized thread pools, based on arrival rate of packets and packet’s retransmission time. The work in [13] is based on the performance improvement of n-tier web architectures running in the cloud domain. They devised an iterative algorithm for thread pool optimization by combining queuing laws and data measurement of each tier in distributed system. They adopt an offline system profiling strategy and run the algorithm on n-tier system for 100 min in order to generate near optimal thread pool size of each tier. Algorithm first identifies critical resources of each tier that saturates on increasing workloads. Next, a near optimal pool sizes are configured for identified bottlenecked tiers in order to avoid hardware saturation and finally, the remaining tiers that were not saturated are also configured by proper thread pool sizes by applying queuing law. These offline results are then applied to the online system during system reconfiguration phase in the cloud. The problem in optimizing pool size using queuing law is the service time of requests which are unknown at schedule time. These service times must be estimated based on the past experience by a proper verified model. However, the estimates could be off by orders of magnitude, as service time of requests is not always constant and may be affected by number of factors including context switch time, thread contention. Hence, some research works only considered the request arrival rate and predicted the rate, so that an appropriate pool size can be set before that request arrival.
Schemes have been presented in the past to predict the future request arrival rate, and set the pool size equal to the request rate. In this regard, reference [14] presented a prediction based TPS that creates threads in the pool in advance by Gaussian distribution. The scheme periodically computes the rate of change in the pool size (number of threads). This rate is used as a coefficient of linear equation to identify the expected number of threads in the future and set the pool size accordingly. However, predictions may be inaccurate due to the synchronization overhead. Another prediction based TPS is presented in [15] that calculates exponential moving averages of change in pool size. However, redundant threads were created by this TPS if predictions are wrong. TPS developed in [16] was extension of [15]. This TPS analyzed trends of time series in order to avoid redundant threads. However, its downside was creation of lacking threads.
Some research works have been used the divide and conquer approach to optimize thread pool size. The TPS presented in [17] applied a divide and conquer approach to divide a task into subtasks and run those subtasks in parallel by pool of threads in order to reduce computational cost. Similarly, the reference [18] implemented a round robin based TPS in the software stack of their simulation system (SMAUG). This TPS repeatedly distributes the task of preparing simulation data across multiple threads in the pool and achieves performance of software stack in the data preparation and finalization. The problem with this parallel processing approach is the logical division of a task into subtasks on runtime, which is very difficult.
The fuzzy and heuristic approaches have been attempted in TPS optimization. The TPS presented in [19] uses a model fuzzing approach in order to optimize pool size. However, number of constraints and parameters were applied for dynamic optimization of TPS which is too difficult to rapidly make a decision, hence this scheme is not suitable for the system having frequent change in request rates. A heuristic approach is presented in [20] to find a near optimum thread pool size. The objective of the work in [20] was to increase the execution performance of integration process by using thread pool. They used set of algorithms that generates different thread pool configurations to process a task in time efficient manner. These configurations are iteratively applied to process a specified task. Finally, the best configuration is selected that will execute a task in shorter time. The winning thread pool configuration is then selected as a thread pool size. However, systems having variation in the nature and size of messages executed by the task can affect this algorithm.
The resource level metrics have been used in TPS optimization. The CPU-utilization metric is used in [21] to optimize thread pool size, where a lower bound and upper bound of utilization-threshold are defined and a function repeatedly increases the pool size when CPU utilization decreases and vice versa. However, CPU utilization alone is not a good indicator of QoS [22]. The server applications running on the back-end servers have become diverse, hence CPU utilization alone is not appropriate to exactly represent the load status of the back-end server [23], because some other resource may be the cause of bottleneck even on very low CPU utilization. Similarly, the TPS presented in [24] optimized pool size based on the performance data of threads that is associated with system resource usage. It collects the performance data of threads in the form of thread usage to the available system resources that are updated gradually to generate historic data. The historic performance data of threads is combined with newly collected thread’s performance data to generate a cumulative data that indicates thread performance trend. This trend is analyzed over time in order to adapt certain size of thread pool. However, successively measuring different types of resource usages after short intervals consumes computational resources and decrease machine capacity [25].
The high level metrics have been used in TPS optimization. The response time is considered as a performance metric in [26,27] for TPS optimization. The optimization policies are based on response time observations. After specified time intervals, an algorithm compares successive response times on specific pool size and either increases pool size if response times are higher or decreases pool size if response times are better. However, due to the dynamics and unpredictability of the workload in application server the response time metric needs more assessment. The work of [28] is based on throughput metric. On throughput fall, the algorithm gradually increases pool size until throughput stability. In case of multi-tier applications, the response time and throughput may result in either resource over-provisioning or lack of responsiveness due to non-uniform traffic load [6]. Response time metric becomes vague and useless for server applications that have requests of different processing times, e.g., multi-tier web applications. Hence, policies [29] have been suggested to smooth response time metric to make it effective in multi-tier applications. Similarly, the throughput metric is only effective in traditional transaction processing system that serves uniform load traffic. Moreover, higher throughput does not mean reliable response times for all clients [7,8].
Some TPS optimization schemes have been presented that targeted specific machine architectures. The scheme presented in [30] is developed for GPU-based applications. In order to increase the computational speed of parallel tasks in a real-time simulation, a framework is proposed that is based on thread pool, where the size of pool depends upon particular GPU architecture running the application. Similarly, the work of [31] targeted those applications that are running in multicore CPU’s. The authors presented a framework for web servers to increase the performance of multicore CPU’s. The framework consists of stages that contains set of tasks that are processed by a thread pool which is tuned by the resource controller.
In [32], the author proved by experiments that the performance of multithreaded application based on thread pool depends not only on thread pool parameters but also on computational complexity of thread pool tuning algorithm and available computational resources. The author suggested that an optimal pool size can be achieved by assessing both computational complexity and resources.
The resource level load balancing is used in DTPS presented in [2], where unbounded TPSs used memory utilization as an overload detection metric. The load balancer supervises the memory resources of all TPSs and distributes requests according to the available memory in TPSs. There is a thread pool agent at each back-end server that is guided by the load balancer to adjust thread pool size based on corresponding back-end server load. A resource agent running in each back-end server periodically monitors server’s overload condition by accessing memory status and saves the status of memory in a data structure that is passed to the load balancer upon its request. When load balancer observes a change of load pattern at any back-end server, it first examines the memory status of corresponding server in order to assess feasibility of new thread pool size. If corresponding back-end server has enough available memory, then load balancer sends a signal to the agent in order to set a new thread pool size. However, memory utilization is a low level metric that cannot be used as an actual pointer to the overload condition, because some other resource may be the cause of bottleneck even on efficient memory utilization, hence it has been reported in [3] that resource level metrics are too coarse to locate the overload condition. Moreover, resource level metrics are not directly related to end user experience, thus memory-utilization metric does not provide reliable response-time outage [4]. Moreover, if there is no shortage of memory it does not mean that everything is satisfactory. Another DTPS presented in [5] is a Heuristic-DTPS that utilized a round robin load balancing. This DTPS utilized throughput decline to detect the overload condition in TPS. The overload recovery was done by restoring the size of thread pool to the last stable state on which the TPS was running gracefully. As discussed before, throughput may result in either resource over-provisioning or lack of responsiveness due to non-uniform traffic load [6]. Furthermore, throughput proportional to the request rate does not mean that response times are not compromising, especially in case of load spikes, as it has been reported in [33] that throughput metric does not provide the best indication of outages quickly. Moreover, higher throughput does not mean reliable response times for all clients [7,8]. Regarding load balancing strategy, no consideration is taken in the load balancing policies of [2,5] to overcome the overload quickly by reducing the request rate on overloaded TPS based on the intensity of overload and shift the load towards other gracefully running nodes.
The performance metrics presented in the literature review has shown that none of these metrics can properly target TPS because of its use in the variety of servers. The server applications running on the back-end servers become diverse with non-uniform traffic load [6], where requests are of different sizes, hence neither resource level metrics nor the presented high level metrics are adequate for TPS optimization. The resource level metrics are not fit for TPS as there is no direct relation between the utilization of a resource and the QoS of the service. The high level performance metrics are only useful for performance optimization of applications having request of almost similar sizes. Moreover, the load balancing techniques presented in [2,5] did not use any strategy to overcome the overload faster based on the intensity of overload condition.
In contrast to the aforementioned schemes, we are presenting a more robust application-level metric i.e., average wait of queued requests to detect and resolve overload condition. In a stable unbounded TPS, the requests submitted to the request queue for processing do not wait and picked up by available threads for execution, because pool size is kept parallel to the request rate. However, the increasing waits of the requests in the queue indicate that the system is no more responsive due to the low machine capacity that has wasted to manage thread related overheads. Our proposed metric is independent of request type and request size, hence more suitable for TPS optimization. Also, our proposed collaborative round robin load balancer has an effect of double-edge sword, that not only recovers the overload quickly by maintaining an affordable load on the overloaded TPS, but also sets an appropriate upper bound of thread pool size of overloaded TPS, because the pool size at each TPS is kept equal to the request rate on it. The overload monitoring scheme is running in each TPS that detects the overload condition based on the average waits of queued requests that are waiting for the availability of thread. The monitoring scheme periodically compares queue average waits and reacts on upsurge of average waits beyond a threshold. In such a case, it signals current request rate as an overload point to the load balancer. Consequently, the collaborative round robin scheduler decelerates the request rate on the overloaded TPS proportional to the intensity of overload point, hence recovers overload condition quickly and improves response times. The remaining workload is shifted towards other gracefully running nodes in a round robin manner.
3 System Architecture of Proposed DTPS
In this section, we discuss the system architecture of our new DTPS shown in Fig. 1, that is composed of a load balancer and one or more unbounded TPSs (running in the backend servers). We proceed by first discussing the load balancer and next we present the architecture of TPS.
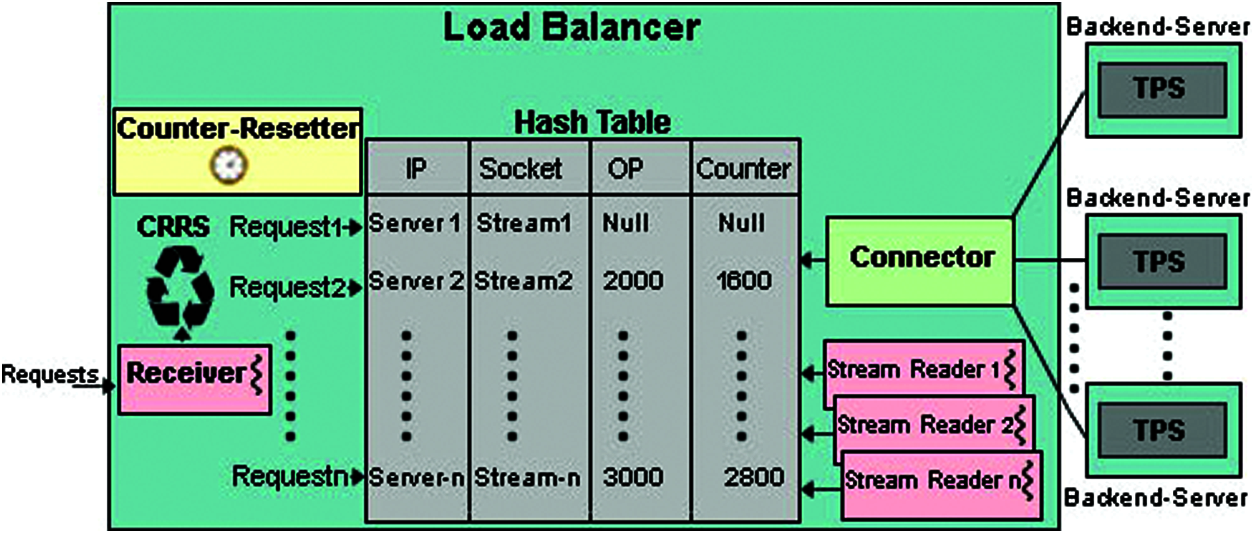
Figure 1: Distributed thread pool system with a collaborative round robin load balancer and set of TPSs at backend servers
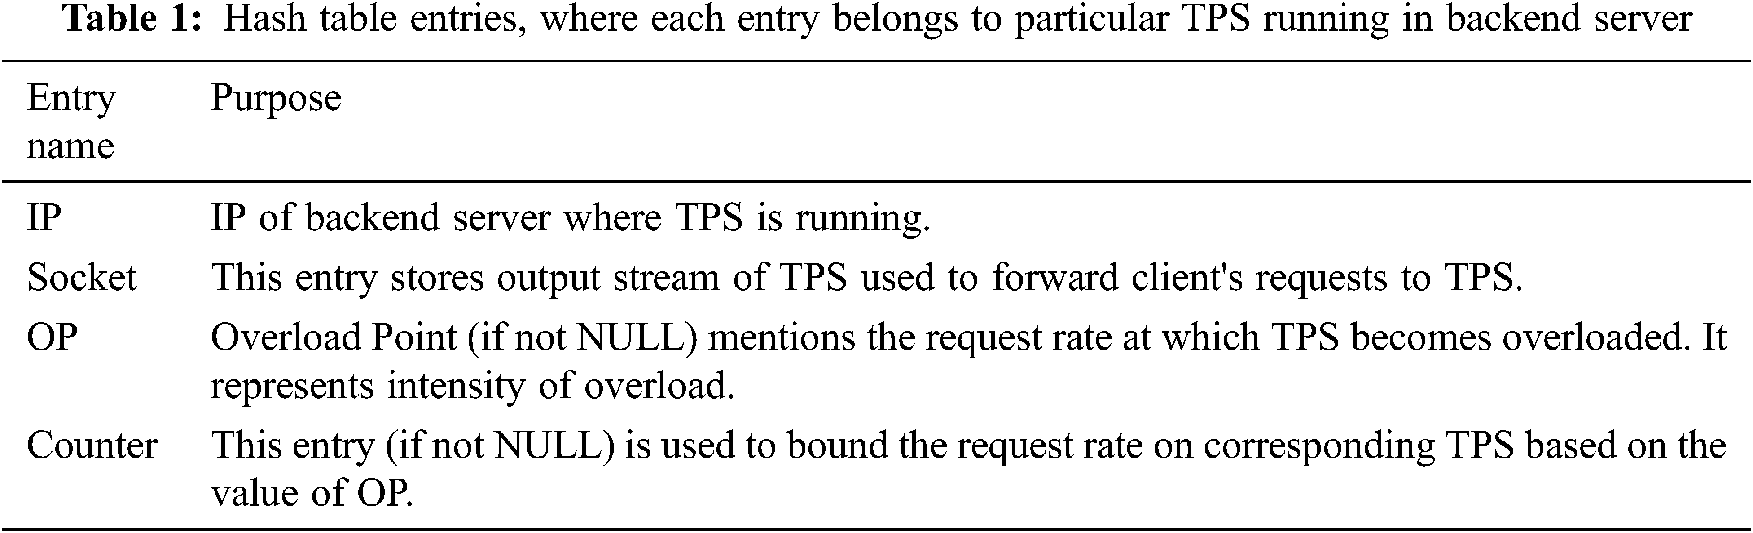
The load balancer is a central coordinator that receives client’s requests and forwards these requests to the available set of TPSs. The TPSs execute requests and send responses to the load balancer, that in turn sends these responses back to the corresponding clients. Each TPS first connects to the load balancer in order to be a part of the distributed system. The load balancer maintains a hash table that stores information of each TPS connected to it. The hash table entries are detailed in Tab. 1. The connector component of the load balancer repeatedly listens for TPSs connections. When a TPS connects to it, the connector creates a Stream-Reader thread for it, that repeatedly receives TPS responses and sends these responses back to the clients.
Moreover, the Stream-Reader may also receive overload point (OP) value sent by corresponding overloaded TPS. The OP specifies the request rate at which the TPS is overloaded. In such a case, Stream-Reader uses IP of corresponding TPS as an indexed into the Hash table by a hash function and updates OP entry in the hash table. The counter entry in the hash table is used to recover the overload condition. In case of overload condition, it is incremented on every request submission in order to keep track of the request rate on overloaded TPS. The counter reduces the request rate on overloaded TPS. It prohibits the request rate to reach the OP again in order to prevent the overload. The counter is never incremented on request submission to the stable TPS, because counter is only used to control and prevent the overload condition on the TPS. Hence, there is no need to update the counter for a TPS that is running gracefully. The Counter-Resetter is a timer thread that activates after every second and resets the values of all counters that are not null, in order to control request rate every second on overloaded TPS. The Counter-Resetter and counter are used to keep track of request rate and control the request rate per second on TPSs in order to prevent overload condition again. Both of these components of the load balancer assist the round robin scheduler to adapt the collaborative policy with overloaded TPS by decelerating the load on by specific percentage.
The collaborative round robin scheduler (CRRS) works in a round robin manner when there is no overload condition in the system. However, in case of overload condition, the CRRS adopts a collaborative policy with overloaded TPS. The working flowchart of CRRS is shown in Fig. 2.
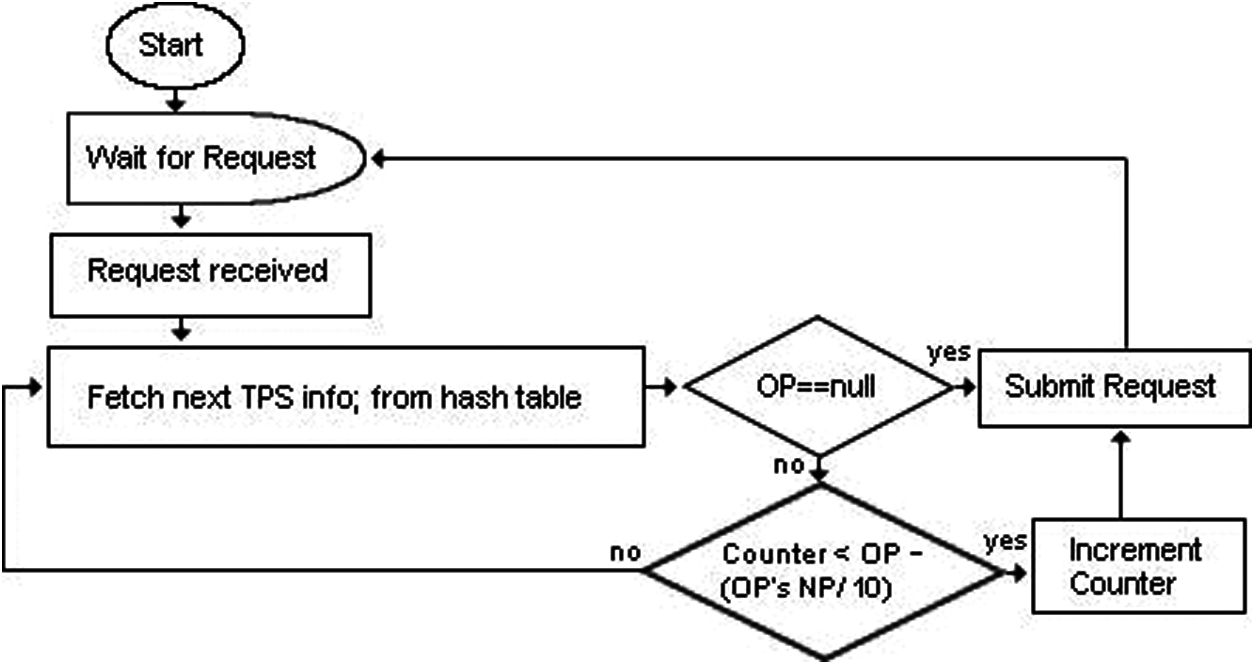
Figure 2: Working flowchart of collaborative round robin scheduler
The Receiver component in the load balancer receives client’s requests and forwards these requests to the CRRS. The CRRS repeatedly iterates through the hash table. It forwards requests to the TPSs in a round robin manner by fetching next available TPS’s information from hash table. If hash table entry specifies that OP is null, then request is sent to the corresponding TPS without incrementing its counter. Otherwise, the CRRS is restricted to decelerate the request rate to overcome the overload condition, hence it increments the counter in order to track the request rate per second on overloaded TPS. The CRRS will decelerate the request rate on TPS depending upon the value of OP (which is communicated by the TPS at backend server) at which the overload condition was detected. The OP is basically the request rate at which the TPS was overloaded at backend server. The more the value of OP that caused the overload on TPS, the large the amount of request rate reduced by the CRRS, to quickly recover the overload. This is achieved with the help of number’s placement (NP) of OP on which the overload occurred in the TPS. The request rate is decreased by 10% of the number placement of OP. Eq. (1) is used by the CRRS to decelerate the request rate on overloaded TPS.
For example, if a TPS is overload on 1200 requests per second, then TPS will send the value 1200 as an overload point (OP = 1200) to the load balancer. The number placement of 1200 is 1000, hence the request rate will be decreased by 100 requests per second and CRRS will send 1100 requests per second to the overloaded TPS. Similarly, the request rate will be decelerated to 1000 requests per second for OP = 12000. For low intensity overload, the decelerating value is also low. For example, if overload is occurred in TPS at 500 request rate (OP = 500), then CRRS will decelerate the request rate by 10 requests (i.e., counter< = 490). In case, if a TPS is overloaded again on 490 requests per second, then request rate is kept to 480, and so on. If the condition in Eq. (1) is false, then it indicates that the CRRS has sent requests to the corresponding TPS according to its capacity. Hence from hash table, the request is sent to any other graceful TPS. In this way, the remaining requests are shifted to the gracefully running TPSs.
The overload is monitored by the overload monitoring scheme at TPS after every half second, hence this scheme quickly sets an appropriate request rate on the overloaded TPS which is according to its capacity. Furthermore, this approach sets an upper limit of thread pool size in TPS (discussed in the next section). Since we used unbounded TPS at backend servers, thus a controlled request rate by CRRS on the overloaded TPS ultimately creates an appropriate thread pool size, hence optimizes TPSs.
3.2 Unbounded Thread Pool System
In this section, we discussed the system architecture and operational flow of TPS, that is composed of collection of components as shown in Fig. 3.
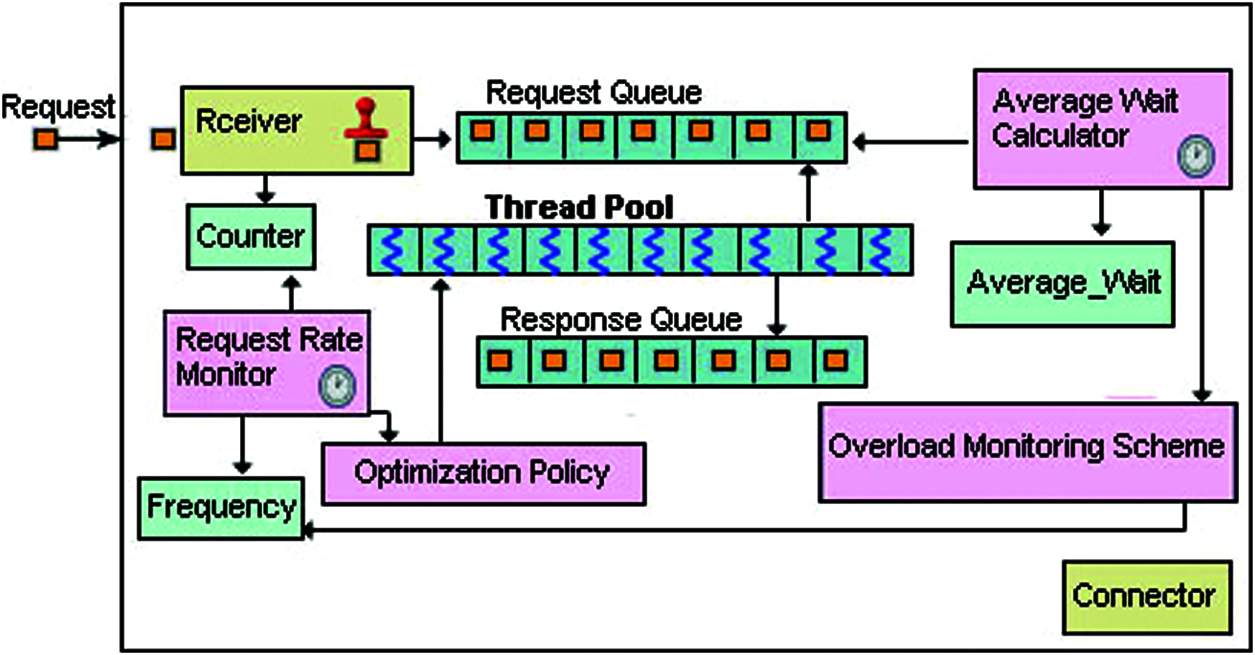
Figure 3: System architecture of TPS running in backend-server
When a TPS starts, it initializes a thread pool, the request and response queues. Initially, the thread pool is allocated threads equal to the number of cores in the system. On runtime, the pool size is kept equal to the request rate on TPS. Each thread has a Timer object that starts when a threads becomes idle. The Timer destroys its corresponding thread if it is idle for 500 ms. This reduces the pool size when the request rate gradually falls. After initializing thread pool and queues, the TPS connects with the load balancer. If it is connected successfully, then TPS starts its Receiver thread, that waits for request arrival. Receiver thread repeatedly receives client’s requests (that are forwarded by the load balancer), marks a time stamp on request and submit it to the request queue which is a producer consumer FIFO queue. The time stamp mentions the time the request entered in the system. It assists in calculating the total wait time of request in the queue. The request has to wait in the request queue, until a free thread is available. If there is an optimal number of threads inside thread pool, then every request is immediately picked up by a free thread as soon as it is inserted into the queue. Receiver also increments a synchronized object named Counter on each request arrival. The Counter is used to keep track of request rate. On arrival of the very first request, the TPS starts request rate monitor. The request rate monitor is a timer thread that keeps track of request rate. It activates after every second and assigns the Counter to the Frequency object and sets the Counter to zero. The request rate monitor keeps the current request rate and the last highest request rates in Frequency object. Finally, the request rate monitor runs optimization policy thread and passes it a copy of Frequency object in order to optimize thread pool size (if required).
The optimization policy thread reads the current and the last highest request rates from Frequency object and compare these rates. If current request rate is greater than the last highest request rate, then optimization policy optimizes pool size by keeping it equal to the current request rate. Finally, the optimization policy starts Average Wait Calculator (AWC) thread and exits. The AWC monitors the effect of pool size optimization on the system. The AWC is a timer thread, that keeps track of average wait of queued requests that are waiting inside the request queue for the availability of thread in order to run the request. Initially, this thread is activated by the optimization policy after very first optimization of pool size and later it repeatedly performs its job after every 500 milliseconds. Eq. (2) is used by the AWC to calculate the queue average wait. For all requests from 1 up to n that are waiting in the queue, the wait time of i-th request is calculated by arrival time of i-th request and current time, and the sum of waits of all requests is calculated and divided by the queue size n.
The AWC thread saves the result of eq. (2) in Average-Wait object. The AWC thread updates this object after every 500 ms and also keeps the last updated value in this object for comparison. After updating this object, the AWC starts overload monitoring scheme and also passes a copy of this object in order to detect the overload. The overload monitoring scheme is a thread that monitors and controls overload condition in its TPS. It is always started by the AWC. It reads current and previous average waits (of queued requests) from Average-Wait object and calculates percentage increase. If percentage increase is greater than specified threshold (10%) then it indicates an overload condition. This mentions that the current request rate is not affordable for the system because it has created threads in the pool beyond the system capacity. Consequently, the overload monitoring scheme sends the current request rate as an overload point to the load balancer (to decelerate the request rate) that updates corresponding entry of OP in the hash table. The CRRS adopts the collaborative policy and decelerates the request rate on TPS until it is according to the TPS’s capacity. Keeping an affordable request rate on the TPS ultimately reduces the size of its thread pool that results in an appropriate amount of threads in the pool, hence optimizes pool size.
The threshold (percentage increase of 10%) used by the overload monitoring scheme has been determined after successive simulation tests under different loads by compromising some fundamental thread related overheads in context switching, scheduling and contention, as these overheads are prerequisites of thread management. We found this threshold working well to overcome the overload. Our goal is to enable the overload monitor scheme to respond quickly in case of increasing queue average wait in order to make response times stable. Overload monitoring scheme achieves this by threshold of 10%. The automatic tuning of this parameter will be investigated in the future work.
In this section, we are validating the proposed system by jPoolRunner [34] simulation toolkit. The simulator is based on the client-server model. Its server-tier can accommodate a TPS inside it, whereas the client-tier behaves as a load generator, that sends requests to the server-tier and receives responses. The client-tier also displays performance statistics. Testing is performed on a network of four computers with 64gb memory each, where one of these computers is running the client-tier of simulator and another one is running the load balancer and remaining two computers are backend servers running a separate instance of TPS. The backend servers are intel Xeon with 18 cores and intel quad core. The processing capacity of backend servers is different in order to evaluate the results. We validate the improved performance (in terms of response time) of our collaborative round robin based DTPS (CRR-DTPS) against RL-DTPS [2] and Heuristic-DTPS [5].
4.1 Testing on Gradually Increasing Request Rate
To conduct this test, we gradually increased the load (request rate) on the load balancer. The dynamic request rate is shown in Fig. 4, where x axis represents time in seconds and y axis represents request rate. Initially, the request rate is generated by the poisson distribution with λ = 1400. After every minute, the load gradually increased up to 200 more requests i.e., λ = λ+200. In each scheme, half of the workload is sent to each server every second. For example, in the first minute of testing, when the request rate is 1400, the 700 requests are sent to both of the backend servers each second, similarly, on second minutes, 800 requests are sent to both of the backend servers and so on. The workload is simulated by the Task object (available in toolkit) that simulates 1 kb file by sleeping for ≈100 milliseconds.
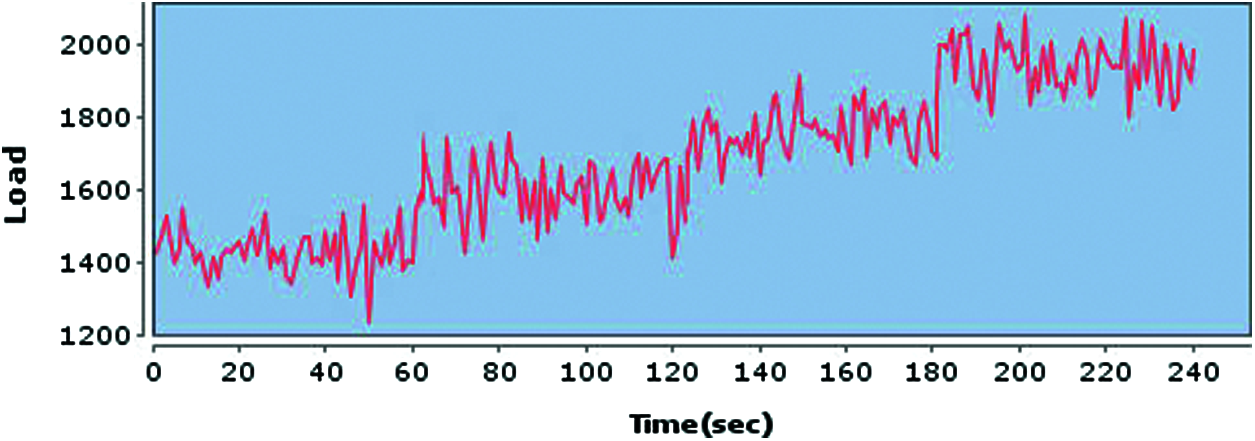
Figure 4: System load used for testing
A comparative analysis of three schemes in terms of pool size at low-processing backend server is depicted in Fig. 5, with x axis representing the time in seconds and y axis representing the pool size. The first three minutes of the test execution show that each scheme is producing pool size equal to the request rate. However, RL-DTPS did the same in the last minute. The RL-DTPS didn't find any shortage of memory, thus it kept its pool size to 1000 in the last minute too. As there is sufficient amount of memory available at backend server which can be seen in Fig. 6, thus RL_DTPS did not detect internal overload condition. Fig. 6 represents memory utilization of RL-DTPS. The memory utilization pattern (Heap) confirms that memory is not growing quickly, instead it is a flat baseline trend in form of double-sawtooth pattern where memory is gradually increases and decreases due to the small GC pauses which is necessary for reclaiming memory by GC. Heap is uplifted in the fourth minute of the test execution due to the increase of threads in the pool that can be seen in Fig. 5 that shows pool size of 1000. It can be seen in Fig. 5, that both of CRR-DTPS and Heuristic-DTPS schemes are producing same thread pool size in the last minute. The CRR-DTPS initially kept its thread pool size to 1000 at the start of the fourth minute, but its overload monitoring scheme detected overload condition by observing large queue average wait. Consequently, it sent the overload point (1000) to the load balancer, that immediately changed the load on the corresponding backend server to 900 requests per second. Thus, the pool size of 900 can be seen in Fig. 5 in the last minute. Ultimately, the load is shifted to the other high processing backend server by the CRRS. The Heuristic-DTPS also maintained same pool size as CRR-DTPS did in the fourth minute by restoring previous pool size which was 900.
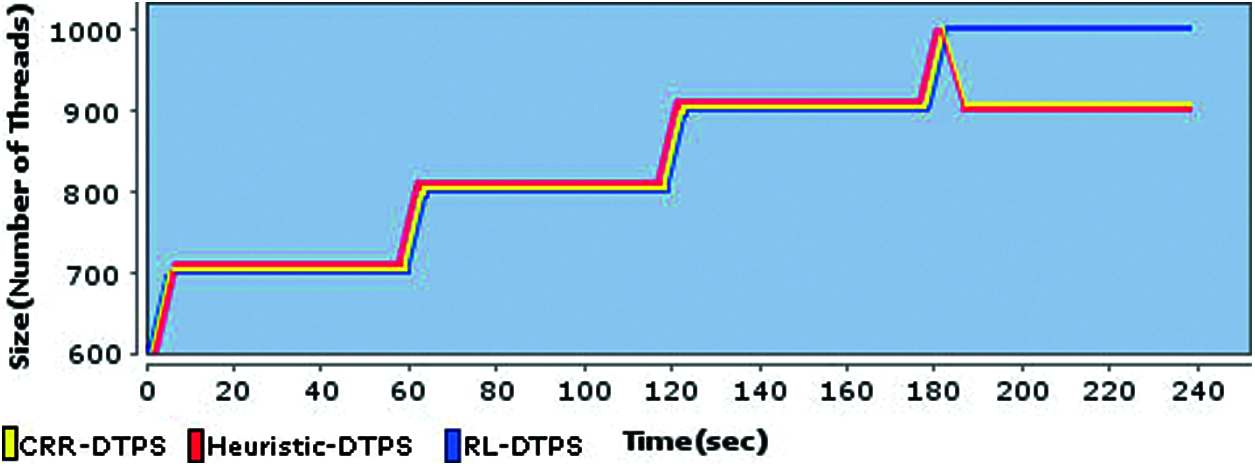
Figure 5: Comparison among pool sizes of three schemes at low processing backend server
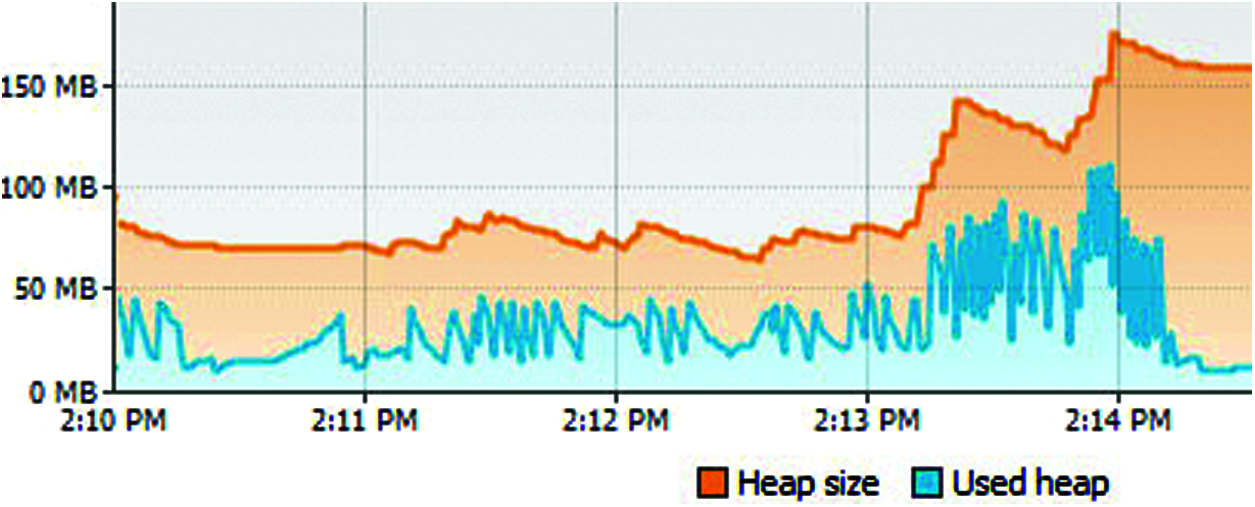
Figure 6: Memory utilization of RL-DTPS on low processing backend server
A comparative analysis of response times (of all requests) of three schemes is presented in Fig. 7, that shows that CRR-DTPS and Heuristic-DTPS are producing very small response times in the whole test run as compared to RL-DTPS.
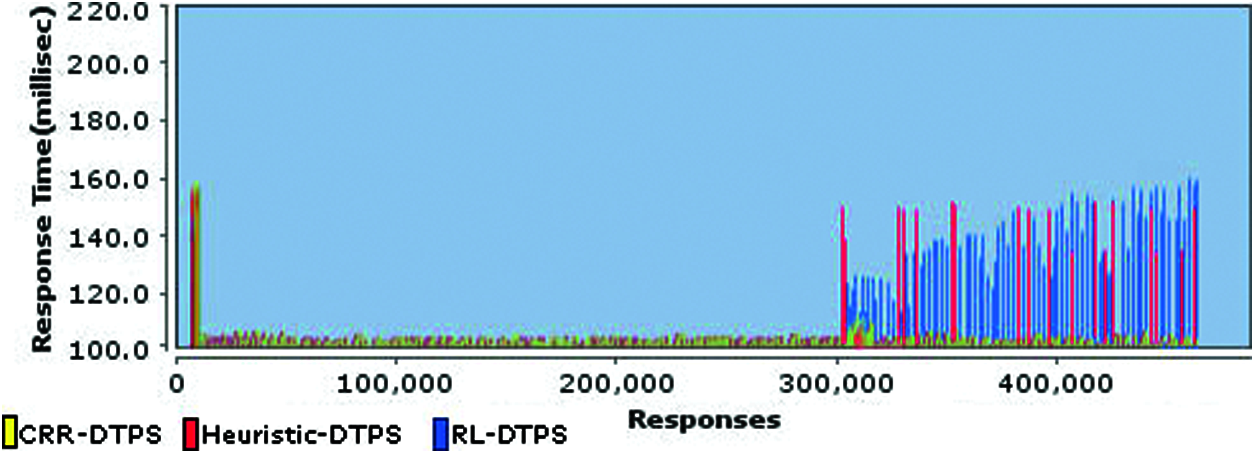
Figure 7: Comparison of response times of all requests between three schemes
The CRR-DTPS is producing efficient response times in whole test execution. It detected the overload in the start of the last minute on low processing machine and reduced request rate to 900 requests per second on it. Thus, more workload is shifted to the high processing node for improved performance. Similarly, the Heuristic-DTPS is producing efficient response times in the last minute. However, a small amount of requests suffered due to simple round robin scheme, which is unable to shift the load to the gracefully running node. The RL-DTPS is producing higher response times in the last minute, as it did not detect internal health of the system and TPS on low processing machine is overloaded, because large number of threads resulted in overheads of thread management, thread context switching and thread synchronization. Hence, system is busy in managing these overheads instead of letting threads run requests. Thus, queue wait of requests increases. Moreover, the new request arrivals on low processing machine further increased queue waits and response time. Consequently, the new requests have to wait more for the completion of the old requests. Thus, all requests on TPS of low processing machine are suffered with high response times.
The 90th percentile response time of both CRR-DTPS and Heuristic–DTPS is 100 milliseconds, while it is 135 milliseconds for RL-DTPS. Hence, CRR-DTPS produced 25.9% less response time than RL-DTPS.
4.2 Testing on Sudden Load Spike
To conduct this test, we put a sudden spike of load to overload servers. The dynamic request rate is shown in Fig. 8, where x axis represents time in seconds and y axis represents request rate. Initially, request rate is generated by poisson distribution with λ = 1000. However, we suddenly increased the request rate with λ = 2000 after 30 s. This load spike will assess the schemes in case of bursty workload. The workload here is also simulated by the Task object (available in toolkit) that simulates 1 kb file by sleeping for ≈100 milliseconds.
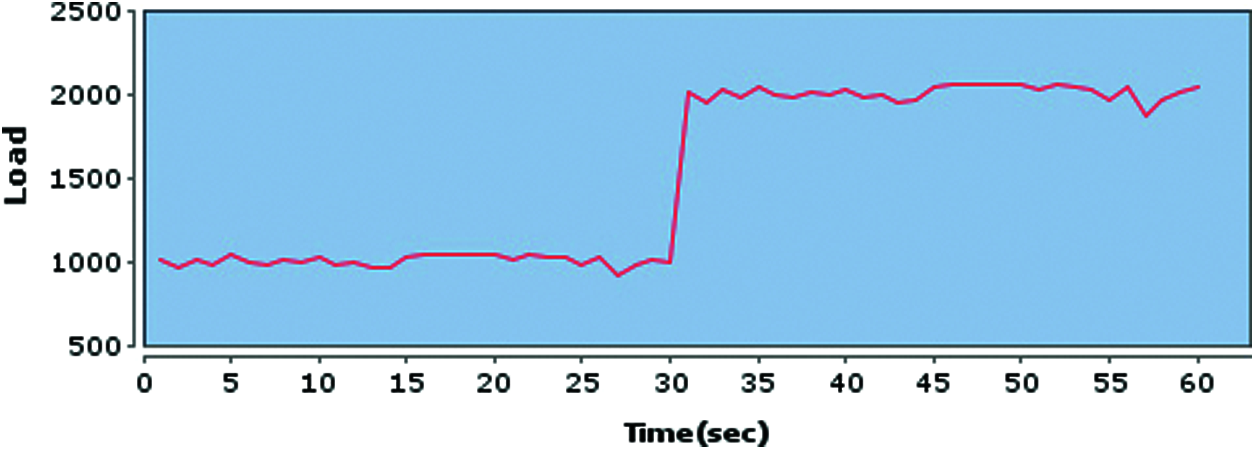
Figure 8: System load used for testing
A comparative analysis of thread pool sizes of three schemes at low processing backend server is presented in Fig. 9, that shows that the CRR-DTPS configured the pool size to 1000 on load spike (due to 1000 request rate on TPS), however the pool size gradually dropped by 100 threads in every half second and sustained to 800 till the end of test. The successive reduction of pool size is due to the increasing average waits on 1000 and 900 request rates. The overload monitoring scheme signaled these rates successively to the load balancer, as a result, the CRRS gradually decelerated the request rate. Finally, the system turned into stable state with thread pool size of 800 till the end of the test. The Heuristic-DTPS detected the overload situation too, however, it restored its pool size to previous state which was 500 and kept this pool size till the end of test. Since 500 threads are enough to complete 1000 requests (of 100 milliseconds) per second, therefore no more throughput decline is observed by Heuristic-DTPS. The RL-DTPS kept its pool size parallel to the request rate as it did in the last test.
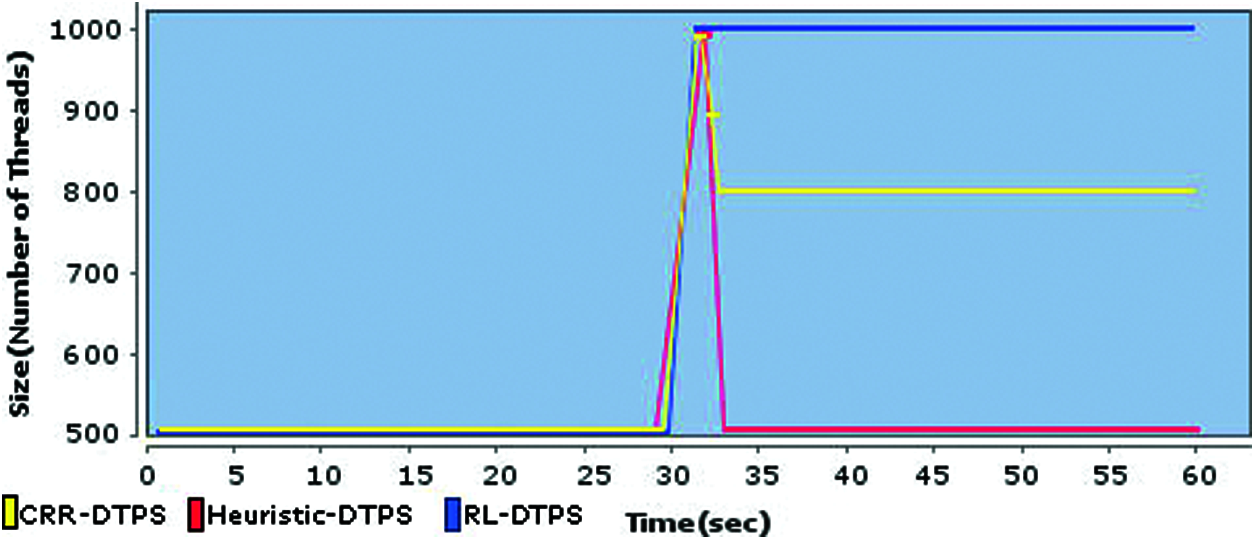
Figure 9: Comparison among pool sizes of three schemes at low processing backend server
A comparative analysis of response times of three schemes is presented in Fig. 10. It is clear in the figure, that CRR-DTPS outperformed both schemes. It can be seen in Fig. 9, that CRR-DTPS detected the overload twice after load spike, and set an appropriate pool size of 800. The remaining load is shifted to the other TPS, hence improved response times. The Heuristic-DTPS is producing higher response times for ≈500 requests each second at low processing backend server, whereas RL-DTPS is producing higher response times for all of the 1000 requests at low processing backend server. Furthermore, the response times of RL-DTPS are increasing gradually for new requests at overloaded TPS. The 90th percentile response time of three schemes are CRR-DTPS = 100 milliseconds, Heuristic–DTPS = 135 milliseconds, and RL-DTPS = 170 milliseconds. Hence, CRR-DTPS produced 25.9% less response time than Heuristic-DTPS, while its performance gain is 41% against RL-DTPS. The Heuristic-DTPS produced 20% less response times against RL-DTPS.
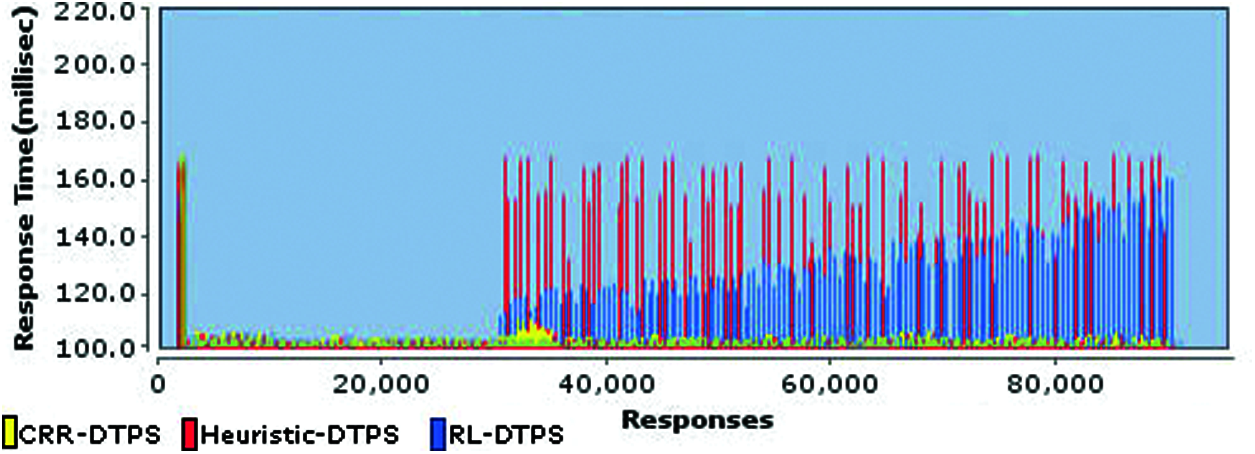
Figure 10: Comparison of response times of all requests between three schemes
It has been concluded that our new scheme outperformed other schemes in terms of response times. Furthermore, our scheme can respond effectively to both request arrival patterns of gradually increasing load and bursty load.
This paper has presented a collaborative round robin load balancing scheme for distributed thread pool system. The load balancer is backed by an overload monitoring scheme running in each TPS at backend servers. The overload monitor uses queue average-wait metric to detect the overload. The overload is quickly recovered by the collaborative round robin load balancing. The load balancing scheme has the effect of a double edge sword that not only balances the load among available TPSs according to their capacities, but also optimizes thread pool sizes of TPSs. The incoming client’s requests are first distributed to the available set of TPSs in a round robin manner. However, in case of overload situation at any TPS, the load balancer quickly decelerates the load on the overloaded TPS proportional to the intensity of overload and shifts incoming requests towards other available nodes. The load deceleration process optimizes thread pool size of corresponding TPS. The effect of the double edged sword collaborative load balancing improves client’s response times. We have compared this scheme with two other existing schemes by an open source client-server based simulation tool and the results of evaluation have proved that our new scheme is more performance efficient in terms of response time.
In the future, we will auto-tune the thresholds used in this paper. Furthermore, we will add multiple load balancers to support availability and reliability.
Funding Statement: This work is not received external funding.
Conflicts of Interest: The authors declare that they have no conflicts of interest to report regarding the present study.
1. P. Veentjer, “Distributed executor service,” in Mastering Hazelcast: The Ultimate Hazelcast Book, Palo Alto: Hazelcast, 2015. [Google Scholar]
2. M. G. Valls, “A proposal for cost-effective server usage in CPS in the presence of dynamic client requests,” in Proc. 2016 IEEE 19th Int. Symp. on Real-Time Distributed Computing (ISORCYork, UK, pp. 19–26, 2016. [Google Scholar]
3. X. Zhang, F. Meng, P. Chen and J. Xu, “Taskinsight: A fine-grained performance anomaly detection and problem locating system,” in Proc. 2016 IEEE 9th Int. Conf. on Cloud Computing (CLOUDSan Francisco, CA, USA, pp. 917–920, 2016. [Google Scholar]
4. Y. Yang, M. Varshney, S. Mohan and R. Bagrodia, “High-fidelity application-centric evaluation framework for vehicular networks,” in Proc. 4th ACM Int. Workshop on Vehicular Ad hoc Networks, Montreal, Quebec, Canada, pp. 49–58, 2007. [Google Scholar]
5. F. Bahadur, A. I. Umar and F. Khurshid, “Dynamic tuning and overload management of thread pool system,” International Journal of Advanced Computer Science and Applications, vol. 9, no. 11, pp. 444–450, 2018. [Google Scholar]
6. J. Rao and C. Z. Xu, “CoSL: A coordinated statistical learning approach to measuring the capacity of multi-tier websites,” in Proc. 2008 IEEE Int. Symp. on Parallel and Distributed Processing, Miami, FL, USA, pp. 1–12, 2008. [Google Scholar]
7. S. Ghandeharizadeh, C. Papadopoulos, M. Cai and K. K. Chintalapudi, “Performance of networked xml-driven co-operative applications,” Concurrent Engineering, vol. 12, no. 3, pp. 195–203, 2004. [Google Scholar]
8. Z. Bi and W. Zhou, “Deep reinforcement learning based power allocation for D2D network,” in Proc. IEEE 91st Vehicular Technology Conf. (VTC2020-SpringAntwerp, Belgium, pp. 1–5, 2020. [Google Scholar]
9. Y. Ling, T. Mullen and X. Lin, “Analysis of optimal thread pool size,” ACM SIGOPS Operating Systems Review, vol. 34, no. 2, pp. 42–55, 2000. [Google Scholar]
10. J. D. Little and S. C. Graves, “Little’s law,” in Building Intuition. International Series in Operations Research & Management Science, vol. 115, Boston, MA, Springer, pp. 81–100, 2008. [Google Scholar]
11. G. You and Y. Zhao, “A weighted-fair-queuing (WFQ)-based dynamic request scheduling approach in a multi-core system,” Future Generation Computer Systems, vol. 28, no. 7, pp. 1110–1120, 2012. [Google Scholar]
12. S. Jeonand and I. Jung, “Experimental evaluation of improved IoT middleware for flexible performance and efficient connectivity,” Ad Hoc Networks, vol. 70, pp. 61–72, 2018. [Google Scholar]
13. Q. Wang, S. Zhang, Y. Kanemasa, C. Pu, B. Palanisamy et al., “Optimizing N-tier application scalability in the cloud: A study of soft resource allocation,” ACM Transactions on Modeling and Performance Evaluation of Computing Systems (TOMPECS), vol. 4, no. 2, pp. 1–27, 2019. [Google Scholar]
14. J. H. Kim, S. Han, H. Ko and H. Y. Youn, “Prediction-based dynamic thread pool management of agent platform for ubiquitous computing,” in Proc. Int. Conf. on Ubiquitous Intelligence and Computing, Berlin, Heidelberg, pp. 1098–1107, 2007. [Google Scholar]
15. D. Kang, S. Han, S. Yoo and S. Park, “Prediction-based dynamic thread pool scheme for efficient resource usage,” in Proc. 2008 IEEE 8th Int. Conf. on Computer and Information Technology Workshops, Sydney, NSW, Australia, pp. 159–164, 2008. [Google Scholar]
16. K. L. Lee, H. N. Pham, H. S. Kim, H. Y. Youn and O. Song, “A novel predictive and self--adaptive dynamic thread pool management,” in Proc. 2011 IEEE 9th Int. Symp. on Parallel and Distributed Processing with Applications (ISPABusan, Korea (Southpp. 93–98, 2011. [Google Scholar]
17. M. Chen, Y. Lu, G. Zhang and W. Zou, “Real-time simulation in dynamic electromagnetic scenes using pipeline thread pool,” in Proc. 10th Int. Conf. on Computational Intelligence and Security (CISKunming, China, pp. 770–774, 2014. [Google Scholar]
18. S. Xi, Y. Yao, K. Bhardwaj, P. Whatmough, G. Y. Wei et al., “SMAUG: End-to-end full-stack simulation infrastructure for deep learning workloads,” ACM Transactions on Architecture and Code Optimization (TACO), vol. 17, no. 4, pp. 1–26, 2020. [Google Scholar]
19. J. L. Hellerstein, “Configuring resource managers using model fuzzing: A case study of the .NET thread pool,” in Proc. 2009 IFIP/IEEE Int. Symp. on Integrated Network Management, NY, USA, pp. 1–8, 2009. [Google Scholar]
20. D. L. Freire, R. Z. Frantz and F. R. Frantz, “Towards optimal thread pool configuration for run-time systems of integration platforms,” International Journal of Computer Applications in Technology, vol. 62, no. 2, pp. 129–147, 2020. [Google Scholar]
21. D. Robsman, “Thread optimization,” US Patent No. 6477561 B1, U.S. Patent and Trademark Office, 2002. [Google Scholar]
22. N. Poggi, D. Carrera, R. Gavald`a, J. Torres and E. Ayguad´e, “Characterization of workload and resource consumption for an online travel and booking site,” in IEEE Int. Symp. on Workload Characterization (IISWC'10Atlanta, GA, USA, pp. 1–10, 2010. [Google Scholar]
23. K. Vaidyanathan, H. W. Jin, S. Narravula and D. K. Panda, “Accurate load monitoring for cluster-based web data-centers over RDMA-enabled networks,” Technical Report, Department of Computer Science & Eng., The Ohio State University, Columbus, 2005. [Online]. Available: http://citeseerx.ist.psu.edu/viewdoc/download?doi = 10.1.1.60.3433&rep=rep1&type=pdf. [Google Scholar]
24. F. Muscarella, “Method and apparatus for dynamically adjusting thread pool,” US Patent No. 8185906B2, U.S. Patent and Trademark Office, 2012. [Google Scholar]
25. T. Hayashi and S. Ohta, “Performance management of virtual machines via passive measurement and machine learning,” in Proc. 2012 9th Int. Conf. on Ubiquitous Intelligence and Computing and 9th Int. Conf. on Autonomic and Trusted Computing, Fukuoka, Japan, pp. 533–538, 2012. [Google Scholar]
26. N. J. Chen and P. Lin, “A dynamic adjustment mechanism with heuristic for thread pool in middleware,” in Proc. 2010 3rd Int. Joint Conf. on Computational Science and Optimization. IEEE Computer Society, Huangshan, China, pp. 324–336, 2010. [Google Scholar]
27. N. Costa, M. Jayasinghey, A. Atukoralez, S. S. Abeysinghex, S. Perera et al., “ADAPT-T: An adaptive algorithm for auto-tuning worker thread pool size in application servers,” in Proc. 2019 IEEE Symp. on Computers and Communications (ISCCBarcelona, Spain, pp. 1–6, 2019. [Google Scholar]
28. J. L. Hellerstein, V. Morrison and E. Eilebrecht, “Applying control theory in the real world: Experience with building a controller for the .NET thread pool,” ACM SIGMETRICS Performance Evaluation Review, vol. 37, no. 3, pp. 38–42, 2010. [Google Scholar]
29. S. Guo, L. Cui, S. Liu and C. Pu, “Combining fine-grained analysis and scheduling to smooth response time fluctuations in multi-tier services,” in Proc. 2015 IEEE Int. Conf. on Services Computing, New York, NY, USA, pp. 750–753, 2015. [Google Scholar]
30. B. Hu and L. Xingguo, “Real-time simulation and optimization of elastic aircraft vehicle based on multi-GPU workstation,” IEEE Access, vol. 7, pp. 155659–155670, 2019. [Google Scholar]
31. G. You and X. Wang, “A server-side accelerator framework for multi-core CPUs and intel xeon phi co-processor systems,” Cluster Computing, vol. 23, no. 4, pp. 2591–2608, 2020. [Google Scholar]
32. I. V. Stetsenko and O. Dyfuchyna, “Thread pool parameters tuning using simulation,” in Proc. Int. Conf. on Computer Science, Engineering and Education Applications, Kiev, Ukraine, pp. 78–89, 2019. [Google Scholar]
33. P. M. Broadwell, “Response time as a performability metric for online services,” Computer Science Division, University of California, Berkeley, California, Rep. no. UCB//CSD-04–1324, 2004. [Online]. Available: http://roc.cs.berkeley.edu/papers/csd-04-1324.pdf. [Google Scholar]
34. jPoolRunnerTM: Performance testing simulation tool, http://jpoolrunner.net/. [Google Scholar]
 | This work is licensed under a Creative Commons Attribution 4.0 International License, which permits unrestricted use, distribution, and reproduction in any medium, provided the original work is properly cited. |