DOI:10.32604/csse.2022.022506
| Computer Systems Science & Engineering DOI:10.32604/csse.2022.022506 | |
| Article |
Modeling Rogowski Coils for Monitoring Surge Arrester Discharge Currents
1Department of Electrical Engineering, Faculty of Engineering, Menoufia University, 32511, Shebin Elkom, Egypt
2Department of Electrical Engineering, College of Engineering, Taif University, 21944, Taif, Saudi Arabia
*Corresponding Author: Nehmdoh A. Sabiha. Email: nehmdoh.sabiha@sh-eng.menofia.edu.eg
Received: 10 August 2021; Accepted: 10 September 2021
Abstract: Rogowski coils (RCs) are widely used to measure power or high frequency currents based on their design. In this paper, two types of RCs that are circular (traditional) and cylindrical shapes wound using wire covered by varnish are constructed. This construction is carried out to be suitable for monitoring the discharge current of the surge arrester installed in the distribution system. Concerning high frequency RC modeling for both types considering transfer function is introduced. Self-integrating for both types is attained. Therefore, the experimental tests using function generator for both coils are carried out to identify the parameters of the transfer function representing the introduced model. The measured signals for current and induced voltages are denoised for the parameter identification process. The denoised process is achieved using the MATLAB code ‘wdenoise’ while the parameters are estimated using the system identification toolbox. Verification of the proposed model is achieved using experimental results for the two coils. The sensitivity of the two coils is investigated based on the induced output voltage. The application concerning the two coils for monitoring the discharge current of the surge arrester is done. The results confirm the accuracy of the introduced RC model, as well as the performance of the cylindrical shape, is better than the traditional one. The simulation is carried out using MATLAB and ATPDraw programs.
Keywords: Rogowski coil; surge arrester discharge current; frequency response; parameters dentification; denoised signal
The distribution system is subjected to lightning strokes leading to catastrophic failures due to the huge faults resulting from lightning. These lightning strokes can be direct or induced based on their location. For the distribution system rounded by high objects, the direct stroke rarely hits it and vice versa. Many studies are investigating the lightning-overvoltages and performance of distribution systems, the most recent studies are declared in [1–6].
Surge arresters are commonly used to protect the distribution systems from lightning overvoltages by discharging lightning strokes. However, they can be burned out due to excess discharge energy behind their capabilities, especially under direct lightning strokes [7,8]. Therefore, monitoring the surge arrester discharge current is essential for estimating the discharge energy and protecting it from burning out. Studying such performance needs accurate modeling for distribution systems as well as protecting devices and current monitoring devices such as Rogowski coil. All components of the distribution system have to be modeled in high frequency to be suitable for transient studies.
There are many published surge arrester models. Among these models, there is Pinceti et al. model [9,10]. It is an accurate and simple model. Also, its parameters are only represented based on the electrical data taken from the datasheet. The studies considering this model achieve a good result matched well with the corresponding datasheet of medium voltage and low voltage surge arrester as in [7,11].
Rogowski coil has many advantages such as simplicity of construction, use, and modeling as well as the capability for measuring currents in a very wide range of amplitudes and bandwidths. Therefore, the Rogowski coil is widely used in many applications such as monitoring partial discharges [12–14], transient currents [7,15–18] as well as power frequency currents [19]. For modeling Rogowski coil, there are two main models, lumped and distributed, which are suitable for high frequency measurements [20]. There are two modes of Rogowski coil, the current mode where the induced voltage is proportional to the current (Self-integrating Coil) and the differential mode where the induced voltage is proportional to the derivative of the current (Differentiating Coil) [21–23]. The advantage of the self-integrating coils is that no external circuit is needed for integration to get the required measured current. Accordingly, it is appropriate for the applications of monitoring the arrester discharge current as considered in this study.
One of the applications of Rogowski coil is recently surge arrester discharge current monitoring as report in [7]. However, the integration Rogowski coil is utilized for this application. Also, there was no design introduced for this application directly. This ensures the importance of this study to continue to the research related to the application of self-integrating Rogowski coil for monitoring the arrester discharge current efficiently and simply.
In this paper, two types of RCs circular and cylindrical shapes are constructed. The model of each coil is experimentally proposed as a black box represented by the transfer function for the coils to be self-integrated. Therefore, the experimental tests are carried out using a function generator to generate square pulses for the input current. Then, the order and parameters of the introduced transfer function for each coil are estimated using the system identification toolbox in MATLAB software. Also, the experimental signals for current and induced voltages are denoised using MATLAB software. The accuracy of the proposed model is experimentally verified where the coils are simulated using TACS in ATPDraw. Finally, the proposed model is used to monitor the discharge current of a medium voltage surge arrester in the distribution network.
The contribution of the paper can be summarized as:
1. Two configurations of the Rogowski coil, circular and cylindrical shapes are constructed.
2. Experimental work to estimate the performance of Rogowski coils (RCs) is carried out using function generator.
3. Black box transfer function models using system identification based on the experimental performance are proposed.
4. The proposed Rogowski coil models are experimentally validated for the two configurations using time and frequency domains.
5. Simulation verification of the proposed model to monitor the discharge current of the surge arrester is accomplished using time and frequency domains.
2 Self-Integrated Rogowski Coil View
The Rogowski coils can be designed for attaining different output considerations that are either differentiating or integrating Rogowski coil [24]. The difference between them is formulated concerning the relationship between the current flowing in the coil windings (Ic) and the magnetic flux linking the coil windings (ϕ) due to the current threading the coil (I). For the differentiating Rogowski coils, the coil current Ic is proportional to the flux derivative dϕ/dt. This can be achieved when the Rogowski coil time constant L/R (where L is coil self-inductance and R is the total coil circuit resistance including the self-resistance and terminal resistance) is very short comparing with pulse width. However, the integrating Rogowski coil current Ic is proportional to the flux linking the coil windings ϕ. This occurs when the coil time constant L/R is greater than the pulse width [24]. This integrating coil is called self-integrating Rogowski coil, and it is appropriate for monitoring the high currents such as the dynamic surge arrester discharge currents under overvoltages of the lightning strokes in the distribution networks. For this application in the distribution networks, the physical advantages of self-integrating Rogowski coils have been exploited comparing with the differentiation Rogowski coil. These advantages are such as independent frequency response, less cable attenuation of the coil measured signals, etc. A further benefit of utilizing a self-integrating Rogowski coil is that no further integrating circuit or integrating signal processing. The response of the self-integrated coil to step input signal is analytically reported in [23,24].
3 Experimental Results and Verification
Experimental configuration for measuring induced voltage due to the current carried by the conductor is shown in Fig. 1. For achieving a self-integrated coil, the applied current has the form of square pulses [23,24]. These pulses are generated using a function generator and the measurements are recorded using a four-channel digital storage oscilloscope as shown in Fig. 1. Although the desired application in this study is to monitor the high discharge currents of the surge arresters, the utilized function generator producing low currents is utilized. Toward modeling the Rogowski coil for self-integrating applications, the input current is experimentally implemented as a square waveform. The function generator is used to generate square wave voltage applied on a resistor to produce square wave currents passing through two Rogowski coils.
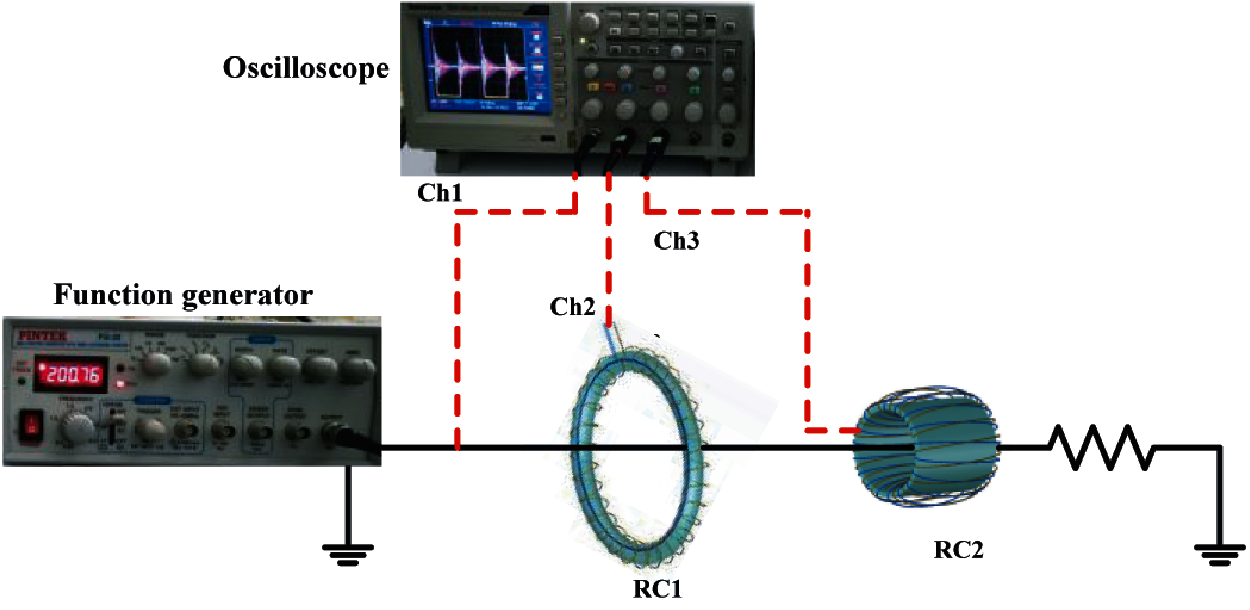
Figure 1: Experimental setup
Two shapes of the Rogowski coil are constructed and fabricated concerning the air core point of view. The first coil is circular and has 30 turns, 155 mm outer diameter, 131 mm inner diameter, and 0.85 mm wire diameter as depicted in Fig. 2a. This first coil has a return passing through the center of the core to serve as a return loop to reduce the external induces. This coil design becomes a flexible open-end design, ready for fitting around a power line or the conductor carrying the arrester discharge currents. Similarly, the second coil is designed, however with a different configuration toward attaining higher sensitivity. As depicted in Fig. 2b, it is a cylindrical shape with a higher number of turns of 36 (18 turns forward winding and 18 turns backward winding), an inner diameter of 56 mm, and an outer diameter of 60 mm.

Figure 2: Rogowski coils constructed under this study (a) Circular coil (RC1), (b) Cylindrical coil (RC2)
Fig. 3 shows the experimental measurements of tests applied to measure the input current threading the coils and the output voltages of the two coils under study. Fig. 3a includes the input square wave current with amplitude around ± 0.025 A and 200.76 kHz. This square waveform was selected as the change of the applied current from negative to positive and vice versa being a high rate of change of the current and therefore includes a wide range of frequency contents that are injected to the RC. Correspondingly, Figs. 3b and 3c show the Rogowski coils outputs that are sinusoidal decaying and reappeared every square wave input change repetition. Such induced voltage waveform (sinusoidal decaying) was referred to using an analytical model and reported in [23].
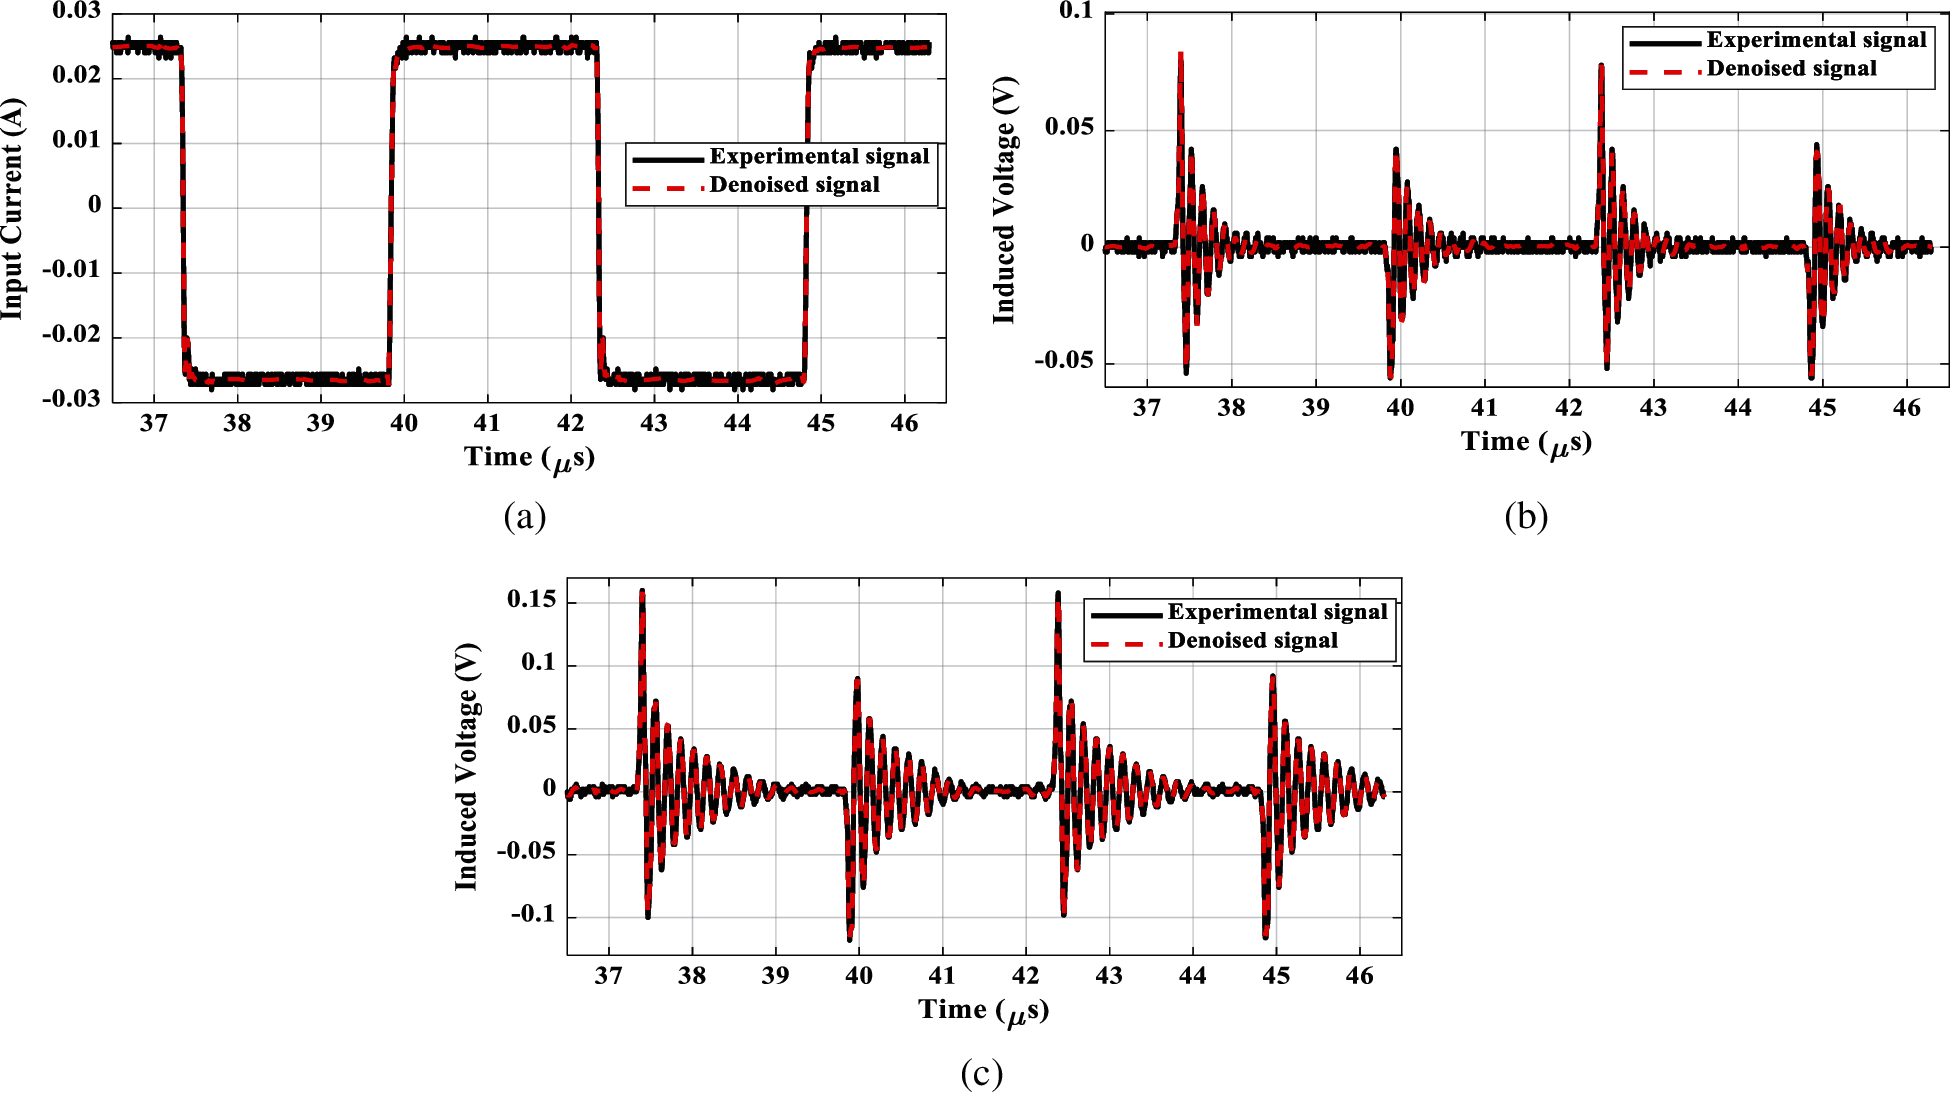
Figure 3: Experimental measurements. (a) Input signal, (b) Circular Rogowski coil (RC1), (c) Cylindrical Rogowski coil (RC2)
The subfigures presented in Fig. 3 show the experimental measurements and their corresponding denoising signals. The denoising process is accomplished using the MATLAB code ‘wdenoise’ that is Wavelet signal denoising based on empirical Bayesian method with a Cauchy prior and the mother wavelet ‘sym4’ for the time and frequency domain analyses. These denoised measurements are used for the model parameter estimations.
System identification toolbox in MATLAB software [25] is a powerful tool to investigate the best mathematical model for describing the system. It depends on applying data analysis to the experimental measurements for input-output of the system under study that is the Rogowski coil. Two Rogowski coils are designed to be suitable for high frequencies measurements, where their mode is the current mode.
Experimental tests are carried out for both coils, circular and cylindrical with the same input current in the form of square pulses generated using a function generator as described above and shown in Fig. 3a. Based on the induced voltage output for each coil as shown in Figs. 3b and 3c, the transfer function is investigated using system identification in MATLAB software for denoised measured signals. The Rogowski coils can be modeled as a black box by using a transfer function approach relating between output the V(s) and input I(s) of the coils. Using the system identification toolbox in MATLAB software, the transfer function representing the coils models are identified and verified with the output induced voltage. For circular Rogowski coil RC1, the transfer function model is:
For the cylindrical Rogowski coil RC2, the transfer function model is:
Based on the above two functions, the two Rogowski coils under study are modeled under the condition that the transfer function parameters are determined to attain the minimum error between the measured induced voltage and the voltage based on the modeled transfer function for the same input. The advantages of the proposed modeling for the Rogowski coils for arrester discharge current monitoring are its simplicity and accuracy to accomplish the discharge energy of the arrester by measuring its discharge current. Then, the action for protecting the surge arrester from burning out can be done safely.
3.3 Rogowski Coil Model Verification
For time domain and frequency response verification and evaluation, the simulated Rogowski coil performance is obtained using ATPDraw. The input signal shown in Fig. 3a is simulated using the TACS field in ATPDraw to apply the pulses on the modeled transfer functions of the Rogowski coils under study. Also, the transfer functions of the two coils represented by (1) and (2) are implemented using the TACS facilities, respectively. Then, the simulated induced voltages are obtained and compared concerning the experimental measurements (shown in Figs. 3b and 3c).
The corresponding comparison of the induced output voltages are shown in Figs. 4 and 5 in time and frequency domains for circular and cylindrical Rogowski coils (RC1 and RC2), respectively. From the comparison point of view, these figures declare the experimental denoised and simulated signals for the induced voltages of the coils. The simulated induced output voltages represent the output of the transfer function, which is simulated in TACS, ATPDraw software. The analysis to get frequency response is carried out using Fast Fourier Transform (FFT) in MATLAB. The frequency response for each coil declares its high frequency performance. As shown from these figures, the induced output voltages in time and frequency domains for experimental and simulated results are matched well. Only, at the start instant time of induced voltage waveform, the error reaches around 16% and 13% for circular and cylindrical types, respectively. This is due to the sharp steepness of the applied current front time as shown in Fig. 3a. However, an insignificant error is noticed after that time. For other waveforms of applied currents, the front time is not sharp in the form of square wave edges and sides. Therefore, the performance of RCs always achieves an insignificant error. This ensures the accuracy of the introduced transfer function representing RC for both types. However, this comparison is accomplished using the same measurements utilized for the modeling process. Accordingly, the other verification is carried out considering a different input current that is shown in Fig. 6 with approximate amplitude 0.014 A. This figure includes the experimental, experimental denoised, and simulated current waveforms. The corresponding induced output voltages are shown in Figs. 7 and 8 for circular and cylindrical coils (RC1 and RC2), respectively. The comparison between experimental signals and simulated ones for both coils declares the accuracy of the introduced transfer function representing the coils. The frequency response shows the high frequency performance for both coils. For the same reason mentioned above, only, at the start instant time of induced voltage waveform, the error is recorded to be around 20% and 13% for circular and cylindrical types, respectively. However, an insignificant error is noticed after that time. Generally, the simulated induced waveform is matched very well with the experimental results. Therefore, from the results shown in Figs. 4, 5, 7, and 8, the RC2 is expected to have more accuracy for monitoring the surge arrester discharge current as declared in the next section.
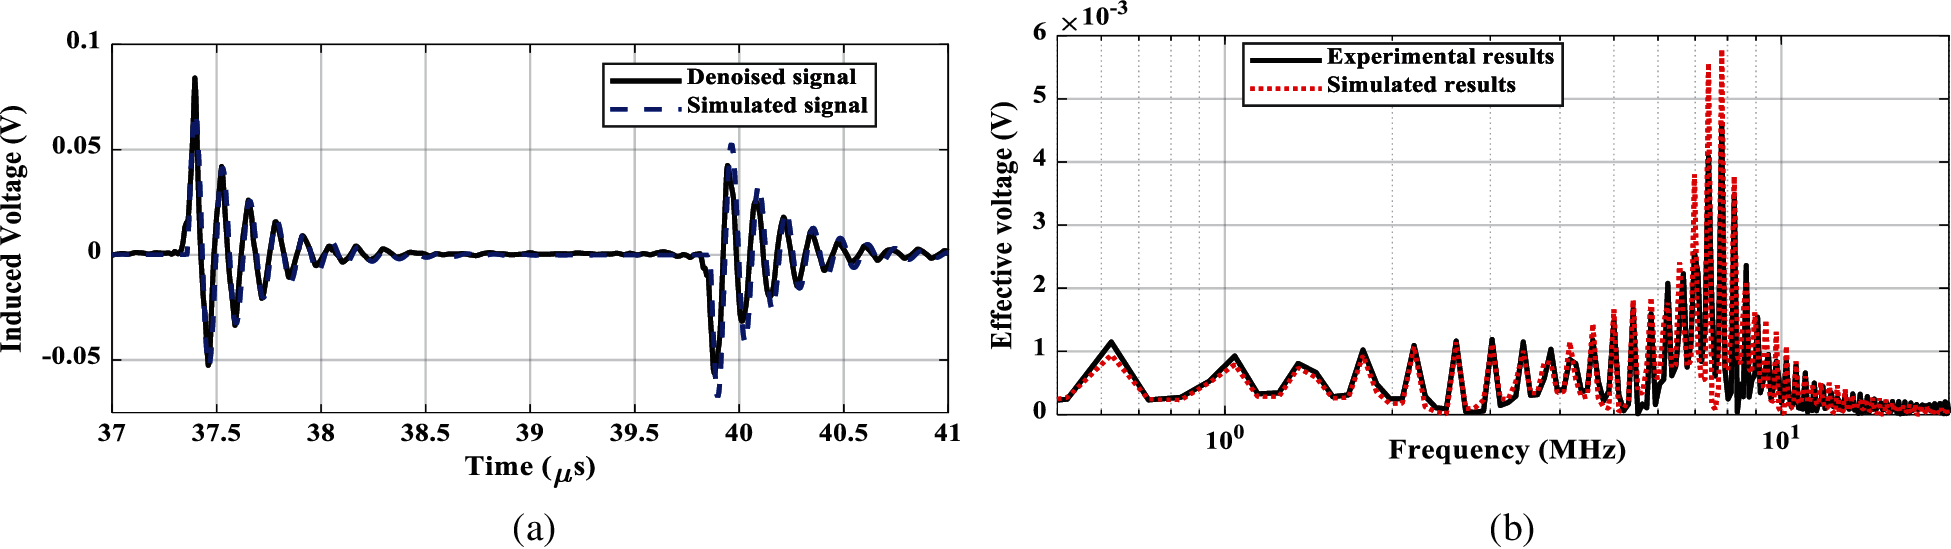
Figure 4: Induced output voltage, circular Rogowski coil (RC1). (a) Time response, (b) Frequency response
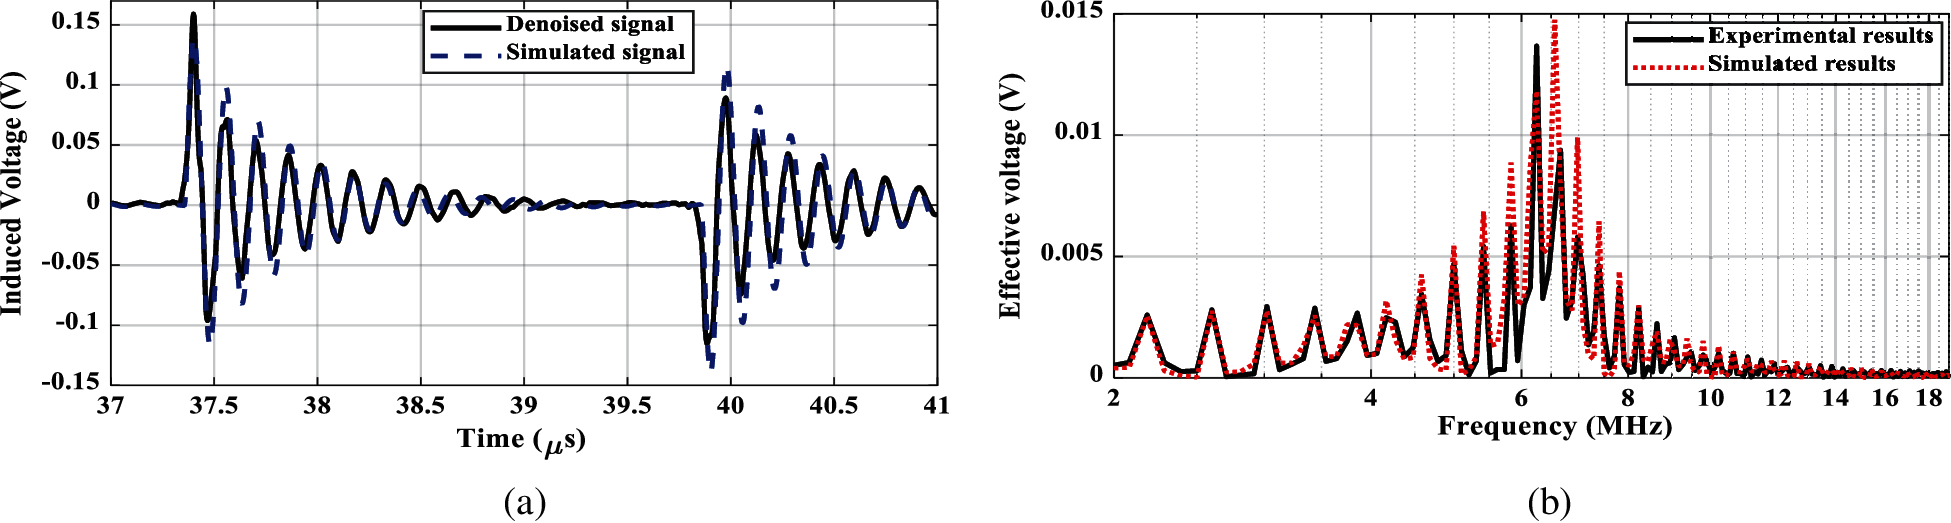
Figure 5: Induced output voltage, cylindrical Rogowski coil (RC2). (a) Time response, (b) Frequency response
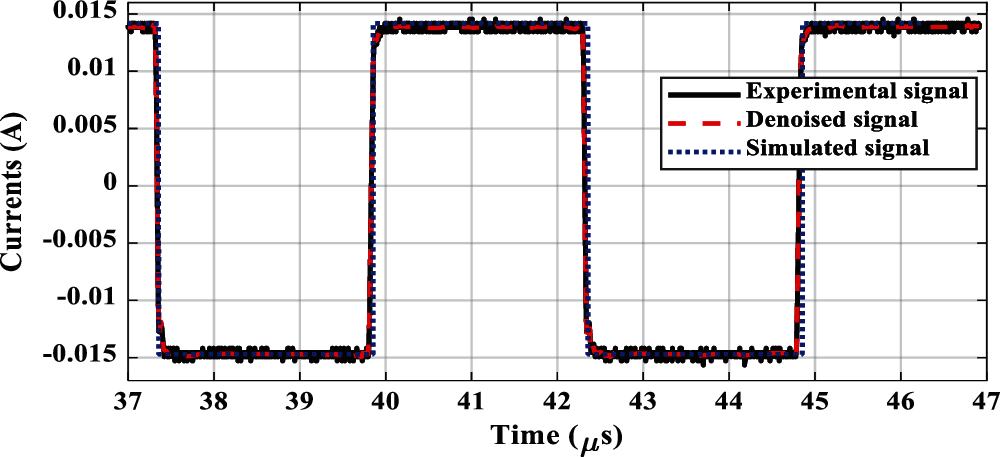
Figure 6: Input currents
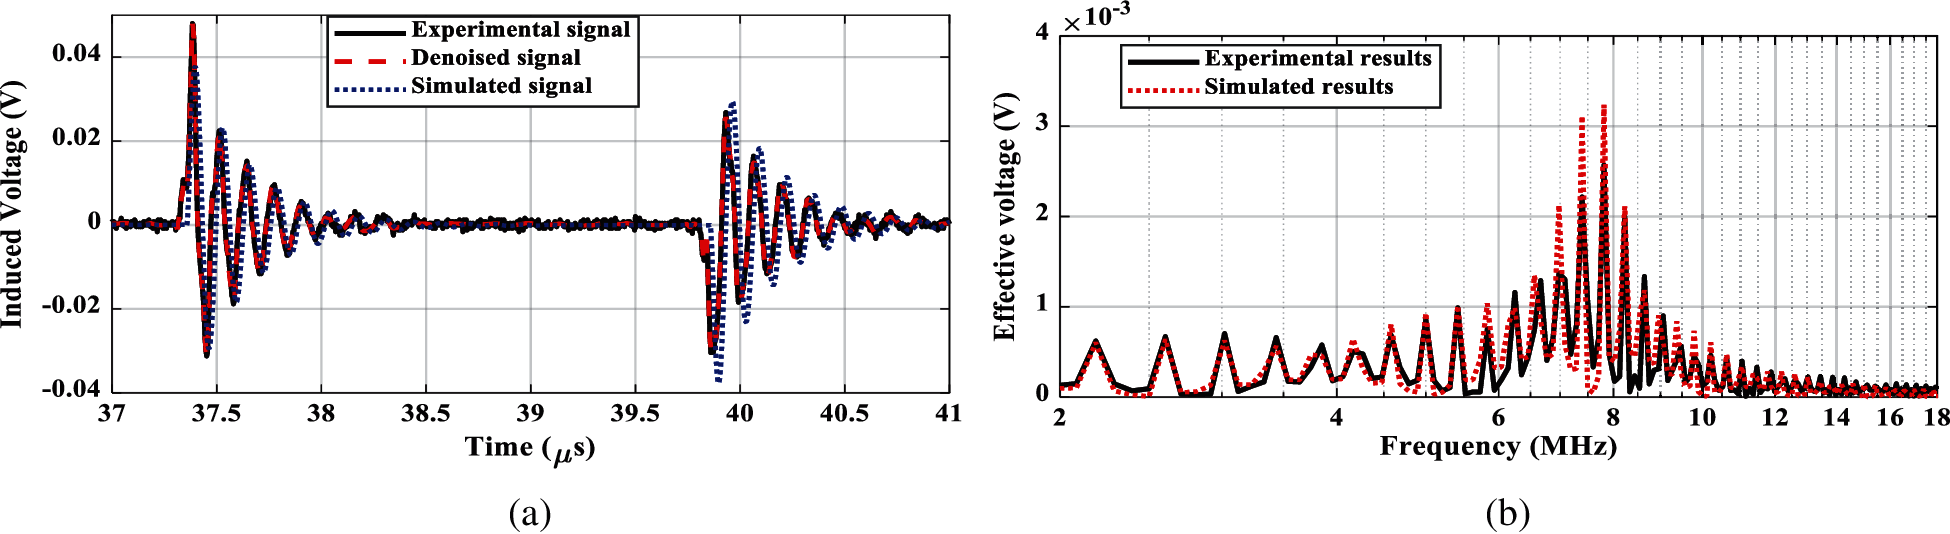
Figure 7: Induced output voltage, circular coil. (a) Time response of induced voltage, (b) Frequency response
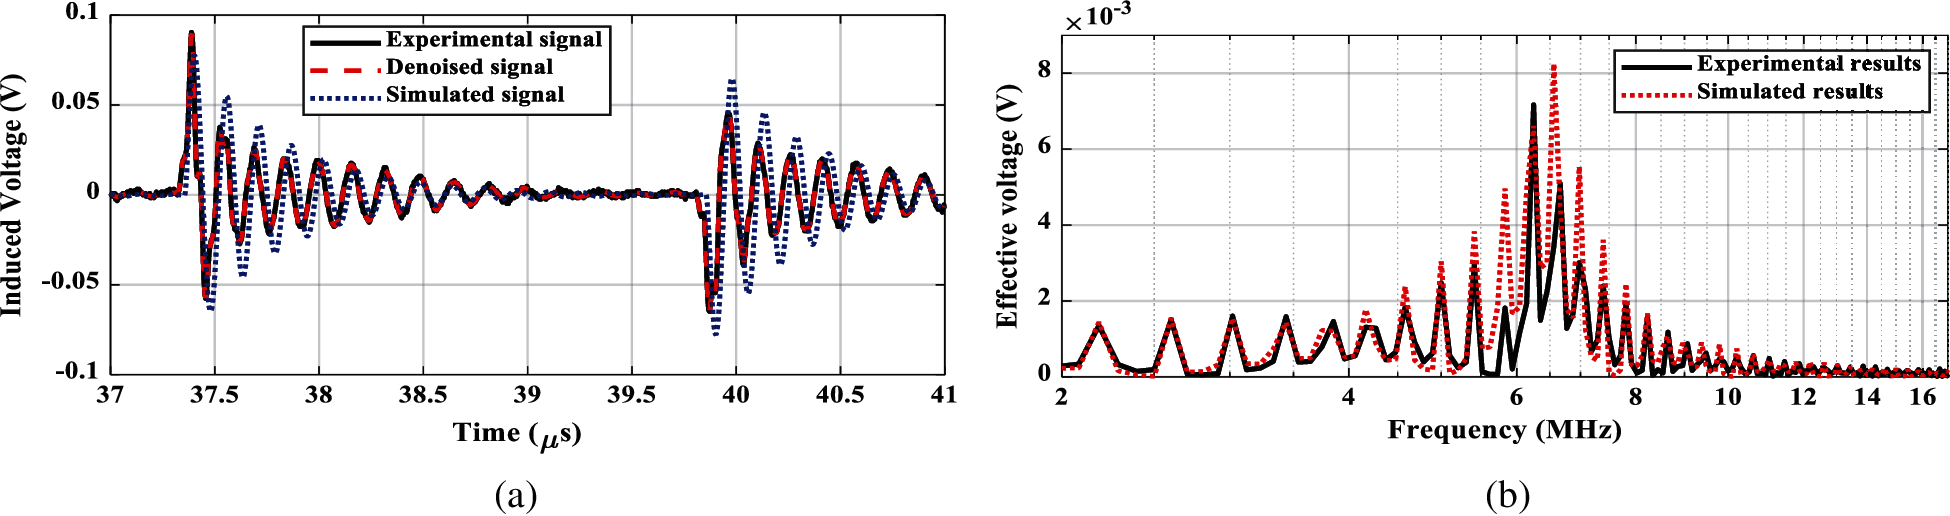
Figure 8: Induced output voltage, cylindrical coil. (a) Time response, (b) Frequency response
4 Monitoring Surge Arrester Discharge Current
In this section, the proposed Rogowski coil modeling is evaluated for monitoring surge arrester discharge currents for the electric power distribution networks. One of the motivations behind this application is that the Rogowski coil can be easily and cheaply installed with a surge arrester in the distribution system [7]. However, the Rogowski coil utilized in [7] was differentiating type, and an additional digital integrating process was implemented to monitor the arrester discharge current that was utilized to calculate the dissipating energy for controlling the triacs triggering.
Fig. 9 shows the simulated distribution network, where the simulation was done using ATPDraw. The detailed simulation of the distribution network components, such as overhead lines, transformers, etc. is reported in [7]. This distribution network is protected against lightning-overvoltage using a medium voltage (MV) surge arrester. These surge arresters are installed in main and load busbars. The direct lightning strokes affect the distribution network shown in Fig. 9 at busbar LHT. Due to this stroke, the MV surge arrester protects the distribution network from overvoltages by dissipating the lightning currents. The monitoring of this discharge current is measured using the two Rogowksi coils (circular and cylindrical, RC1 and RC2). The lightning current waveform of time parameters 10/350 μs and amplitude 10 kA is applied at busbar LHT. The corresponding discharge current of the surge arrester installed at load busbar L1, phase A is shown in Fig. 10. Although the utilized Rogowski coils are intently designed for non-integrating type, there is a difference between the coil induced voltage and the actual discharge current. This difference is compensated using gain values 300 and 90 for circular and cylindrical Rogowski coils (RC1 and RC2), respectively. These values are extracted only one time from the first test of the coils within the application.
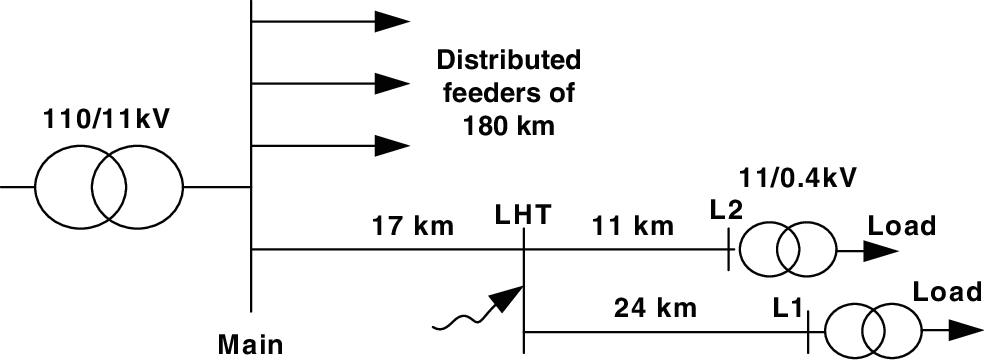
Figure 9: Simulated ATPDraw circuit of the distribution network [7]
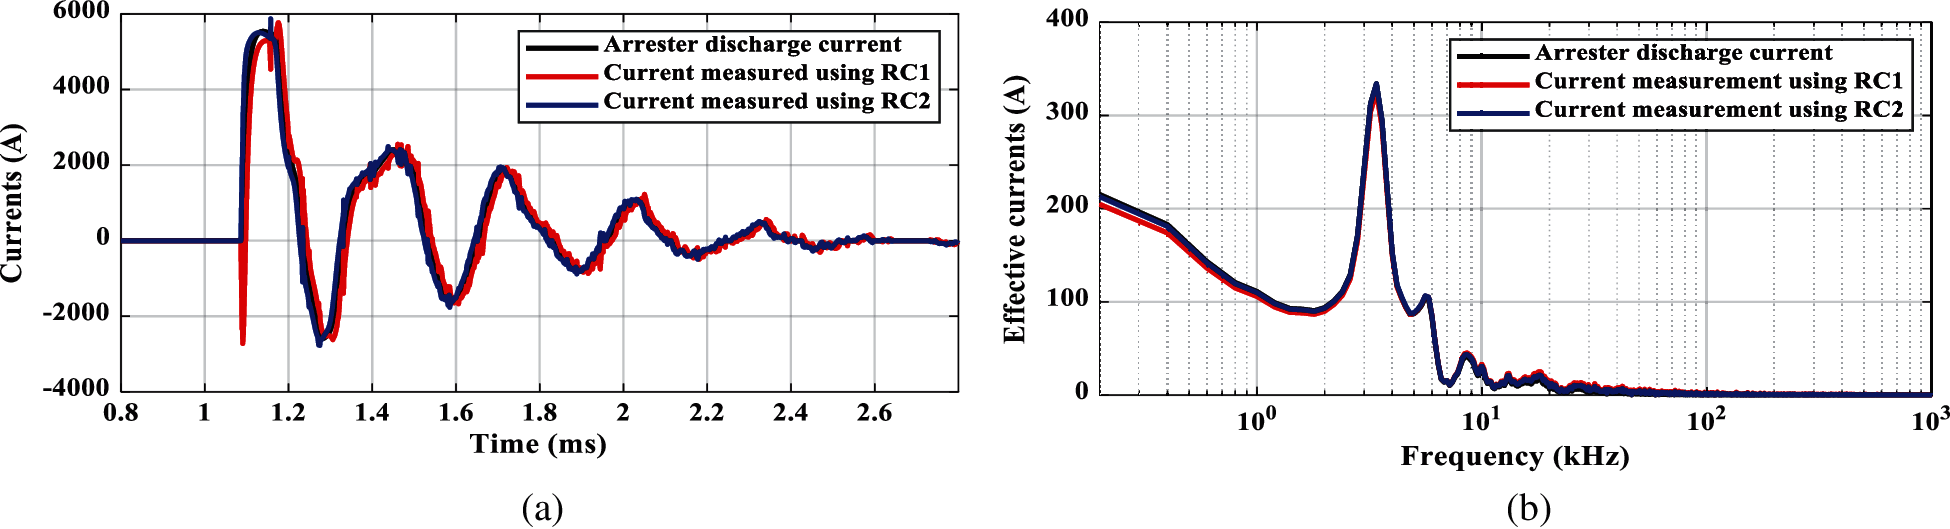
Figure 10: Measured surge arrester discharge current, phase A, busbar L1 by injecting 10 kA, 10/350 μs lightning current. (a) Time response, (b) Frequency response
Fig. 10a shows the time-domain comparison of the arrester discharge current, the current measured using RC 1, and current measured using RC2, while Fig. 10b shows the frequency analyses comparison. From this figure, the estimated discharge current using the proposed model for both coils is matched well with the reference discharge current. However, the cylindrical Rogowski coil (RC2) has a better performance than the circular coil (RC1).
Comparing the frequency response of measurements used for modeling RCs (see Figs. 4b, 5b, 7b, and 8b) and frequency content of arrester discharge current (see Figs. 10b and 11b), there is a big difference between these two frequencies where the waveforms for modeling the RC stage includes frequencies in MHz while the application waveforms of surge arrester consideration include kHz. The modeling stage is accomplished considering a wide range of frequencies including the application frequency. This is to ensure the modeling accuracy for the application under study.
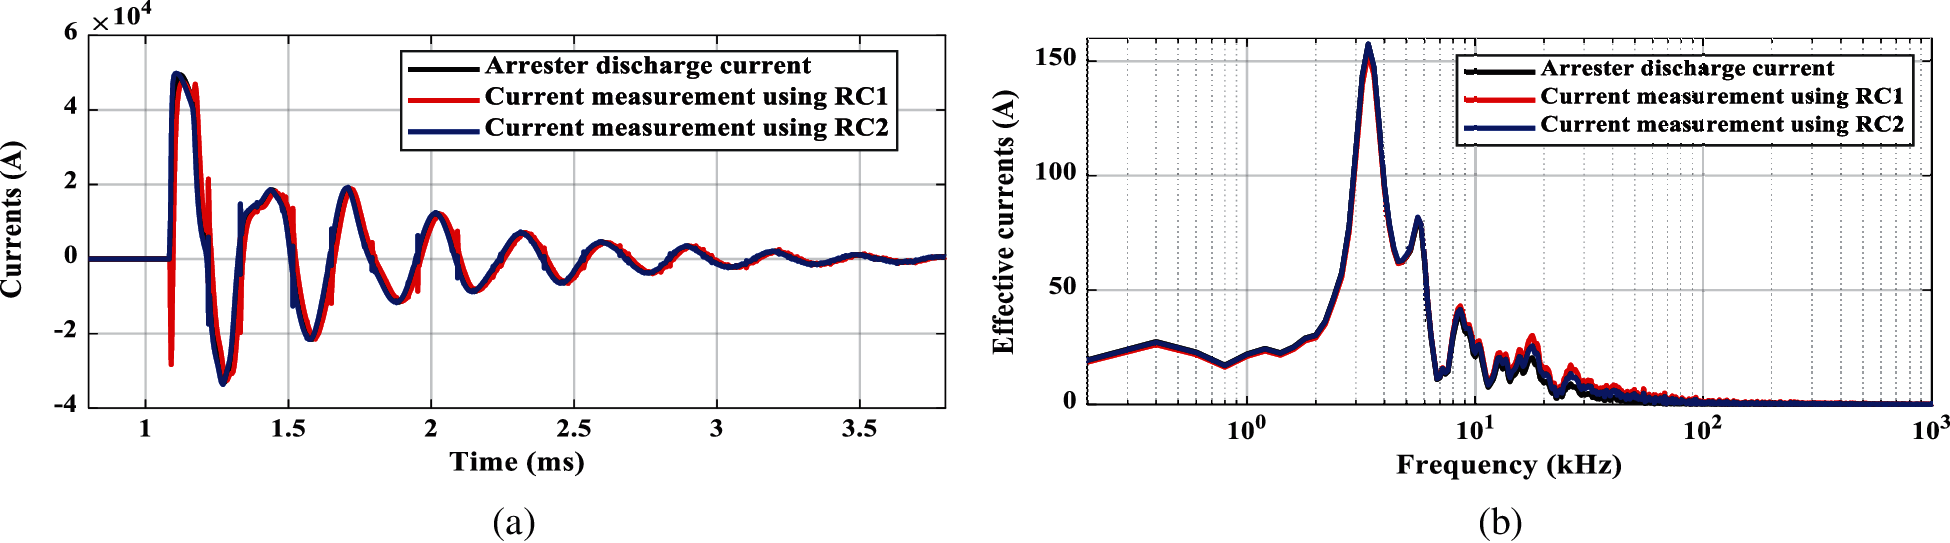
Figure 11: Measured surge arrester discharge current, phase A, busbar L1 by injecting 10 kA, 8/20 μs lightning current. (a) Time response, (b) Frequency response
More evaluation is carried out by injecting a different impulse current waveform, 8/20 μs with amplitude 10 kA to busbar LHT. Fig. 11 shows the arrester discharge current of phase A at the load busbar L1. Once again, this figure confirms a good accuracy of cylindrical coil compared with a circular one.
High frequency model of the Rogowski coil concerning two different shapes, circular and cylindrical, were proposed. The proposed model was based on the transfer function approach. Therefore, experimental tests were carried out by injecting square pulses using a function generator to identify the parameters of the corresponding transfer function representing the proposed model for the self-integrating coil. The proposed model for both shapes had the same order, two-zero and three-pole. The model verification was experimentally carried out in both time and frequency domains. Due to the sharpness of the applied current front time, the maximum errors for induced voltage at the starting time were reached to 20% and 13% for circular and cylindrical coils, respectively. Considering these errors and the value of the induced voltage, the results showed more accuracy of the cylindrical coil compared with the circular one. These errors were insignificant for other applied currents with less sharp front time. The proposed models were used to measure the discharge current of the surge arrester installed in the distribution network due to injecting 10 kA, 10/350 μs, and 8/20 μs. The measured discharge currents were analyzed in both time and frequency domains. The results for monitoring the discharge current confirmed the accuracy of the proposed model.
Acknowledgement: The authors would like to acknowledge the support from Taif University Researchers Supporting Project number (TURSP-2020/264), Taif University, Taif, Saudi Arabia.
Funding Statement: This study was funded from Taif University Researchers Supporting Project number (TURSP-2020/264), Taif University, Taif, Saudi Arabia.
Conflicts of Interest: The authors declare that they have no conflicts of interest to report regarding the present study.
1. Q. Yang, L. Yin, H. Liu, K. Wang and J. Huang, “Measurement of lightning-induced overvoltage in power distribution lines using ceramic-capacitor insulator,” IEEE Transactions on Electromagnetic Compatibility, vol. 61, no. 3, pp. 788–795, 2019. [Google Scholar]
2. J. Snodgrass and L. Xie, “Overvoltage analysis and protection of lightning arresters in distribution systems with distributed generation,” International Journal of Electrical Power & Energy Systems, vol. 123, p. 106209, 2020. [Google Scholar]
3. N. A. Sabiha, M. Alsharef, M. K. Metwaly, E. E. Elattar, I. B. M. Taha et al., “Sustaining electrification service from photovoltaic power plants during backflow lightning overvoltages,” Electric Power Systems Research, vol. 186, pp. 106386, 2020. [Google Scholar]
4. A. Andreotti, R. Araneo, F. Mahmood and A. Pierno, “An accurate approach for the evaluation of the performance of overhead distribution lines due to indirect lightning,” Electric Power Systems Research, vol. 186, pp. 106411, 2020. [Google Scholar]
5. M. Natsui, A. Ametani, J. Mahseredjian, S. Sekioka and K. Yamamoto, “3-D FDTD analysis of lightning-induced voltages in distribution lines due to inclined lightning,” IEEE Transactions on Electromagnetic Compatibility, vol. 63, no. 1, pp. 189–197, 2021. [Google Scholar]
6. S. Sekioka, H. Otoguro and T. Funabashi, “A study on overvoltages in windfarm caused by direct lightning stroke,” IEEE Transactions on Power Delivery, vol. 34, no. 2, pp. 671–679, 2019. [Google Scholar]
7. N. A. Sabiha, “Limiting surge arrester failure under direct lightning strokes for attaining service continuity of distribution networks,” IET Generation, Transmission & Distribution, vol. 14, no. 21, pp. 4796–4804, 2020. [Google Scholar]
8. N. A. Sabiha, F. Mahmood and A. M. Abd Elhady, “Failure risk assessment of surge arrester using paralleled spark gap,” IEEE Access, vol. 8, pp. 217098–217107, 2020. [Google Scholar]
9. P. Pinceti and M. Giannettoni, “A simplified model for zinc oxide surge arresters,” IEEE Transactions on Power Delivery, vol. 14, no. 2, pp. 393–398, 1999. [Google Scholar]
10. M. C. Magro, M. Giannettoni and P. Pinceti, “Validation of ZnO surge arresters model for overvoltage studies,” IEEE Transactions on Power Delivery, vol. 19, no. 4, pp. 1692–1695, 2004. [Google Scholar]
11. N. A. Sabiha and M. Lehtonen, “Lightning-induced overvoltages transmitted over distribution transformer with MV spark-gap operation—Part II: Mitigation using LV surge arrester,” IEEE Transactions on Power Delivery, vol. 25, no. 4, pp. 2565–2573, 2010. [Google Scholar]
12. S. Sharifinia, M. Allahbakhshi, T. Ghanbari, A. Akbari and H. R. Mirzaei, “A new application of rogowski coil sensor for partial discharge localization in power transformers,” IEEE Sensors Journal, vol. 21, no. 9, pp. 10743–10751, 2021. [Google Scholar]
13. M. Shafiq, L. Kutt, M. Lehtonen, T. Nieminen and M. Hashmi, “Parameters identification and modeling of high-frequency current transducer for partial discharge measurements,” IEEE Sensors Journal, vol. 13, no. 3, pp. 1081–1091, 2013. [Google Scholar]
14. M. N. Kh. H. Rohani, Ch. Ch. Yii, M. Isa, S. I. S. Hassan, B. Ismail et al., “Geometrical shapes impact on the performance of ABS-based coreless inductive sensors for PD measurement in HV power cables,” IEEE Sensors Journal, vol. 16, no. 17, pp. 6625–6632, 2016. [Google Scholar]
15. M. E. Ibrahim and A. M. Abd Elhady, “Rogowski coil transducer-based condition monitoring of high voltage insulators,” IEEE Sensors Journal, vol. 20, no. 22, pp. 13694–13703, 2020. [Google Scholar]
16. L. Zhao, J. Su, R. Li, B. Yu, B. Zeng et al., “Two compact coaxial cable connectors with self-integrating sensors to measure nanosecond pulse signals,” IEEE Transactions on Plasma Science, vol. 46, no. 10, pp. 3291–3299, 2018. [Google Scholar]
17. L. Zhao, J. Su, B. Zeng, J. Cheng, L. Zheng et al., “Development of a new type of large-size self-integrating rogowski coils applied in TPG-series generators,” IEEE Transactions on Dielectrics and Electrical Insulation, vol. 24, no. 5, pp. 2864–2872, 2017. [Google Scholar]
18. B. Yu, J. c. Su, R. Li, L. Zhao, J. Cheng et al., “Study on shielded rogowski coil with return line for measurement of nanosecond-range current pulse,” Measurement, vol. 177, pp. 109256, 2021. [Google Scholar]
19. M. E. Ibrahim and A. M. Abd Elhady, “A proposed non-invasive rogowski coil design for measuring 3-phase currents through a 3-core cable,” IEEE Sensors Journal, vol. 21, no. 1, pp. 593–599, 2021. [Google Scholar]
20. M. H. Samimi, A. Mahari, M. A. Farahnakian and H. Mohseni, “The rogowski coil principles and applications: A review,” IEEE Sensors Journal, vol. 15, no. 2, pp. 651–658, 2015. [Google Scholar]
21. I. A. Metwally, “Design of different self-integrating and differentiating rogowski coils for measuring large-magnitude fast impulse currents,” IEEE Transactions on Instrumentation and Measurement, vol. 62, no. 8, pp. 2303–2313, 2013. [Google Scholar]
22. I. A. Metwally, “Coaxial-cable wound rogowski coils for measuring large-magnitude short-duration current pulses,” IEEE Transactions on Instrumentation and Measurement, vol. 62, no. 1, pp. 119–128, 2013. [Google Scholar]
23. W. Stygar and G. Gerdin, “High frequency rogowski coil response characteristics,” IEEE Transactions on Plasma Science, vol. 10, no. 1, pp. 40–44, 1982. [Google Scholar]
24. D. G. Pellinen, M. S. Di Capua, S. E. Sampayan, H. Gerbracht and M. Wang, “Rogowski coil for measuring fast, high-level pulsed currents,” Review of Scientific Instruments, vol. 51, no. 11, pp. 1535–1540, 1980. [Google Scholar]
25. L. Ljung, “System identification toolbox: User's guide,” The MathWorks Inc, chapter 1, pp. 27–31, 2021. [Google Scholar]
 | This work is licensed under a Creative Commons Attribution 4.0 International License, which permits unrestricted use, distribution, and reproduction in any medium, provided the original work is properly cited. |