DOI:10.32604/csse.2022.022519
| Computer Systems Science & Engineering DOI:10.32604/csse.2022.022519 | |
| Article |
Predicting Mobile Cross-Platform Adaptation Using a Hybrid Sem–ANN Approach
Department of Information Technology, College of Computer, Qassim University, Buraydah, Saudi Arabia
*Corresponding Author: Ali Alkhalifah. Email: a.alkhalifah@qu.edu.sa
Received: 10 August 2021; Accepted: 23 September 2021
Abstract: Owing to constant changes in user needs, new technologies have been introduced to keep pace by building sustainable applications. Researchers and practitioners are keen to understand the factors that create an attractive user interface. Although the use of cross-platform applications and services is increasing, limited research has examined and evaluated cross-platforms for developing mobile applications for different operating systems. This study evaluates cross-platform features, identifying the main factors that help to create an attractive user adaptation when building sustainable applications for both Android and iOS. Flutter and React Native were selected so end-users could test their features using the cross-platform usability assessment model. Usability, satisfaction, and navigation were tested to measure the cross-platform adaptation and end-user experience. The data were analyzed using hybrid structural equation modeling (SEM) and artificial neural network (ANN) approaches. The study results show that usability and navigation both have a positive effect on adaptation on Flutter and React Native, while satisfaction only has an effect on Flutter. The navigation variable was also the most significant predictor of adaptation for both models. This study has several implications and makes contributions to the research field, to developers, and to end-users.
Keywords: Mobile application; user experience; Flutter; React Native; cross-platform; artificial neural network
With today’s diversification of mobile device operating systems, the use of applications has increased in daily life. Keeping pace with the application market is therefore urgently needed, along with cross-platform work to build applications that work in different operating systems, such as Android and iOS. In this study, we use the term “cross-platform” to refer to a development environment in which the user interface code is written once only and runs in different operating systems [1]. We use the term “user experience “to emphasize user experience when interacting with cross-platform applications in different operating systems. Significant improvements are needed in the technology industry in the mobile cross-platform development market [2]. In addition, a major shift is occurring regarding valuing the experiences of users and adaptation and investing more to make user experiences much more effective through using sustainable applications and programs [3]. However, despite growing interest in industry and academia, research is still lacking on improving and designing the user experience, [4,5]. On the other hand, companies are beginning to adapt to users’ versatile patterns by perceiving what is required in mobile applications. Mobile phones are being widely used by almost every individual in the world [2,4,6].
The use of mobile applications has clearly increased in recent years. By 2026, mobile advertising and the cross-platform market are projected to be worth USD 150 billion [7]. Consequently, more sustainable and interactive mobile applications are required to stay ahead of this trend. In parallel, the new shift to an emphasis on user experience (UX) has focused primarily on product design and evaluation [8]. As many basic mobile platforms, such as iOS, Android, Windows, etc., are operating in different development environments, the concept of a unified user experience is becoming increasingly mind-boggling and expensive. The challenge is to find an answer that enables the deployment of a single software development kit (SDK) tool in various operating systems to maintain similar performance on different devices.
In software engineering and human–computer interaction (HCI) disciplines, the user experience design focuses on the overall user experience, not on a case-by-case basis on alternative user interfaces [9]. Human beings are social by nature, with our emotions and pleasures closely related to social contexts. With the advent of social services, the need to design for social contexts increases. User experience should therefore be expanded to include the social experience [10], with this being user experience in the social context. The social experience has many unique features not noticeable within the user experience [9]. Furthermore, human behavior is a popular subject in behavioral economics, with it considered to enhance the innovative user experience [6]. Behavioral economics addresses that part of the economy that uses social cognitive and emotional factors to understand consumers’ economic decisions [8]. The current study suggests that interactive design creates user experience that involves active users as participants in sustainability practices. This adaptive design could theoretically confirm the user experience.
The suggested solution in this study is to build a mobile cross-platform to keep up with the speed of application development, creating a united user experience and sustainable adaptation for all devices. In this solution, code only needs to be written once. This means reductions in time and effort as the code, although written once only, will target multiple devices, while the user interface also only needs to be designed once. This study provides a comparison across existing platforms. Firstly, it provides an explanation of the most popular existing cross-platforms. Secondly, it tests the features of each cross-platform. Finally, it concludes by making a comparison of user perceptions and adaptation behavior for each of these two platforms, namely, Flutter and React Native. These two platforms are currently the most widely used by developers, as shown in Fig. 1 [11].
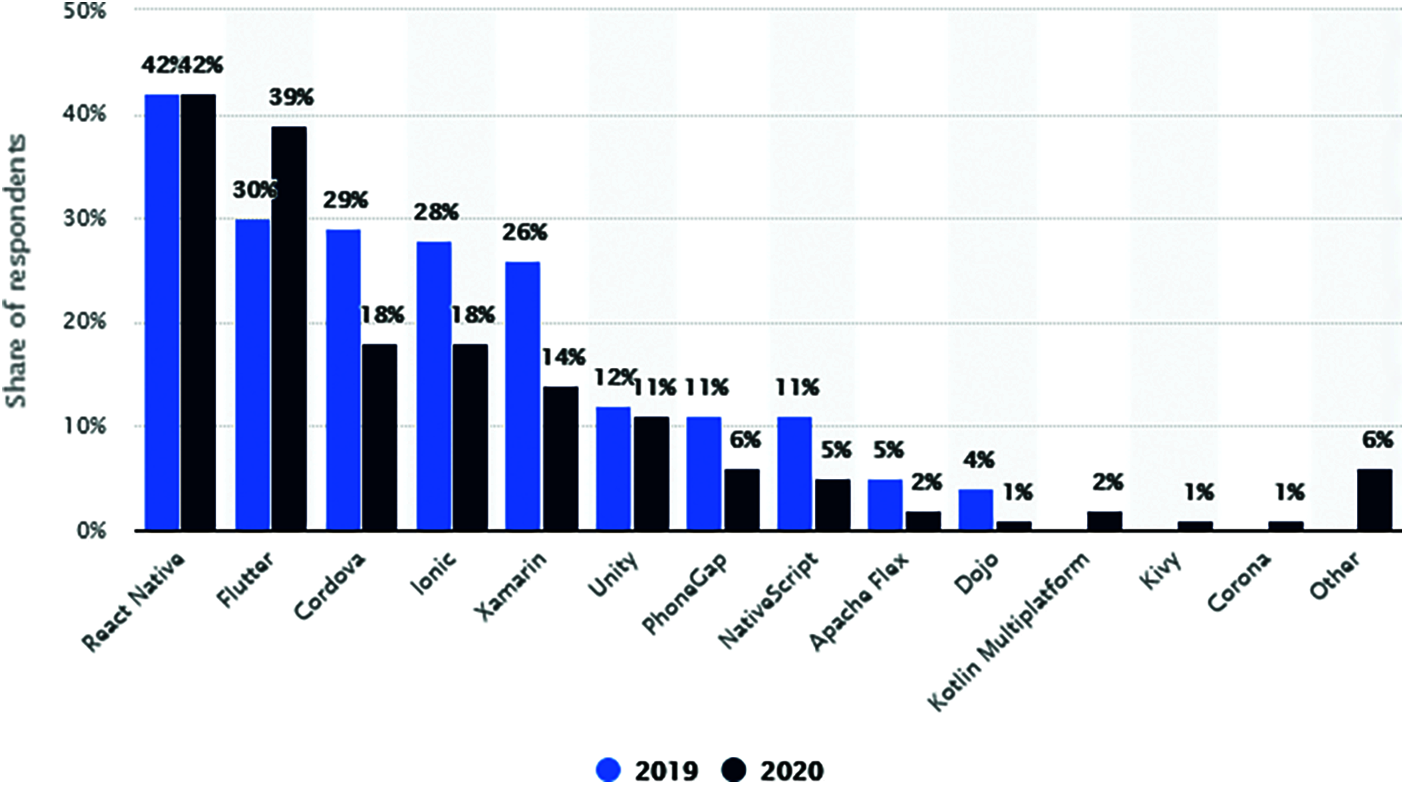
Figure 1: Cross-platform mobile frameworks used by software developers worldwide. Source: Statista [11]
Studies are lacking on comparisons of different mobile devices (e.g., Android and iOS phones) in terms of user experience and adaptation. Furthermore, limited studies have addressed enhancement and user testing of user experience for mobile devices [5,10]. Therefore, the current study seeks to fill this gap, aiming to examine the main factors that help to create a sustainable user experience through the most common cross-platforms, namely, Flutter and React Native. This study also contributes to the HCI research by exploring and analyzing the different factors of cross-platform adaptation using both structural equation modeling (SEM) and artificial neural network (ANN) approaches. This kind of hybrid approach is scarce in the literature.
This paper is organized as follows. Sections 2 and 3 present an overview of user experience, HCI, and mobile cross-platforms. Section 4 describes cross-platform assessment models and the study’s methodology. Section 5 describes the analysis of both SEM and ANN evaluation models. Section 6 discusses the study’s results, while Section 7 provides the study’s implications and its contributions. Finally, Section 8 presents the conclusion along with the study’s limitations and future opportunities.
2 User Experience (UX) and Human–Computer Interaction (HCI)
User experience is “about creating a meaningful experience through a device” [12]. It is not only about design interfaces or technology but is also about “our quality of life by designing for pleasure” [13]. The “user experience (UX)” term has influenced the design of user interaction for two decades, while indicating a move away from the interface between the computer and the human being towards the design of high-level interaction [14]. Since the 1990 s, user experience has been progressively embraced as a tool for assessing the quality of human–product interactions [14]. For example, in 1996, Alben [15] were the first to propose the notion of user experience as: “the way the product feels in hands, how well users understand how it works, how users feel about it while they're using it, how well the product serves users’ purposes, and how well the product fits into the entire context in which users are using it.”
Previous user experience studies have sought to convince the HCI community to focus more attention on users’ internal state. User experience is an area of software development and research with design developing human-friendly user interfaces [8]. The HCI community should therefore expand its methodological practice to take full advantage of these resources. The HCI field has a long history of integrating methodologies from different disciplines, most of which are concerned with the social sciences [16]. In any case, HCI and related controls are not used to manage experiences. Human–computer interaction (HCI) emerged from coordinated efforts between software engineering and psychology, of which the academic elements of both are more comfortable with the laboratory rather than the outside world. This coordination was more toward practical documentation of personal computer (PC) and human interaction rather than toward user experience [17]. Against this foundation, it may merit taking a look at the rise of enthusiasm for involvement in innovation and how HCI currently understands user experience. It is essential that HCI engages with topics related to the user’s interface experience, addressing issues such as feelings, elucidation and satisfaction [8,14].
3 Cross-Platform and User Experience
Different terms have been used in the literature to describe the interactive cross-platform. Studies [18–21] have used the term “multiple user interfaces (MUIs)” which describe user services and information from different software and hardware. Other terms include “distributed user interface (DUI)” [22,23] and “multiple platform user interface” [24,25]. The term “cross-platform service” is used by Majrashi et al. [5] who define “cross-platform” as a set of user interfaces for a single service on diverse computational platforms.
Existing studies contribute to HCI research by presenting and addressing issues related to cross-platform systems and applications. These issues include the challenges and opportunities of designing an interactive cross-platform [26,27]; terminologies and trends in cross-devices [25,28]; designing the development of multi-application and users’ interface experience [29–32]; and evaluation and comparison of cross-platform mobile applications and tools [33,34]. Limited studies have explored and assessed cross-platform user experiences [5,10,14,35]. Most of these studies have not conducted comprehensive user experience and perceptions testing. The current study contributes to the body of knowledge by identifying and examining a mobile cross-platform with user perceptions and testing.
The present study differs from the previous research, and the key differences are highlighted. Firstly, most previous studies are technical in nature, focusing on design science and software engineering. These studies focused on the compression of cross-platform frameworks [25,33], designing user interfaces [29,30], and evaluation performance [22,32].
Secondly, existing studies did not test or consider users’ perceptions and behaviour toward use or adoption. Although limited studies addressed users’ beliefs and experiences about cross-platform mobile technologies, no theoretical models have been developed yet and empirically tested to better understand the user experience of cross-platform mobile. A study by Biørn-Hansen et al. [10] is limited survey-based research based on an online questionnaire that studied users’ perceptions of user experience. The research [10] focused on pointing out some issues from the industry perspective, such as popularity and adoption, which differs from the perspective of this study. Furthermore, Angulo and Ferre [35] presented a questionnaire-based study to test user experience from the developer perspective using different frameworks, which is also diverse from our work.
Finally, this study uses a different technique to collect data, which is different from previous studies. In addition, different data analysis techniques were used in cross-platform mobile literature. For example, Majrashi et al. [5] analysed measures to test user satisfaction of cross-platform usability using think-aloud protocol and observations. Feng and Wei [14] used the AttrakDiff questionnaire method to evaluate the user experience of the app on iOS and Android platforms. The same study used the UX Curve and coordinate planes method to assess the quantitative data on how users’ experience with the mobile app has changed over time. To the best of our knowledge, this study is the first effort to use dual-approach analysis (SEM-ANN) in the context of cross-platform mobile.
4.1 Measurement Factors and Hypotheses
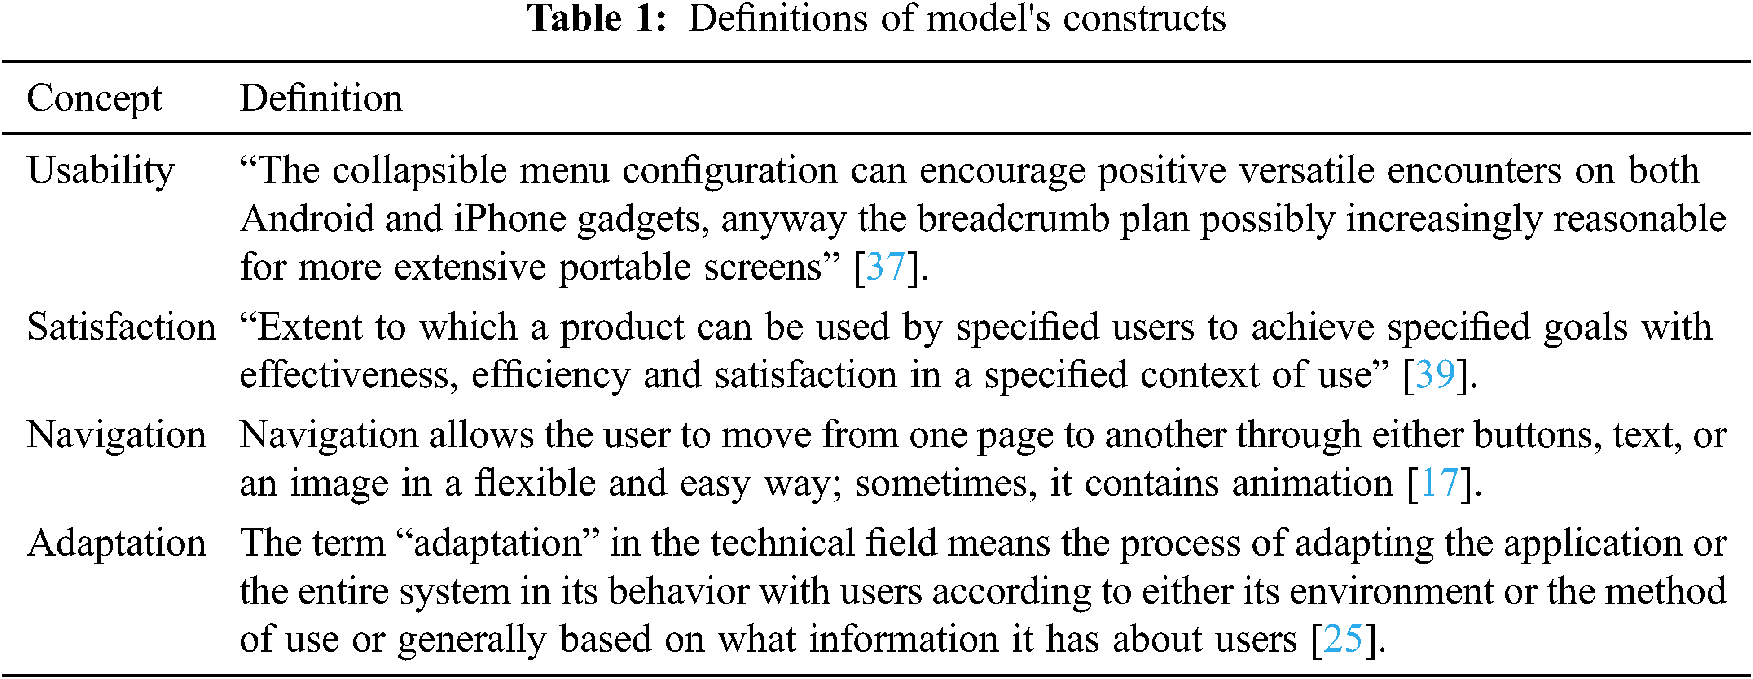
This study develops a user experience cross-platform model, as shown in Fig. 2. The model adopts three measurable factors of adaptation: usability, satisfaction, and navigation. These variables have been identified as the most cross-platform user experience metrics [5,14,36–38]. Tab. 1 presents the overview of the measurement factors of the proposed model.
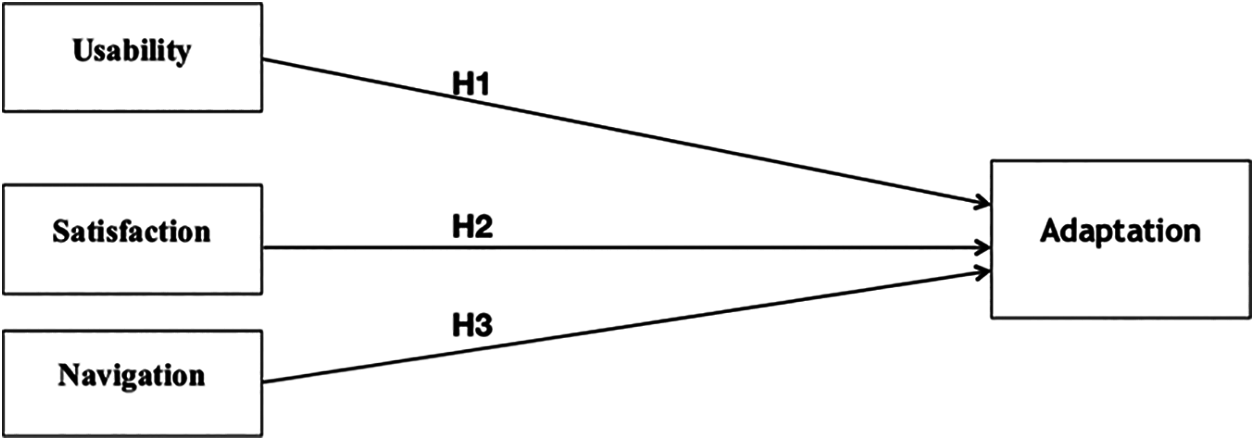
Figure 2: Cross-platform user experience measurement model
Information access via mobile phones provides rich opportunities to companies, enabling them to reach their customer base at a much more extensive level [13]. Nonetheless, this wide access presents organizations with new difficulties; they need to build their sites so they can be adequately accessed by mobile phones. Djamasbi et al. [37] show that: “ease of use look[s] into remaining aggressive in the commercial center [and] expects organizations to give better client experience [through] their applications.” We hypothesized that:
H1: The usability of mobile devices on cross-platforms will positively impact on the user experience.
Satisfaction aims to enable the user to make better decisions. Users can provide ratings, criticize items, assign weights to an item’s features, or indicate their own needs. The system draws suggestions by comparing user tendencies with the most prominent elements of the catalog or other users’ preferences [5]. Therefore, we hypothesized that:
H2: User satisfaction will be positively enhanced by the experience of building apps using a cross-platform.
Navigation allows the user to move from one page to another through buttons, text, or an image in a flexible and easy way; sometimes, navigation contains animation. In product design, a feature should not be added to the product simply because it is easy and cheap to implement, or because the designer thinks it is a good idea. The most important part of the design process is to provide the user with a real usage context. For mobile phones, this means users need to be able to touch the buttons and see software that feels like it is working [33]. Therefore, the process needs to provide the user with the real usage context.
H3: The more flexible the navigation, the better the user experience.
4.2 Cross-Platform Assessment Model
This study uses the novel cross-platform usability assessment model developed by Majrashi et al. [5]. This model has been developed to enable quantification and identification of cross-platform usability issues (see Fig. 3). As this model has been evaluated and its variability has been confirmed in studying the usability of mobile cross-platforms, it is suitable for adoption in the current study in the same context. The key model parts developed for this study are discussed in the following sub-sections. Section 4.2.1 describes the horizontal tasks. Section 4.2.2 explains the data collection techniques. Section 4.2.3 identifies the cross-platform user experience scales.
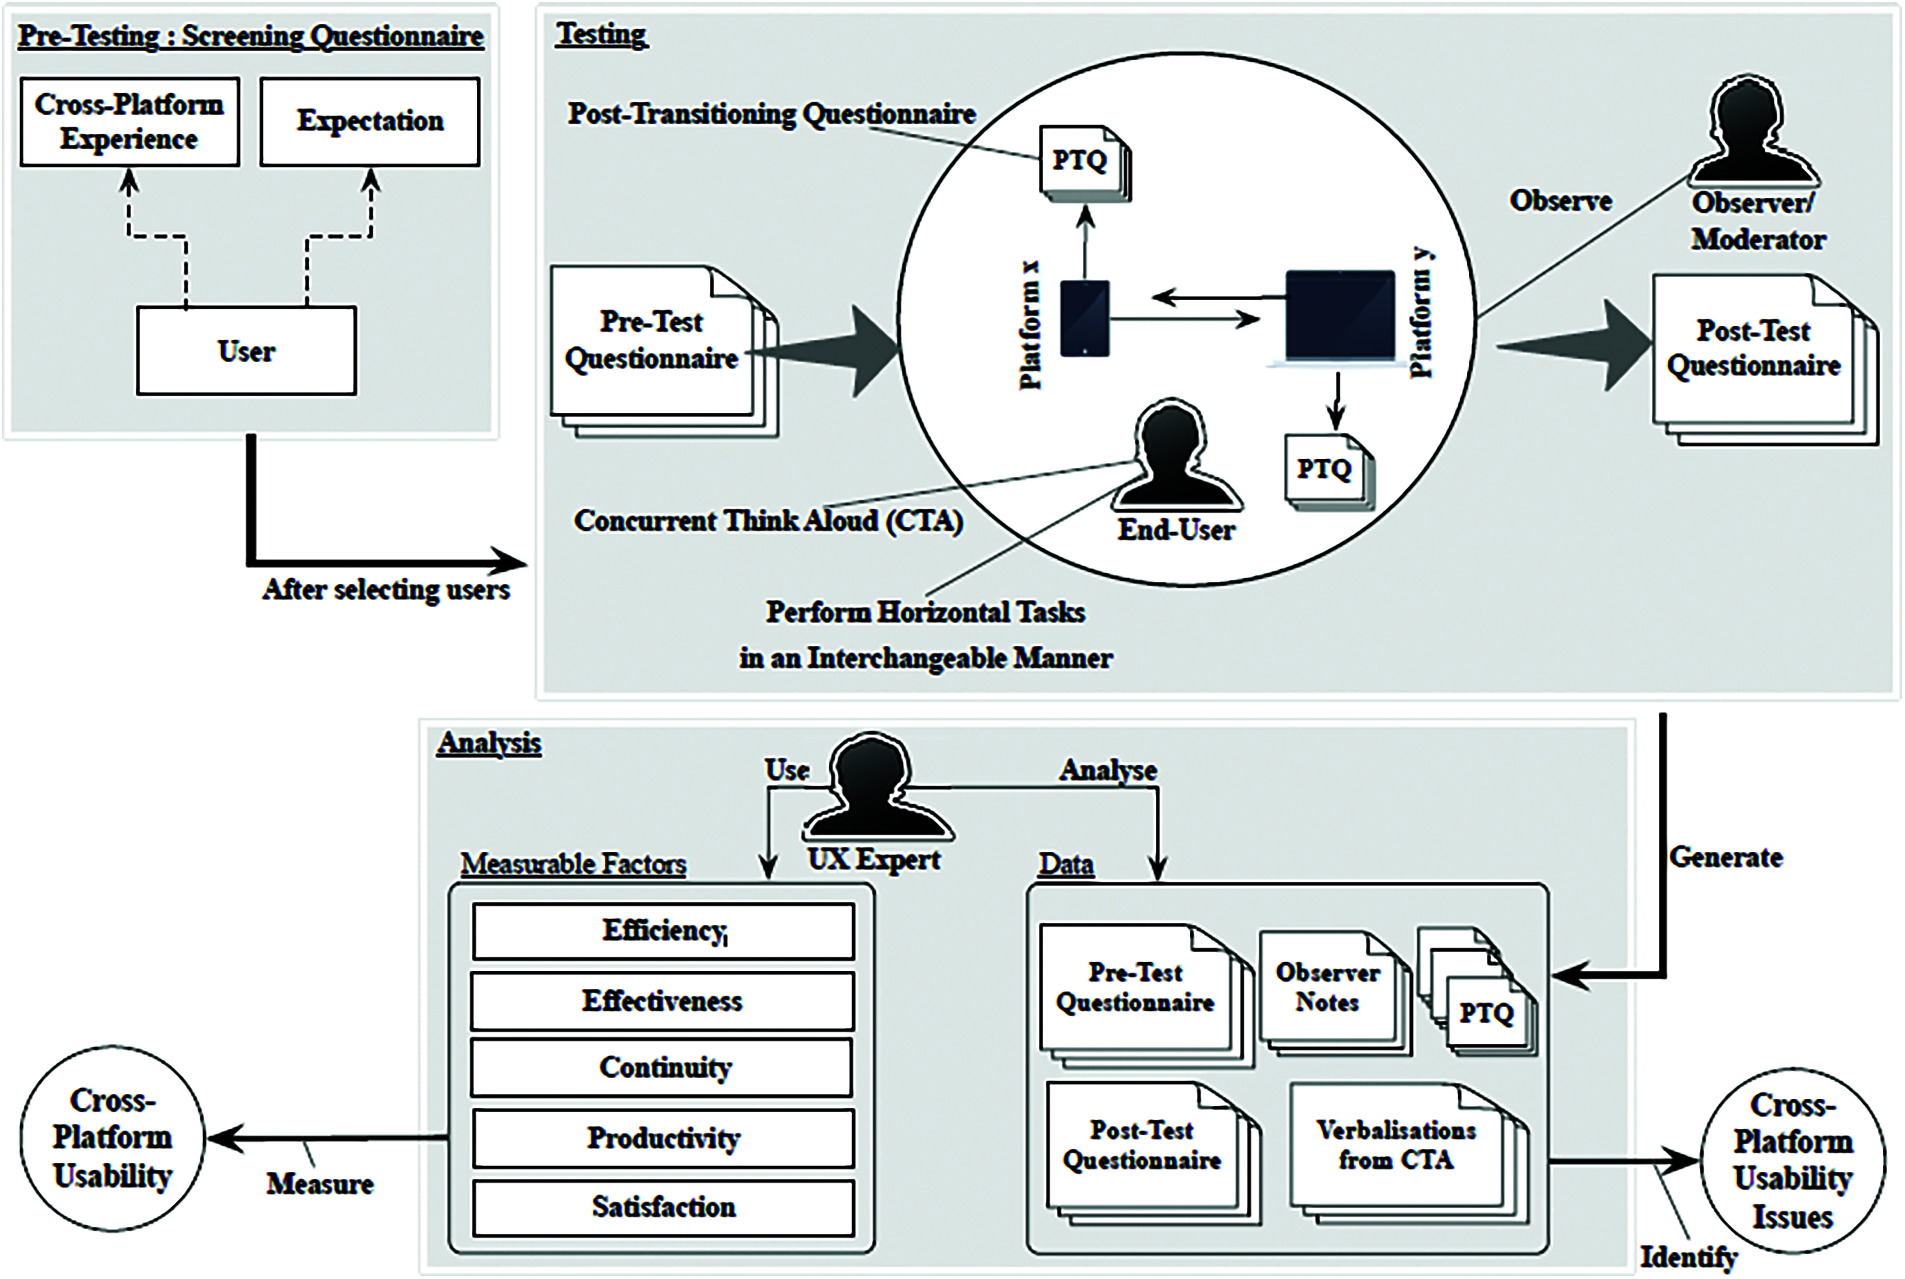
Figure 3: Cross-platform usability assessment model [5]
We divided cross-platform tasks into two subtasks (case studies), each of which was conducted using a specific operating system and user interface [5,38]. In the current study, we provided two case studies developed on the cross-platforms of most interest for mobile applications, namely, React Native and Flutter [11,40,41]. Flutter is an open-source framework which is a collection of widgets for what is seen, such as views or user interface (UI) elements [41]. These widgets in Flutter comprise a modern framework. The UI is created from the widgets by developers: these widgets can represent what their view should look like, given their current configuration and state. All applications in Flutter are programmed using Dart language for both UI and base code. React Native was introduced by Facebook in 2015. Aimed at solving the above-mentioned problem, it is an open-source cross-platform based on the JavaScript framework [40]. Due to its efficient development process, as well as its simplicity and ease of use, the React Native framework is extensively used by developers [40].
This study is focused on evaluating the user experience with mobile interfaces that facilitate preferences and on the user experience when users need multiple systems, attempting to improve current mobile interfaces. We proposed an online shopping application to support various systems, helping users to select their preferred options, such as the information shown and payment method. Developing the UI elements is done by default on both Android and iOS systems. These elements include text, image, scrolling, navigation, layout, list, buttons, sync, touchable highlight, and research capacity (see Fig. 4). Users were asked to test and do tasks in these elements to test their perceptions of usability, satisfaction, navigation, and adaptation.
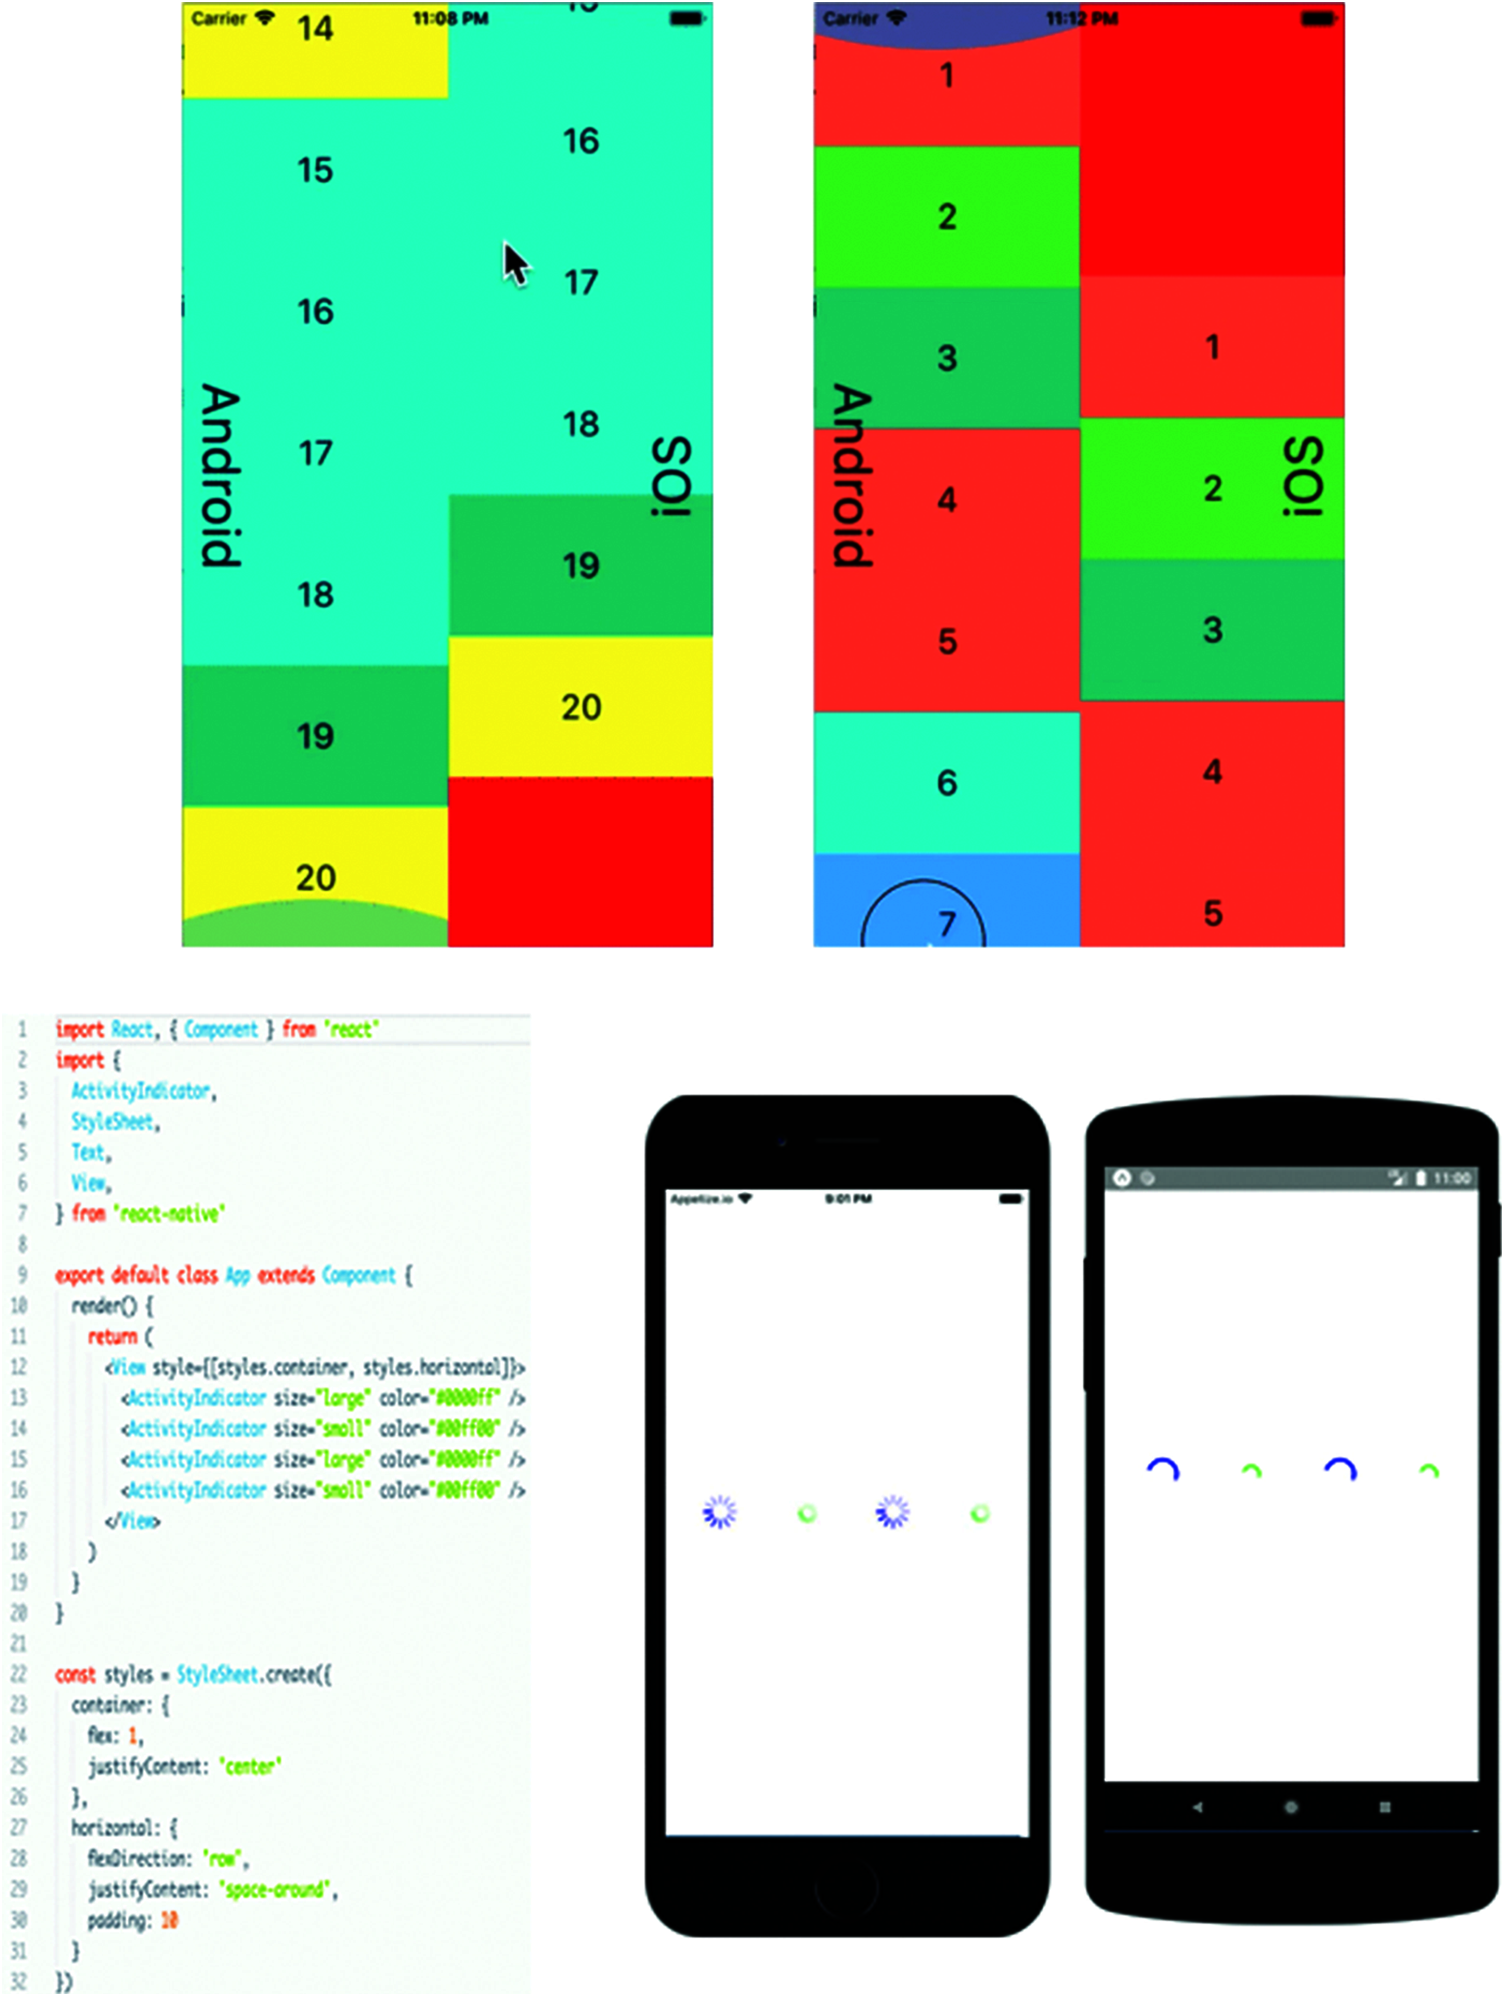
Figure 4: Flutter scrolling (up); React Native sync (bottom) UI element examples
4.2.2 Data Collection Procedure
This section describes the data collection design process used in this study. The data collection procedure includes the sampling technique and the targeted population. Studies have shown that questionnaires are a valuable technique for cross-platform usability engineering when evaluating the cross-platform user experience [5,10,14,35,39,42]. We designed this study to capture the opinions and impressions of end-users.
Initially, the study’s target population was 100 participants, all of whom were students from the College of Computer, Qassim University. Owing to the current pandemic conditions (due to the coronavirus [COVID-19]), a meeting was held, using the Zoom application, to determine whether potential participants were immune deficient. As a result, 20 users were excluded from the study for their safety. The remaining 80 participants were divided into eight groups, each group consisting of 10 users. A computer lab was the location for the experiment, taking an hour to perform the experiment for each group. In total, 48 participants (60%) were female and 32 participants (40%) were male, with 63% using iOS and 37% using Android mobile phones.
4.2.3 Cross-Platform User Experience Scales
In exploring user experience, questionnaires are commonly used to collect demographic data about participants. They can also be used for gauging subjective reactions to the use of interfaces, these being data that are hard to measure objectively [43]. Firstly, pre-test questionnaires were used to collect demographic data about participants and their levels of expertise in computers, such as the Internet, and regarding the tested proposed system. Secondly, post-task questionnaires were utilized after completing each platform task. These have two main advantages in user experience studies [43]: providing diagnostic information on user experience issues and measuring user satisfaction after the completion of a task [5,44]. A scale developed by Likert was used to rate participants’ attitudes, opinions, and beliefs about a topic, with the open-ended question format also used in this type of questionnaire.
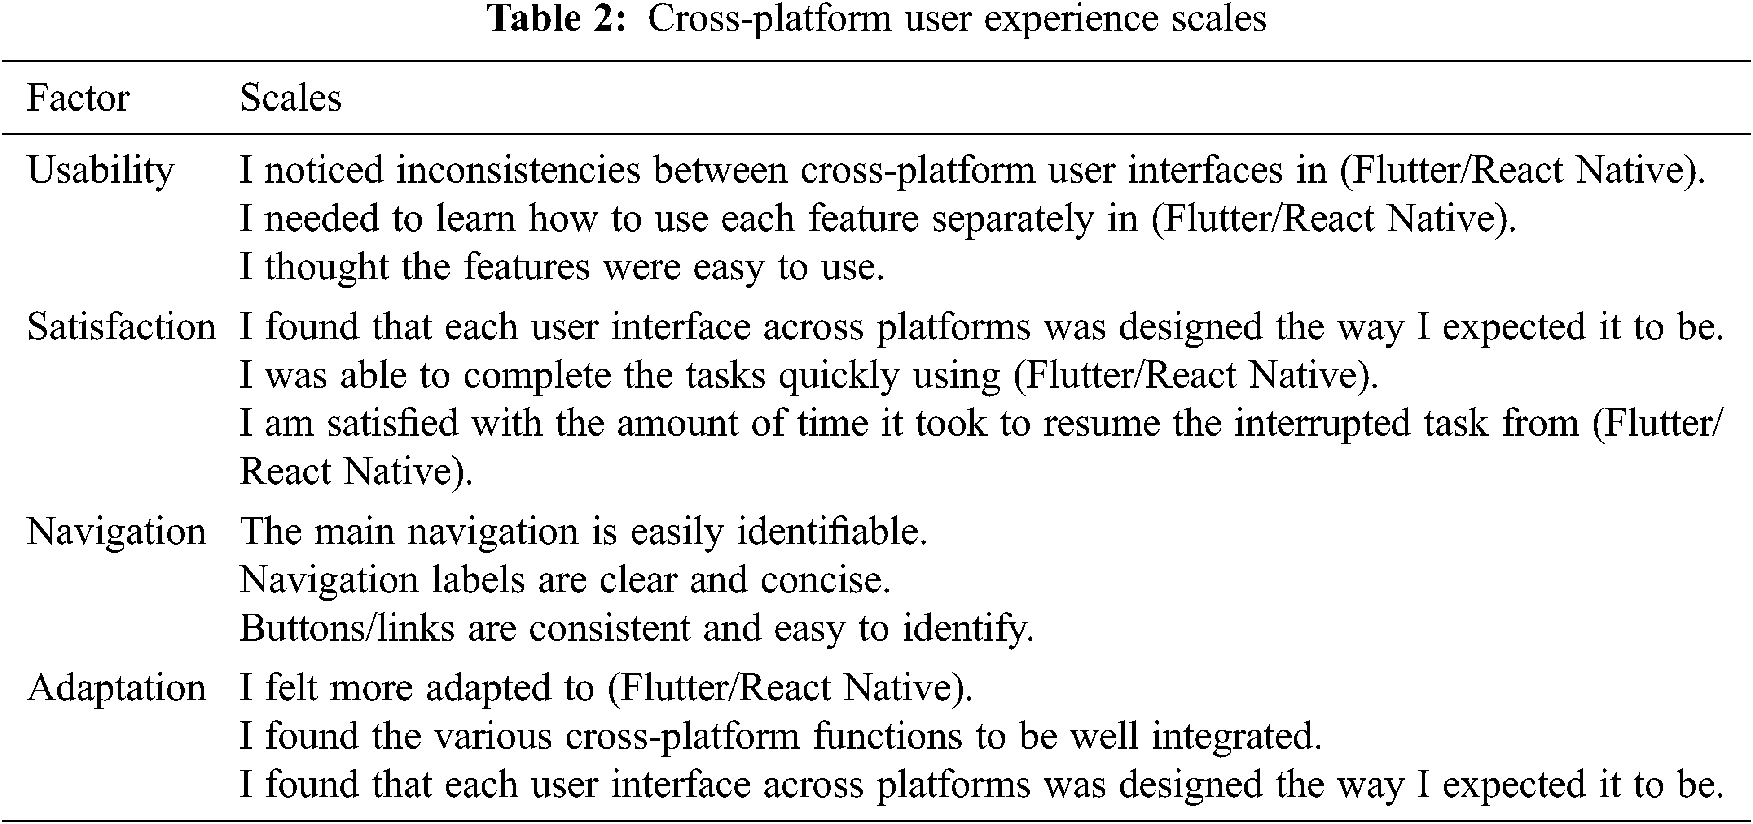
Tab. 2 presents the post-task questionnaire developed in this study. These questionnaires were completed after a participant had finished all tasks, those in Flutter as well as those in React Native. With these post-task questionnaires, participants could comment about their impressions of the tasks across platforms and could report cross-platform usability, satisfaction, navigation, and adaptation (see Tab. 2). All questions were adopted from previous studies [5,14,33,35,44]. In addition, the questionnaires were evaluated and tested prior to use by two information technology (IT) professors and two mobile-app developers.
This study uses a hybrid evaluation approach to test the metrics. It applies two-stage analysis using SEM and ANN approaches. Section 5.1 describes the SEM evaluation measurement; while Section 5.2 provides the ANN analysis.
5.1 Structural Equation Modeling
A statistical method is used in this research to estimate and test causal relationships through statistical data as well as causal assumptions. Additive causal models and linear theory support can be tested using partial least squares (PLS), a tool used in research called structural equation modeling (SEM) which is concerned with the measurement of elements, after which it is statistically tested [45]. Usually, one or more hypotheses are required, with these represented as a model. The proposed model designed in this study is a basic model for building an inner/outer model. We use SmartPLS 3.0 software to test the proposed model and evaluate the results [46].
5.1.1 Flutter: Structural Evaluation Measurement
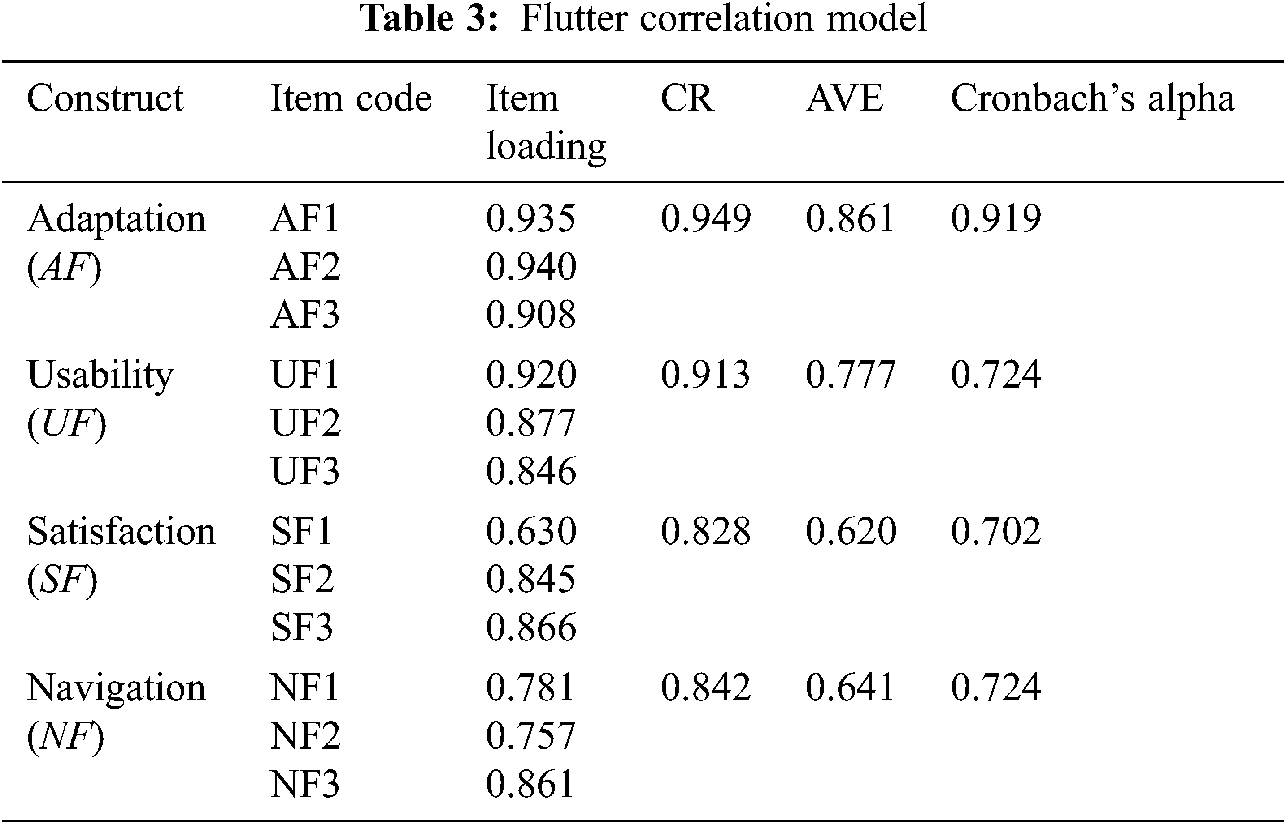
As in all other research, it is essential to establish the reliability and validity of the latent variables to complete the examination of the structural model [45]. When conducting PLS-SEM analysis, the reliability and validity of items must be checked and reported. In the current study, indicator reliability is tested through factor loading values. As shown in Tab. 3, all item loading values exceed the cut-off value of 0.6 [47]. Therefore, the reliability of the scales is satisfactory. We test internal reliability by composite reliability (CR). If the value is less than −0.5 or 0.06, a problem is present due to the CR effect; between 0.7 and 0.8 is considered normal; and 0.9 or above is considered outstanding [45]. Also, we test convergent validity by Cronbach’s alpha coefficient values. If the value in the study is less than 0.5, a problem exists; otherwise, it is considered correct. Cronbach’s alpha values are above 0.6 for all constructs, while CR is above 0.7, thus exceeding the cut-off value of 0.7 for all variables [45]. Therefore, reliability and validity are confirmed for the measurement model.
To evaluate discriminant validity, we apply the Fornell–Larcker feature [48]. We calculate the square root values of average variance extracted (AVE), as shown in the diagonals of the correlation matrix in Tab. 4. These values are greater than in the relationship of the construct with the other variables in the first-order model. This indicates that each item is loaded more on its relevant construct than on other constructs [47]. Therefore, discriminant validity is confirmed.

This study uses the t-statistics method to test the hypotheses. The t-statistics in this method can be generated by SmartPLS for significance testing of both the inner and outer models using a procedure called bootstrapping. Non-parametric bootstrapping is carried out using 80 cases and 1,000 samples to obtain the significance of each structural path (i.e., the t-value) between the constructs [49]. The results, as shown in Tab. 5, indicate one directly hypothesized relationship in the developed model. If the effect between two constructs in the model is less than 0.05, it is not supported; otherwise, it is supported [45]. Based on the inner model suggestion, navigation has the strongest effect on adaptation (0.639), followed by satisfaction (0.201): the weakest effect is usability (0.068). All loadings of the constructs are significant at p < 0.001. Therefore, we can deduce from their coefficient values that satisfaction, navigation, and usability are factors that influence adaptation, thus creating a great user experience.

5.1.2 React Native Structural Evaluation Measurement
The steps previously adopted in the Flutter case analysis are repeated for React Native. As shown in Tab. 6, all the item loadings exceed the cut-off value of 0.7. One item (SRN2) is deleted, with no further involvement in the analysis, due to its low loading. Cronbach’s alpha coefficient values and the average of variance extracted (AVE) were above the cut-off of 0.6 for all constructs [49]. Composite reliability (CR) was above 0.7 for all constructs which exceeds the cut-off value of 0.7 [45,47]. Therefore, reliability and validity are satisfactory. In addition, Tab. 7 shows that all constructs met the discriminant validity requirements.


Based on the inner model suggestion, navigation has the strongest effect on adaptation (0.748), followed by usability (0.145) (as shown in Tab. 8); however, no effect is found for satisfaction (−0.013). Therefore, we can deduce from their coefficient values that the navigation and usability factors influence adaptation, thus creating a great user experience.

The current study uses an artificial neural network (ANN) as an alternative to regression analysis to re-examine the model. To enjoy the advantages of both PLS-SEM and ANN analyses, a dual analysis can be conducted [50]. Thus, the ANN was utilized to evaluate the predictors of adaptation in this study [51]. The PLS-SEM technique is frequently used to examine relationships and test research hypotheses [52,53]. However, the ANN is used to reveal complex linear and non-linear relationships, as stated by Chan and Chong [52] and Teo et al. [54], respectively. Additionally, the ANN approach offers more precise prediction than the conventional regression technique [55,56]. Furthermore, it is used in information system (IS) research to evaluate relationships between dependent and independent variables [50,56–58]. Hence, this study uses ANN analysis to identify the elements that have a major impact on adaptation in both the Flutter and React Native models.
According to the study by Chong [59], the NN is a modelling tool that aims to imitate human neutral systems and is capable of learning. Due to their learning capability, ANNs can be trained to improve their performance [54,60]. Following the methodologies published and practiced by various previous studies, IBM SPSS Statistics (SPSS) v.24 is used to conduct the ANN analysis [50,56,61]. This study use a multi-layer perceptron (MLP) artificial neural network (ANN) with a feed-forward back-propagation (FFBP) algorithm to determine the relative relevance of exogenous factors to an endogenous variable. Figs. 5 and 6 illustrate the ANN models produced for Flutter and React Native. To avoid overfitting, a tenfold cross-validation is done on the dataset (resulting in 10 ANN models), with 70% of the data utilized for training and the remaining 30% used to determine the predicted accuracy of the trained network (also known as testing). Additionally, the number of hidden neurons is specified to be created automatically by the algorithm, and the hyperbolic tangent activation function is used for both the hidden and output layers. To evaluate the predictive accuracy of the model, the root mean square error (RMSE) for each ANN in the ANN model is calculated, as presented in Tab. 9, as recommended by various studies [50,54,56]. As shown in Tab. 9, the Flutter ANN model has a mean RMSE value for training (0.560) and testing (0.553) data, indicating that the model’s predictive accuracy is medium. The same explanation applies to the React Native ANN model. Apart from suggesting a medium level of predictive accuracy, a smaller RMSE number also indicates a more accurate fit and forecast of the data. Additionally, the significance of external variables is determined by the number of non-zero synaptic weights associated with hidden neurons in a given ANN model.
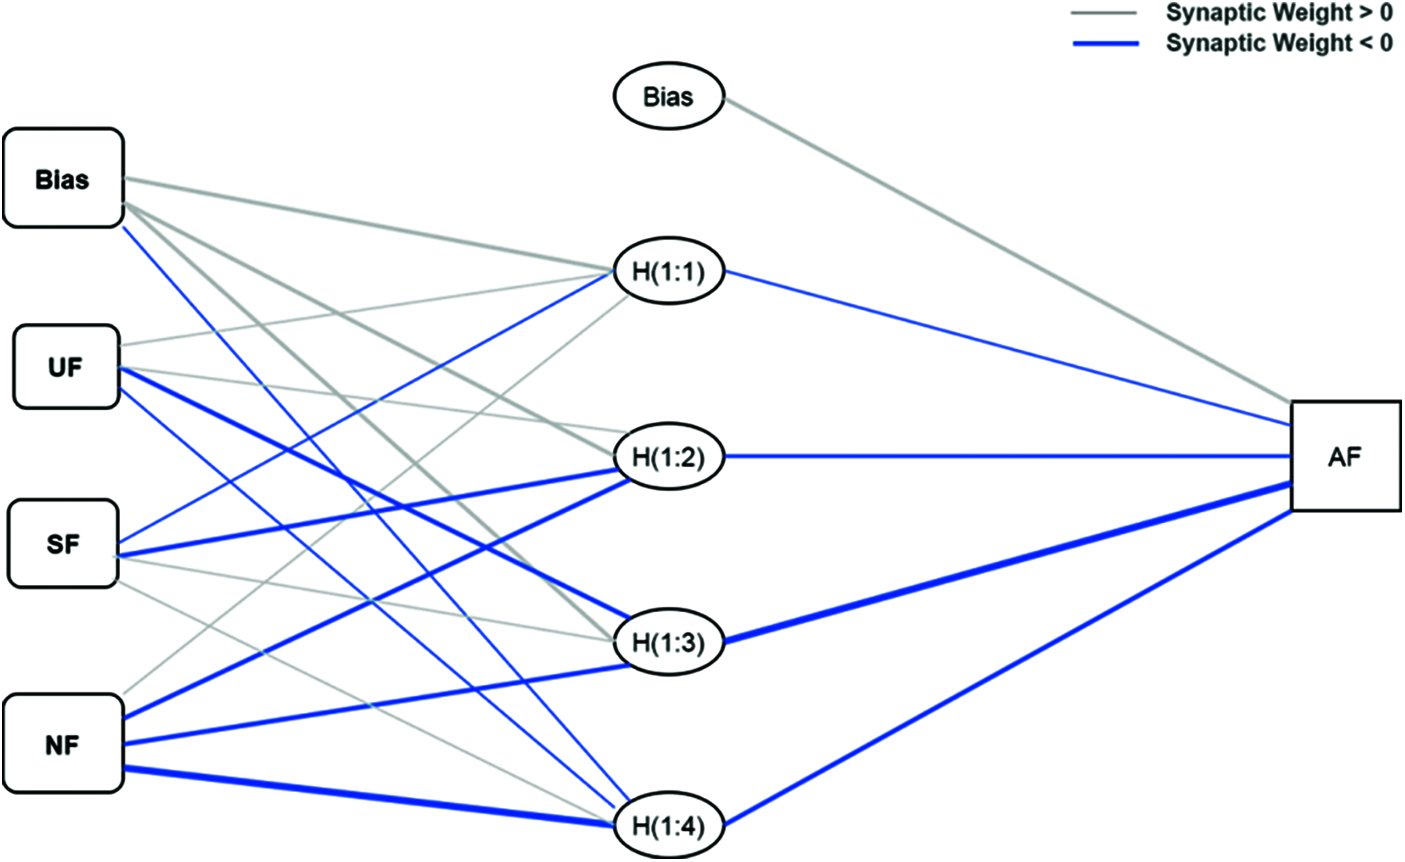
Figure 5: Flutter ANN model. Note: Usability-Flutter (UF); Satisfaction-Flutter (SF); Navigation-Flutter (NF); Adaptation-Flutter (AF)
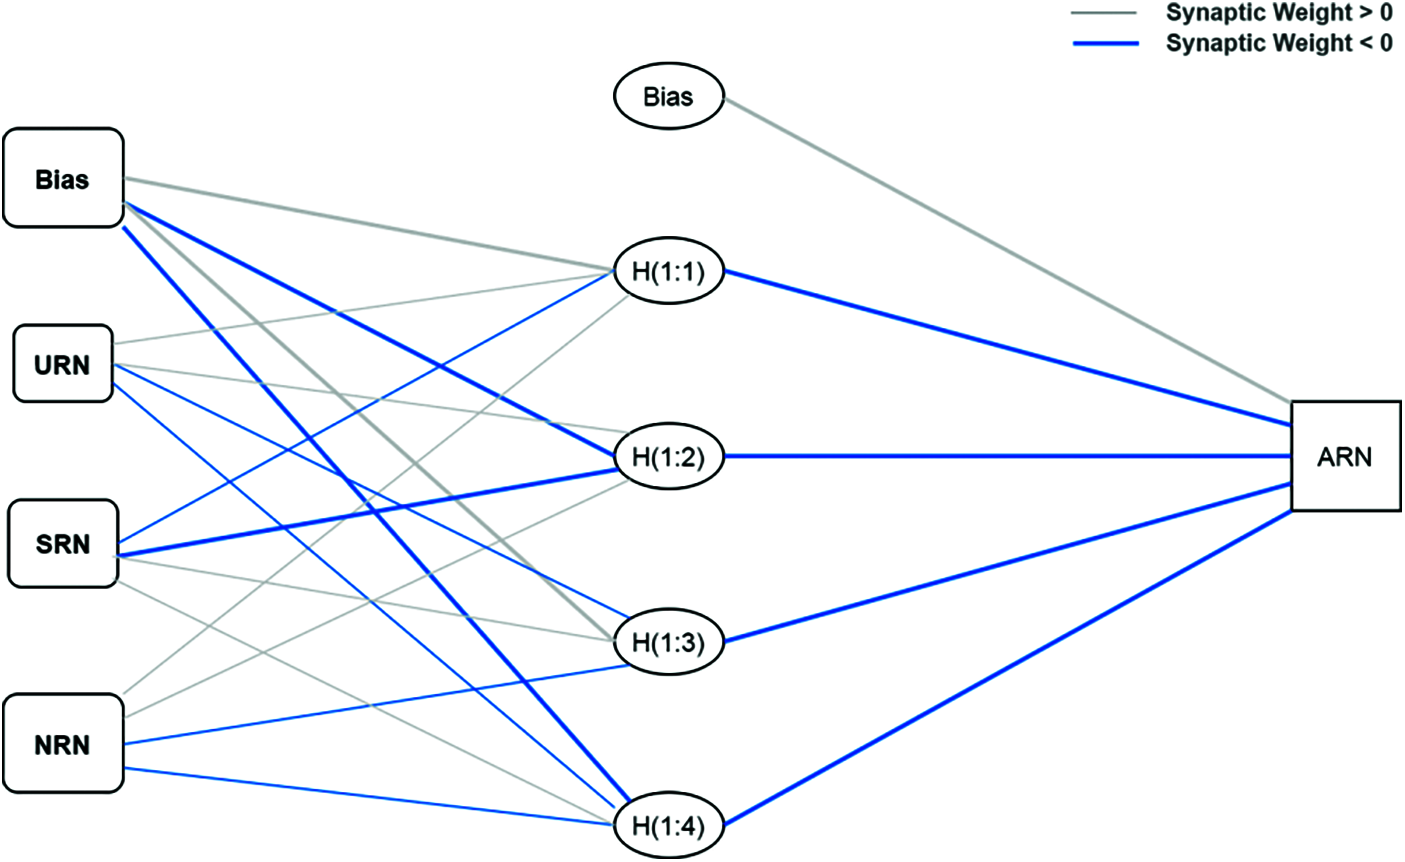
Figure 6: React Native Model. Note: Usability-React Native (URN); Satisfaction-React Native (SRN); Navigation-React Native (NRN); Adaptation-React Native (ARN).

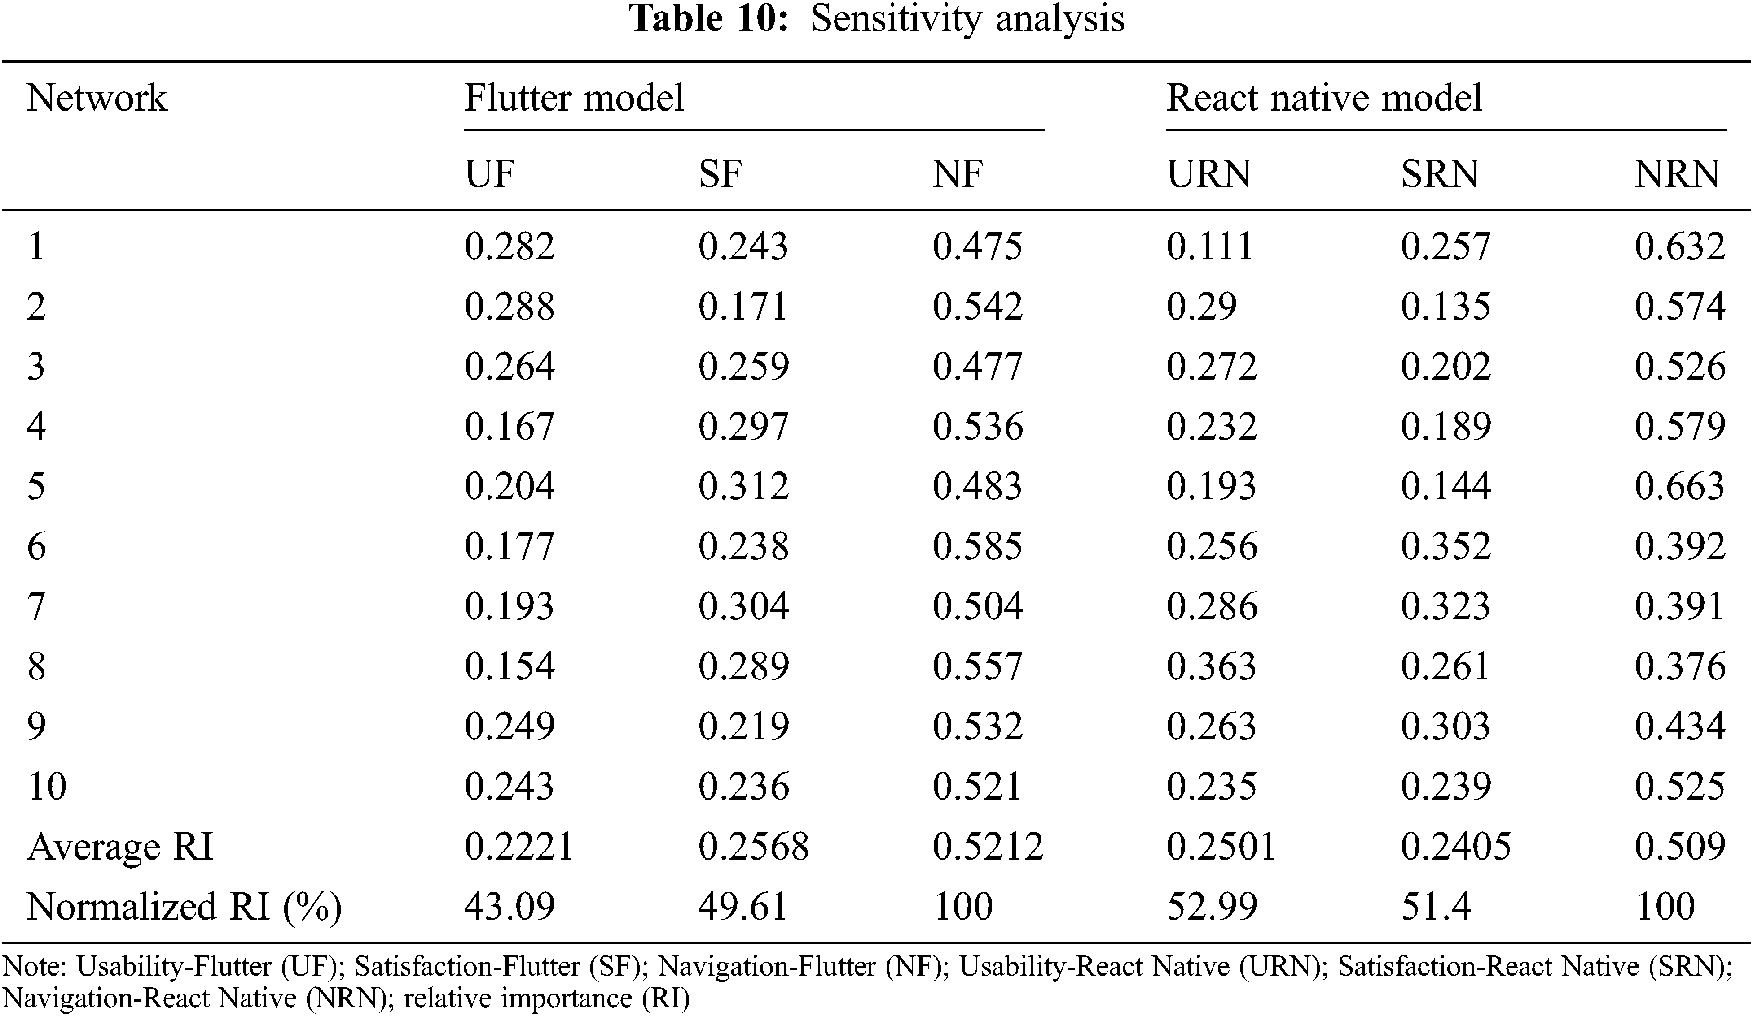
After establishing the predicted accuracy and predictive relevance of each of the ANN models, a sensitivity analysis is used to numerically evaluate the predictive potential of the exogenous variables with respect to endogenous factors [54,62]. The relative importance of each exogenous variable is calculated, with this used to compute the normalized relative importance, as shown in Tab. 10. The exogenous variables are then rated according to their normalized relative relevance in terms of the strength of their influence. Notably, the three variables are tested on both the Flutter model and the React Native model, with the navigation variable the most significant predictor of adaptation (with 100% normalized relative importance). In another finding, satisfaction (49.61%) performed better than usability (43.09%) in the Flutter model. However, usability (52.99%) slightly outperformed satisfaction (51.4%) in the React Native model. Finally, in both the ANN models, navigation has the greatest influence on adaptation, while satisfaction and usability are the weakest predictors.
The study results show that usability has a positive effect on adaptation (β = 0.145) (H1) in React Native and a positive effect in Flutter (β = 0.068) (H1). In addition, the ANN analysis confirmed this result and predicted the usability performance in React Native (52.99%) as being larger than in Flutter (43.09%). The biggest difference in the score from participants was for the usability factor, with React Native recorded as having higher usability than Flutter. Participants also confirmed that the response speed and animation in Flutter were higher than in React Native. With average scores, we found that overall scores varied, although they were closely related. The difference in grades between Flutter and React Native is something that we attributed to ease and flexibility of use, as this drop in performance was reiterated numerous times. This was also something of which we were aware and, thus, we were not surprised by the outcome.
The study results show that satisfaction has a positive effect on adaptation (β = 0.201) (H2) in Flutter, while no effect was noted in React Native (β = −0.13) (H2). A difference was recorded in scores by all participants who scored their satisfaction level higher in Flutter than in React Native. One participant mentioned that response time, speed, and satisfaction with the user interfaces as well as the animations caused this difference in registration between the two platforms, commenting that the difference was minuscule. The difference in scores between Flutter and React Native is something that we attributed to the extent to which participants were satisfied with the experiment’s performance, such as the speed of performance and the response in relation to their expectations.
The navigation variable was the most significant predictor of adaptation for both models. The SEM result showed that navigation had a positive effect on adaptation (β = 0.748) (H3) on React Native, with a positive effect also noted in Flutter (β = 0.639) (H3). The biggest difference in scores from participants was also in the Navigation factor, with React Native recording a higher navigation score than Flutter. Participants also mentioned that they found more adaptability in React Native than in Flutter.
The last factor, adaptation, showed a difference in participants’ scores with adaptation scoring differently in Flutter than in React Native. The overall variance explained by the adaptation cross-platform model in terms of the R2 value was 0.641 for Flutter, 0.0.587 for React Native, which were significantly large (f2 > 0.35), and consistent with the effect sizes identified for R2 by Cohen (1988) [63]. Although different scores were recorded, the difference between the best and the worst was only a few points. Adaptation was used to measure usability, satisfaction, and navigation in our evaluation to provide total points for different cross-platforms. The questions in this survey were completely relevant, making this test practical on these points. We used it in its broadest sense as we sought to find differences in shared platforms on more formal and standard levels. We focused our project on studying the following factors: usability, adaptation, satisfaction, and navigation.
After using the cross-platform as a solution for developers, we note that these solutions have both advantages and disadvantages for end-users. The study’s results show not only a comparison between them, but also include a comparison with another platform as well as native development.
One of the most important aspects of the user experience is the design of the user interface. In this study, we have seen the importance of highlighting the huge differences between React Native and Flutter in the design of user interfaces. We mentioned in this study that the React Native platform has been developed to take account of the designs and user interfaces supported in Android and iOS. While the Flutter platform is keen to work with its own material widgets and to adopt a special design and arrangement method for the components of its user interfaces, Flutter seeks to take account of the designs supported in the iOS operating system by developing libraries, such as Cupertino Widgets. Therefore, thanks to the use of tools provided by Flutter, user-friendly interface designs can be obtained for different operating systems, with this demonstrated by this study’s participants in the survey through the experiment. The React Native platform also provides a great user experience.
On the other hand, if we want to compare the two platforms in terms of speed of performance and execution, Flutter is superior in this respect to its React Native counterpart. The main feature that ensures Flutter excels in terms of speed is its programming language: Dart. Moreover, the Flutter platform uses JavaScript as a bridge to connect the native parts of each application. Developers face noticeable issues when using the React Native platform to develop hybrid mixed applications [25]. To address these problems, programmers need to return the application to its original environment and use the original libraries and components to address these bugs and software problems.
In this study, we found that Flutter is superior to React Native. The reason is that the Flutter platform offers a wide range of useful and effective documents that help application developers and significantly increase their activity. It is not only the quantity and richness of information in the Flutter platform about codes and tools. Instead, the documentation for React Native is somewhat confusing and may cause some problems for programmers [22]. Moreover, React Native has neglected to document and provide information on many important parts. As for tools and add-ons, the two platforms are competitive in providing the largest number of useful tools to facilitate the application development process. Flutter offers a range of integrated development environments (IDEs) and tools to help React Native. Flutter is also famous for its similarity to Visual Studio Code, Android Studio, etc.
7 Contributions and Implications
This study makes some contributions and has implications for the research field, developers, and users.
Limited research has examined and tested user experience of cross-platform applications and services [5,14,22,25]. This study contributes to the literature by identifying the factors that are needed to evaluate and study the user experience in cross-platform mobile applications and to address this gap by comparing it with native applications. Furthermore, Furthermore, Information Systems and IT adoption studies, using a hybrid measurement analysis, are lacking. Studies have suggested that more research should be undertaken that combines ML tools such as ANN with SEM [56,58,64]. Thus, this study establishes the proportional importance of critical characteristics that precede the prediction of mobile cross-platform adaptation by using the dual -stage SEM–ANN analysis to address this gap by ranking the examined factors. For instance, the core factor of adaptation, namely, navigation was the most significant predictor of adaptation for both models. These determinants are demonstrated to be conceptually and practically significant, with this paper adding to the body of knowledge by directly assessing their relative value using a two-stage approach.
This study helps developers to decide which platform is better in terms of the programming language used: Dart or JavaScript. This is one of the most important questions that concern engineers and developers before they start developing applications. No doubt, JavaScript is the most popular language and is the preferred option for most developers. In 2019, it was announced as one of the most popular programming languages on GitHub [41]. It receives wide support from search engines, servers, and smartphones. As Dart is still new, it does not receive as much attention as JavaScript. Moreover, Dart is developed by Google and carries the Google fingerprint and privacy. It is difficult to learn as a programming language.
On the other hand, the stability of the development platform is a key factor in the process of developing multiple applications and cross-platform applications. Therefore, the competition between the two platforms in this aspect is significant. Firstly, the Flutter platform was only available in an alpha version that was not suitable for long-term or medium-term application stability.
In May 2018, Google announced a new version of the platform: Flutter Beta 2 which is an improved and more stable version. It also provides a bundle of new resources and tools, and Google is continuing to offer improvements that make it stable. React Native is a fairly stable platform and is supported by a large network of developers and programmers.
Both Flutter and React Native support the Hot Reload feature, which enables programmers to preview the changes they make to application code to instantly ensure that they are correct. This greatly facilitates the work of developers. In fact, this feature is very important for developers today. They need to preview and monitor the changes they make to the app, especially if the app is used with multiple operating systems.
Finally, finding a development platform that requires less development time is very important for programmers. In this sense, the React Native platform is better than the Flutter platform as it greatly reduces application development times. This is one of the greatest advantages of the React Native platform. What gives React Native this advantage is that it uses what are known as segments which increase the speed of application development through the React Native platform. Ultimately, it is difficult to determine the best platform between the two platforms: React Native or Flutter. Each platform has its advantages and disadvantages. However, we must not overlook that Flutter is still new in the world of application development. As for React Native, it has made its way early and won the trust of developers and major international companies.
Initial evaluations favor the React Native platform over the Flutter platform. However, the latter is expected to achieve a promising future in the world of developing applications that cross operating systems. In fact, the decision to develop one of the two platforms depends on the developer himself/herself and his/her specific needs.
This study was designed to explore what it takes to create a promising user experience which could affect the extent of user association with the sustainable application used. The study also contributes to educating developers’ awareness about building a flexible user experience by examining each of the features provided by the platform in each operating system and then making a comparison between them.
This study investigates interactive user experience and adaptation in the cross-platform mobile user interface. Employing the user experience cross-platform assessment model and SEM–ANN approaches, the results show that usability, navigation, and satisfaction predict the user experience for a mobile cross-platform application. These results contribute both to research and practice. This study helps to create a sustainable user experience through the most common cross-platforms, namely, Flutter and React Native.
This study inevitably confronted several limitations. The possible methodological limitations for this study related to the questionnaire method. This study used a questionnaire technique to collect data. Consequently, future research may need to consider various methods of collecting all data, such as the loud thinking and observation techniques. Another methodological limitation of this study relates to the simple constructs used, with more usability and security factors needed. Responding to these limitations, future work could involve and test more factors, such as design features and security. Future research could also make a comparison between the two platforms using applications that include all the features discussed in this study.
Acknowledgement: The author thanks Qassim University and the Deanship pf Scientific Research for their support and funding the publication for this project. The author also thanks Master student: Maha Aldwahy for her help in developing the mobile app used in this study.
Funding Statement: The author received no specific funding for this study.
Conflicts of Interest: The authors declare that they have no conflicts of interest to report regarding the present study.
1. J. Meskens, J. Vermeulen, J. Luyten and K. Coninx, “Gummy for multi-platform user interface designs: Shape me, multiply me, fix me, use me,” in Proc. of the Working Conf. on Advanced Visual Interfaces, Association for Computing Machinery (ACM), New York, USA, pp. 233–240, 2008. [Google Scholar]
2. H. Henning, H. Sebastian and A. M. Tim, “Comparing Cross-Platform Development Approaches for Mobile Applications,” in Proc. of Web Information Systems and Technologies, Porto, Portugal, pp. 120–138, 2013. [Google Scholar]
3. V. Kaisa, M. Wäljas, J. Ojala and K. Segerståhl, “Identifying drivers and hindrances of social user experience in web services,” in Proc. of the SIGCHI Conf. on Human Factors in Computing Systems, New York, USA, pp. 2499–2502, 2010. [Google Scholar]
4. Y. Yamakami, “From user experience to social experience: A new perspective for mobile social game design,” in Proc. of the UFirst 2012, IEEE CS, Washington, USA, pp. 792–796, 2012. [Google Scholar]
5. K. Majrashi, M. Hamilton, A. Uitdenbogerd and S. Al-Megren, “Cross-platform usability model evaluation,” Multimodal Technologies and Interaction, vol. 4, no. 80, pp. 1–23, 2020. [Google Scholar]
6. E. L. Law and P. Van Schaik, “Modelling user experience—An agenda for research and practice,” Interacting with Computers, vol. 22, no. 5, pp. 5313–322, 2010. [Google Scholar]
7. Report and data, “Salient trends of cross-platform and mobile advertising market,” July 22, 2021. [Online]. Available: https://www.reportsanddata.com/report-detail/cross-platform-and-mobile-advertising-market. [Google Scholar]
8. M. Bačikov, “User experience design: Contrasting academic with practice,” in Proc. of the 13th Int. Conf. on Emerging ELearning Technologies and Applications (ICETA), Stary Smokovec, Slovakia, pp. 1–6, 2015. [Google Scholar]
9. T. Yamakami, “Exploratory analysis of differences between social experience design and user experience design,” in Proc. of 16th Int. Conf. on Advanced Communication Technology, Hangzhou, China, pp. 769–773, 2014. [Google Scholar]
10. A. Biørn-Hansen, T. Grønli, G. Ghinea and S. Alouneh, “An empirical study of cross-platform mobile development in industry,” Wireless Communications and Mobile Computing, vol. 2019, pp. 1–12, 2019. [Google Scholar]
11. Statista, “Cross-platform mobile frameworks used by software developers worldwide in 2019 and 2020,” July 22, 2021. [Online]. Available: https://www.statista.com/statistics/869224/worldwide-software-developer-working-hours. [Google Scholar]
12. M. Hassenzahl, “User experience and experience design,” In Encyclopedia of Human-Computer Interaction, 2nd ed, Denmark: The Interaction Design Foundation, pp. 1–14, 2011. [Google Scholar]
13. M. Hassenzahl and N. Tractinsky, “User experience—A research agenda,” Behavior Information Technology, vol. 25, no. 2, pp. 91–97, 2006. [Google Scholar]
14. L. Feng and W. Wei, “An empirical study on user experience evaluation and identification of critical UX issues,” Sustainability, vol. 11, no. 8, pp. 1–19, 2019. [Google Scholar]
15. L. Alben, “Quality of experience: Defining the criteria for effective interaction design,” Interactions, vol. 3, no. 3, pp. 11–15, 1996. [Google Scholar]
16. M. Biythe and P. Cairns, “Critical methods and user generated content: the iphone on youtube,” in Proc. of the SIGCHI Conf. on Human Factors in Computing Systems, Boston, USA, pp. 1467–1476, 2009. [Google Scholar]
17. J. Kiruthika, S. Khaddaj, D. Greenhill and J. Francik, “User experience design in web applications,” in Proc. of the 2016 IEEE Intl Conf. on Computational Science and Engineering (CSE) and IEEE Intl Conf. on Embedded and Ubiquitous Computing (EUC) and 15th Int. Symp. on Distributed Computing and Applications for Business Engineering (DCABES), Paris, France, pp. 642–646, 2016. [Google Scholar]
18. K. Samaan and F. Tarpin-Bernard, “Task models and interaction models in a multiple user interfaces generation process,” in Proc. of the 3rd Annual Conf. on Task Models and Diagrams, Association for Computing Machinery (ACM), USA, pp. 137–144, 2004. [Google Scholar]
19. A. Seffah and H. Javahery, “Multiple user interfaces: Cross-platform applications and context-aware interfaces,” in John Wiley & Sons, Ltd, Hoboken, New Jersey, USA, pp. 11–26, 2004. [Google Scholar]
20. P. S. Pyla, M. Tungare and M. Pérez-Quinones, “Multiple user interfaces: Why consistency is not everything, and seamless task migration is key,” in Proc. of the CHI 2006 Workshop on the Many Faces of Consistency in Cross-Platform Design, Montreal, Canada, 2006. [Google Scholar]
21. L. Nilsson, “Continuity of service in design for a specific platform: Combining service-and interaction design perspectives in a multiple platform environment,” Ph.D. dissertation, Linköping University, Sweden, 2006. [Google Scholar]
22. T. Dorfer, L. Demetz and S. Huber, “Impact of mobile cross-platform development on CPU, memory and battery of mobile devices when using common mobile app features,” Procedia Computer Science, vol. 175, pp. 189–196, 2020. [Google Scholar]
23. M. Bång, A. Larssonand, E. Berglund and H. Eriksson, “Distributed user interfaces for clinical ubiquitous computing applications,” International Journal of Medical Informatics, vol. 47, no. 7–8, pp. 545–551, 2005. [Google Scholar]
24. M. F. Ali, M. A. Perez-Quinones, M. Abrams and E. Shell, “Building multi-platform user interfaces with UIML,” In Computer-Aided Design of User Interfaces III, Berlin/Heidelberg, Germany: Springer, Berlin/Heidelberg, Germany, pp. 255–266, 2002. [Google Scholar]
25. W. S. El-Kassas, B. A. Abdullah, A. H. Yousef and A. M. Wahba, “Taxonomy of cross-platform mobile applications development approaches,” Ain Shams Engineering Journal, vol. 8, no. 2, pp. 163–190, 2017. [Google Scholar]
26. T. Dong, E. F. Churchill and J. Nichols, “Understanding the challenges of designing and developing multi-device experiences,” in Proc. of the 2016 ACM Conf. on Designing Interactive Systems, Association for Computing Machinery (ACM), New York, USA, pp. 62–72, 2016. [Google Scholar]
27. M. Levin, Designing Multi-Device Experiences: An Ecosystem Approach to User Experiences Across Devices, CA, USA: O'Reilly Media, 2014. [Google Scholar]
28. F. Brudy, C. Holz, R. Rädle, C. J. Wu, S. Houben et al., “Cross-device taxonomy: Survey, opportunities and challenges of interactions spanning across multiple devices,” in Proc. of the ACM Conf. on Human Factors in Computing Systems 2019, Association for Computing Machinery (ACM), New York, USA, 2019. [Google Scholar]
29. K. O.’Leary, T. Dong, J. K Haines, M. Gilbert, E. F. Churchill et al., “The moving context kit: Designing for context shifts in multi-device experiences,” in Proc. of the 2017 Conf. on Designing Interactive Systems, Association for Computing Machinery (ACM), New York, USA, pp. 309–320, 2017. [Google Scholar]
30. L. M. Sáhez-Adame, S. Mendoza, A. M. Viveros and J. Rodríguez, “Towards a set of design guidelines for multi-device experience,” in Proc. of the Int. Conf. on Human-Computer Interaction, Springer: Berlin/Heidelberg, Germany, pp. 210–223, 2019. [Google Scholar]
31. A. Biørn-Hansen, T. M. Grønli and G. A. Ghinea, “A survey and taxonomy of core concepts and research challenges in cross-platform mobile development,” ACM Computing Surveys, vol. 51, no. 5, pp. 1–34, 2019. [Google Scholar]
32. C. Rieger and H. Kuchen, “A model-driven cross-platform app development process for heterogeneous device classes,” in Proc. of the 52nd Hawaii Int. Conf. on System Sciences, Maui, Hawaii, USA, 2019. [Google Scholar]
33. I. Dalmasso, S. K. Datta, C. Bonnet and N. Nikaein, “Survey, comparison and evaluation of cross platform mobile application development tools,” in Proc. of the 9th Int. Wireless Communications and Mobile Computing Conf. (IWCMC), IEEE, Berlin/Heidelberg, Germany, pp. 323–328, 2013. [Google Scholar]
34. I. Mehmet and K. Murat, “Comparison and evaluation of cross platform mobile application development tools,” International Journal of Applied Mathematics, Electronics and Computers, vol. 8, no. 4, pp. 273–281, 2020. [Google Scholar]
35. E. Angulo and X. Ferre, “A case study on cross-platform development frameworks for mobile applications and UX,” in Proc. of the XV Int.Conf. in Human Computer Interaction, Puerto de la Cruz, Tenerife, Spain, pp. 1–8, 2014. [Google Scholar]
36. N. Bevan, “International standards for HCI and usability,” International Journal of Human-Computer Studies, vol. 55, no. 4, pp. 533–552, 2001. [Google Scholar]
37. D. Djamasbi, G. V. Kardzhaliyski, T. Liu and F. E. Ogles-by, “App-like mobile optimization and user experience,” in Proc. of the Twelfth Annual Workshop on HCI Research in MIS, Milan, Italy, pp. 12, 2013. [Google Scholar]
38. A. Bouabid, S. Lepreux and C. Kolski, “Design and evaluation of distributed user interfaces between tangible tabletops,” Universal Access in the Information Society, vol. 18, pp. 801–819, 2019. [Google Scholar]
39. J. Benedek and T. Miner, “Measuring desirability: New methods for evaluating desirability in a usability lab setting,” in Proc. Usability Professionals Association, Redmond, Washington ,USA, vol. 2003, pp. 57, 2002. [Google Scholar]
40. Flutter, July 28, 2021. [Online]. Available: https://flutter.dev. [Google Scholar]
41. Introduction to Dart VM, July 28, 2021. [Online]. Available: https://mrale.ph/dartvm. [Google Scholar]
42. J. Nielsen, “Usability inspection methods,” in Proc. of the Conf. Companion on Human Factors in Computing Systems, in Association for Computing Machinery (ACM), New York, USA, pp. 413–414, 1994. [Google Scholar]
43. T. S. Tullis and J. N. Stetson, “A comparison of questionnaires for assessing website usability,” in Proc. of the Usability Professional Association Conf, Minneapolis, USA, pp. 1–12, 2004. [Google Scholar]
44. J. Rubin and D. Chisnell, “Handbook of Usability Testing: How to Plan, Design, and Conduct Effective Tests,” 2nd ed., New Jersey, USA: John Wiley & Sons, 2008. [Google Scholar]
45. W. Chin, “The partial least squares approach to structural equation modeling,” in G. A. Marcoulides (EdIn Modern Methods for Business Research, Mahwah, New Jersey, Lawrence Erlbaum Associates, pp. 295–336, 1998. [Google Scholar]
46. C. M. Ringle, S. Wende and J. M. Becker, “SmartPLS 3. Boenningstedt: SmartPLS GmbH,” 2015. [Online]. Available: http://www.smartpls.com. [Google Scholar]
47. J. F. Hair, G. T. Hult, C. M. Ringle and M. A. Sarstedt, “A primer on partial least squares structural equation modeling (PLS-sEM),” Sage Publications, 2021. [Google Scholar]
48. C. D. Fornell and D. F. Larcker, “Evaluating structural equation models with unobservable variables and measurement error,” Journal of Marketeering Research, vol. 18, no. 1, pp. 39–50, 1981. [Google Scholar]
49. D. W. Straub, M. C. Boudreau and D. Gefen, “Validation guidelines for IS positivist research,” Communications of the Association of Information Systems, vol. 13, no. 24, pp. 380–427, 2004. [Google Scholar]
50. J. J. Hew, L. Y. Leong, G. W. Tan, V. H. Lee and K. B. Ooi, “Mobile social tourism shopping: A dual-stage analysis of a multi-mediation model,” Tourism Management, vol. 66, pp. 121–139, 2018. [Google Scholar]
51. J. E. Scot and S. Walczak, “Cognitive engagement with a multimedia ERP training tool: Assessing computer self-efficacy and technology acceptance,” Information and Management, vol. 46, no. 4, pp. 221–232, 2009. [Google Scholar]
52. F. T. Chan and A. A. Chong, “A SEM–neural network approach for understanding determinants of interorganizational system standard adoption and performances,” Decision Support Systems, vol. 54, no. 1, pp. 621–630, 2013. [Google Scholar]
53. J. F. Hair, M. A. Sarstedt, C. M. Ringle and S. P. Gudergan, “Advanced Issues in Partial Least Squares Structural Equation Modeling,” Thousand Oaks, California, USA: Sage publications, 2017. [Google Scholar]
54. A. C. Teo, G. W. Tan, K. B. Ooi, T. S. Hew and K. T. Yew, “The effects of convenience and speed in m-payment,” Industrial Management and Data Systems, vol. 115, no. 2, pp. 311–331, 2015. [Google Scholar]
55. R. Joshi and R. Yadav, “An integrated SEM neural network approach to study effectiveness of brand extension in Indian FMCG industry,” Business Perspectives and Research, vol. 6, no. 2, pp. 113–128, 2018. [Google Scholar]
56. Y. Li, S. Yang, S. Zhang and W. Zhang, “Mobile social media use intention in emergencies among Gen Y in China: An integrative framework of gratifications, task-technology fit, and media dependency,” Telematics and Informatics, vol. 42, pp. 101244, 2019. [Google Scholar]
57. A. Ahani, N. Z. Rahim and M. Nilashi, “Forecasting social CRM adoption in SMEs: A combined SEM-neural network method,” Computers Human Behavior, vol. 75, pp. 560–578, 2017. [Google Scholar]
58. Y. A. Qasem, S. Asadi, R. Abdullah, Y. Yah, R. Atan et al., “Multi-analytical approach to predict the determinants of cloud computing adoption in higher education institutions,” Applied Sciences, vol. 10, no. 14, pp. 4905, 2020. [Google Scholar]
59. A. Y. Chong, “Predicting m-commerce adoption determinants: A neural network approach,” Expert Systems with Applications, vol. 40, no. 2, pp. 523–530, 2013. [Google Scholar]
60. P. C. Chang, J. J. Lin and W. Y. Dzan, “Forecasting of manufacturing cost in mobile phone products by case-based reasoning and artificial neural network models,” Journal of Intelligent Manufacturing, vol. 23, no. 3, pp. 517–531, 2012. [Google Scholar]
61. G. W. Tan, K. B. Ooi, L. Y. Leong and B. Lin, “Predicting the drivers of behavioral intention to use mobile learning: A hybrid SEM-neural networks approach,” Computers in Human Behavior, vol. 36, pp. 198–213, 2014. [Google Scholar]
62. K. B. Ooi and G. W. Tan, “Mobile technology acceptance model: An investigation using mobile users to explore smartphone credit card,” Expert Systems and Applications, vol. 59, pp. 33–46, 2016. [Google Scholar]
63. J. Cohen, “S Tatistical Power Analysis for the Behavioral Sciences,” 2nd ed, Hillsdale, Lawrence Erlbaum Associates, New Jersey, USA, 1988. [Google Scholar]
64. S. A. Alwabel and X. J. Zeng, “Data-driven modeling of technology acceptance: A machine learning perspective,” Expert Systems with Applications, vol. 18, pp. 115584, 2021. [Google Scholar]
 | This work is licensed under a Creative Commons Attribution 4.0 International License, which permits unrestricted use, distribution, and reproduction in any medium, provided the original work is properly cited. |