DOI:10.32604/csse.2022.022955
| Computer Systems Science & Engineering DOI:10.32604/csse.2022.022955 | |
| Article |
Soft Computing Based Discriminator Model for Glaucoma Diagnosis
1Department of Information Science and Engineering, NHCE, Visvesvaraya Technological University, Bangalore, India
2Department of Computer Science and Engineering, Nagarjuna College of Engineering and Technology, Bangalore, India
*Corresponding Author: Anisha Rebinth. Email: rebinth.anisha@gmail.com
Received: 24 August 2021; Accepted: 25 September 2021
Abstract: In this study, a Discriminator Model for Glaucoma Diagnosis (DMGD) using soft computing techniques is presented. As the biomedical images such as fundus images are often acquired in high resolution, the Region of Interest (ROI) for glaucoma diagnosis must be selected at first to reduce the complexity of any system. The DMGD system uses a series of pre-processing; initial cropping by the green channel’s intensity, Spatially Weighted Fuzzy C Means (SWFCM), blood vessel detection and removal by Gaussian Derivative Filters (GDF) and inpainting algorithms. Once the ROI has been selected, the numerical features such as colour, spatial domain features from Local Binary Pattern (LBP) and frequency domain features from LAWS are generated from the corresponding ROI for further classification using kernel based Support Vector Machine (SVM). The DMGD system performances are validated using four fundus image databases; ORIGA, RIM-ONE, DRISHTI-GS1, and HRF with four different kernels; Linear Kernel (LK), Polynomial Kernel (PK), Radial Basis Function (RBFK) kernel, Quadratic Kernel (QK) based SVM classifiers. Results show that the DMGD system classifies the fundus images accurately using the multiple features and kernel based classifies from the properly segmented ROI.
Keywords: Glaucoma; support vector classification; clustering technique; spatial domain and frequency domain features
Glaucoma is the second leading cause of vision loss globally, and the estimated number of people suffering from this eye disease worldwide in the year 2040 will be 111.8 million [1]. Loss of sight in glaucoma is the result of progressive damage to the optic nerve, particularly in its upper and lower parts, with a resulting characteristic pattern of visual field loss, superiorly, inferiorly and nasally, with eventual tunnel vision. The commonest form of this disease is chronic simple glaucoma. Fortunately, in chronic glaucoma, the damage often progresses slowly. Patients may not experience any problems with their vision for years as good central vision is usually retained until the later stages of the disease. In many cases, the condition is discovered by an optician during a regular eye examination. To aid the diagnosis of glaucoma, a new computerized classification system based on soft computing is designed after reviewing the following existing techniques.
Ensemble classifier fusion is discussed for glaucoma diagnosis in [2]. Features based on the structure of the vascular using local binary pattern and from the segmented Optic Disc (OD) and Optic Cup (OC) such as energy of OD, radius of OD and OC and their ratio are utilized. Consensus based fusion approach is employed using the outputs of SVM, K-Nearest Neighbour [3] and Random Forest (RF) classifiers. A super pixel classification approach is discussed in [4] for glaucoma diagnosis. After segmentation by simple linear iterative clustering approach, feature extraction and classification by SVM are performed based on super pixel approach.
Discrete wavelet transform is discussed in [5] for fundus image classification. Texture features from horizontal, vertical and diagonal directions are obtained from the DWT decomposition and are fetched to Neural Network (NN) classifier for the diagnosis. Complex wavelet transform based glaucoma diagnosis is discussed in [6]. For OD segmentation, fuzzy-c-means clustering is applied on the value component of the HSV colour space. Multilayer perception, SVM, RF and Adaboost classifiers utilize the features such as ratio of OD and OC, neo-retinal rim area, blood vessels ratio and complex wavelet features for the classification.
LAWS based micro statistical feature are employed in [7] for glaucoma diagnosis. After extracting the OD region with an assumption that OD region is brightest in the green channel, texture energy features are extracted and NN classifier is used for the classification. Shearlet based texture energy feature is utilized in [8] for glaucoma diagnosis. The selected ROI is decomposed by Shearlet and then statistical and occurrence features are extracted. The classification is performed by the SVM classifier.
Generative adversarial network based glaucoma diagnosis is discussed in [9]. As the network is a generative model, the model is reconfigured to diagnose glaucoma in a semi-supervised mode. The output layer is modified to classify the fundus images. An 18-layer convolutional NN is employed in [10] for glaucoma diagnosis. Batch normalization is utilized for faster learning and max pooling layer is used for dimension reduction.
Recently, deep learning architectures are designed in [11] for many image processing applications including glaucoma diagnosis. Though they provide promising results, their architectures are very complex to understand [12]. They have many parameters such as batch size, optimizer, epochs and activation functions in both hidden and output layer to fine tune the network in order to get proper results [13]. The conventional classifiers can achieve better performance if dominant features are extracted from the OD region [14].
The measurement of OC and OD region is discussed in [15] for glaucoma diagnosis. Different machine learning techniques are reviewed o diagnose the damage of the optic nerve head and to diagnose the glaucoma. Deep learning based glaucoma diagnosis systems are discussed in [16–18]. Transfer learning is utilized successfully in classifying fundus images recently. In transfer learning, the pretrained neural architectures such as visual geometric group, residual network and GoogleNet are employed. Super pixel segmentation approach is discussed in [19] for glaucoma diagnosis. CDR is the main parameter used for glaucoma diagnosis after segmentation of OC and OD regions by super-pixel classification.
In this study, soft computing based discriminator model for glaucoma diagnosis is presented. The rest of this study is as follows: Section 2 describes the DMGD system design and the methods used in three stages of the system. Section 3 validates the DMGD system using cross validation on four different databases; ORIGA, RIM-ONE, DRISHTI-GS1, and HRF. The final section concludes the DMGD system performances for glaucoma diagnosis.
The system designed for glaucoma diagnosis is considered as a discrimination problem. It is defined by “Given a particular member of the population, whose class is unknown, predict this individual’s class from its attributes”. Let us consider a population of individuals, i = 1, …N. Suppose this population is a mixture of distinct sub-populations or classes. In this study, the classes will be described as normal and abnormal (glaucoma). Let yi denote the class of individual i and a set of variables (called the features) that can be measured for any individual in the population. The particular values of the features measured on individual i will be denoted by the vector xi. The vector xi will be referred to as the attributes of individual i. The training set with known features and classes is then used to produce a discrimination that classifies the unknown samples.
Fig. 1 shows the DMGD system using soft computing techniques. The DMGD system consists of three stages; preprocessing, multiple features extraction, and kernel-based classification. The preprocessing steps includes colour component separation, initial segmentation, SWFCM based OD segmentation, blood vessel detection and blood vessel removal by inpainting algorithm. All preprocessing steps except blood vessel removal are applied on the green channel and the outputs are superimposed on the colour images. Only the inpainting algorithm is applied on the colour image. Colour based statistical features, LBP and LAWS based features are extracted in the multiple feature extraction stage and finally kernel based classification is employed using SVM classifier for fundus image classification.
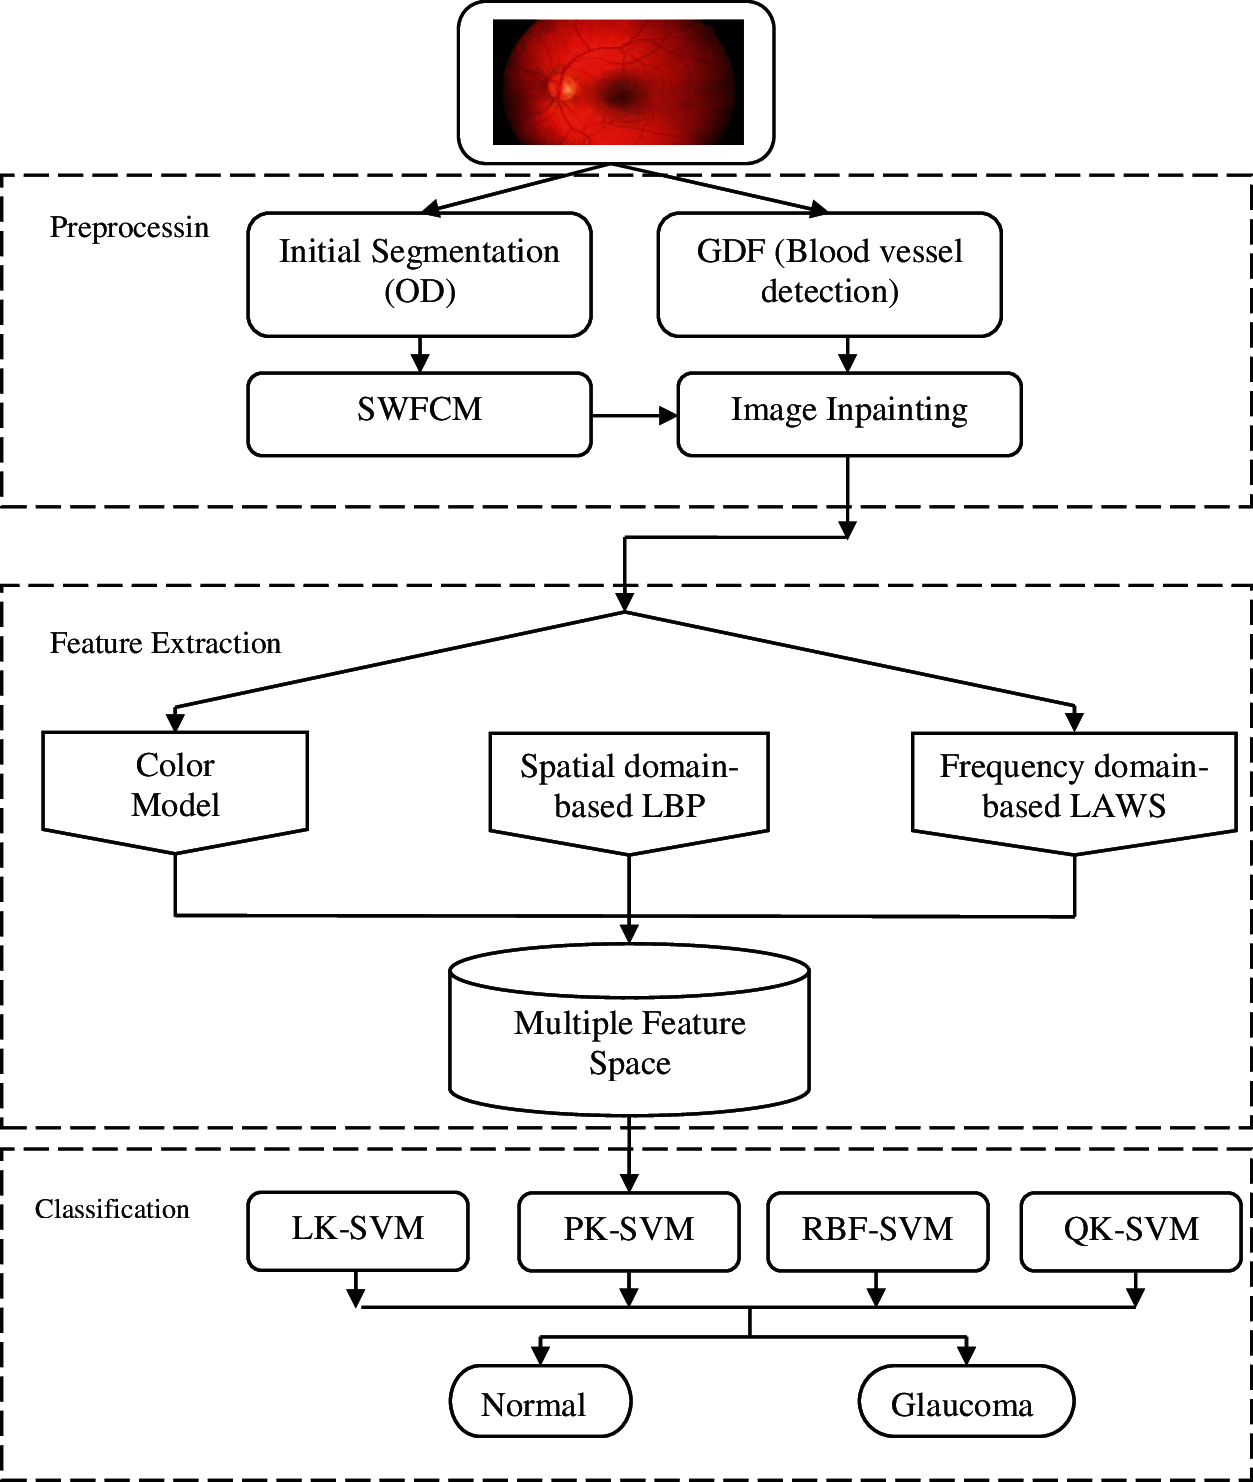
Figure 1: Soft computing discriminator model for glaucoma diagnosis
The first stage of the system is crucial in any classification system as the system’s performance mainly depends on it. If the input data has unwanted information such as background information, image details and noise, then they will degrade the system performance. A series of image processing techniques are applied to extract the OC and OD region [7]. Initial cropping around the OD region is made automatically based on the intensity of the green channel [8]. It is well known that OD is the brightest region in the fundus image, and thus this property is utilized for initial segmentation. Fig. 2 shows the colour components of the fundus image and Fig. 3 shows the results of initial segmentation.
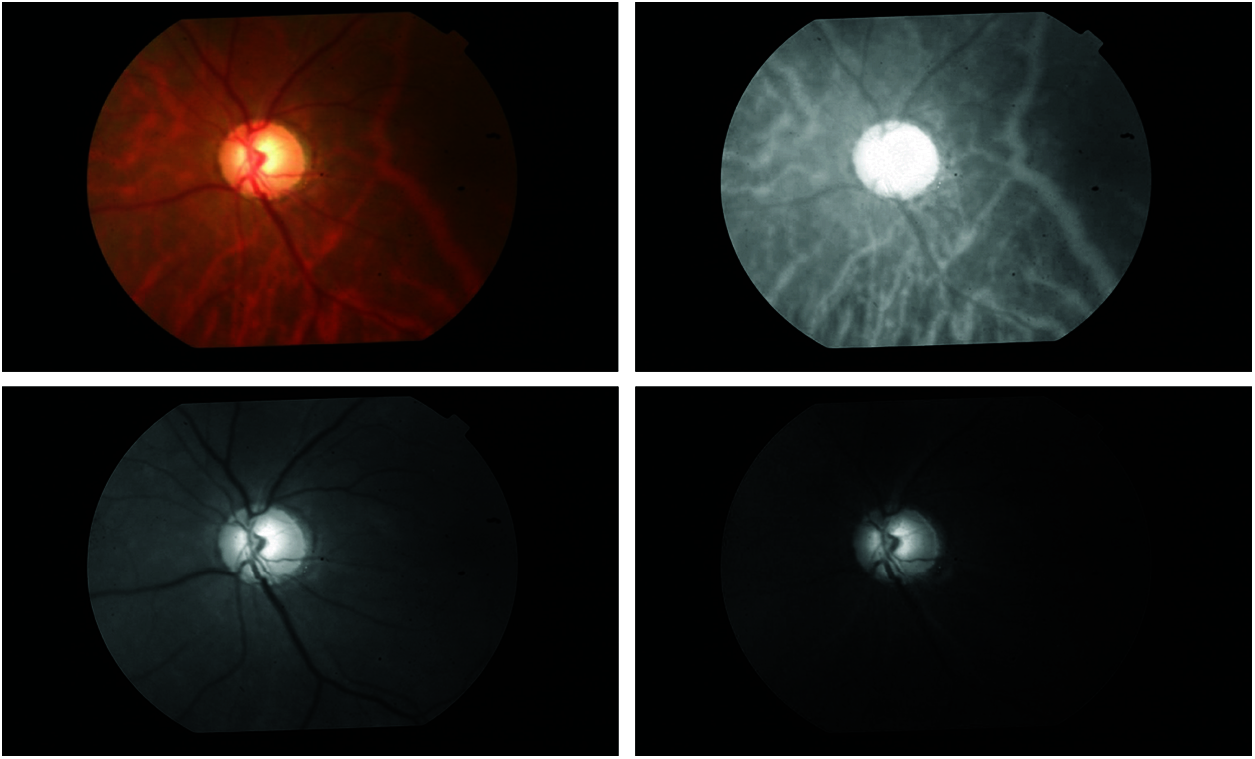
Figure 2: Colour components of a fundus image

Figure 3: Outputs of initial segmentation (a) input image (b) initial segmentation
After initial segmentation, SWFCM [20] clustering approach is utilized to segment the OD region from its background. As SWFCM uses spatial information between the pixels and thus provides better segmentation than FCM and k-means clustering. Fig. 4 shows the obtained OD region from the ROI using SWFCM.

Figure 4: Obtained OD region using SWFCM (a) input for SWFCM (b) OD region by SWFCM
To remove the blood vessels inside the OD region, it should be segmented at first. A 2nd Order Gaussian Derivative Filter (GDF) [21] is designed to extract the blood vessels in the fundus image. Fig. 5 shows the segmented blood vessels inside the OD region.

Figure 5: Segmented blood vessels in the OD region (a) input for GDF (b) blood vessel detection by GDF
After blood vessel segmentation, inpainting approach [22] is employed to remove the blood vessels inside the OD region. Fig. 6 shows the results of inpainting to remove the blood vessels. A fast non-iterative inpainting algorithm based on the 1st order transport equations is employed. While transporting, the image values are estimated coherently by means of structure tensor and fast marching method. The coherence strength determines the transport methods such as directional transport or diffusion transport.

Figure 6: OD region with no blood vessels (a) input for inpainting (b) blood vessel removed image
2.2 Multiple Feature Extraction
The second stage of the DMGD system extracts multiple features from the OD region obtained from the first stage. The feature set contains spatial as well as frequency domain features. In the spatial domain, a standard set of commonly used statistical features [23] such as mean, standard deviation, skewness and kurtosis are extracted at first from red, green and blue channel independently. As the colour features are varied against illumination, Local Binary Pattern (LBP) [24] is extracted and added to the feature set, which has illumination invariant property. Though the spatial domain features provide colour and texture information, they are unable to provide image singularities. The LBP defined for a gray scale image is as follows;
where c in the sub-script denoted the center pixel and n represents the neighbourhood pixels. The definition for T (threshold function) is defined by
To add image singularities to the feature set, LAWS features [25] are extracted from the OD region. LAWS employ local masks to detect various types of textures. Each mask is designed to respond to a different local property. Law’s provides variation such as ripple (wavy texture), spot (point texture), level (flat surface) and edges within a specified fixed-size window. Features derived from laws masks provide good spatial discrimination since the determined measure is well localized. Fig. 7 shows the Laws texture map obtained from the green channel of the blood vessel removed image. All the extracted features in this stage are combined to form the feature space.
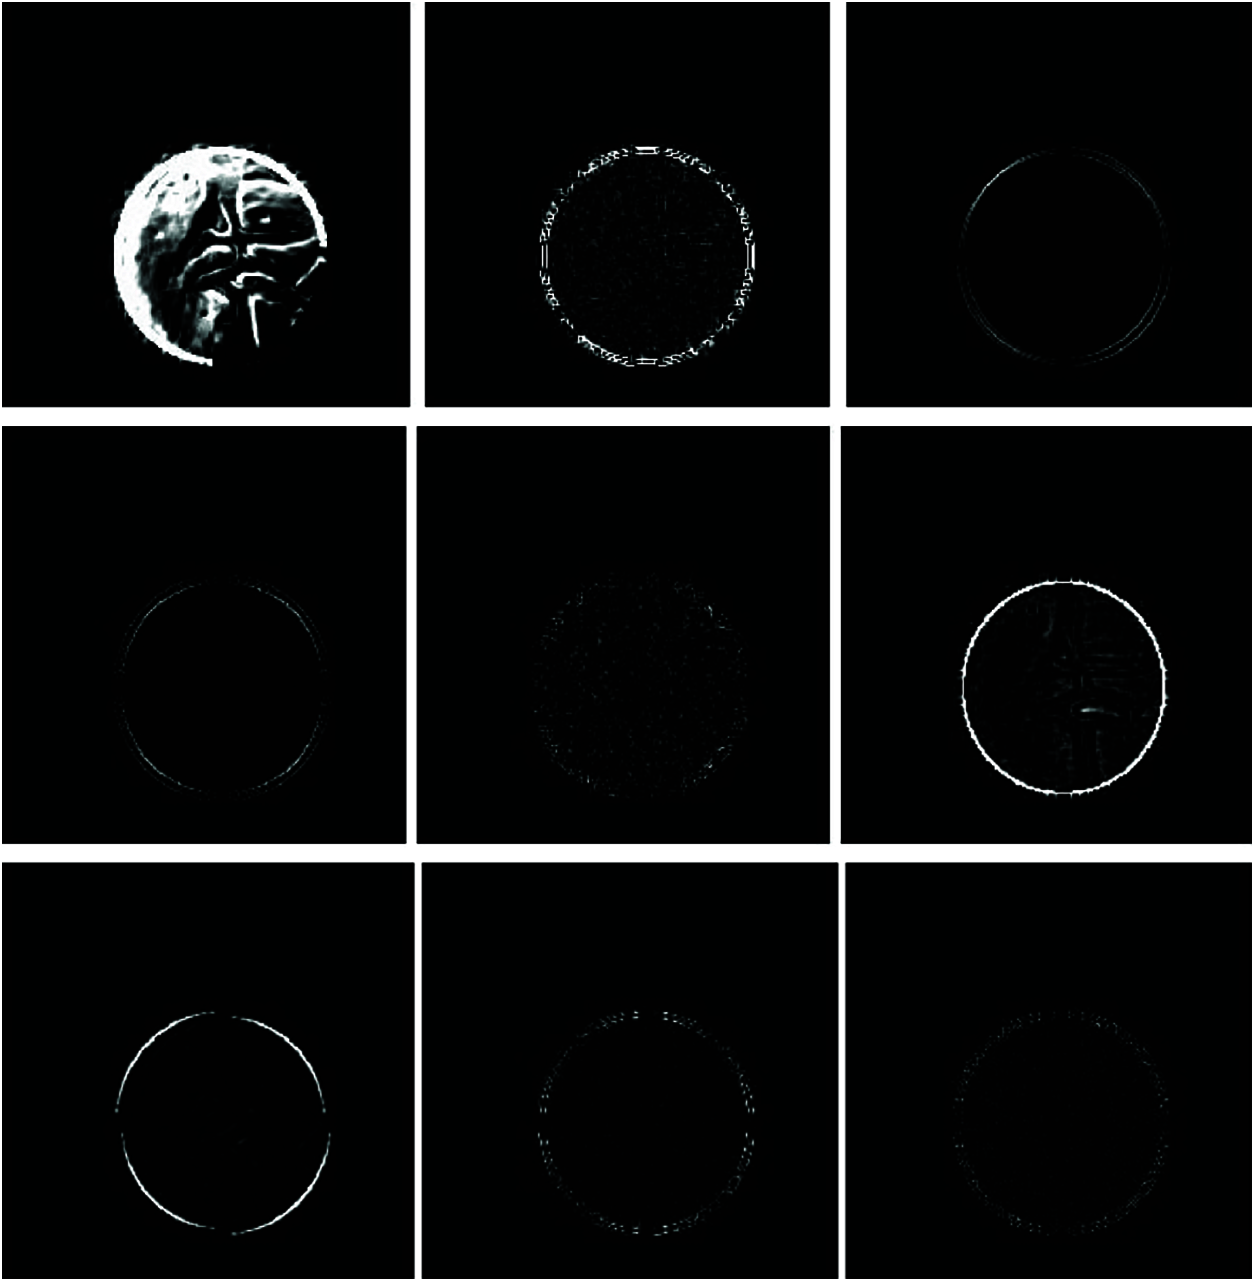
Figure 7: LAWS texture map
2.3 Kernel Based Classification
The third stage of the DMGD system classifies the given fundus image as either glaucomatous or normal based on the feature space. SVMs construct a hyper plane as the decision surface in such a way that the margin of separation between the positive and negative samples is maximized in an appropriate feature space, known as the maximal margin rule. SVMs combined the kernel function with large-margin hyper planes, leading to kernel-based SVMs [26] that are highly successful in solving various nonlinear and non-separable problems in machine learning. The hyper plane in the kernel (k) defined feature space with bias (b) is given by
Also, the following regularized (reg) optimization risk is expected to be minimized.
where ‖‖ denotes the norm in the transformed feature space k with support vectors (ω) for xi samples. By the Lagrange multipliers (β = [β1, β2, ……βl]T), the above equation is equivalent to solve the following quadratic programming problem.
and,
This stage uses SVM classifier with four different kernels; LK, PK, RBF, QK and their performances are independently analyzed. SVM classifier calculates a hyper plane that separates the feature space with maximum margin. The kernel definitions are given in Tab. 1.
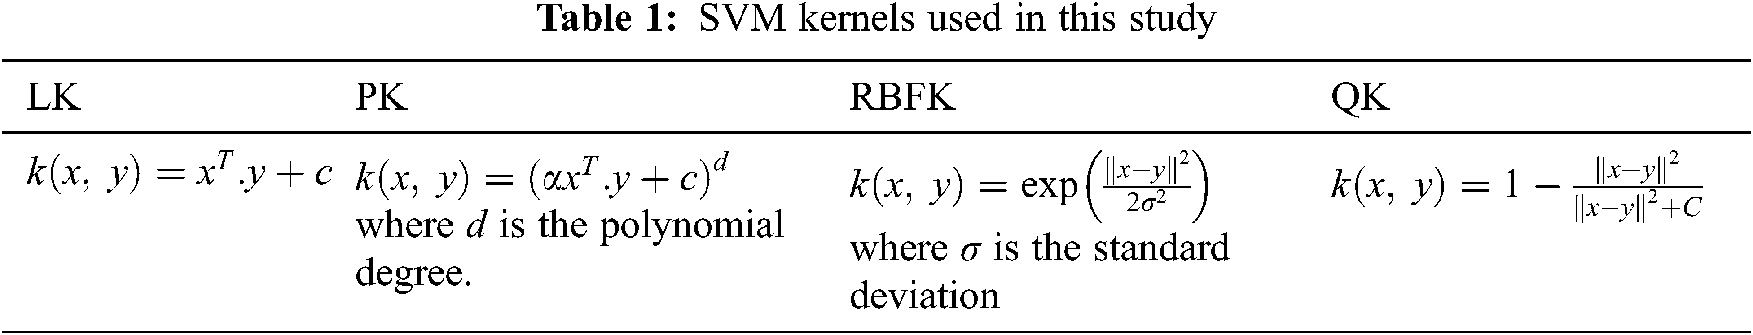
The LK function classifies the fundus images exactly into two sets. When decision boundary does not classify the datasets correctly, the kernel function is used to classify the images in high dimensional space. PK is a time consuming non-stationary kernel. When the feature space is divided by a highly non linear decision boundary, then RBF classifies the fundus images with higher classification accuracy than QK and other kernels.
This section discusses the performances of the DMGD system using five different fundus image databases along with the experimental setup. The performances of DMGD system analyzed using confusion matrices and Receiver Operating Characteristics (ROCs) are also discussed.
The proposed system is evaluated using four different databases, such as ORIGA [27], RIM-ONE [28], DRISHTI-GS1 [29], and HRF [30]. Tab. 2 shows the description of each database used for glaucoma diagnosis.
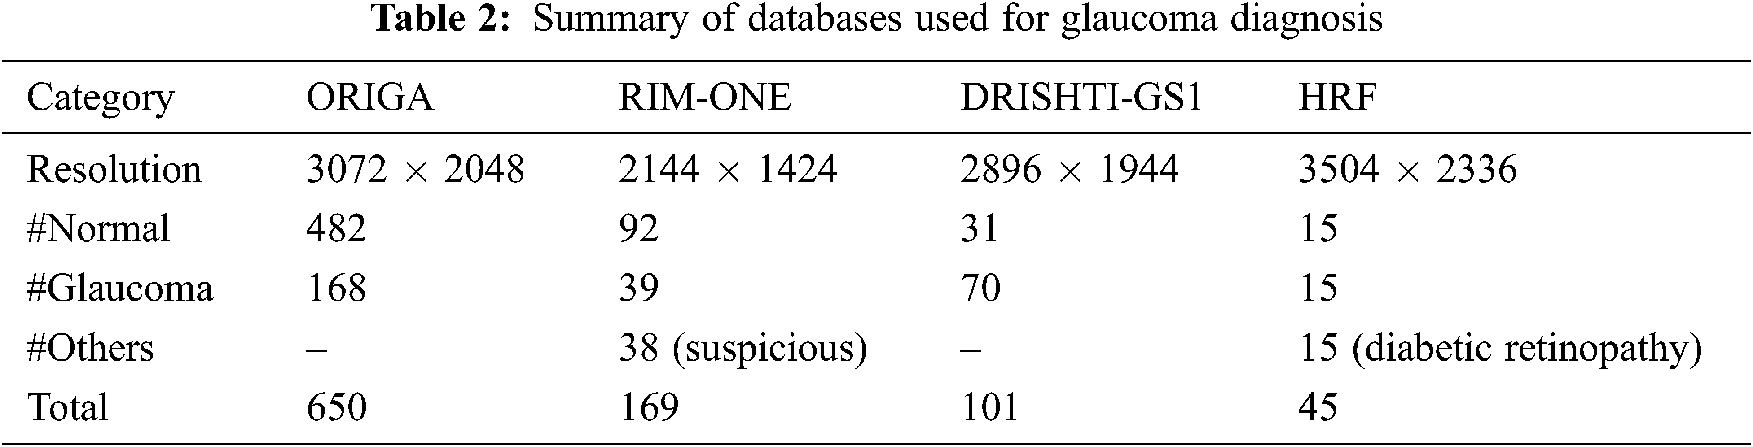
Apart from glaucomatous images, RIM-ONE has 38 suspicious images, and HRF has 15 diabetic retinopathy images. They are not included in this study as the system only classifies the glaucomatous images. Fig. 8 shows samples from the databases used in this work.

Figure 8: Fundus images (a) ORIGA (b) RIM-ONE (c) DRISHTI-GS1 (d) HRF
To test the proposed system, a re-sampling procedure named Cross-Validation (CV) is employed where a portion of data is used for training and later uses the remaining data for testing. As the number of data available to validate the model is limited, the k-fold (10-fold) technique in CV is used. Fig. 9 shows the k-fold technique in the CV.
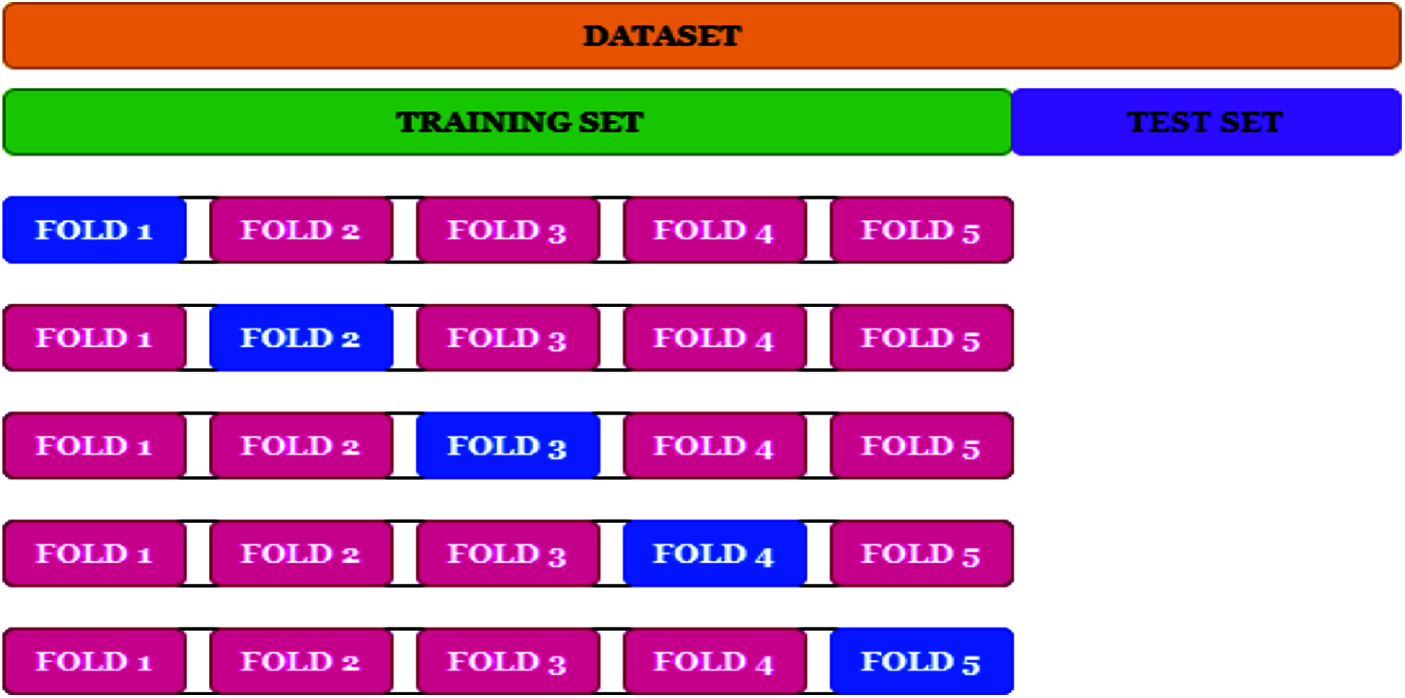
Figure 9: k-fold technique in CV
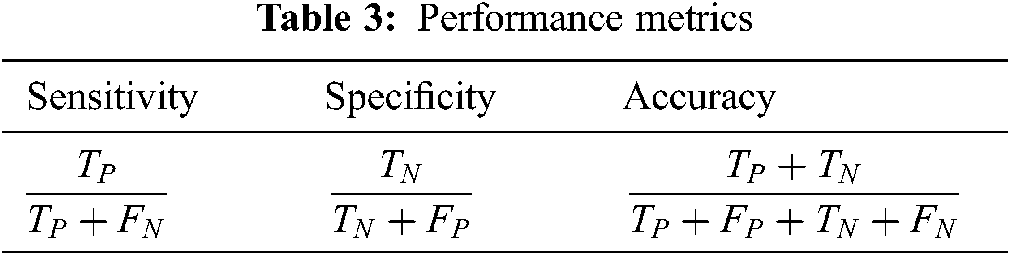
To evaluate the performance metrics such as accuracy, sensitivity and specificity, update TP and FN if glaucoma image is correctly classified and incorrectly classified respectively while testing each fold. Similarly, update TN and FP if normal image is correctly classified and incorrectly classified. Finally, the performance of the system is evaluated based on these parameters. Tab. 3 shows the performance metrics used for glaucoma diagnosis.
3.2 Analysis of DMGD’s Performances
Tab. 4 shows the performances of DMGD system using kernel based SVM classifier. The performance of DMGD system is analyzed using same set of images for all kernel based classifiers; LK-SVM, RBF-SVM, QK-SVM and PK-SVM.
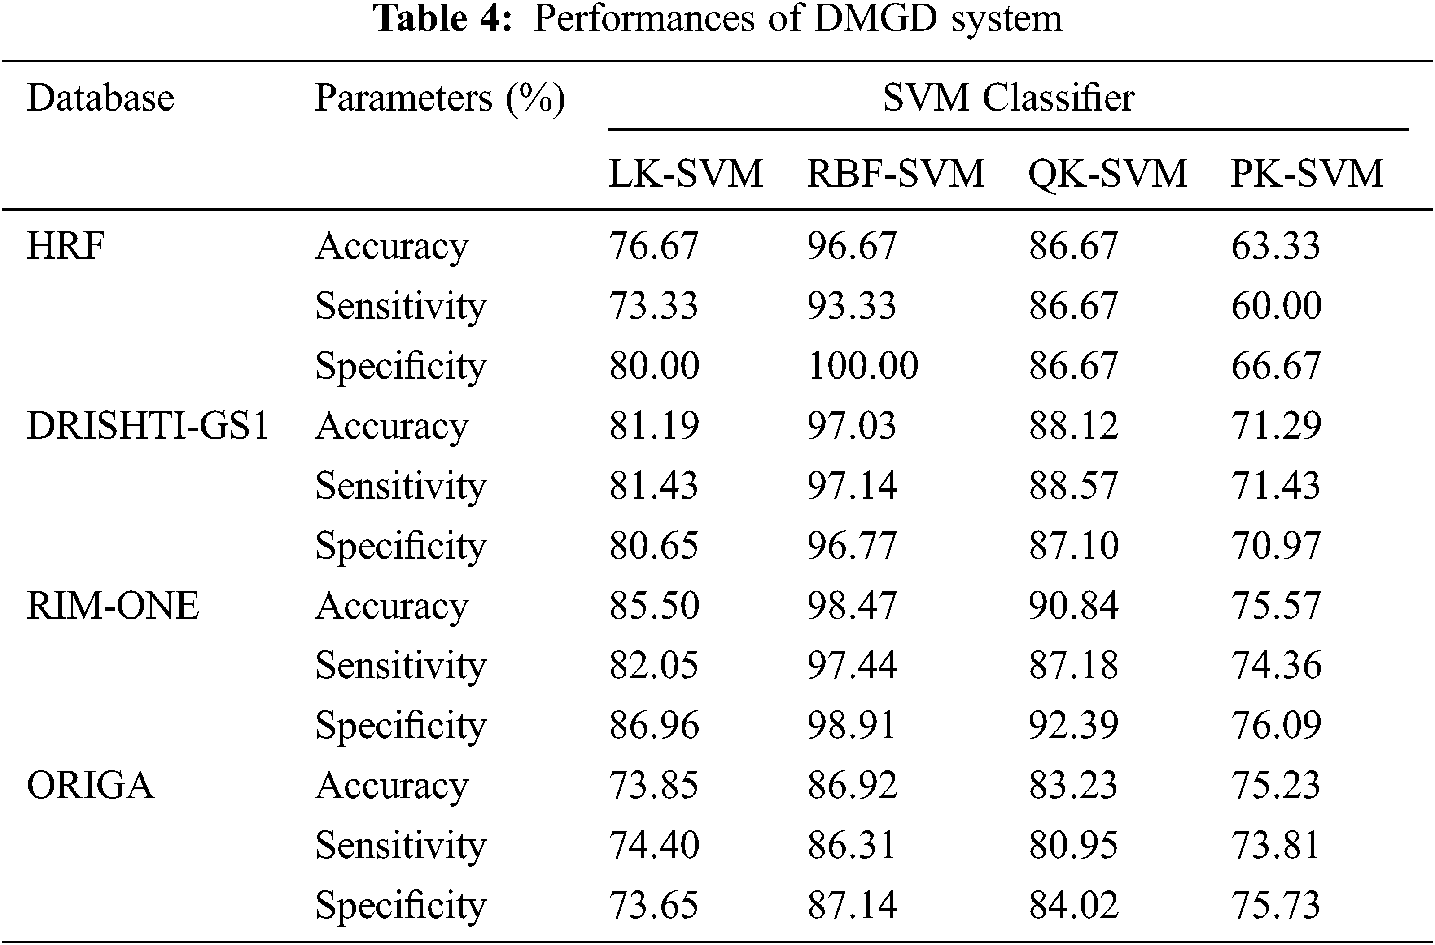
It can be seen from Tab. 4 that RBF-SVM classifier in DMGD system is better than LK-SVM, QK-SVM and PK-SVM. All normal images in the HRF database are correctly classified (specificity of 100%) whereas only one abnormal image is misclassified (sensitivity of 93.33%) by the RBK kernel based classifier. For DRISHTI-GS1 database, RBF-SVM provides 97.03% accuracy followed by QK-SVM classifier with 88.12%. For RIM-ONE and ORIGA database also, RBF-SVM gives maximum results than other kernel based classifiers with 98.47% and 86.92% accuracy respectively. It is inferred that the least performer for glaucoma diagnosis is PK-SVM with less than 75% accuracy for all databases. Fig. 10 shows the confusion matrices for the highest performer (RBF-SVM) that gives the exact number of classified images.

Figure 10: DMGD system confusion matrices by RBF-SVM (a) HRF (b) DRISHTI-GS1 (c) RIM-ONE (d) ORIGA
It can be seen from Fig. 10 that more number of images in ORIGA database are misclassified than HRF (1), DRISHTI-GS1 (2) and RIM-ONE (2). Due to more misclassification, the performance of DMGD system on ORIGA images is around 85% where as it is over 95% for all other databases. Fig. 11 shows the combined ROCs of DMGD system.

Figure 11: Combined ROCs of DMGD system (a) HRF (b) DRISHTI-GS1 (c) RIM-ONE (d) ORIGA
The combined ROCs of DMGD system clearly gives a view of the performance of RBF-SVM. For all databases, the ROCs of RBF-SVM is more close to the y-axis and occupies more area than others. Thus, the RBF-SVM is the best kernel for glaucoma diagnosis using multiple features.
In this study, a discriminator model is presented using soft computing techniques for glaucoma diagnosis. A series of preprocessing steps is employed to select the ROI, to segment the blood vessels and to remove the blood vessels by soft computing techniques. Multiple features in the form of colour, spatial relationship by LBP and texture features by LAWs are extracted from the obtained ROI. The kernel based SVM classifiers; LK-SVM, RBF-SVM, QK-SVM and PK-SVM are employed to separate the extracted features with maximum margin. Results on different databases; ORIGA, RIM-ONE, DRISHTI-GS1, and HRF show the ability of DMGD system for glaucoma diagnosis. The highest performer among the four kernel based classifiers is the RBF-SVM classifier with more than 96% accuracy except for ORIGA database (86.92%). This study gives a promising second opinion for the diagnosis of glaucoma.
Funding Statement: The authors received no specific funding for this study.
Conflicts of Interest: The authors declare that they have no conflicts of interest to report regarding the present study.
1. Y. C. Tham, X. Li, T. Y. Wong, H. A. Quigley, T. Aung et al.., “Global prevalence of glaucoma and projections of glaucoma burden through 2040: A systematic review and meta-analysis,” Ophthalmology, vol. 121, no. 11, pp. 2081–2090, 2014. [Google Scholar]
2. B. Kishore and N. P. Ananthamoorthy, “Glaucoma classification based on intra-class and extra-class discriminative correlation and consensus ensemble classifier,” Genomics, vol. 112, no. 5, pp. 3089–3096, 2020. [Google Scholar]
3. S. Murugan, A. Bhardwaj and T. R. Ganeshbabu, “Object recognition based on empirical wavelet transform,” International Journal of MC Square Scientific Research, vol. 7, no. 1, pp. 74–80, 2015. [Google Scholar]
4. N. A. Mohamed, M. A. Zulkifley, W. M. D. W. Zaki and A. Hussain, “An automated glaucoma screening system using cup-to-disc ratio via simple linear iterative clustering super pixel approach,” Biomedical Signal Processing and Control, Article ID: 101454, vol. 53, no. 11, pp. 1–17, 2019. [Google Scholar]
5. D. Selvathi, N. B. Prakash, V. Gomathi and G. R. Hemalakshmi, “Fundus image classification using wavelet based features in detection of glaucoma,” Biomedical and Pharmacology Journal, vol. 11, no. 2, pp. 795–805, 2018. [Google Scholar]
6. T. R. Kausu, V. P. Gopi, K. A. Wahid, W. Doma and S. I. Niwas, “Combination of clinical and multi resolution features for glaucoma detection and its classification using fundus images,” Bio Cybernetics and Biomedical Engineering, vol. 38, no. 2, pp. 329–341, 2018. [Google Scholar]
7. M. Alagirisamy, “Micro statistical descriptors for glaucoma diagnosis using neural networks,” International Journal of Advances in Signal and Image Sciences, vol. 7, no. 1, pp. 1–10, 2021. [Google Scholar]
8. G. G. Jerith and P. N. Kumar, “Analysis of shearlet system based features to characterize fundus images for glaucoma diagnosis,” Journal of Medical Imaging and Health Informatics, vol. 11, no. 9, pp. 2450–2456, 2021. [Google Scholar]
9. K. G. Kannan and T. R. Babu, “Semi supervised generative adversarial network for automated glaucoma diagnosis with stacked discriminator models,” Journal of Medical Imaging and Health Informatics, vol. 11, no. 5, pp. 1334–1340, 2021. [Google Scholar]
10. U. Raghavendra, H. Fujita, S. V. Bhandary, A. Gudigar, J. H. Tan et al.., “Deep convolution neural network for accurate diagnosis of glaucoma using digital fundus images,” Information Sciences, vol. 441, pp. 41–49, 2018. [Google Scholar]
11. L. Li, M. Xu, H. Liu, Y. Li, X. Wang et al.., “A large-scale database and a CNN model for attention-based glaucoma detection,” IEEE Transactions on Medical Imaging, vol. 39, no. 2, pp. 413–424, 2019. [Google Scholar]
12. J. J. Gómez-Valverde, A. Antón, G. Fatti, B. Liefers, A. Herranz et al.., “Automatic glaucoma classification using color fundus images based on convolutional neural networks and transfer learning,” Biomedical Optics Express, vol. 10, no. 2, pp. 892–913, 2019. [Google Scholar]
13. D. M. S. Barros, J. C. C. Moura, C. R. Freire, A. C. Taleb, R. A. Valentim et al.., “Machine learning applied to retinal image processing for glaucoma detection: Review and perspective,” Biomedical Engineering Online, vol. 19, no. 1, pp. 1–21, 2020. [Google Scholar]
14. A. Diaz-Pinto, S. Morales, V. Naranjo, T. Kohler, J. Mossi et al.., “CNNs for automatic glaucoma assessment using fundus images: An extensive validation,” Biomedical Engineering Online, vol. 18, no. 1, pp. 1–19, 2019. [Google Scholar]
15. F. Abdullah, R. Imtiaz, H. A. Madni, H. A. Khan, T. M. Khan et al.., “A review on glaucoma disease detection using computerized techniques,” IEEE Access, vol. 9, pp. 37311–37333, 2021. [Google Scholar]
16. M. Alghamdi and M. Abdel-Mottaleb, “A comparative study of deep learning models for diagnosing glaucoma from fundus images,” IEEE Access, vol. 9, pp. 23894–23906, 2021. [Google Scholar]
17. M. Juneja, S. Singh, N. Agarwal, S. Bali, S. Gupta et al.., “Automated detection of glaucoma using deep learning convolution network (G-net),” Multimedia Tools and Applications, vol. 79, pp. 15531–15553, 2020. [Google Scholar]
18. N. Deepa, S. Esakkirajan, B. Keerthiveena and S. B. Dhanalakshmi, “Automatic diagnosis of glaucoma using ensemble based deep learning model,” in 7th Int. Conf. on Advanced Computing and Communication Systems, Coimbatore, India, vol. 1, pp. 536–541, 2021. [Google Scholar]
19. Y. Wen, L. Chen, L. Qiao, C. Zhou, S. Xi et al.., “An efficient weakly-supervised learning method for optic disc segmentation,” in IEEE Int. Conf. on Bioinformatics and Biomedicine, Seoul, South Korea, pp. 835–842, 2020. [Google Scholar]
20. T. R. Babu, S. Devi and R. Venkatesh, “Optic nerve head segmentation using fundus images and optical coherence tomography images for glaucoma detection,” Biomedical Papers, vol. 159, no. 4, pp. 607–615, 2015. [Google Scholar]
21. M. M. Fraz, P. Remagnino, A. Hoppe, B. Uyyanonvara, C. G. Owen et al.., “Retinal vessel extraction using first-order derivative of Gaussian and morphological processing,” in Int. Symposium on Visual Computing, Las Vegas, NV, USA, pp. 410–420, 2011. [Google Scholar]
22. F. Bornemann and T. März, “Fast image inpainting based on coherence transport,” Journal of Mathematical Imaging and Vision, vol. 28, no. 3, pp. 259–278, 2007. [Google Scholar]
23. E. A. Kolog and S. N. O. Devine, “Texture image classification by statistical features of wavelet,” International Journal of Advances in Signal and Image Sciences, vol. 5, no. 1, pp. 1–7, 2019. [Google Scholar]
24. Y. Ojala, M. Pietikäinen and T. Mäenpää, “Multi resolution gray-scale and rotation invariant texture classification with local binary patterns,” IEEE Transactions on Pattern Analysis and Machine Intelligence, vol. 24, no. 7, pp. 971–987, 2002. [Google Scholar]
25. K. I. Laws, “Rapid texture identification,” Image Processing for Missile Guidance, vol. 238, pp. 376–381, 1980. [Google Scholar]
26. C. Srinivasan, S. Dubey and T. R. Ganeshbabu, “Complex texture features for glaucoma diagnosis using support vector machine,” International Journal of MC Square Scientific Research, vol. 7, no. 1, pp. 81–92, 2015. [Google Scholar]
27. Z. Zhang, F. S. Yin, J. Liu, W. K. Wong, N. M. Tan et al.., “Origa-light: an online retinal fundus image database for glaucoma analysis and research,” in Annual Int. Conf. of the IEEE Engineering in Medicine and Biology, Buenos Aires, Argentina, pp. 3065–3068, 2010. [Google Scholar]
28. F. Fumero, S. Alayón, J. L. Sanchez, J. Sigut and M. Gonzalez-Hernandez, “RIM-One: an open retinal image database for optic nerve evaluation,” in 24th Int. Symposium on Computer-Based Medical Systems, Bristol, UK, pp. 1–6, 2011. [Google Scholar]
29. J. Sivaswamy, S. R. Krishnadas, G. D. Joshi, M. Jain and A. U. S. Tabish, “Drishti-gs: retinal image dataset for optic nerve head (onh) segmentation,” in IEEE 11th Int. Symposium on Biomedical Imaging, Beijing, China, pp. 53–56, 2014. [Google Scholar]
30. A. Budai, R. Bock, A. Maier, J. Hornegger and G. Michelson, “Robust vessel segmentation in fundus images,” International Journal of Biomedical Imaging, vol. 2013, pp. 1–11, 2013. [Google Scholar]
 | This work is licensed under a Creative Commons Attribution 4.0 International License, which permits unrestricted use, distribution, and reproduction in any medium, provided the original work is properly cited. |