DOI:10.32604/csse.2022.023129
| Computer Systems Science & Engineering DOI:10.32604/csse.2022.023129 | |
| Article |
Research on Ratio of New Energy Vehicles to Charging Piles in China
Department of Industrial Management, National Taiwan University of Science and Technology, Taipei, 10607, Taiwan
*Corresponding Author: Zhiqiu Yu. Email: D10201m01@ntust.edu.tw
Received: 28 August 2021; Accepted: 29 September 2021
Abstract: With the widespread of new energy vehicles, charging piles have also been continuously installed and constructed. In order to make the number of piles meet the needs of the development of new energy vehicles, this study aims to apply the method of system dynamics and combined with the grey prediction theory to determine the parameters as well as to simulate and analyze the ratio of vehicles to chargers. Through scenario analysis, it is predicted that by 2030, this ratio will gradually decrease from 1.79 to 1. In order to achieve this ratio as 1:1, it is necessary to speed up the construction of public charging station or private charging station. Due to global warming, the attitudes of countries towards fuel vehicles have become increasingly tough. There is huge uncertainty in the growth rate of electric vehicles. Therefore, it is recommended that the construction of charging station be deployed in advance to avoid hindering the development of electric vehicles in the future.
Keywords: New energy vehicles; charging piles; system dynamic; grey forecasting
Due to global warming effect, several governments have paid more attention on environmental protection and considered decreasing the number of vehicles purely consuming the fossil fuel. Some EU countries even have employed the ban on the sale of fuel vehicles by 2030. As a result of new laws, various types of new energy vehicles have been booming, and governments are also exploring different development paths for new energy vehicles. New energy vehicles are mainly composed of pure electric vehicles and plug-in hybrid vehicles. Pure electric vehicles are driven by pure electricity, while plug-in hybrid vehicles retain the original fuel engine, and at the same time have both rechargeable batteries and electric drive systems. At present, more and more new energy vehicles appear on the highway.
Although the popularization of new energy vehicles has just emerged in recent years, research on new energy vehicles has already started some decades ago. For example, [1] predicted the ownership and usage of electric vehicles in the coastal air basin of southern California. Eberle et al. in [2] discussed sustainable transportation based on the concept of electric vehicles while Huo et al. in [3] explored the environmental impact of electric vehicles in China. They believed that new energy vehicles can solve China’s oil shortage and other problems. However, the main source of electricity in China relies on coal, so there is an urgent need for key policy supporting to solve the environmental problems caused by the use of electric vehicles. Shepherd et al. in [4] discussed the factors affecting the future demand of electric vehicles. Li et al. in their study [5] based on the Gompertz model to predict the number of electric vehicles while He et al. in [6] used the grey forecast buffer operator to forecast the production and sales of new energy vehicles in China.
Guojian et al. [7] relied on FPGA system and neural network to analyze electric vehicle purchase behavior. In short, the numbers of researches on new energy vehicles is increasing sharply along with its development. Most of these studies focused on the factors affecting the customer adoptions of new energy vehicles. Li et al. [8] screened 1846 papers and classified factors affecting the customer adoptions into demographic factors, contextual factors, and psychological factors. The most important factors are shown in Fig. 1.
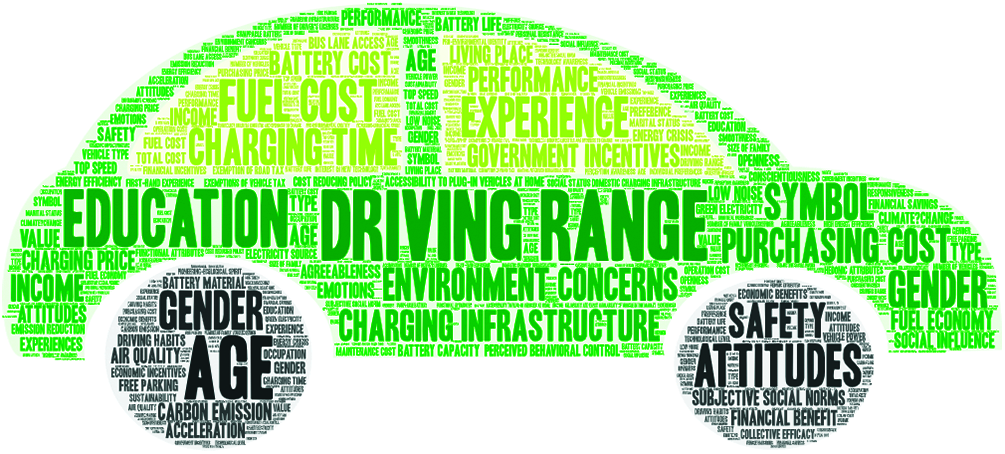
Figure 1: Factors affect the customer adoption of new energy vehicles
From the Fig. 1, the travel distance is the most important factor which accounts for a very large proportion of adopting new energy sources. The study in [9] pointed out that “distance anxiety” is the main obstacle to the popularization of electric vehicles.
With the development of new energy vehicles, charging piles and charging stations have been continuously constructed. Compared with research on new energy vehicles, especially pure electric vehicles, there are relatively few researches on charging piles. Luo et al. [10] applied the GM (1, 1) model is used to predict the number of electric vehicles and analyze the plan for construction charging station. Reference [11] used multivariate linear regression to illustrate the demand for electric vehicle charging stations. Arias et al. [12] built an electric vehicle charging demand prediction model based on big data technology. In summary, most of the research has focused on the site selection and capacity design and operation of charging stations [13,14].
Since most of the research just focused on the number of new energy vehicles, relatively few studies paid attentions to the numbers of charging piles, this study focuses on exploring the ratio of new energy vehicles to chargers. It also simulates and analyzes the future development of public and private charging piles.
The research on the vehicle-to-pile ratio requires a more reliable method to understand and predict the number of new energy vehicles, the number of charging piles, and the ratio of the two. Proper ratio of new energy vehicles to charging piles will help increase the range of new energy vehicles; solve the car owners’ charging anxiety; and promote the sale.
System dynamics is a discipline that analyzes and studies information feedback, and it is also an intersecting and comprehensive discipline that recognizes and solves system problems [15]. It has also been widely used in the research of new energy vehicles. Sun et al. [16] used game theory and system dynamics to study the subsidy policy of China’s new energy vehicle market. Shepherd et al. [4] established a system dynamics model for the electric vehicle market in the UK over the next 40 years to analyze the factors that affect the utilization rate of new energy vehicles, the impact on carbon dioxide emissions, and the cost of the government before 2050. In view of this, we adopt the method of system dynamics to conduct a more detailed discussion on the vehicle-to-pile ratio.
System dynamics does not have high requirements for parameters, but since the real popularity of new energy is less than ten years, the data is relatively small, so we use some methods of grey theory to assist in determining the parameters. Grey system theory focuses on the uncertain problems of small data and poor information that are difficult to solve by fuzzy mathematics and probability statistics [17].
In summary, this article is based on Vensim software and grey modeling software for analysis the future development trend of China’s electric vehicles and charging piles as well as assist decision makers to effective control the vehicle-to-pile ratio of new energy vehicles in the future. This article is divided into five parts. The first section is the introduction. The second section describes the system model of the problem. The third section discusses and explains model testing. The fourth section is the scenario analysis. The fifth section is the conclusion.
The relationship between charging piles and new energy vehicles is a typical companion relationship. For the sake of discussion, we assume that new energy vehicles are composed of pure electric passenger vehicles and plug-in passenger hybrid electric vehicles. Vehicles such as extended-range electric vehicles, fuel cell electric vehicles, and hydrogen-engine vehicles are not included. We also assume that the charging pile protocol is universal, all kinds of cars can use any charging pile and private charging stations can also charge other people’s cars.
At present, there are mainly three sources of statistical data related to China’s new energy vehicles, namely, China Association of Automobile Manufacturers, the Passenger Vehicle Market Information Association and Traffic Administration Bureau of the Ministry of Public Security of the People’s Republic of China. All three departments have published different kinds of statistics. However, because the data of the Vehicle Administration of the Ministry of Public Security is the number of registrations, it is relatively the most accurate, so the number of new energy vehicles is based on the data released by the Vehicle Administration of the Ministry of Public Security, and the charging piles are based on the data of the China Electric Charging Infrastructure Promotion Alliance. These data can be accessed in [18–22]. These historical data are shown in Tab. 1.

Although new energy vehicles have appeared a long time ago, they have become popular in China only in recent years. Therefore, the data for 2013 is relatively inadequate. For example, the China Electric Charging Infrastructure Promotion Alliance’s data on private charging piles in 2014 is missing, and it needs to be corrected from other public information. Another example is the number of new energy vehicles released by the Transportation Administration of the Ministry of Public Security of China in 2016 was 583,200, but the follow-up announcement in 2017 became 420,000. Therefore, the data before 2014 is discarded, and the latest published data shall predominate, and finally sorted into Fig. 2.
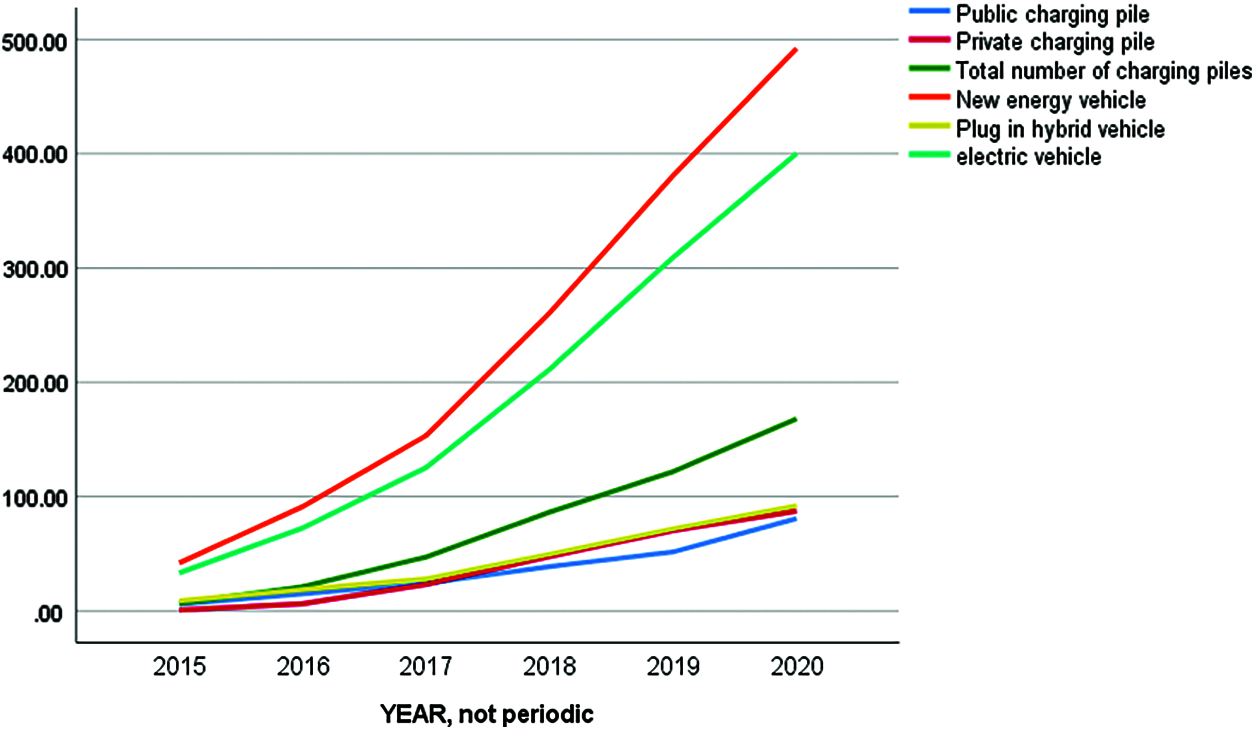
Figure 2: Reference model
Fig. 2 shows the trend of public charging piles, private charging piles, charging piles, pure electric passenger cars, plug-in passenger cars, and new energy vehicles since 2015. It can be seen that most of them have shown a rapid growth trend. In particular, the number of new energy vehicles, including pure electric vehicles, is increasing rapidly at an alarming rate. These trends are typical S-shaped growth. The S-shaped growth process is not uncommon in real life. Its initial speed is slow, and then gradually accelerates, after a certain process, it gradually stabilizes and then gradually decreases. At present, both new energy vehicles and charging piles have the characteristics of a typical S-shaped early growth structure.
In order to analyze the ratio of new energy vehicles to charging piles more accurately, we narrowed the scope of the model as much as possible. Only the numbers of public charging piles, private charging piles, electric vehicles, plug-in hybrid electric vehicles numbers, the increase rate of public charging piles, the increase rate of private charging piles are considered as the endogenous variables of the system. At the same time, we consider the scrap rate of automobiles and the increase rate of plug-in hybrid electric vehicles as exogenous variables. Exclude factors are charging time, battery life of electric vehicles, number of fuel vehicles, vehicle prices, fuel prices, government policies and other factors. The summary of endogenous, exogenous and excluded variables are shown in Tab. 2

Based on the existing literature and the actual situation of China’s new energy vehicles, this paper uses system dynamics to construct a causal-loop diagram in Fig. 3. The entire system is mainly composed of charging pile blocks and new energy vehicle blocks. The charging pile block is mainly composed of private charging piles and public charging piles. Private charging piles mainly refer to fixed installations for charging electric vehicles or plug-in hybrid electric vehicles. The new energy vehicle sub-block is mainly composed of pure electric vehicles and plug-in hybrid vehicles
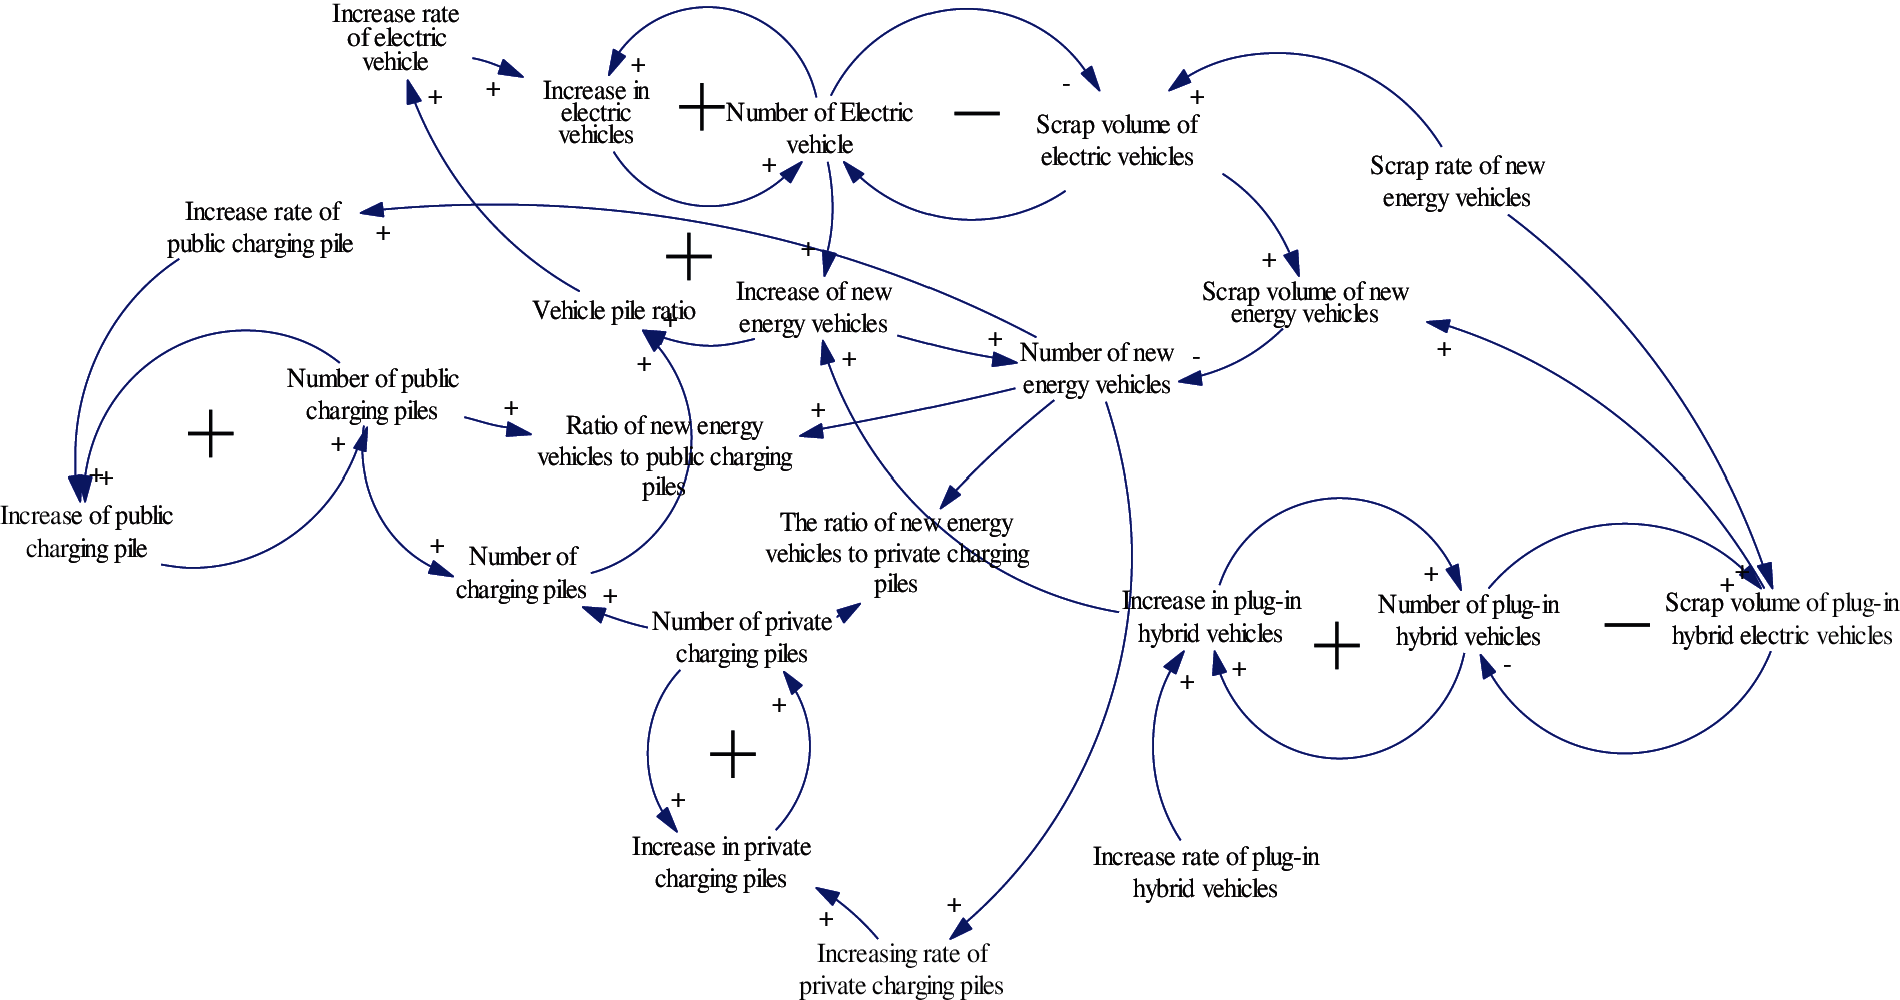
Figure 3: Causal-loop diagram
It can be seen from the figure that the vehicle-to-pile ratio is the ratio of the number of new energy vehicles to the number of charging piles. The more charging piles are, the lower the vehicle to pile ratio is A large vehicle-to-pile ratio corresponds to the inconvenience of charging new energy vehicles, and also means restrictions on the range of activities of new energy vehicles, which will affect the long-term development of new energy vehicles. What needs to be explained is that plug-in hybrid electric vehicles have the characteristics of pure electric vehicles as well as the characteristics of fuel vehicles because they retain the fuel engine. Therefore, it is less affected by charging piles.
According to the above Causal-loop diagram, Vensim is adopted to draw the system flow diagram of new energy vehicles and charging piles which is shown in Fig. 4. Among them, the number of public charging piles, private charging piles, pure electric vehicles, new energy vehicles, and plug-in hybrid power are set as state variables. The increases of public charging piles, private charging piles, pure electric vehicles, new energy vehicles, plug-in hybrid electric vehicles, plug-in hybrid electric vehicles, the scrap of pure electric vehicles, the amount of scrap, etc. are rate variables. The rest are auxiliary variables, constants and exogenous variables.
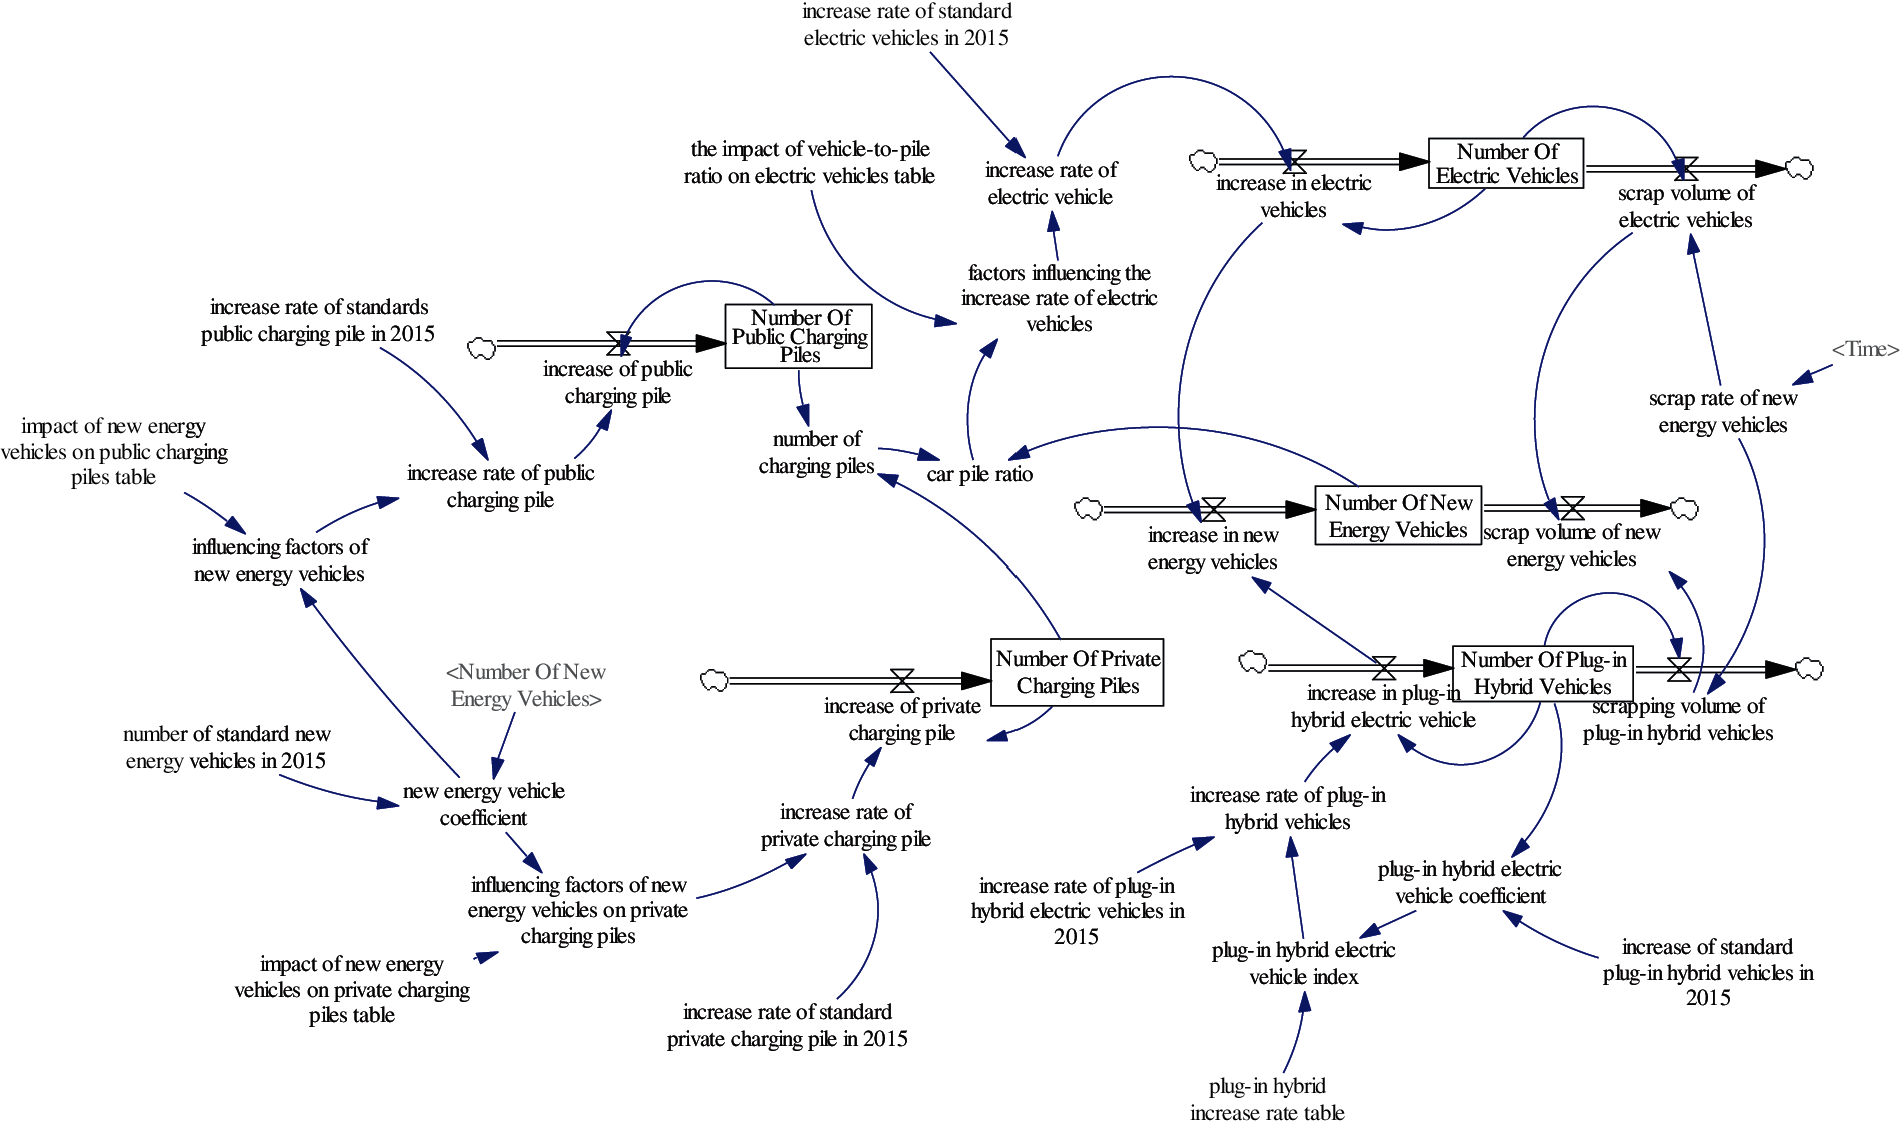
Figure 4: System flow diagram of new energy vehicles and charging piles
2.4 Parameter Identification and Method
System dynamics mainly emphasizes the structure of the system. For some parameters in the model that lack of historical data, reasonable assumptions can be made on them. However, as mentioned above, due to the relatively short time for new energy vehicles to become popular, they are still in the early stage of popularization and there are few data. In view of the fact that there is less data, we choose to use grey prediction theory to construct the table function parameters of system dynamics.
In this paper, the simulation time is determined to be from 2015 to 2030, the step size is 1, and Euler’s algorithm is selected. The relationship between the main variables of the model is shown in appendix. The Lookup function in Appendix A is determined by the grey prediction theory model [23]. The analysis takes the public charging pile increase rate table function as an example.
Grey Forecasting Method
Given the original sequence X = (x(1), x(2), …, x(n)) a stepwise ratio test on the original data is conducted as follows.
In order to ensure the feasibility of modeling, the sequence level ratio of the existing data sequence must fall within the acceptable coverage interval
Due to the limited number of the raw data, in order to solve the data applicability, we perform a first-order average weakening buffer operator calculation on the data sequence.
Let the raw data sequence as
The transformation of Eq. (3) is applied to the x(0)(k) of Eq. (2) as follow:
From this transformation the new sequence X(0)D is obtained as Eq. (4)
Through calculation, the 1st order average weakening buffer operator of the public charging pile inventory sequence is obtained as 31.1544, 35.9718, 42.0104, 48.7872, 57.0427, 66.1897, 80.7398. The level ratio generating operator sequence is 1.1546; 1.1679; 1.1613; 1.1692; 1.1604; 1.2198 which passed the stepwise ratio test.
To create a new sequence of 1-AGO (accumulating generation operator) Eq. (5) is applied
The generated mean sequence of x(1) is defined as Eq. (6)
where z(1)(k) is the mean value of adjacent data and is caculated through Eq. (7)
The GM (1, 1) model can be constructed by establishing a first order differential equation for x(1)(k) as:
The solution for Eq. (8), also known as time response function, of above equation is given by Eq. (9):
where
where Y, B are
After calculation by using Y and B of Eq. (11), the following results are obtained for the sequence of public charging pile sequence: a = −0.1616 and b = 27.4670.
Inverse AGO (IAGO) is used to find predicted values of primitive sequence. By using the IAGO:
Therefore, the fitted and predicted sequence
Residual modification model of GM (1, 1) developed as the difference between the real values, x(0)(k) and the model predicted values,
The percentage error of simulation is calculated as Eq. (15)
Finally, these simulation error are shown in Tab. 3

In order to verify the credibility of the model, a precision test is also required. The precision test includes calculate four indexes, namely the mean of relative errors, the absolute degree of incidence, the posterior error ration, and the small error probability.
The mean of relative errors is given by Eq. (16)
The average simulation relative error of the public charging pile inventory:1.2457%.
According to the calculated average simulation relative error, the simulation effect of the model is better.
The absolute degree of incidence is computed through Eqs. (17)–(19) as follows:
where
and
In the case of public charging pile data, the value of |s0|, |s1|, |s0 − s1| and ε01are 92.5268, 95.6387, 3.1119, and 0.9838 respectively. Since ε01 is >0.900, the degree of incidence is the first level.
The posterior error ration is computed by Eqs. (20)–(22)
where
In case of public charging piles number,
The small error probability is calculated as
By value substitution into Eq. (23), the value of p is obtained as greater than 0.95. According to the accuracy check table, the accuracy grades are all excellent. Finally, the forecast data of the public charging piles are obtained as 93.0185, 109.3334, 128.5097, 151.0495, 177.5427, 208.6825, 245.2841, 288.3053, 338.8722, 398.3083. In the same way, other data can be obtained, and the table functions can be constructed.
In order to ensure the robustness of the model, the system model needs to be tested. System dynamics model testing generally includes two aspects: model structure testing and model behavior testing. Model structure testing also includes direct model testing and structural behavior [24]. Direct structure inspection mainly includes model structure, parameter, boundary and dimension evaluation. This article mainly inspects dimensional and model structure. The behavior test for the structure mainly includes the limit case test, the behavior sensitivity test, the prediction of the restricted behavior, the boundary adequacy test, and so on. This article mainly does extreme case testing and behavioral sensitivity testing.
3.1 Dimensional Consistency Test and Model Structure Test
Dimensional consistency test is a method to judge whether the dimensions of the left and right sides of the mathematical formula in the model are consistent [24]. Dimensional inspection can ensure that the equation has practical significance. This function is already available in the Vensim software, just select “Units Check” in the “Model” menu, as shown in the figure. Through Vensim, confirm that the system model passes the unit consistency test. In the same way, the model is structurally tested with vensim, and the model meets the testing requirements.
Limit case test refers to checking whether the behavior of the model is consistent with the behavior under extreme regulation of the real system when the parameter value is set to the limit [24]. Although extreme situations rarely occur in life, they ensure the logical robustness of the model.
In the extreme value test, the increase rate of public charging piles is set as 0. Without the increase of public charging piles, pure electric vehicles will not be able to develop. The most likely future new energy vehicles will be the development of plug-in hybrid vehicles. We set the model’s public charging pile increase rate to a constant 0.
Through simulation, it can be seen that when the increase rate of public charging piles is 0, the number of public charging piles is fixed. Pure electric vehicles have almost no growth due to the lack of the cooperation of public charging piles. The growth of the entire new energy vehicle is almost always dominated by plug-in hybrid vehicles. The results after running the simulation are shown in Fig. 5. After the extreme value test, it can be found that the simulation results of the model are consistent with the expected system behavior. Similarly, limit detections can also be tried, and it all finds that the simulation results of the model are consistent with expectations. The model is considered to pass the limit detection.
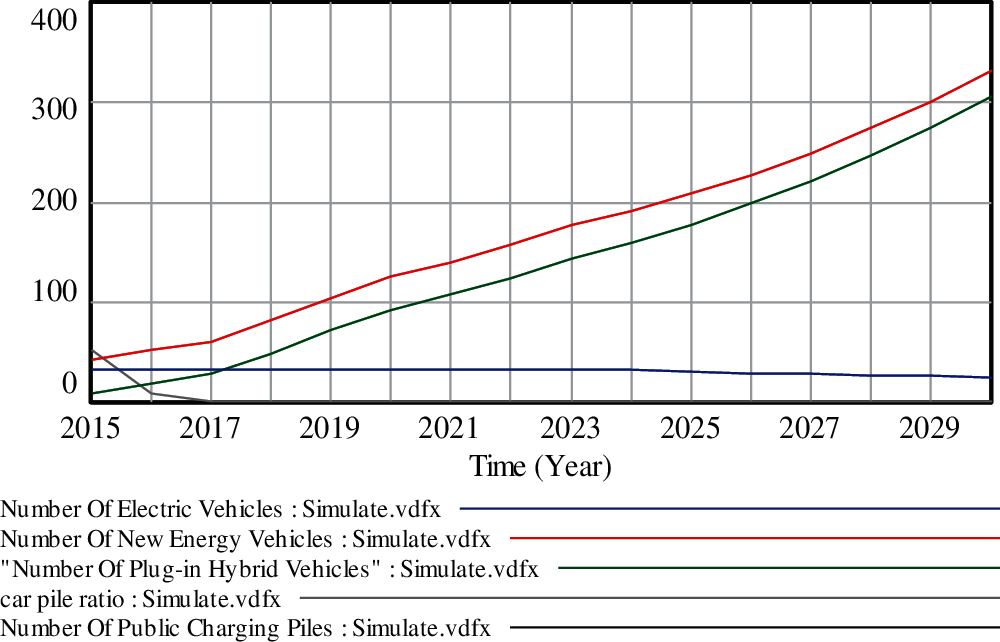
Figure 5: Limit case test results
Sensitivity testing is to test whether the corresponding changes in other model variables are reasonable when one parameter of the model changes [25]. There are two main methods for sensitivity testing. One is to run the model with the maximum possible value and the minimum possible value of a parameter, and then observe the sensitivity of each parameter of the model. The second is to pass the sensitivity test in the Vensim software. Within a certain value range of the parameters, after the software runs randomly, look at the distribution of these runs. This article uses Vensim’s own sensitivity function to achieve detection.
As can be seen from the Fig. 6, due to the different parameters, the operating results are different. However, the shape of the entire graph is basically the same, and 50% of the simulation results fall in the middle light position. The operation structure of the entire model shows numerical sensitivity, so the operation of the model passes the sensitivity test.
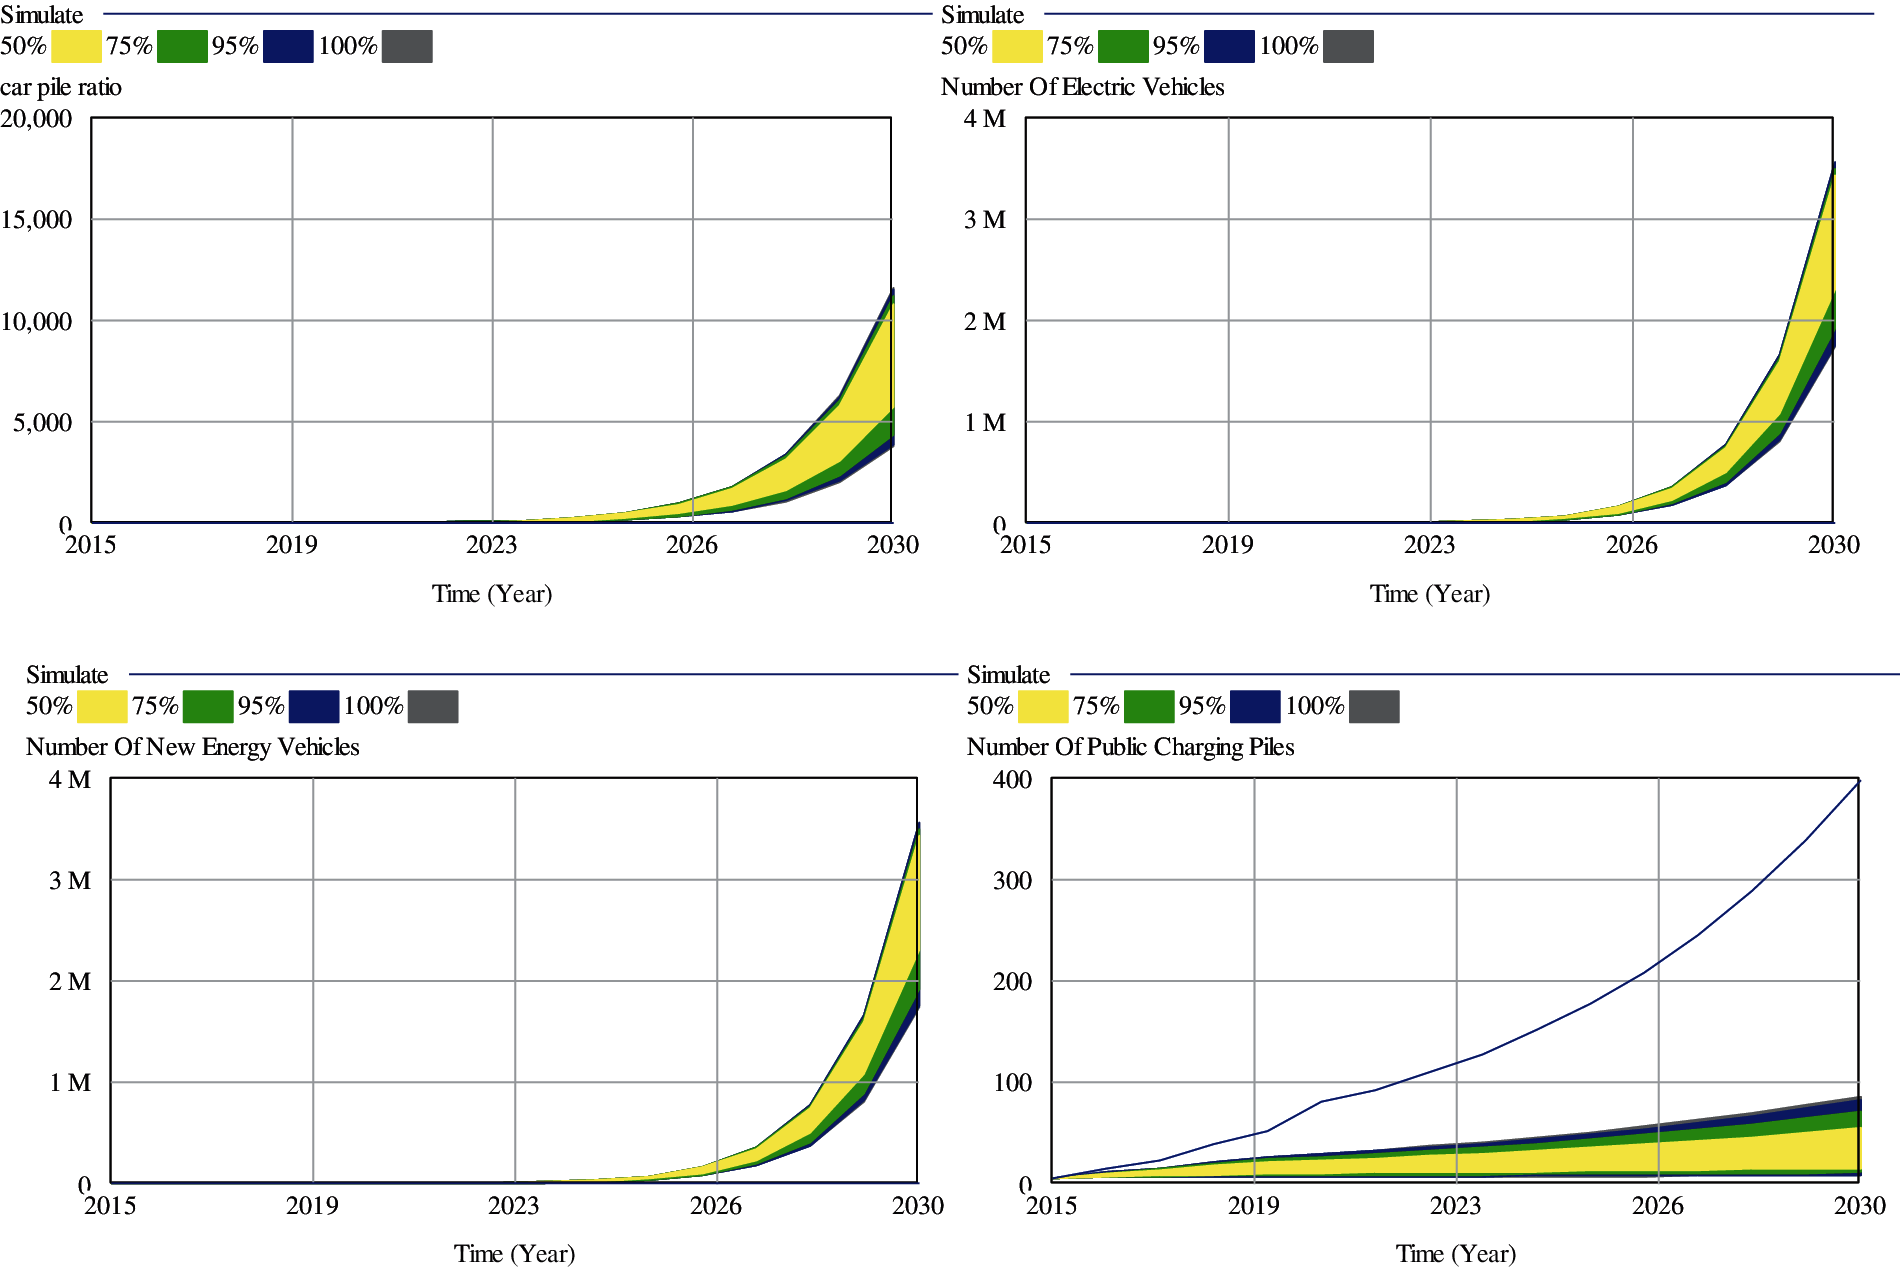
Figure 6: Sensitivity analysis when the standard increase rate of public charging piles is 0.1–1 in 2015
After confirming the robustness of the model, the model uses 1 as the step size to simulate the results from 2015 to 2030. The final results are shown in Fig. 7.
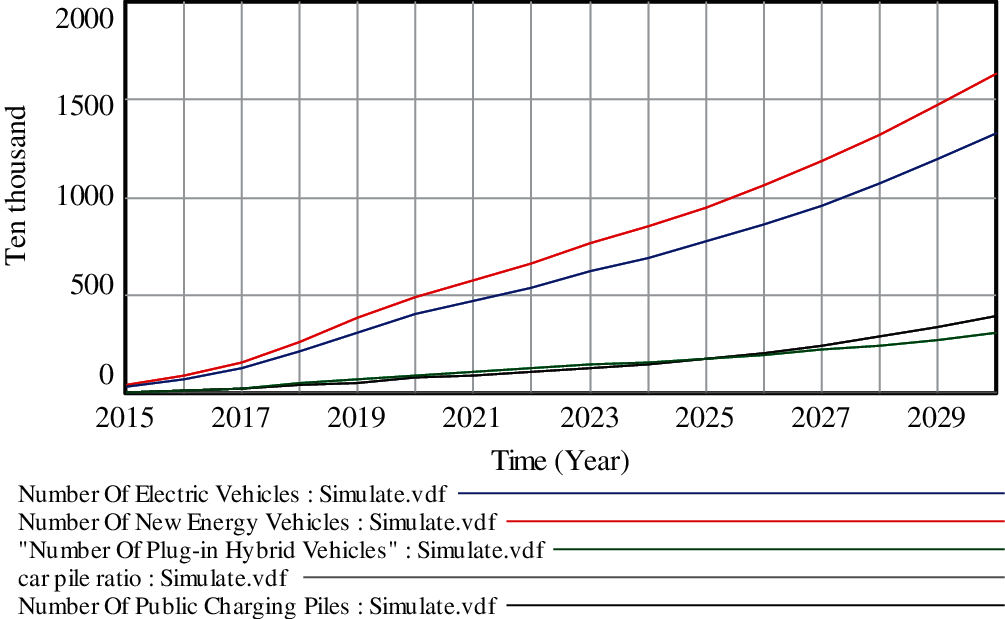
Figure 7: Trends in the number of new energy vehicles and charging piles in China
According to the simulation in Tab. 4, the total number of new energy vehicles will maintain a rapid upward trend. It is predicted that by 2030, the total number of new energy vehicles will reach about 16.3688 million, and the number of pure electric vehicles will reach about 13.3095 million. The growth rate of plug-in hybrids is relatively slow, and the number of vehicles is expected to reach 3.0593 million. As a transitional product, plug-in hybrid has a slower growth rate, estimated at 3.0593 million, and its trend is more in line with the actual situation.

The total number of charging piles, especially the total number of public charging piles, has an accelerated growth. It is estimated that by 2030, China will build about 398,207 public charging piles to meet the development needs of new energy vehicles. At the same time, it is estimated that by 2030, the number of charging piles installed in private vehicles will reach 4.27 million. Fig. 8 shows the simulation results of the pile-to-vehicle ratio of China from 2015 to 2030.

Figure 8: Simulation results of the pile-to-vehicle ratio of China from 2015 to 2030
For a more in-depth analysis of the vehicle-to-stake ratio, two ratios, i.e., new energy vehicles to public charging piles ratio and the private charging piles to public charging piles ratio are added to the model. The new simulation model structure is shown in Fig. 9.

Figure 9: The structure of new simulation models when two ratios are added
It can be seen from the result in Tab. 5 that the ratio of new energy vehicles to piles in China continues to decrease. It is estimated that by 2030, the ratio of new energy vehicles to charging piles will reach about 1.98:1, and the ratio of new energy vehicles to public charging piles will reach about 4.1:1. The ratio of new energy vehicles to private charging piles will reach 3.84:1.

From the simulation, it can be concluded that the development of charging piles and new energy vehicles have an accompanying relationship. The accelerated development of new energy vehicles reflects the simultaneous development of charging piles from another aspect, and the two are highly correlated. Furthermore, the construction speed of public charging piles needs to be accelerated. With the end of the initial market promotion, new energy vehicles, especially pure electric vehicles, have been widely accepted. In order to meet this rapidly growing demand, public charging piles, as the most important supporting facilities, have become a problem that the market and the government must face squarely. In order to meet this increasing demand, public charging piles will enter a rapid development channel.
The ratio of vehicle-to-pile is reasonable, and different people have different understandings. At present, some departments have positioned the ideal vehicle to pile ratio as 1:1. Regardless of the goal, striving to meet the charging needs at different times and places is the overall goal of everyone. From the simulation data, with the continuous construction of public charging piles, the possibility of a 1:1 ratio of vehicle piles is increasing.
4.1 The First Scenario Simulation
In order to achieve the ratio of vehicles to piles in an ideal state, the first scenario is simulated by adjusting the growth rate of private charging piles. Through trial and error, the private charging pile chronology function after 2021 is set to 0.045, that is, the increase rate of private charging piles is fixed at about 0.045, and the pile ratio will be 1:1 around 2030 which is shown in Fig. 10.
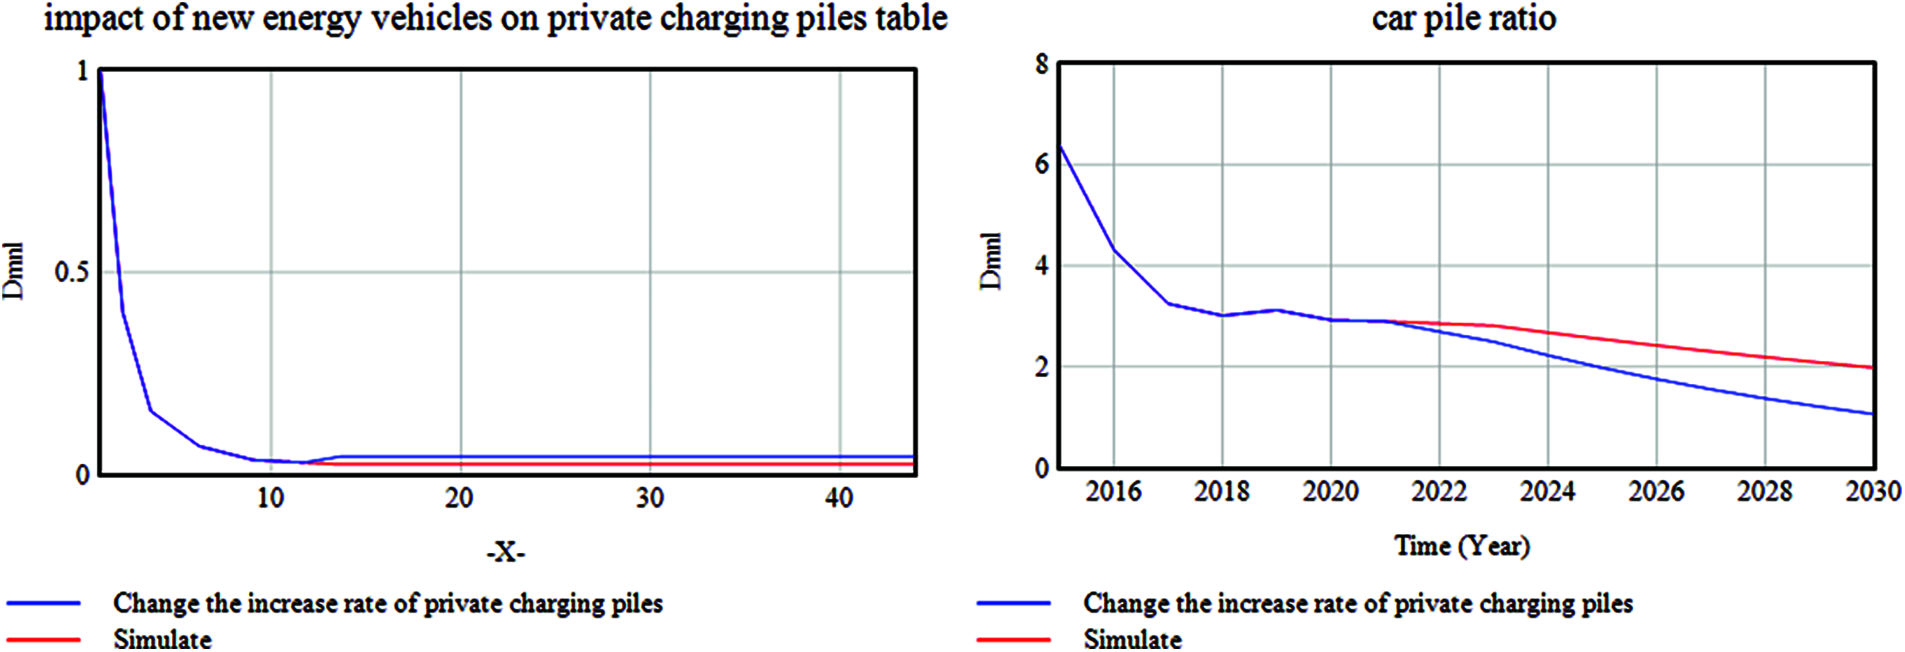
Figure 10: The vehicle-to-pool ratio after simulating future private charging piles with an increase rate of 0.03
When the growth rate of private charging piles maintains a growth rate of 0.27 in the next 10 years, it is expected that the vehicle pile ratio will be 1:1 by 2030, which is close to the current goals of some governments. Through simulation, it is recommended to strengthen the construction of private charging piles, solve the difficulties encountered in the installation of private charging piles, and try to maintain the current growth rate of private charging piles.
It is found from the prediction model that although the number of private charging piles continues to increase, they are not rapidly adapted to the development of new energy sources as expected. On the contrary, more and more people may not install private charging piles in the future. As private charging piles have a relatively high ratio of vehicles to piles, and they do not grow rapidly in the future as expected, the reasons are focused on analysis. According to the survey statistics of the China Electric Vehicle Charging Infrastructure Promotion Alliance, the construction of private charging piles is mainly affected by factors such as the degree of property cooperation, fixed parking spaces, power connection factors, and dedicated venues (EVCIPA). The effects of these factors on the model are shown in Fig. 11.
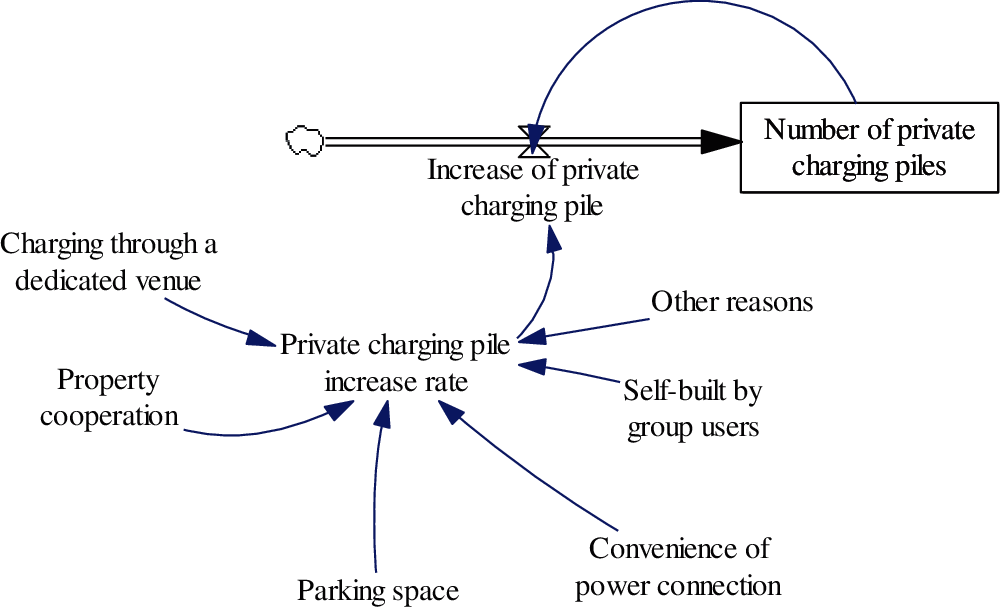
Figure 11: Factors affecting the number of private charging piles
Specifically, the time when private charging piles are really open for installation is May 27, 2014, announced by the State Grid Corporation of China. Although it is open, the installation of private charging piles still needs to meet a series of conditions. For example, you need to have your own parking space, you need the permission of the property, you also need to have your own charging equipment, and the community’s power system needs to be able to withstand it. This series of factors has become an obstacle to the development of private charging piles. In particular, parking spaces are originally an important factor restricting the development of automobiles. In cities, the cost of a fixed parking space is even greater than the car itself. Therefore, new energy vehicles may develop rapidly, but the growth of private charging piles has been unsatisfactory.
Another reason for the slow growth of private charging piles is that low-cost on-board charging cables have replaced fixed charging piles. With the refinement of new energy vehicles, low-endurance and low-price vehicles like Wuling Hongguang MINI are extremely popular. New energy vehicles that target urban counterparts for short-distance travel only need one charging cable for a long time, although the charging speed is not. The fixed pile is fast, but it has been fully able to meet the demand. Such a flexible and low-cost charging line method has also led to the slow growth of private charging piles, which in turn affects the ratio of private charging piles to vehicles. The continuous improvement of the battery life of pure electric vehicles and the reduction of charging time have reduced the demand for charging from the side, and the development of public charging piles has also led to the slowdown of the growth rate of private charging piles.
4.2 The Second Scenario Analysis
In this scenario, we strengthen the construction of public charging piles. Through simulation, if the annual increase rate of public charging piles of 0.165 can be maintained, then it is very likely that the vehicle-to-pile ratio will be 1:1 in 2030. The results of the second scenario analysis are shown in Fig. 12.
Figure 12: The vehicle-to-piles ratio after simulating the future public charging piles to maintain an increase rate of 0.03
The growth of public charging piles is greatly affected by government policies which include factors such as the planning, construction cost, the supply of land, operating cost and the government subsidies. These factors are presented in Fig. 13. At present, the government has issued the “Notice on Accelerating the Construction of New Energy Vehicle Charging Infrastructure in Residential Areas”, “Notice on Coordinating and Accelerating the Integrated Construction of Parking Lots and Charging Infrastructure”, and “On Accelerating the Unit’s Internal New Energy Vehicle Charging Infrastructure “Notice of Construction” and other policies which create significant impacts on the increase of public charging pile number.

Figure 13: Influencing factors of relating to government policies
The early stage of the construction of public charging piles must be guided by the government. But after a period of development, it will inevitably need to return to the market-themed direction. By reducing construction and operating costs, increasing operating profits, it will motivate enterprises to actively invest in the operating market of public charging piles, improving service efficiency, and achieving the harmonious development of vehicle-to-piles ratio. According to the simulation, although the future growth of public charging piles will continue to increase, the overall growth rate will slowly slow down. Therefore, it is necessary to optimize various factors that affect the construction of public charging piles to adapt to the future development of new energy vehicles.
4.3 The Third Scenario Analysis
In this scenario, we simulate the impact of government carbon reduction targets and policy changes on new energy vehicle ownership growth rate. The above-mentioned scenario simulation is performed by adjusting the charging piles as presented in Fig. 14. In real life, the changes of pure electric vehicles and plug-in hybrid electric vehicles have a great influence on the ratio of vehicle to piles. At present, with changes in government carbon reduction targets and policies, some provinces have already proposed a ban on the sale of gasoline vehicles after 2030. According to forecast of Beijing Institute of Technology, the number of new energy vehicles in China will increase from the current 5 million to more than 80 million from 2020 to 2030. According to its forecast, the growth rate of China’s new energy vehicles will be adjusted to 0.457. By 2030, the number of new energy vehicles in China will basically reach 80 million. At this point, it can be seen that the corresponding vehicle to pile ratio will even reach 8 to 1. Obviously, such a high vehicle to pile ratio will inevitably cause a series of problems. Similar government carbon reduction targets and policy changes will directly affect the number of new energy vehicles, which in turn will cause significant changes in the vehicle-to-weight ratio.

Figure 14: The situation of piles after a large increase in new energy vehicles
Therefore, it is recommended that the construction of charging piles must be deployed in advance to prepare for the explosion of new energy vehicles in advance.
The development of new energy vehicles is an important part of China’s realization of the energy-saving and emission-reduction targets of the Paris Climate Agreement. The research simulation predicts that in the next 10 years, the ratio of vehicles to piles of new energy vehicles in China will become lower and lower. If the growth rate of private charging piles or public charging piles can be maintained, then the ratio of vehicles to piles in an ideal state will be 1:1. It will be realized in 2030, and the charging of new energy vehicles will become easier and easier. Of course, it is obviously wrong to blindly pursue a 1:1 ratio. Moreover, there are great uncertainties in the development of new energy vehicles in the future, especially the various disasters brought about by climate warming, which will profoundly affect the development of the entire automobile market in the future. At present, the government and enterprises are beginning to study important data, and optimizing the layout to respond to the increasing demand for charging. In addition, especially the introduction of battery swap mode, a battery is equivalent to a fast charging pile. Under the new situation, under the new technology, the research on the vehicle-to-pile ratio will be different. In short, this research supplements the research on the vehicle-to-pile ratio that is easily overlooked for the series of research on new energy vehicles. Moreover, when there is a small amount of data in the research and analysis of system dynamics, grey prediction theory is used to construct table functions to assist in exploring the method of constructing table functions. In order to simplify the model, the above three scenario analyses are all simulated and analyzed by directly adjusting the number of new energy vehicles and charging piles. Looking forward to future research, we can deeply simulate the influencing factors of new energy vehicles and charging piles, and then analyze the development of new energy vehicles and charging piles more comprehensively.
Acknowledgement: This work was supported in part by the Center for Cyber-physical System Innovation from the Featured Areas Research Center Program within the framework of the Higher Education Sprout Project by the Ministry of Education in Taiwan.
Funding Statement: The authors received no specific funding for this study.
Conflicts of Interest: The authors declare that they have no conflicts of interest to report regarding the present study.
Reference
1. T. F. Golob, D. Brownstone, D. S. Bunch and R. Kitamura, “Forecasting electric vehicle ownership and use in the california south coast air basin: Final report,” in Forecasting Electric Vehicle Ownership and use in the California South Coast Air Basin, 1st ed, vol. 1, Berkeley, USA: University of California, Institute of Transportation Studies, pp. 1–20, 1996. [Google Scholar]
2. D. U. Eberle and D. Helmolt, “Sustainable transportation based on electric vehicle concepts: A brief overview,” Energy & Environmental Science, vol. 3, no. 6, pp. 689–699, 2010. [Google Scholar]
3. H. Huo, Q. Zhang, M. Q. Wang, D. G. Streets and K. He, “Environmental implication of electric vehicles in China,” Environmental Science & Technology, vol. 44, no. 13, pp. 56–61, 2010. [Google Scholar]
4. S. Shepherd, P. Bonsall and G. Harrison, “Factors affecting future demand for electric vehicles: A model based study,” Transport Policy, vol. 20, no. 5, pp. 62–74, 2012. [Google Scholar]
5. X. Li, E. Wang and C. Zhang, “Prediction of electric vehicle ownership based on gompertz model,” in 2014 IEEE Int. Conf. on Information and Automation (ICIAHailar, China, pp. 87–91, 2014. [Google Scholar]
6. L. Y. He, L. L. Pei and Y. H. Yang, “An optimised grey buffer operator for forecasting the production and sales of new energy vehicles in China,” Science of the Total Environment, vol. 704, no. 1, pp. 1–33, 2020. [Google Scholar]
7. X. Guojian and Z. Meihua, “Analysis of electric vehicle purchase behavior based on FPGA system and neural network,” Microprocessors and Microsystems, vol. 83, no. 1, pp. 1–20, 2020. [Google Scholar]
8. W. Li, R. Long, H. Chen and J. Geng, “A review of factors influencing consumer intentions to adopt battery electric vehicles,” Renewable and Sustainable Energy Reviews, vol. 78, no. 30, pp. 318–328, 2017. [Google Scholar]
9. J. Dixon, P. B. Andersen, K. Bell and C. Traeholt, “On the ease of being green: An investigation of the inconvenience of electric vehicle charging,” Applied Energy, vol. 258, no. 1, pp. 1–19, 2020. [Google Scholar]
10. H. Luo, J. Ruan and F. Li, “Study on the electric vehicles ownership and planning for the construction of charging infrastructure,” Journal of Chemical Physics, vol. 135, no. 7, pp. 1–4, 2011. [Google Scholar]
11. Q. L. Yan, H. J. Zi, L. W. Fei and Z. Ying, “Demand forecast of electric vehicle charging stations based on user classification,” Applied Mechanics & Materials, vol. 291–294, pp. 855–860, 2013. [Google Scholar]
12. M. B. Arias and S. Bae, “Electric vehicle charging demand forecasting model based on big data technologies,” Applied Energy, vol. 183, no. 28, pp. 327–339, 2016. [Google Scholar]
13. A. Y. S. Lam, Y. Leung and X. Chu, “Electric vehicle charging station placement: Formulation, complexity, and solutions,” IEEE Transactions on Smart Grid, vol. 5, no. 6, pp. 2846–2856, 2017. [Google Scholar]
14. H. Zhang, S. J. Moura, Z. Hu, Q. Wei and Y. Song, “A second order cone programming model for planning PEV fast-charging stations,” IEEE Transactions on Power Systems, vol. 33, no. 3, pp. 2763–2777, 2017. [Google Scholar]
15. Q. F. Wang, “Introduction,” in Advanced System Dynamics, 1st ed, vol. 1, Beijing, China: Tsinghua University Press, pp. 1–50, 1995. [Google Scholar]
16. H. Sun, Y. Wan and H. Lv, “System dynamics model for the evolutionary behaviour of government enterprises and consumers in China’s new energy vehicle market,” Sustainability, vol. 12, no. 4, pp. 1–18, 2020. [Google Scholar]
17. S. Liu, “Grey system modelling,” in Grey System Theory and Its Applications, 1st ed, vol. 1, Berlin, Germany: Springer-Verlag, pp. 107–148, 2011. [Google Scholar]
18. C. E. V. C. I. P. Alliance. “Statistical summary of charging facilities of charging alliance,” [Online]. 2021. Available: http://www.evcipa.org.cn/. [Google Scholar]
19. P. I. R. Institute, “The scale of the charging pile market continues to expand, and private charging piles occupy half of the country,” [Online]. 2018. Available: https://bg.qianzhan.com/report/detail/459/180524-f4c41604.html. [Google Scholar]
20. T. A. B. O. T. M. O. P. S. O. T. P. S. R. O. China, “In 2015, the number of motor vehicles and drivers in the country increased rapidly, with more than 17.81 million new vehicles added. the growth of the number of vehicles reached a record high”. [Online]. 2016. Available: https://www.mps.gov.cn/n2254098/n4904352/c5141532/content.html. [Google Scholar]
21. T. A. B. O. T. M. O. P. S. O. T. P. S. R. O. China, “In 2018, the number of cars in China exceeded 200 million for the first time”. [Online]. 2019. Available: https://baijiahao.baidu.com/s?id=1622349088177624657&wfr=spider&for=pc. [Google Scholar]
22. T. A. B. O. T. M. O. P. S. O. T. P. S. R. O. China, “One picture to understand: 33.28 million newly registered motor vehicles nationwide in 2020“. [Online]. 2021. Available: https://www.mps.gov.cn/n6557563/c7647931/content.html. [Google Scholar]
23. J. L. Deng, “Control problems of grey systems,” Systems & Control Letters, vol. 1, no. 5, pp. 288–294, 1982. [Google Scholar]
24. Y. Barlas, “Formal aspects of model validity and validation in system dynamics,” System Dynamics Review, vol. 12, no. 3, pp. 183–210, 1996. [Google Scholar]
25. Y. G. Zhong, X. Q. Jia and Y. Qian, Frontiers and Applications of System Dynamics, 1st ed, vol. 1, Beijing, China: China Science Publishing & Media Ltd., pp. 1–100, 2016. [Google Scholar]
Appendix A.
Model parameter equations and units
(01) Car pile ratio = Number of new energy vehicles/number of charging piles
Units: Dmnl
(02) Factors influencing the increase rate of electric vehicles = the impact of vehicle-to-pile ratio on electric vehicles table
Units: Dmnl
(03) FINAL TIME = 2030
Units: Year
(04) Impact of new energy vehicles on private charging piles table(
[(1, 0)-(50, 2)], (1, 1),…,(43.9309, 0.0250277))
Units: Dmnl
(05) Impact of new energy vehicles on public charging piles table(
[(1, 0)-(50, 1.5)], (1, 1),…,(43.9309, 0.111099))
Units: Dmnl
(06) Increase in electric vehicles = Number of electric vehicles * increase rate of electric vehicle
Units: Ten thousand/Year
(07) Increase in new energy vehicles = increase in plug-in hybrid electric vehicle + increase in electric vehicles
Units: Ten thousand/Year
(08) Increase in plug-in hybrid electric vehicle = increase rate of plug-in hybrid vehicles * Number of Plug-in Hybrid Vehicles
Units: Ten thousand/Year
(09) Increase of private charging pile = Number of private charging piles * increase rate of private charging pile
Units: Ten thousand/Year
(10) Increase of public charging pile = Number of public charging piles * increase rate of public charging pile
Units: Ten thousand/Year
(11) Increase of standard plug-in hybrid vehicles in 2015 = 8.8
Units: Ten thousand
(12) Increase rate of electric vehicle = increase rate of standard electric vehicles in 2015 * factors influencing the increase rate of electric vehicles
Units: 1/Year
(13) Increase rate of plug-in hybrid electric vehicles in 2015 = 1.12727
Units: 1/Year
(14) Increase rate of plug-in hybrid vehicles = “increase rate of plug-in hybrid electric vehicles in 2015 * plug-in hybrid electric vehicle index
Units: 1/Year
(15) Increase rate of private charging pile = increase rate of standard private charging pile in 2015 * influencing factors of new energy vehicles on private charging piles
Units: 1/Year
(16) Increase rate of public charging pile = increase rate of standards public charging pile in 2015 * influencing factors of new energy vehicles
Units: 1/Year
(17) Increase rate of standard electric vehicles in 2015 = 1.18554
Units: 1/Year
(18) Increase rate of standard private charging pile in 2015 = 6.73816
Units: 1/Year
(19) Increase rate of standards public charging pile in 2015 = 1.57871
Units: 1/Year
(20) Influencing factors of new energy vehicles = impact of new energy vehicles on public charging piles table (new energy vehicle coefficient)
Units: Dmnl
(21) Influencing factors of new energy vehicles on private charging piles = impact of new energy vehicles on private charging piles table (new energy vehicle coefficient)
Units: Dmnl
(22) INITIAL TIME = 2015
Units: Year
(23) New energy vehicle coefficient = Number of new energy vehicles/number of standard new energy vehicles in 2015
Units: Dmnl
(24) Number of charging piles = Number of public charging piles + number of private charging piles
Units: Ten thousand
(25) Number of electric vehicles = INTEG (increase in electric vehicles − scrap volume of electric vehicles, 33.2)
Units: Ten thousand
(26) Number of new energy vehicles = INTEG (increase in new energy vehicles − scrap volume of new energy vehicles, 42)
Units: Ten thousand
(27) Number of plug-in hybrid vehicles = INTEG (increase in plug-in hybrid electric vehicle-scrapping volume of plug-in hybrid vehicles, 8.8)
Units: Ten thousand
(28) Number of private charging piles = INTEG (increase of private charging pile, 0.8085)
Units: Ten thousand
(29) Number of public charging piles = INTEG (increase of public charging pile, 5.7792)
Units: Ten thousand
(30) Number of standard new energy vehicles in 2015 = 42
Units: Ten thousand
(31) Plug-in hybrid electric vehicle coefficient = Number of plug-in hybrid vehicles/increase of standard plug-in hybrid vehicles in 2015
Units: Dmnl
(32) Plug-in hybrid electric vehicle index = plug-in hybrid increase rate table (plug-in hybrid electric vehicle coefficient)
Units: Dmnl
(33) Plug-in hybrid increase rate table ([(1, 0)-(45, 1)], (1, 1),…,(38.5329, 0.137279))
Units: Dmnl
(34) SAVEPER = TIME STEP
Units: Year [0, ?]
(35) Scrap rate of new energy vehicles = IF THEN ELSE (Time > 2022, 0.04, 0)
Units: 1/Year
(36) Scrap volume of electric vehicles = scrap rate of new energy vehicles * Number of electric vehicles
Units: Ten thousand/Year
(37) Scrap volume of new energy vehicles = scrapping volume of plug-in hybrid vehicles + scrap volume of electric vehicles
Units: Ten thousand/Year
(38) Scrapping volume of plug-in hybrid vehicles = scrap rate of new energy vehicles * Number of plug-in hybrid vehicles
Units: Ten thousand/Year
(39) The impact of vehicle-to-pile ratio on electric vehicles table ([(1, 0)-(7, 1.5)],…,(2.62166, 0.130504)) Units: Dmnl
(40) TIME STEP = 1
Units: Year [0, ?]
 | This work is licensed under a Creative Commons Attribution 4.0 International License, which permits unrestricted use, distribution, and reproduction in any medium, provided the original work is properly cited. |