DOI:10.32604/csse.2022.023509
| Computer Systems Science & Engineering DOI:10.32604/csse.2022.023509 | |
| Article |
Conditional Probability Approach for Fault Detection in Photovoltaic Energy Farms
1Electrical Engineering Department, Faculty of Engineering, Menoufia University, 32511, Egypt
2Electrical Engineering Department, College of Engineering, Taif University, 21944, Saudi Arabia
*Corresponding Author: Nagy I. Elkalashy. Email: nagy.elkalashy@sh-eng.menofia.edu.eg
Received: 11 September 2021; Accepted: 12 October 2021
Abstract: Detection of electric faults in photovoltaic (PV) farms enhances a sustainable service continuity of farm energy generation. In this paper, a probabilistic function is introduced to detect the faults in the PV farms. The conditional probability functions are adopted to detect different fault conditions such as internal string faults, string-to-string faults, and string-to-negative terminal faults. As the diodes are important to make the PV farms in-service safely during the faults, the distribution currents of these faults are evaluated with different concepts of diode consideration as well as without considering any diode installation. This part of the study enhances the diode utilization in the PV farms concerning the protection point of view. The PV string currents are used as inputs to the conditional probability detection algorithms. However, the setting of the fault detection technique is not portable for the other PV systems due to broad ranges of PV system ratings. To accordingly generalize the proposed fault detection algorithm, the PV string currents are first normalized to the total array current for universally applying the detection function at different PV string ratings. The limiting fault resistances are evaluated to show the sensitivity of the proposed fault detector. The results ensure the application of the proposed probabilistic detection function for PV farms.
Keywords: Photovoltaic farm; fault detection; conditional probability; diodes
Thus, in recent decades, renewable power resources are rapidly implemented worldwide due to their small impacts on environments and climates [1,2]. Renewable power resources include photovoltaic (PV) power, wind power, geothermal power, biomass power, small hydro, and fuel cell power [3]. The renewable power resources are rapidly increased; for example, in India, the total renewable power generation increases from 15.238 GW in 2009–2010 to 73. 352 in 2018–2019 [4]. In 2009–2010, wind energies were utilized to generate the most renewable power, while in 2018–2019, the PV power generation is slightly close to that generated from wind power generation. In [5], the growing adoption and importance of implementing PV systems as a source of electrical energy are presented. The PV system fault prediction and identification are implemented to maintain the normal operation of PV systems [6].
Fault detection and classification of their types in PV systems are implemented based on two approaches. The first approach is implemented based on artificial intelligent techniques [7–16], while the second approach is build based on the PV system waveform shape [17–23]. The model introduced in [7] is built to detect and classify PV system faults based on a random forest ensemble machine-learning approach (RF). It detects and classifies line-to-line, open circuits, shading, and degradation faults. The RF model input is the array voltage and string currents, while its output is the PV system fault types. Large dataset samples for the RF model training process, ignoring blocking diode effect and ignoring some PV fault types such as string-to-string and pole-to-pole faults represent this work's main drawbacks. The model presented in [8] is built to detect and classify only short circuit PV system faults based on a fuzzy logic interface. It detects and classifies only line-to-line and line-to-ground faults. The fuzzy logic model input is the array voltage, current, and irradiance level, while its output is the PV short circuit fault types. Ignoring the blocking diode effect and ignoring some PV fault types such as string-to-string, open circuit, and shading faults are the main shortage in the suggested fault detection model. In [9], the grey-wolf optimizer technique (GWO) is applied to detect and classify PV system fault types. Predicting its accuracy is compared with other optimization techniques with the effectiveness of GWO. Only short-circuit and open-circuit faults are presented in this work, but irradiance variations and fault types such as shading and pole-to-pole faults are not considered. The model presented in [10] is built based on the kernel generalized likelihood ratio test (KGLRT) to predict faults in PV systems. The faults detected by the suggested model are bypass, mismatch, and mix and shading failures. The cell-to-cell, string-to-string, pole-to-pole, open circuit faults, and irradiance are not considered in this work; as well as the complexity of the mathematical model represents the main drawbacks of this work. A machine learning framework model for PV model monitoring conditions is presented in [11]. It only monitors the PV system for uniform and partial shading, increasing string series resistor up 100%, snow effect on the PV system, cloudy sky effect. In [12], the PV fault detection and classification model is built based on two-dimensional convolutional neural networks. Line-to-line, open-circuits, partial shading, series arc faults are only detected by the suggested model. This work does not consider string-to-string and uniform shadow faults. The model presented in [13] is built based on the graph-bass semi-superposed learning technique. The main drawbacks of this work are that it required large numbers of training dataset samples, and some faults are not considered, such as pole-to-pole, string-to-string, and shadow faults. A reduced kernel principal component based on the random forest model is presented in [14] to predict and classify PV system faults. It classifies between open-circuits, short-circuits, output current sensor, islanding, and shading faults. Model complexity, string-to-string, pole-to-pole, and cell-to-cell faults are the main drawbacks of this model. In [15], an AI technique is presented to detect and classify the PV system faults based on neural pattern recognitions (NPR), and ensemble bagged trees (EN) with superiority of the NPR compared to the EN method. Two diodes are added to each string, one at the upper and the other at the lower terminal of each string. Pole-to-pole, open-circuit, and shading faults are not considered in this study. In [16], a PV detection and classification model is presented based on the fuzzy logic (FL) approach. It is only used for the prediction of the array, hot spots, and shading faults. It is not considered an open circuit and pole-to-pole faults.
In [17], a fault detection model is built based on the current and voltage indicators and the power losses due to fault conditions. The model considered only the partial shading faults and the inverter mall operation. The model is not considered pole-to-pole, open-circuits, and uniform shading faults. A parallel fault prediction method for grid-connected PV energy systems based on t-test statistical analysis is presented in [18]. The predicting algorithm is divided into two steps. The first is used for fault detection on the DC side, while the second is used for the fault on the AC side. Pole-to-pole, open circuits, and string-to-string faults are not considered in this study. In [19], the PV model for predicting and identifying DC side faults is built based on the PV array normalized super-imposed power component. It identifies between short-circuit and partial shading faults. The classifying between different short-circuit fault types are not considered. In [20], the PV detecting model is built based on the difference between the maximum power tracking point for the real and simulated PV arrays (output voltage, current, and power) has been suggested. It distinguishes between string and shading faults. It does not separate between low and high fault status, and some faults do not consider, such as the string-to-string and pole-to-pole faults. The model presented in [21] suggested a PV fault predicting model to predict the cell-to-cell and cell-to-ground faults considering normal and low irradiance and partial shading durations based on the maximum power point tracking (MPPT). The proposed model determines the system operating states (normal or faulty states) without distinguishing fault types. Some fault types are not considered in this work, such as Open-circuit, string-to-string, and pole-to-pole faults. The PV predicting model presented in [22] is built based on statistical analysis. The actual string powers are compared with the mean simulated string powers to determine the PV string fault nature. String-to-string, open-circuits, and pole-to-pole faults are not considered in this study. A PV fault detection based on string voltage and current trajectories is presented in [23]. Only one diode is suggested at the upper terminal of each string. The suggested model detects cell-to-cell, string-to-string, pole-to-pole, and shadow faults. It distinguishes between low and high states of different PV array faults. The open-circuit and hot spot faults are not considered in this work.
In this work, the conditional probability function is implemented to distinguish between different PV array faults. These faults are such as internal string faults, string-to-string faults, and string-to-negative terminal faults. The fault detections are accomplished for different diodes considerations in the PV farms such as without considering any diodes and with different concepts of diode installations. The inputs to the conditional probability algorithms are normalized currents of the PV strings. The current normalization enhances the utilization of the proposed detection algorithm, widely. The results ensure the application of the proposed probabilistic detection function for PV farms. The paper structure is as follows. First, the effect of considering the diodes on the fault current distribution is evaluated and ascertained utilizing a simulated PV energy system. Then, the proposed fault detection algorithm is presented. The performance evaluation is done concerning the array diodes and fault resistance limitation to show the effectiveness of the proposed algorithm for fault detection in PV farms. Finally, the work conclusion is summarized.
2 Diodes Effect on Fault Current Distribution
In Fig. 1a, a built-in example in Matlab Simulink of a 400 kW PV farm is shown, where it consists of four arrays. It is available and entitled “power\_4PVarray\_400 kW”. This example is used to collect measurements of fault cases in one of the PV arrays where this faulted PV array is more constructed, as shown in Fig. 1b. As shown in Fig. 1a, the energy management from the PV farm into the 25 kV power grid is accomplished using a control concept through two stages. First, the DC/DC converter is utilized to attain the continuous maximum power point tracking based on the well-known Perturb and Observe algorithm. Then, a voltage source converter (VSC) interconnects the renewable generation system to the three-phase AC power grid. This power grid includes the essential power transformer to step up to 25 kV level voltages. As shown in Fig. 1a, there are four PV arrays, where each one rating is 100 kW. Each array contains 64 parallel strings, and each string includes 5 series PV modules. This is easily adjusted using the facilities of the PV representation in the Simulink domain. The fourth array is rearranged to show at least two strings to implement the fault cases as shown in Fig. 1b.

Figure 1: Simulated 400 kW PV farm. (a) Built-in practical example of PV farm in Matlab/Simulink. (b) Faulted PV array
2.2 Diodes Consideration Effect for Internal String Faults
Considering irradiation of 1000 and 250 W/m2, Figs. 2 and 3 respectively show the PV current distribution during internal string faults where different diode interactions in the PV array are considered. Fig. 2a illustrates the currents when there is no diode insertion in the PV array. Accordingly, the faulted string current is reversed from +5.8 A to −392.8 A, where all healthy PV strings (63 strings) and the array converter inject current into the faulted string. However, considering diodes at the PV array (in between PV array and DC/DC converter) slightly improves the performance, where the faulted string current becomes −246.6 A. However, such fault currents provide hazards to the PV system. When the diodes are installed in series with the strings, the corresponding fault current distribution is shown in Fig. 2c. Safely, the PV array provides the generated power from the healthy PV strings. However, the faulted string is isolated by the reverse action of the diodes, as concluded from Fig. 2c.

Figure 2: PV current distribution due to internal string fault at irradiation 1000 W/m2. (a) Without diode consideration. (b) Diodes at the PV arrays. (c) Diodes at the PV strings

Figure 3: PV current distribution due to internal string fault at irradiation 250 W/m2. (a) Without diode consideration. (b) Diodes at the PV arrays. (c) Diodes at the PV strings
Fig. 3 ensures diodes’ effect on the fault current distribution in the PV array, however at irradiation 250 W/m2. In Fig. 3a, both the healthy strings and DC/DC converter inject high currents into the faulted string, and still, the faulted string carries a high current of −341.2 A. When the array diodes are installed, the total array current becomes zero due to the reverse status of the diode, and the fault current becomes −95.77 A that is only injected from the healthy PV strings as depicted in Fig. 3b. There is no power provided from the PV array during this fault case, although the other 63 healthy strings are available. In the third case of diode considerations shown in Fig. 3c, only the faulted string is isolated from the service. However, the healthy strings are in-service and unaffected by the fault event. Accordingly, the total current of the array is slightly reduced from 92.37 to 90.96 A.
2.3 Diodes Consideration Effect for String-to-String Faults
Fig. 4 shows the distributed currents during string-to-string fault with different considerations of the diode installation. Considering the fault case between string 1 and string 2, the currents of the positive-terminal of string 1 and negative-terminal of string 2 are changed from 5.8 A to −155.3 A, as shown in Fig. 4, where the diodes are not considered in the PV array. This fault case reduces the array current from 370.2 A to 211.7 A, however, the array current is not reversed. The same performance is attained in Fig. 4b, which is for diodes consideration at the array terminals. However, the performance is changed for the string diodes consideration as depicted in Fig. 4c, where the diodes prevent the reverse currents in the faulted strings, and therefore, the array current is slightly reduced by 5.8 A. The currents of the positive terminal of string 1 and the negative terminal of string 2 strictly changed to zero during the fault period as depicted in the zoomed Fig. 4c.

Figure 4: PV current distribution due to string-to-string fault at irradiation 1000 W/m2. (a) Without diode consideration. (b) Diodes at the PV arrays. (c) Diodes at the PV strings
Based on the above discussion, the diode consideration is essential for safely service operation of the PV array during the internal string faults and string-to-string faults. Accordingly, fault detection is introduced concerning these two cases of diodes considerations that are diodes at the array terminals and diodes at the string terminals.
3 Proposed Fault Detection Algorithm
The conditional probability application as a selectivity function for estimating the faulted feeder in the distribution networks was reported in [24]. Also, the conditional probability was successfully utilized for condition assessment of the power transformer using dissolved gas analyses as addressed in [25]. In the current study, the algorithm is adopted to detect the faulted string in the PV array.
Fig. 5 shows the proposed fault detection technique that is designed depending on the conditional probability and based on the fault results shown in Figs. 2–4. The first step is that the PV string currents (i1, i2, …, in, …, iN, where N is the total string number per array) and the array current (ia, which is the total summation string currents during normal operation) is measured and used as inputs to the proposed fault detection algorithm. Then, each string current is normalized with respect to the total array current by;
where, B is a bias used to stabilize the normalized value when the total array current ia is close to zero. The ratio current of the string current to the array current is multiplied by N to make the value of the normalized string current close to one during the normal operation. Accordingly, the mean value of the string normalized current during its health operation (μh) is adjusted equal to 1. However, the string normalized current mean value when it is faulted (μf) depends on the diode places. For the string diodes consideration, this normalized current mean value during the fault μf is zero where the diodes prevent the reverse currents in the string. For the array diodes consideration, the mean value μf is −1 where the reverse current condition less than −1 is adjusted equal to −1 as depicted in the flowchart in Fig. 5. Regarding the standard deviations, either healthy or faulty condition (σh or σf, respectively) is considered 0.20. This value of the standard deviation is estimated as the mean values of the healthy and steady state are close, where they are 1 and −1, respectively. However, higher values of standard deviation unfortunately produce error in the fault detection where the probability of the fault detection may be reduced than unity, which is 100% detection probability.

Figure 5: Proposed fault detection algorithm
As shown in the flowchart in Fig. 5, the Gaussian point probability value is computed for the normalized current concerning the two settings that are healthy and faulty conditions as;
Finally, the conditional probability is applied as;
Based on the evaluation of the above equation, the faulted string is detected if there is a fault in the PV array.
4 Performance Evaluation Concerning Array Diodes
Due to different fault conditions possibility, the proposed probabilistic detector presented in Fig. 5 is separately processed for the positive and negative terminal measurements of the strings and array currents. This is because the positive terminal current can be different than the negative terminal current of the same PV string as the test case shown in Fig. 4 during the string-to-string fault.
Fig. 6 shows the performance of the proposed probabilistic detector during different fault conditions at irradiation 1000 W/m2. The fault instant is at 0.25 s. The same performance shown in Fig. 6 is attained by either the string or array diode considerations. Fig. 6a shows the proposed probabilistic detector performance for internal string fault, successfully detecting the faulted string. For this fault case, the performance using positive and negative measurements is the same as the series connection status in the faulted string during the internal string faults. For the string-to-string fault shown in Fig. 6b, the fault is detected for the positive terminal string No. 1 and negative terminal string No. 2 because the fault affected the currents of these two terminals, as depicted in Fig. 4. For the fault case of string-to-negative array terminal, the fault case affected the positive terminal measurement of the faulted string 1, and then its flag detected the fault as depicted in Fig. 6c. Similarly, the negative terminal measured current is affected by the fault of the string-to-positive array terminal, and therefore the flag of the negative terminal of string 1 detected this fault case as shown in Fig. 6d. Generally, faults between the string and positive/negative array terminal initiate only one detector of the faulted string. However, it could not estimate if the fault is with negative or positive array terminal because it depends on the fault point place in the faulted string.

Figure 6: Performance of the proposed fault detector. (a) Internal sting fault. (b) String-to-string fault. (c) Fault between the string and the array negative terminal. (d) Fault between the string and the array positive terminal
The limiting fault resistance values show the shortage of the proposed fault detector to detect and estimate the faulted string. The limiting resistance represents the sensitivity of the proposed fault detector. The limiting fault resistance value is estimated when the probabilistic detector attains a value between 0.85 and 0.90 (85% to 90% detection probability) as shown in Fig. 7a for an internal string fault case and Fig. 7b for a string-to-string fault case. The higher fault resistance reduces the probabilistic detector value. They mainly depend on the fault size and the atmospheric condition.

Figure 7: Test cases concerning the limiting fault resistance of the proposed fault detector. (a) Internal string fault case. (b) String-to-string fault case
Refer to the simulated PV system and especially the PV array arrangement is shown in Fig. 1b, each string includes five PV series modules. The internal string faults reported in Tab. 1 have represented a resistance connection between these modules’ interconnections. For example, the 20% internal string fault is a fault resistance in parallel with a single PV module, and the 40% internal string fault is a fault resistance in parallel with two PV modules, and so on. These percentages are described in Tab. 1 as the fault size. The fault size is considered by the difference over the fault resistance between the two faulted strings for the string-to-string fault. For example, if the fault between the first module of string 1 to the second module of string 2, the fault size is 20%. If the fault between the first module of string 1 to the third module of string 2, the fault size is 40%, and so on. Considering such different fault sizes, the performance of the proposed fault detection technique is evaluated. This evaluation is accomplished by increasing the fault resistances up to estimating the fault resistance value when the detector performance is between 0.85 and 0.90 (85% to 90% detection probability). This fault resistance is the value that limits the detector performance.
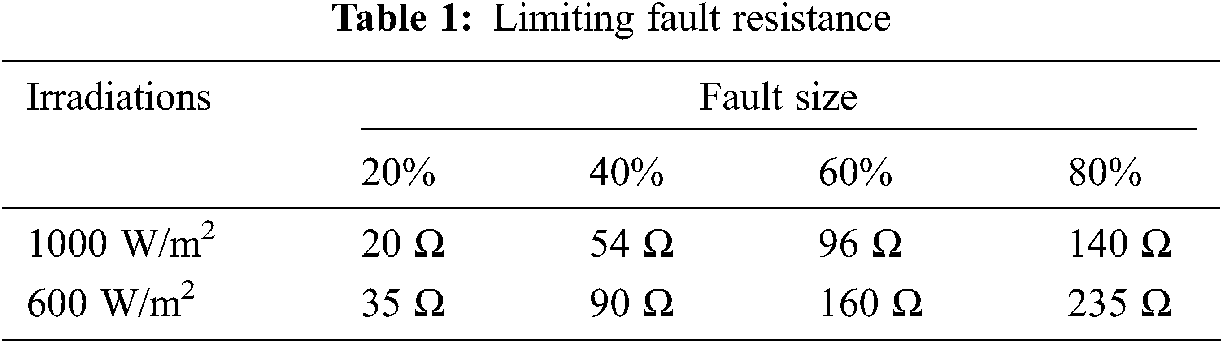
From the results reported in Tab. 1, the limiting fault resistance is increased for higher fault size, where the voltage providing the fault currents is increased. The proportionality is not linear because the PV characteristics (Current-Voltage characteristics) are not linear. However, lower sun irradiations increase the limiting fault resistance, where the irradiations affect the PV current more than the effect of the voltage. Therefore, reduction in the sun irradiations deduces the string currents and then the array current.
A probabilistic fault detector was presented for the PV power array. It was designed for different diodes considerations. The settings of the proposed detector were simply designed considering the normalizations process of the measured distributed currents in the PV array. As the proposed algorithm is probabilistic, the setting included the mean of the health and string condition was 1. However, the mean of fault string condition was 0 or −1 for considering string diodes or array diodes, respectively. Generally, the standard deviations were considered 0.20. The proposed fault detector's performance evaluation successfully determined and estimated the faulted string during different fault conditions such as faults of internal string, string-to-array negative terminal, string-to-array positive terminal, and string-to-string. Then, the limiting fault resistances were evaluated for these fault types and concerning the irradiation effect. For small fault sizes such as 20% of the string as an example, the limiting fault resistances were 20 and 35 Ω at irradiations 1000 and 600 W/m2, respectively. However, higher fault size attained high limiting fault resistances. The results ensured the efficacy of the proposed fault detector for PV arrays.
Funding Statement: The authors would like to acknowledge the financial support received from Taif University Researchers Supporting Project Number (TURSP-2020/61), Taif University, Taif, Saudi Arabia.
Conflicts of Interest: The authors declare that they have no conflicts of interest to report regarding the present study.
1. A. Saleh, A. Bin Haris and N. Ahmad, “Towards a UTAUT-based model for the intention to use solar water heaters by Libyan households,” International Journal of Energy Economics & Policy, vol. 4, no. 1, pp. 26–31, 2014. [Google Scholar]
2. D. Torney and R. O'Gorman, “Adaptability versus certainty in a carbon emissions reduction regime: An assessment of the EU's 2030 climate and energy policy framework,” Review of European, Comparative & International Environmental Law, vol. 29, no. 2, pp. 167–176, 2020. [Google Scholar]
3. R. M. Elavarasan, G. M. Shafiullah, S. Padmanaban, N. M. Kumar, A. Annam et al., “A comprehensive review on renewable energy development, challenges, and policies of leading Indian states with an international perspective,” IEEE Access, vol. 8, pp. 74432–74457, 2020. [Google Scholar]
4. A. Qazi, F. Hussain, N. Rahim, G. Hardaker, D. Alghazzawi et al., “Towards sustainable energy: A systematic review of renewable energy sources, technologies, and public opinions,” IEEE Access, vol. 7, pp. 63837–63851, 2019. [Google Scholar]
5. M. Obi and R. Bass, “Trends and challenges of grid-connected photovoltaic systems–A review,” Renewable & Sustainable Energy Reviews, vol. 58, pp. 1082–1094, 2016. [Google Scholar]
6. A. Triki-Lahiani, A. Bennani-Ben Abdelghani and I. Slama-Belkhodja, “Fault detection and monitoring systems for photovoltaic installations: A review,” Renewable & Sustainable Energy Reviews, vol. 82, pp. 2680–2692, 2018. [Google Scholar]
7. Z. Chen, F. Han, L. Wu, J. Yu, S. Cheng et al., “Random forest based intelligent fault diagnosis for PV arrays using array voltage and string currents,” Energy Conversion & Management, vol. 178, pp. 250–264, 2018. [Google Scholar]
8. Z. Yi and A. H. Etemadi, “Fault detection for photovoltaic systems based on multi-resolution signal decomposition and fuzzy inference systems,” IEEE Transactions on Smart Grid, vol. 8, no. 3, pp. 1274–1283, 2017. [Google Scholar]
9. A. Hazra, S. Das and M. Basu, “An efficient fault diagnosis method for PV systems following string current,” Journal of Cleaner Production, vol. 154, pp. 220–232, 2017. [Google Scholar]
10. R. Fezai, M. Mansouri, M. Trabelsi, M. Hajji, H. Nounou et al., “Online reduced kernel GLRT technique for improved fault detection in photovoltaic systems,” Energy, vol. 179, pp. 1133–1154, 2019. [Google Scholar]
11. L. Maaløe, O. Winther, S. Spataru and D. Sera, “Condition monitoring in photovoltaic systems by semi-supervised machine learning,” Energies, vol. 13, no. 584, pp. 1–14, 2020. [Google Scholar]
12. F. Aziz, A. U. Haq, S. Ahmad, Y. Mahmoud, M. Jalal et al., “A novel convolutional neural network-based approach for fault classification in photovoltaic arrays,” IEEE Access, vol. 8, pp. 41889–41904, 2020. [Google Scholar]
13. H. Momeni, N. Sadoogi, M. Farrokhifar and H. Gharibeh, “Fault diagnosis in photovoltaic arrays using GBSSL method and proposing a fault correction system,” IEEE Transactions on Industrial Informatics, vol. 16, no. 8, pp. 5300–5308, 2020. [Google Scholar]
14. K. Dhibih, R. Fezai, M. Mansouri, M. Trabelsi, K. Bouzrara et al., “A hybrid fault detection and diagnosis of grid-tied PV systems: Enhanced random forest classifier using data reduction and interval-valued representation,” IEEE Access, vol. 9, pp. 64267–64277, 2020. [Google Scholar]
15. I. Taha, N. Elkalashy, M. Alsharef, N. Sabiha, M. Metwaly et al., “Investigation of diode dynamic effect on fault detection of photovoltaic systems,” Sustainable Energy, Grids and Networks, vol. 23, pp. 1–10, 2020. [Google Scholar]
16. M. Dhimish, V. Holmes, B. Mehrdadi, M. Dales and P. Mather, “Photovoltaic fault detection algorithm based on theoretical curves modelling and fuzzy classification system,” Energy, vol. 140, pp. 276–290, 2017. [Google Scholar]
17. S. Silvestre, S. Kichou, A. Chouder, G. Nofuentes and E. Karatepe, “Analysis of current and voltage indicators in grid connected PV (photovoltaic) systems working in faulty and partial shading conditions,” Energy, vol. 86, pp. 42–50, 2015. [Google Scholar]
18. M. Dhimish, V. Holmes and M. Dales, “Parallel fault detection algorithm for grid-connected photovoltaic plants,” Renewable Energy, vol. 113, pp. 94–111, May 2017. [Google Scholar]
19. A. Khoshnami and I. Sadeghkhani, “Two-stage power–based fault detection scheme for photovoltaic systems,” Solar Energy, vol. 176, pp. 10–21, 2018. [Google Scholar]
20. F. Harrou, Y. Sun, B. Taghezouit, A. Saidi and M.-E. Hamlati, “Reliable fault detection and diagnosis of photovoltaic systems based on statistical monitoring approaches,” Renewable Energy, vol. 116, pp. 22–37, 2018. [Google Scholar]
21. D. Pillai and N. Rajasekar, “An MPPT-based sensorless line–line and line–ground fault detection technique for PV systems,” IEEE Transactions on Power Electronics, vol. 34, no. 9, pp. 8646–8659, 2019. [Google Scholar]
22. M. Iqbal, Y. Niazi, U. Khan and B. Lee, “Real-time fault detection system for large scale grid integrated solar photovoltaic power plants,” International Journal of Electrical Power & Energy Systems, vol. 130, pp. 1–13, 2021. [Google Scholar]
23. H. Abdel-Ghany, A. ElGebaly and I. Taha, “A new monitoring technique for fault detection and classification in PV systems based on rate of change of voltage-current trajectory,” International Journal of Electrical Power & Energy Systems, vol. 133, pp. 1–17, 2021. [Google Scholar]
24. N. Elkalashy, A. Elhaffar, T. Kawady, N. Tarhuni and M. Lehtonen, “Bayesian selectivity technique for earth fault protection in medium-voltage networks,” IEEE Transactions on Power Delivery, vol. 25, no. 4, pp. 2234–2245, 2010. [Google Scholar]
25. I. Taha, D. Mansour, S. Ghoneim and N. Elkalashy, “Conditional probability-based interpretation of dissolved gas analysis for transformer incipient faults,” IET Generation, Transmission and Distribution, vol. 11, no. 4, pp. 943–951, 2017. [Google Scholar]
 | This work is licensed under a Creative Commons Attribution 4.0 International License, which permits unrestricted use, distribution, and reproduction in any medium, provided the original work is properly cited. |