DOI:10.32604/csse.2022.020745
| Computer Systems Science & Engineering DOI:10.32604/csse.2022.020745 | |
| Article |
Home Monitoring of Pets Based on AIoT
1Department of Electrical Engineering, National Chin-Yi University of Technology, Taichung City, 411030, Taiwan
2Department of Information Technology, Takming University of Science and Technology, Taipei City, 11451, Taiwan
*Corresponding Author: Sung-Jung Hsiao. Email: sungjung@gs.takming.edu.tw
Received: 06 June 2021; Accepted: 20 July 2021
Abstract: With technological and social development in recent decades, people have begun pursuing more comfortable lives that frequently feature household pets that are treated like members of the family. On average, one out of every three households has a pet. This has also led to the creation and growth of many businesses in the pet industry. A few companies have developed a system that allows busy office workers to remotely care for pets at home based on the Internet of Things and an intelligent adjustment function. As owners of two dogs, the authors of this study observed their pets’ living habits and recorded environmental conditions that appear suitable for them. These data were then used to develop an automatic control system to care for pets. The observational data on the pets’ habits and environment were written in a program in Arduino by using the ESP8266 Wi-Fi module. The module and booster module control is the switch and setting of various household appliances. According to the loop setting of the program, the system does not need to manually switch or adjust the electrical settings of the environment. Instead, the pet's living environment is assessed by using various sensors. The use of Arduino programs helps develop a system that can automatically adjust the environment to one that is most suitable for the pet's comfort.
Keywords: Remote medical care; active RFID; positioning; physiological signal
With the changes in people's lifestyle and social structures across the world in recent decades, many young people now choose to keep pets instead of raising children [1]. In the past, dogs were kept as pets mainly to protect the household from theft and the livestock from wild animals. Nowadays, however, pets are kept mainly as companions. There is one pet for every three households on average [1]. The pet industry has flourished as a consequence, as is evidenced by the ubiquity of animal hospitals and pet stores. This paper discusses the impact of the environment on pets based on long-term observations when their owners are away. We use the reactions of pets and the quality of their skin to determine the most suitable living environment for them, and use these observations to establish a home pet monitoring system. Most office workers do not have flexible working hours, and thus can only attend to their pets when off work. To help such people remotely care for their pets, the authors develop a complete pet home monitoring system [1].
The proposed pet monitoring system controls electrical appliances and the supplementary feed required to remotely care for pets through the Artificial intelligence Internet of Things (AIoT) and Arduino. Such appliances as air conditioners, electric fans, monitors, and dehumidifiers are controlled through Arduino, and the temperature, humidity, and other conditions of the pet's environment are monitored over a long period. These records are then used to determine the most suitable environment for pets.
This remainder of this study is organized as follows: Section 2 provides a discussion of related research, explains the concept of and technological developments related to the AIoT, and discusses various situations involving pets that are relevant to this research. Section 3 details the architecture of the proposed system and the hardware equipment used. Section 4 describes the experiments used to test the proposed system and the results. A variety of factors were simulated to determine the situation of pets at home. Section 5 summarizes the conclusions of this study and suggests directions for future work in the area [2].
This section discusses some research and technical information related to this study. The authors used the literature [3] to learn how to use the AIoT to monitor the home and gradually automate many functions therein. The research object of this study is household pets, which have different needs from those of humans. However, many items in homes are controlled by using the Internet or Wi-Fi as the main medium for manipulating items. The authors also used the literature [4] to learn to automatically control many electrical appliances. There are many smart products in society but there are not actually smart products. This is because these “smart” products can automatically control objects without any manual control. To fully automate the home pet monitoring system, the authors modeled the relevant scenario.
Research on AIoT technology relevant to the work here includes multi-sensing data fusion technology, extension theory, and image monitoring and computation technologies. However, little research has been conducted on the construction and development of pet home systems, because of which this study is important. As it is developed in light of past research and market surveys, the pet home comfort and safety system proposed in this study is expected to be marketable and profitable [5]. At present, the most popular in the industry is “IoT Wisdom and Tomofun Borrowing Children to Bring the Spark of IoT”, developed by Taiwan's IoT software company IoT Wisdom (6565), which focuses on cloud platform development, and Taiwan's new creation team Tomofun Technology (Tomofun). The aim is to integrate the IoT with the pet monitoring system to develop an online system that allows owners to monitor their pets at home through their mobile phones at any time. A recently developed technology for the IoT is the image monitoring function. Video Surveillance as a Service (VSaaS) can be used to implement a cloud IoT environment that can help examine trends in the monitored images. It is expected to drive such the revenue growth momentum of platform providers that focus on cloud image service solutions like IoT Wisdom [6].
Because the above technology does not include multi-sensing fusion and extension theory, which are considered in our proposed system, it allows for the pet's environment to only be remotely monitored, where the environment cannot be remotely adjusted to ensure its comfort. The Furbo Dog Nanny is also a dog-monitoring platform that provides only monitoring functions. Researchers agree that the pet care and interaction market has significant potential for success and growth, especially given that dogs and other pets are known to be prone to separation anxiety. This forms the basis for the need for remote monitoring systems to observe pets at home, and the use of Artificial Intelligence to learn the pet's behaviors to adjust its environment accordingly [7]. Acer under the Pawbo brand has launched a series of technological pet care and monitoring products, including interactive cameras, smart drinking fountains, smart hairdryers, smart feeding machines, smart buttons, and interactive smart toys for pets. Most such products can be remotely controlled through applications (apps). In addition, they have such functions as AI image recognition, and virtual and physical treasure digging for pets [8].
2.1 Internet of Things Technology
The IoT technology is originated in a concept proposed by Peter Lewis in a speech in 1985. Subsequently in 1999, the Massachusetts Institute of Technology (MIT) proposed adding radio-frequency identification (RFID) to the Internet as it can be used to realize intelligent planning and management. The International Telecommunication Union (ITU) then proposed the formal concept of the “Internet of Things” at the World Summit on the Information Society (WSIS) [9]. Sensing technology endows smart objects with the ability to sense changes in the environment, including the movement of objects [10]. Commonly used embedded components used to this end include infrared sensors as well as sensors to detect temperature, humidity, brightness, and pressure. RFID tags are embedded into objects so that data on them can be recorded and reported [11]. The AIoT is technically integrated with many industries, and corresponding application software is developed according to different needs. Applications include smart meters, remote medical treatment, smart homes, and pollution monitoring. The main technologies used in this context include cloud computing and big data analysis [12].
2.2 Living Environment and Pet Health
The living environment is an important factor that affects the health of pets. For example, large changes in temperature and humidity affect pet health. Although we cannot change constant external factors of their environment, we can control the indoor environment of the pet. When the temperature and humidity are very high, the pet can become fatigued and weak even if the air quality is normal [13]. When the weather is humid and cold, this increases the caloric consumption of the pet and reduces its body temperature.
When the weather is humid and hot, the air hinders the loss of moisture on the surface of the pet's lungs and tongue, which increases its body temperature. A suitable range of relative humidity for pet dogs is 30%–40%. When the humidity is higher than 65%, it has many adverse effects on pet [14]:
1. Affect development: When the temperature is between 15°C and 24°C, the relative humidity is between 30% and 40%, which is the most suitable weather for the growth and development of pet dogs. Once it exceeds or falls below this range, it is detrimental to their development. This is why pet dogs tend to be thinner in summer and develop slowly in winter. Their growth has a prominent relationship with these factors.
2. High humidity can cause diseases in pet dogs. In humid weather, the pet's resistance to disease weakens, and pet dogs are more likely to develop canine bronchitis and hemorrhagic jaundice. Their recovery after illness is also longer, and is likely to increase chances of mortality. When the relative humidity is high, bacteria reproduce more quickly, and pathogenic fungi and parasites develop to make pets more prone to skin diseases, as shown in Fig. 1a (red rash) and Fig. 1b (mildew). This can also cause hair loss, and exacerbates skin disease in dogs [15]. In case of high temperature and humidity, pets are also more likely to suffer from various diseases of the cold, such as rheumatism, neuralgia, myositis, and arthritis.
3. Low humidity is also not conducive to the health of pets because the air is too dry, especially when the temperature is also high. This causes the pet's exposed mucous membrane to dry and crack, which reduces the resistive capability of its skin against microorganisms. When the humidity is low, pets are also prone to respiratory diseases, which is a major cause of poor growth of their fur [16].

Figure 1: (a) Schematic diagram of pet rash; (b) schematic diagram of mold infection in pet
2.3 Wireless Transmission Technology
Wireless networks can meet many different needs. It allows users to connect to the Internet when mobile. Assuming that the IP of a network in a certain area often bounces, wireless network are suitable for such a connection. Wi-Fi [17], Bluetooth [18], and ZigBee [19] are common wireless communication technologies. The deputy general manager of the product service department of an electronics store explained that Bluetooth and ZigBee are used in the low-power 2.4 GHz radio-frequency products. For the sake of consistency with international standards, the relevant American frequency specifications at 5 GHz will also become functional in the future [20].
The clarity and smell of, and the volume of, combustible gas in the air are detected by relative values so that the capability of the sensor simulates the sensation on the human body. This study uses clear air as the standard value to judge values recorded by the sensor. Rs is the magnitude of resistance of various gases, and Ro is the magnitude of resistance of air when it is clear [21,22]. Air quality is based on the resistance value of air when it is clear. When various gases are under normal conditions in the environment, the values recorded by the sensor are compared with those of the air when it is clear. When the measured air quality is worse than that of clear air, its resistance is higher.
Infrared frequencies include near infrared, mid-infrared and far infrared. According to ISO 20473, they can be classified into near-infrared, short-wave infrared, medium-wave infrared, long-wave infrared, and far-infrared frequencies when used in sensors. The wavelength of the infrared sensor used varies according to the purpose of the experiment. Infrared sensors can be divided into two types: active and passive sensors. Active infrared sensors emit infrared beams when the object is blocked. If infrared beams are received, they are reflected. The receiver performs an action when it receives the infrared waves, such as activate the faucet of a sink, automatically flush a urinal in a bathroom, and move to avoid objects in the environment. Passive infrared sensors do not emit infrared beams, and sense the infrared rays emitted by the object to determine whether it is moving [23].
3 System Architecture and Hardware Equipment
This study uses the AIoT and the concept of the smart home to establish the system architecture. It can be divided into three parts, a perception layer, a network layer, and an application layer, as shown in Fig. 2. For environmental sensing, the authors set-up four kinds of sensors to monitor various parts of the room housing of the pet. Sensing modules were used for temperature and humidity, light intensity and illuminance, and clear air and infrared thermal imaging. The value recorded by the sensor installed in the house was sent back to the system, which compared with the original preset value to make a judgment regarding the environment in the context of pet health [24]. To handle different temperatures in case of more than one pet in the house, the system required preset values of temperature and humidity so that the indoor values of these measures could be matched to assess pet comfort. Fig. 3a shows a block diagram of the system. For wireless transmission, the ESP8266 is connected to the Arduino UNO motherboard so that it could use the indoor Wi-Fi as the medium of transmission. For wireless control, the system uses infrared thermal imaging to connect to a camera to track the status and location of pets. It can also interact with these devices via remote control.

Figure 2: System architecture

Figure 3: (a) Block diagram of the system. (b) Human–machine interface
Fig. 3b shows the human–machine interface system developed for this research. The top of the screen of the interface shows a picture of a pet. The user clicks it to assess the thermal image. The electric light icon reflects the brightness values obtained by the light sensor. The electric fan, air conditioner, and dehumidifier are used to control the temperature and humidity. The load equipment icon in the lower-right corner of the screen indicates the feed for the pet. Clicking it displays the weight of the feed in the feeding bowl at the given time.
Fig. 4 shows a flowchart of control of the temperature and humidity sensors. When the temperature and humidity sensors indicate that the indoor temperature is higher than 24°C, the system turns on the electric fan. The fan is switched off when the temperature is below 24°C. In case the indoor temperature is higher than 30°C, the system turns on the air conditioner. When the sensor detects that the indoor temperature is lower than 16°C, the system turns on the heater. If the indoor humidity is above 60%, the system turns on the dehumidifier, the operation of which is reassessed every 30 min to ensure optimal energy use [25].

Figure 4: Flowchart of control of temperature and humidity
Fig. 5a shows a flowchart of illuminance-sensing control. The standard outdoor illuminance is 50–500 LUX on cloudy days, and the indoor illuminance is 100–1000 LUX on sunny days. When the system judges via the light sensor that the indoor brightness is higher than 500 LUX, where the system is adjusted in accordance with the brightest outdoor and indoor illumination values on cloudy days, it does not turn on the indoor lights. If it the brightness is below this value, the system turns on the lights. The system judges brightness every 30 min [26].

Figure 5: (a) Flowchart of illumination control. (b) Flowchart of air purifier control. (c) Flowchart of infrared thermal image-based location tracking
Fig. 5b shows a flowchart of the control of the air purifier. When the system determines that the indoor air has a values of Rs/Ro < 1, it turns on the air purifier; otherwise, the purifier remain switched off. The operation of the air purifier is assessed every 30 min. Fig. 5c shows a flowchart of infrared thermal image-based location tracking. When the thermal image sensor determines a heat source, the camera is turned on to track it; if not, the camera remains switched off. The system reassesses the camera every 30 min as well.
Arduino is among the most popular development platforms in the context of the IoT. The programming language it uses has a development environment similar to those of Java and C. Many interactive devices can be developed on the platform for ambient temperature detection, environmental odor detection, and infrared sensing [27]. The development board of the Arduino Uno is dedicated to the development of IoT-related applications by using the microcontroller ATmega328P. The board has 14 digital input/output pins, six analog input/output pins, a 16 MHz quartz crystal, a USB connector, and a supply hole for 9 V of battery power. The board of the Arduino Uno can provide 3.3 V and 5 V, and has set specific pins, such as PWM pins, communication pins, SPI pins, and I2C pins, as shown in Fig. 6 [28].
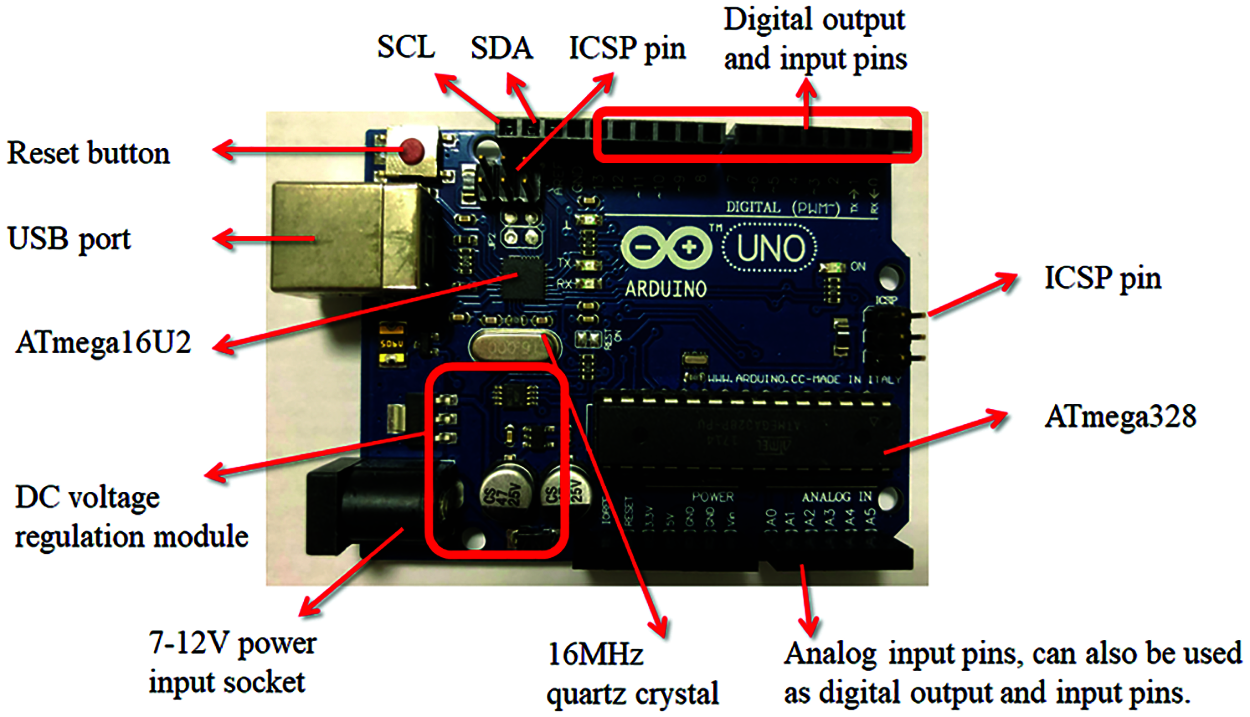
Figure 6: Development board and pin layout of Arduino Uno
3.2.2 Temperature and Humidity Sensing Module
The AM2302 (also known as DHT-22) was used as the temperature and humidity sensor module, and is shown in Fig. 7a. Its output is a calibrated digital signal. The sensor consists of a capacitive humidity element and a high-precision temperature measuring device. It uses a special method to acquire temperature and humidity to ensure the reliability and long-term stability of the results. The working voltage of the AM2302 is 3.3 V~5 V, its range of temperature measurements is −40°C~80°C, its measurement accuracy is 0.5°C, its range of humidity measurements is 0%–100% RH, and the measurement accuracy is 0.05% RH. The AM2302 module has the benefits of low power consumption, small size, high quality, fast response, strong anti-interference ability, and cost-efficient performance [29].

Figure 7: (a) DHT-22 temperature- and humidity-sensing module. (b) GY-302 BH1750 light intensity- and illuminance-sensing module. (c) Weight-sensing module. (d) TGS2602 air quality sensor. (e) Thermal image sensor module
3.2.3 Light Intensity and Illuminance Sensing Module
The GY-302 BH1750 was used as the sensor of indoor light intensity as shown in Fig. 7b. It used the original ROHM BH1750FVI chip, which has a range of voltage of DC 3~5 V and that of sensing of 1~65535 LUX. The sensor has a 16-bit AD converter for direct digital output, help avoid many complicated calculations, and has spectroscopic characteristics that do not distinguish between ambient light sources and those close to visual sensitivity. It can perform highly precise 1-Lux measurements over a wide range of brightness, and uses a low current. Due to power-off protection, it is little affected by infrared rays [30].
We needed to measure the amount of pet feed, and used an electronic scale equipped with the HX711AD weighing sensor to this end as shown in Fig. 7c. The electronic scale calculated the magnitude of force on the metal feed container and changes in it after application. This sensor reflected a linear relationship between the output of the AD module and weight. Therefore, the scale factor and offset needed to be adjusted before use, and a weight, or an object of known weight, was needed for calibration. The HX711 is a highly accurate weight sensor designed with a 24-bit A/D converter chip. Compared with other chip sensors, it includes a voltage regulator circuit and an on-chip clock oscillator. It has the characteristics of high accuracy, fast response, and strong anti-interference [31].
We used the TGS2602 odor sensor as shown in Fig. 7d [32]. It is a dedicated sensor to detect air pollution and odor. It is highly sensitive to smoke and cooking fumes as well as hydrogen sulfide, volatile organic compounds (VOC), and ammonia. When the odor sensor is exposed to a high concentration of impure gas in the air, its conductivity is increases. Smell is judged by comparing the given resistance value of air with that when the air is clear. The resistance value of air divided by the resistance value when the air is clear is equal to Rs/Ro. If the value is less than one, this means that air quality is poor compared with that when the air is clear. Its range of detection is 1–10 PPM, and it boasts the advantages of a long life and low cost. It is typically used to control the operation of air purifiers, ventilation fans, deodorization devices, and indoor air monitors.
3.2.6 Thermal Image Sensor Module
The Lepton®2.5 LWIR module of the FLIR Dev Kit was used as a camera, and had a resolution of 80 × 60 pixels. This module takes infrared radiation in the response band (from 8 to 14 microns) as input, and outputs uniform thermal images. Regardless of the temperature of the camera, the Lepton 2.5 can output 4,800 pixels. The original factory calibration temperature has an accuracy of +/−5˚C, as shown in Fig. 7e.
Eight types of loads were used in this study—air conditioners, electric fans, dehumidifiers, air purifiers, pet monitors, electric lights, automatic feeders, and heaters—as shown in the “Control Subject” part of Fig. 2. The loads were controlled through the boost module and ESP8266 module on the Arduino Uno board. Data transmission was controlled by Wi-Fi. Because the method to control each electrical appliance was different according to the sensor used to record its values, two control methods were used for the electrical loads: by using the boost module alone, and by using a boost module with relay control [33].
Extension theory was proposed by Cai Wen in 1983. The idea is to study the extensions of things, and to explore and resolve contradictions among them from qualitative and quantitative perspectives. Extension theory can be divided into several key issues, such as the pitch area, distance, position, and correlation function. It deals with problems by using the matter–element model. It can be expressed as Eq. (1):
In the above, R is the basic element that describes things, the matter element, and N, C, and V are sub-elements that constitute it. N is the name of the thing, C is its characteristic, and V is the value of the characteristic. In matter–element extension theory, if the matter–element feature is not a single item, it is represented by x features and x corresponding feature values. At this time, the feature is represented as C = [c1, c2, …, cx] A, in the form of a vector, and the feature value is V = [v1, v2, …, vx]. Therefore, the extension function of Eq. (1) can be rewritten as:
Ci is the characteristic of Fo, and Vi is the characteristic value of Ci, namely its classical domain. The matter element RF corresponding to F can be expressed as Eq. (3), where Cj is the eigenvalue of F and Vj is the eigenvalue of Cj, that is, its node domain:
Classical mathematics is the distance relationship between points, while extension theory is the distance relationship between a certain point and an interval in the real field that can be expressed as Eq. (4):
In addition to considering the relevance of points and intervals, we must also consider the relationship between a point and two intervals, or between intervals. Therefore, if F0 = <va, vb > and F = <vc, vd > belong to two intervals in the real domain, and Fo is in F, the positions of point f, and the intervals F0 and F can be expressed as Eq. (5):
The correlation function is a function obtained by dividing the distance by the position, as shown in Eq. (6):
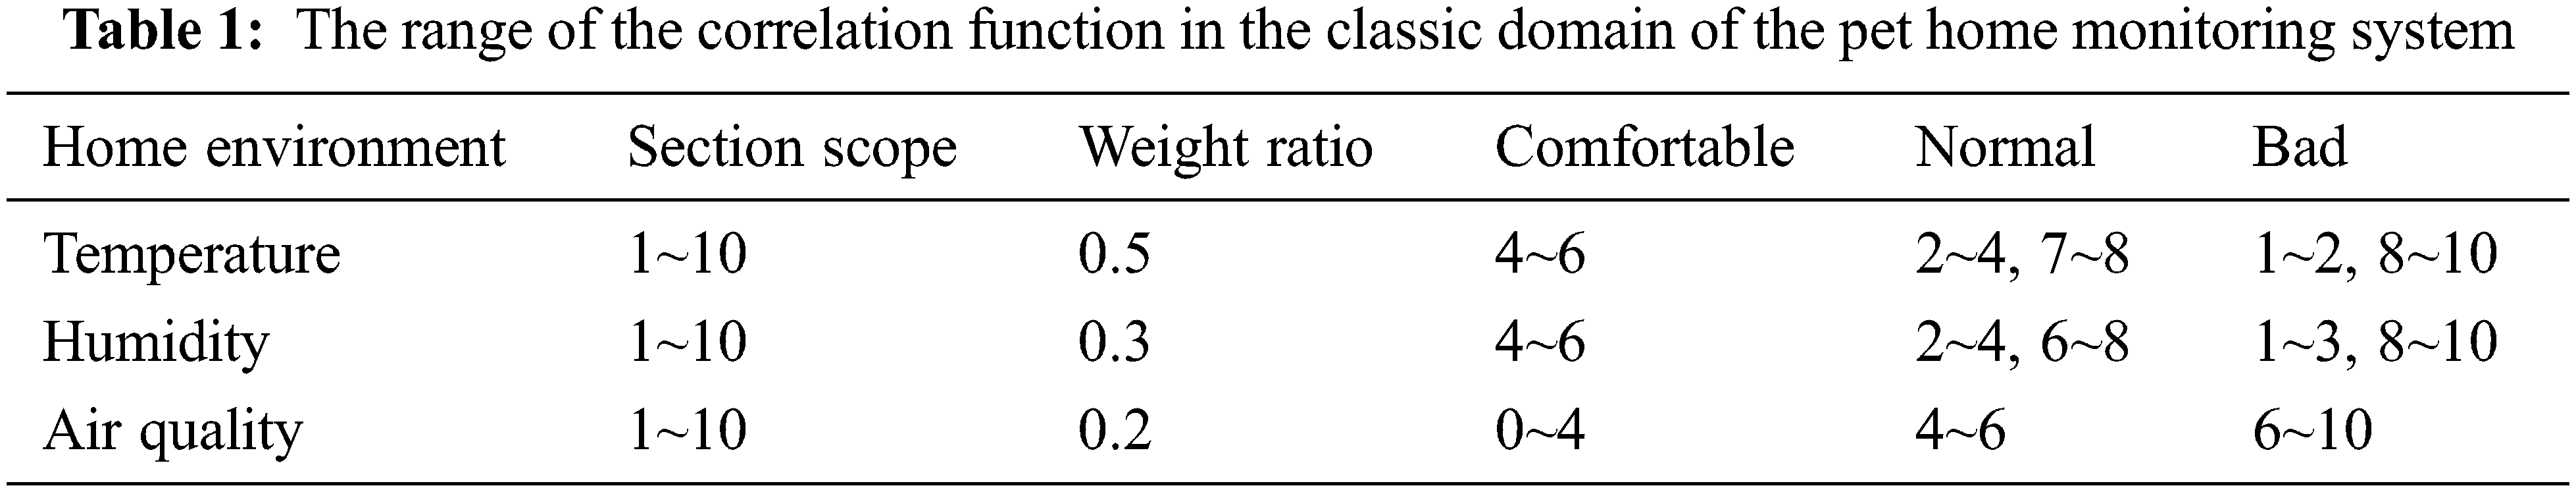
Extension theory can be used to analyze long-term statistical data and their ranges, as shown in the second column of Tab. 1. The values of each range are distinguished according to the ranges of temperature, humidity, and air quality. For example, the temperature from 20°C to 30°C is divided into 10 blocks, where each block represents 1°C; but in order to respond to the temperature that it may exceed value, as long as it is lower than 0, it is calculated as 0, and it is higher than 10 as 10. The standard ranges of temperature, humidity, and air quality in this system are all numerical results of long-term observations, and the values of various items are used as shown in the third column of Tab. 1. Our experiments divided the home environment into comfortable, normal, and bad, and the range of identification was based on long-term observations of data related to the environment of pets. The data were transformed into the range of the classic domain so that the pet owner could immediately understand the situation of the pet's living environment. The correlation function of each block is used to distinguish the importance of the various measurement conditions, as shown in the last three columns of Tab. 1. When extension theory is used to identify the home environment, not every environmental factor is equally important. For example, temperature is the most important factor among the environmental factors considered in this study. Because pets are most sensitive to temperature, and are prone to being harmed by very high and low ambient temperatures, its correlation function had the highest value. Following the construction of the module for extension theory, we need only use the measured values to obtain the result [34–36].
4 Experimental Measurements and Analysis of Result
To ensure the completeness of the pet monitoring system, the authors tested many methods of wireless transmission: Bluetooth, ZigBee, Wi-Fi, and antennas. We chose Wi-Fi because of its ease of use and low cost. The transmission distance of Bluetooth is short, and its signals are easily obstructed by walls. ZigBee is obstructed to a lesser extent by walls, but requires a large number of module connections to control several electrical appliances. Although the antenna is the best medium of transmission, it incurs additional cost because its frequency usually requires modifications. Users can connect to Wi-Fi via mobile phones to monitor the system in real time and determine understand the status of their pets.
We used the ESP8266 Wi-Fi module installed in the development version of Arduino for wireless transmission. The ESP8266 is a low-power module that has been used in many studies on signal transmission. To be able to directly control home appliances using the proposed system, we also used boost modules and relays to switch the home appliances on and off when needed. The loads incurred by the air conditioner and other electrical appliances were remotely controlled by reading the relevant code. The users could thus use Arduino and the infrared transmitters to control all electrical loads. The use of a single Arduino Uno board with the ESP8266 module to control many electrical appliances can easily lead to cause disconnection and inoperability because the control voltage is insufficient. This problem was solved by the booster module that increased the original, low voltage to the required voltage. A booster module was also used to control the relay to avoid the danger of excessive boosting. Two means of controlling electricity were used. The first was through the Arduino and ESP8266 modules along with booster modules for low-voltage electrical appliances. Fig. 8a shows this scenario. To enable the automatic control of the home pet monitoring system, the system was equipped with many sensors. The second means of controlling electricity involved only the Arduino and ESP8266 modules, and is shown in Fig. 8b.

Figure 8: (a) Schematic diagram of pet system. (b) Control of high-voltage electrical appliances
The booster module was controlled by Arduino, and in turn controlled the relay. The relay was turned on and off to control the state of the electrical appliances. We saved the data recorded by all sensors in a database, and then imported extension theory through the AIoT to make the best judgments regarding the pet's health and respond accordingly.
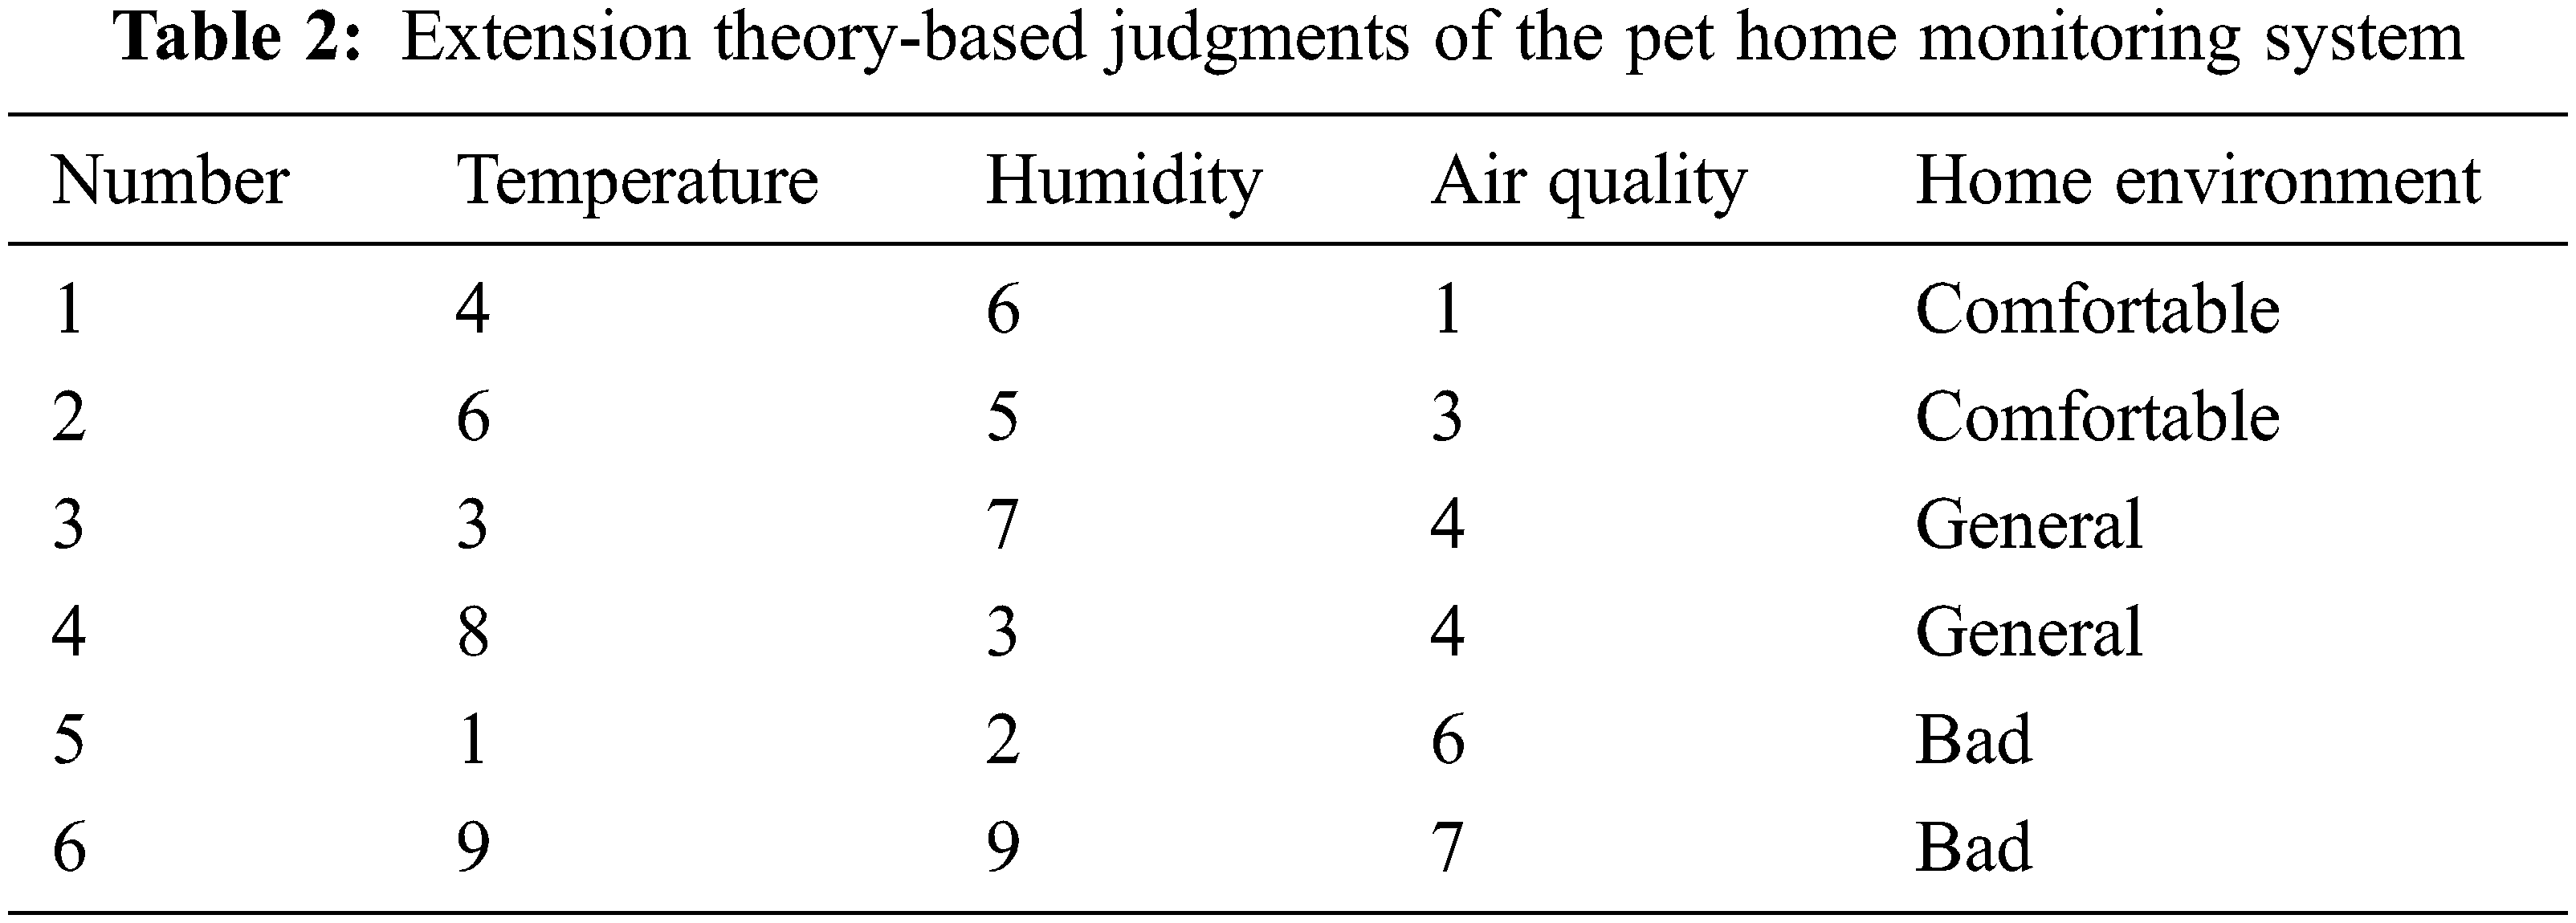
We imported the sensor data into the program based on extension theory. To determine whether the indoor environment was suitable for pets, the data were transmitted to the user's mobile phone to inform them the given situation. Therefore, combining the pet home system with extension theory enabled the user to instantly determine whether the pet's environment was comfortable, normal, or bad/uncomfortable, as shown in Figs. 9a–9c. When the environmental conditions are introduced into the calculation of the extension theory program, we can know which answer is the closest to the current indoor optimal comfort through judgment, as shown in Tab. 2.

Figure 9: Extension theory-based judgments of the pet's environment. (a) Comfortable environment, (b) normal environment, and (c) bad environment
We developed a model according to the characteristics of parameter setting in extension theory, which improves its speed of convergence while preventing the algorithm from falling into the local optimum. This improves its ability to find the global optimum. The results show that the best predictions of pet comfort made by the extension theory-based model were more accurate than those of other models of the same type. The results can thus provide a reference for predictions by other multi-sensing systems.
Fig. 10a shows the measurement diagram of temperature and humidity control. When the ambient humidity was lower than 60%, the dehumidifier was turned off, and was turned on when the humidity was higher than 60%. The electric fan was turned on when the ambient temperature was higher than 24°C, and the air conditioner was turned on when the temperature was higher than 30°C. Figs. 11 and 12 show comparison diagrams of temperature and humidity. Before control was added to the system, the temperature continued to rise and humidity was always high. Once control had been added, the air conditioner, electric fan, and dehumidifier were automatically turned on, when needed, to control the ambient temperature and humidity. In this way, the proposed system ensured a comfortable home environment for pets.

Figure 10: (a) Temperature and humidity control as measured by mobile phone. (b) Measurements of illumination sensor displayed on the mobile phone. (c) Results of tests of automatic feeder displayed on mobile phone. (d) Measurements of air control displayed on mobile phone. (e) Results of infrared thermal image-based location tracking displayed on mobile phone

Figure 11: Comparison of temperature control when (a) general control of extension theory was not added, and when (b) extension theory-based control was added to the system

Figure 12: Comparison of humidity control when (a) extendable general control was not added, and when (b) extendable control was added to the system
Fig. 10b shows measurements of illuminance-sensing control. When the indoor illuminance was lower than 500 LUX, the lamp was turned on, and was turned off when the indoor illuminance was higher than 500 LUX. Fig. 13 shows a comparison diagram of illuminance sensing, which shows that the indoor environment was clearly brighter after control had been added.
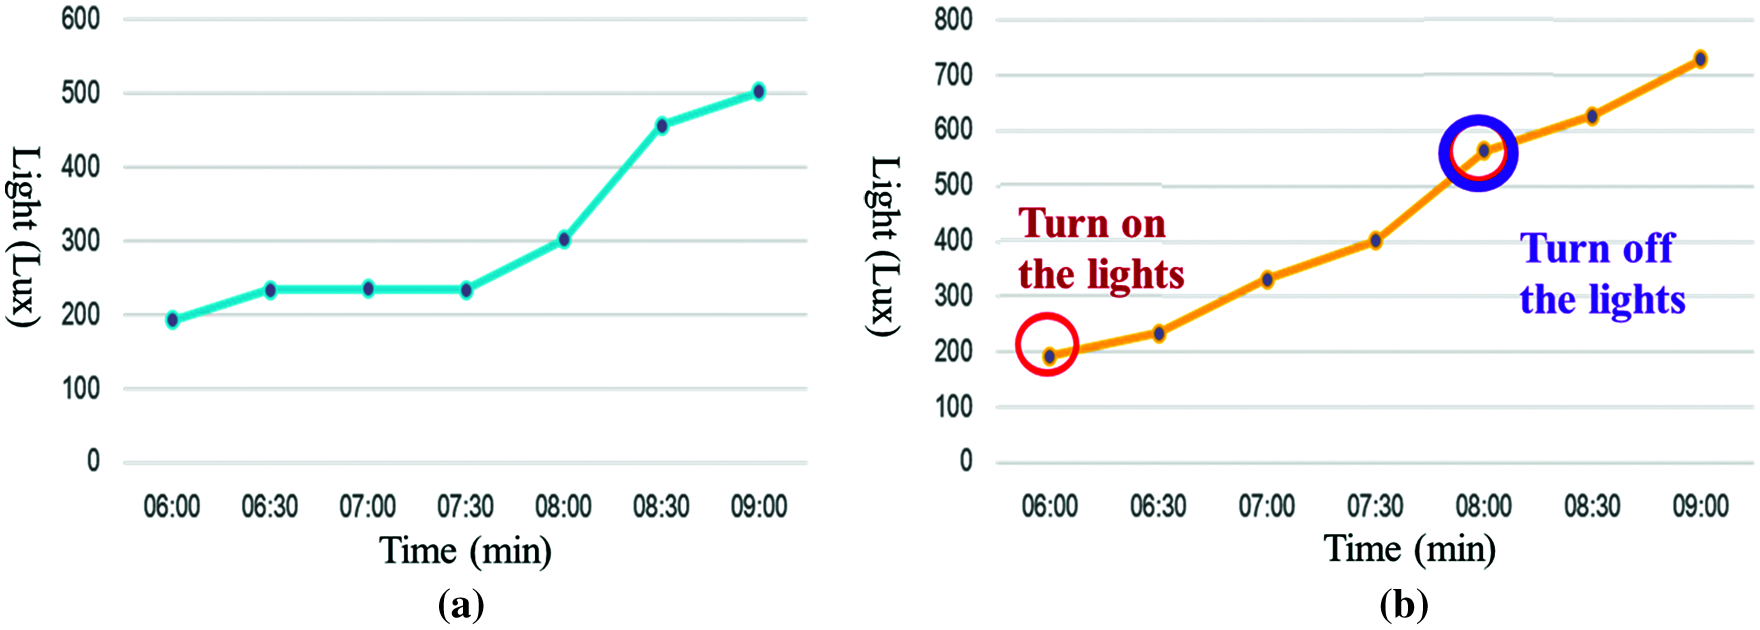
Figure 13: Comparison of Illuminance-sensing Control. (a) General control without extension theory-based addition. (b) Extension control added to the system
Fig. 10c shows the measurement diagram of the automatic feeder. When the weight of the feeder was less than 300 g, feed was added until the weight reached 300 g and then stopped. When the feeder weighed more than 300 g, the feed was not supplemented. Fig. 14 shows a chart of comparison of automatic feeding. Before the control was added, the pet needed to wait for the owner to return to replenish the feeder. Once control had been added, the feed was automatically refilled when the weight of the feeder was below the set weight.
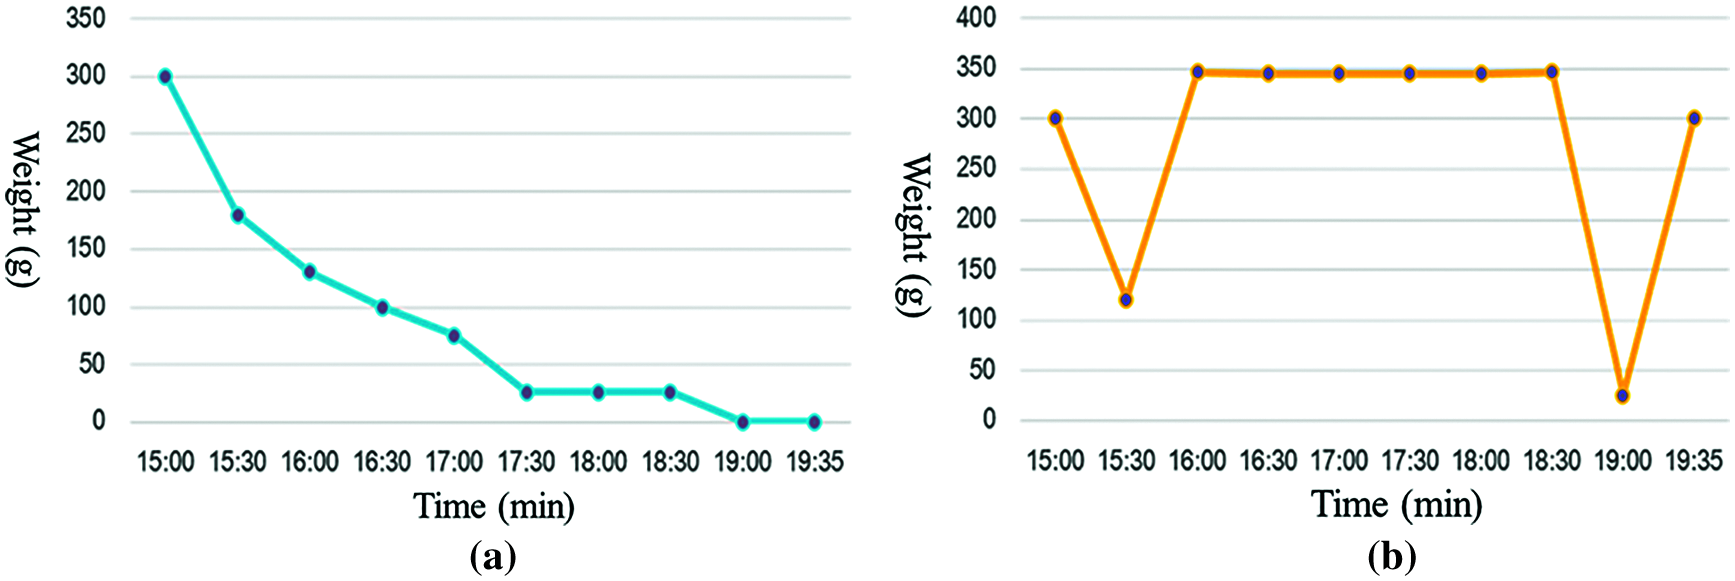
Figure 14: Comparison of feeding of pet. (a) Extendable general control was not added. (b) Extendable control was added to the system
Fig. 10d shows the measurement diagram of air sensing control. When the value is less than one, the air purifier was turned on, and was turned off when the value was greater than one. Fig. 10e shows the measurement map of infrared thermal image-based location tracking. When the heat source was tracked, the camera turned on to record the pet accordingly. The system assessed the operation of the camera every 30 min; if it detected a heat source, the camera continued to operate; if not, it was turned off. The general control of the extension refers to general sequential control; that is, simply setting a threshold value for the sensors such that an operation was executed when a particular value was recorded by a given sensor exceeded it. From this research, it is shown that after adding extension calculations, in addition to adding multiple sensing values at the same time for optimization calculations, every moment it is a different permutation and combination. For example, the calculated environment is uncomfortable. The system made a decision on activating a load based on the results calculated by extension theory. It might have turned the air conditioner on or the dehumidifier off as driven by multiple factors. It could thus realize the intelligent control of a complex situation.
Recent social and economic changes across the world have led to a transformation in the perception of pets from a means of personal protection to a source of companionship. This study used the Arduino Uno board and a booster module along with the ESP8266 to automatically control and adjusts home appliances through sensor data to ensure a comfortable environment for pets when their owners are not at home. The Internet of Things technology was used to remotely control the home appliances and quickly improve the pet's living environment while avoiding wasting electricity.
We combined the proposed system with extension theory to judge the state of the home environment, identify electrical faults, and ensure the safety of the pet. The ESP8266 Wi-Fi module was used to control the home appliances in this study. It can also control other appliances, such as lawn mowers, drones, and electric doors. For instance, it can be used to set the path of mowing of a lawn mower, and can use ultrasonic or infrared signals to detect objects in its path to ensure safe and automated mowing.
We can also use a control motor to open and close an electric door, or manipulate a delicate mechanical arm. More sensors and related control appliances can thus be added to the proposed system to make the pet more comfortable. For example, many pet owners have been unable to care for pets at home during COVID-19 because of forced isolation away from home or hospitalization. The proposed home pet system can be combined with other systems in this case to automatically provide food and water for pets. It can also be enhanced to automatically clean the house and notify the owner of the status of the pet's health, so that the pet can get complete care even when the owner is not at home.
Acknowledgement: This research was supported by the Department of Electrical Engineering at National Chin-Yi University of Technology. The authors would like to thank the National Chin-Yi University of Technology, Takming University of Science and Technology, Taiwan, for supporting this research. We thank Cwauthors (https://www.cwauthors.com) for its linguistic assistance during the preparation of this manuscript.
Availability of data and materials: Data sharing not applicable to this article as no datasets were generated or analyzed during the current study.
Funding Statement: The authors received no specific funding for this study.
Conflicts of Interest: The authors declare that they have no conflicts of interest to report regarding the present study.
1. H. T. Hung and R. C. Chen, “Pet cat behavior recognition based on YOLO model,” in Proc. IS3C, Taichung, Taiwan, pp. 391–394, 2020. [Google Scholar]
2. Y. Lin, Y. Gao, B. Li and W. Dong, “Revisiting indoor intrusion detection with Wi-fi signals: Do not panic over a pet!,” IEEE Internet of Things Journal, vol. 7, no. 10, pp. 10437–10449, 2020. [Google Scholar]
3. T. Malche and P. Maheshwary, “Internet of things (IoT) for building smart home system,” in Proc. I-SMAC, Palladam, India, pp. 65–70, 2017. [Google Scholar]
4. L. Salman, S. Salman, S. Jahangirian, M. Abraham, F. German et al., “Energy efficient IoT-based smart home, “ in Proc. WF-IoT, Reston, VA, USA, pp. 526–529, 2016. [Google Scholar]
5. H. P. Hsu, K. M. Yu, W. Ouyang, C. J. Xu, T. Malche et al., “Constructing a smart home control system with the internet of things,” in Proc. APCAP, Auckland, New Zealand, pp. 128–129, 2018. [Google Scholar]
6. P. Sivagami, D. Jamunarani, P. Abirami, M. Pushpavalli, V. Geetha et al., “Smart home automation system methodologies–A review,” in Proc. ICICV, Tirunelveli, India, pp. 1386–1390, 2021. [Google Scholar]
7. D. S. Namdeo and V. R. Pawar, “A review: IoT based power & security management for smart home system,” in Proc. ICEAC, Coimbatore, India, pp. 552–556, 2017. [Google Scholar]
8. N. A. N. M. Ashril, D. P. Dahnil and S. Abdullah, “Wi-Fi based smart home prototype development, “ in Proc. ICEEI, Bandung, Indonesia, pp. 540–543, 2019. [Google Scholar]
9. M. Zouai, O. Kazar, B. Haba and H. Saouli, “Smart house simulation based multi-agent system and internet of things,” in Proc. ICMIT, Adrar, Algeria, pp. 201–203, 2017. [Google Scholar]
10. D. Minoli, K. Sohraby and B. Occhiogrosso,“Iot considerations, requirements, and architectures for smart buildings—Energy optimization and next-generation building management systems,” IEEE Internet of Things Journal, vol. 4, no. 1, pp. 269–283, 2017. [Google Scholar]
11. D. Sobnath, T. Kaduk, I. U. Rehman and O. Isiaq, “Feature selection for UK disabled students’ engagement post higher education: A machine learning approach for a predictive employment model,” IEEE Access, vol. 8, pp. 159530–159541, 2020. [Google Scholar]
12. W. Xu, J. Zhang, J. Y. Kim, W. Huang, S. S. Kanhere et al., “The design, implementation, and deployment of a smart lighting system for smart buildings,” IEEE Internet of Things Journal, vol. 6, no. 4, pp. 7266–7281, 2019. [Google Scholar]
13. M. A. Malinowski and M. Imitiaz, “Smart dog walk monitor and reminder with color-coded status indicators,” in Proc. HSI, Richmond, VA, USA, pp. 114–117, 2019. [Google Scholar]
14. Y. S. Shih, H. Samani and C. Y. Yang, “Internet of things for human—pet interaction,” in Proc. ICSSE, Puli, Taiwan, pp. 1–4, 2016. [Google Scholar]
15. N. Mukai, Y. Zhang and Y. Chang, “Pet face detection,” in Proc. Nicograph Int. (NicoInt), Tainan, pp. 52–57, 2018. [Google Scholar]
16. A. R. Al-Ali, I. A. Zualkernan, M. Rashid, R. Gupta and M. Alikarar, “A smart home energy management system using IoT and big data analytics approach,” IEEE Transactions on Consumer Electronics, vol. 63, no. 4, pp. 426–434, 2017. [Google Scholar]
17. W. Zhang, W. Hu and Y. Wen,“Thermal comfort modeling for smart buildings: A fine-grained deep learning approach,” IEEE Internet of Things Journal, vol. 6, no. 2, pp. 2540–2549, 2019. [Google Scholar]
18. C. Gray, R. Ayre, K. Hinton and L. Campbell, “‘Smart’ is not free: Energy consumption of consumer home automation systems,” IEEE Transactions on Consumer Electronics, vol. 66, no. 1, pp. 87–95, 2020. [Google Scholar]
19. F. Meneghello, M. Calore, D. Zucchetto, M. Polese and A. Zanella, “IoT: Internet of threats? A survey of practical security vulnerabilities in real IoT devices,” IEEE Internet of Things Journal, vol. 6, no. 5, pp. 8182–8201, 2019. [Google Scholar]
20. A. K. Sultania, F. Mahfoudhi and J. Famaey, “Real-time demand response using NB-IoT,” IEEE Internet of Things Journal, vol. 7, no. 12, pp. 11863–11872, 2020. [Google Scholar]
21. Q. P. Ha, S. Metia and M. D. Phung, “Sensing data fusion for enhanced indoor air quality monitoring,” IEEE Sensors Journal, vol. 20, no. 8, pp. 4430–4441, 2020. [Google Scholar]
22. K. Gu, J. Qiao and W. Lin, “Recurrent air quality predictor based on meteorology- and pollution-related factors,” IEEE Transactions on Industrial Informatics, vol. 14, no. 9, pp. 3946–3955, 2018. [Google Scholar]
23. J. Liao, L. Yuan and C. Nie, “A simulation method for thermal infrared imagery from moon-based earth observations,” IEEE Sensors Journal, vol. 21, no. 6, pp. 7736–7747, 2021. [Google Scholar]
24. Z. Zhou, H. Yu and H. Shi, “Optimization of wireless video surveillance system for smart campus based on internet of things,” IEEE Access, vol. 8, pp. 136434–136448, 2020. [Google Scholar]
25. A. Javed, A. Malhi, T. Kinnunen and K. Främling, “Scalable IoT platform for heterogeneous devices in smart environments,” IEEE Access, vol. 8, pp. 211973–211985, 2020. [Google Scholar]
26. S. A. R. Farnes, D. -M. Tsai and W. -Y. Chiu, “Autofocus measurement for electronic components using deep regression,” IEEE Transactions on Components, Packaging and Manufacturing Technology, vol. 11, no. 4, pp. 697–707, 2021. [Google Scholar]
27. J. Mabrouki, M. Azrour, D. Dhiba, Y. Farhaoui and S. E. Hajjaji, “Iot-based data logger for weather monitoring using arduino-based wireless sensor networks with remote graphical application and alerts,” Big Data Mining and Analytics, vol. 4, no. 1, pp. 25–32, 2021. [Google Scholar]
28. Y. Hokazono, A. Koizuka, G. Zhu, M. Suzuki, Y. Narusue et al., “Iotorch: Reliable led-to-camera communication against inter-frame gaps and frame drops,” IEEE Transactions on Mobile Computing, vol. 20, no. 2, pp. 550–564, 2021. [Google Scholar]
29. A. Alsalemi, Y. Himeur, F. Bensaali, A. Amira, C. Sardianos et al., “A micro-moment system for domestic energy efficiency analysis,” IEEE Systems Journal, vol. 15, no. 1, pp. 1256–1263, 2021. [Google Scholar]
30. M. A. Rahman, A. T. Asyhari, M. S. Obaidat, I. F. Kurniawan, M. Y. Mukta et al., “Iot-enabled light intensity-controlled seamless highway lighting system,” IEEE Systems Journal, vol. 15, no. 1, pp. 46–55, 2021. [Google Scholar]
31. B. Mondal, S. F. Ali and N. Mandal, “An approach to design a wireless air flow transmitter using flex sensor,” IEEE Sensors Journal, vol. 21, no. 9, pp. 10498–10505, 2018. [Google Scholar]
32. R. Yatabe, A. Shunori, B. Wyszynski, Y. Hanai, A. Nakao et al., “Odor sensor system using chemosensitive resistor array and machine learning,” IEEE Sensors Journal, vol. 21, no. 2, pp. 2077–2083, 2021. [Google Scholar]
33. A. R. Barai, M. R. K. Badhon, F. Zhora and M. R. Rahman, “Comparison between noninvasive heart rate monitoring systems using GSM module and ESP8266 Wi-Fi module,” in Proc. ICECTE, Rajshahi, Bangladesh, pp. 45–48, 2019. [Google Scholar]
34. J. Zhang and Y. Shen, “High-order affinity extension of normalized cut and its applications,” IEEE Access, vol. 6, pp. 866–870, 2018. [Google Scholar]
35. M. Wu, K. Wang, X. Cai, S. Guo, M. Guo et al., “A comprehensive survey of blockchain: From theory to IoT applications and beyond,” IEEE Internet of Things Journal, vol. 6, no. 5, pp. 8114–8154, 2019. [Google Scholar]
36. C. Pascal and I. Lipovanu, “Rule-based extension through IoT for a robotized application,” in Proc. ICSTCC, Sinaia, Romania, pp. 559–563, 2020. [Google Scholar]
 | This work is licensed under a Creative Commons Attribution 4.0 International License, which permits unrestricted use, distribution, and reproduction in any medium, provided the original work is properly cited. |