DOI:10.32604/csse.2022.021164
| Computer Systems Science & Engineering DOI:10.32604/csse.2022.021164 | |
| Article |
Detection of Parkinson’s Disease with Multiple Feature Extraction Models and Darknet CNN Classification
1Department of Information Technology, Kumaraguru College of Technology, Coimbatore, 641049, India
2Department of Computer Science and Engineering, Kumaraguru College of Technology, Coimbatore, 641049, India
*Corresponding Author: G. Prema Arokia Mary. Email: gpremaarokiaresearch1@gmail.com
Received: 25 June 2021; Accepted: 17 September 2021
Abstract: Parkinson’s disease (PD) is a neurodegenerative disease in the central nervous system. Recently, more researches have been conducted in the determination of PD prediction which is really a challenging task. Due to the disorders in the central nervous system, the syndromes like off sleep, speech disorders, olfactory and autonomic dysfunction, sensory disorder symptoms will occur. The earliest diagnosing of PD is very challenging among the doctors community. There are techniques that are available in order to predict PD using symptoms and disorder measurement. It helps to save a million lives of future by early prediction. In this article, the early diagnosing of PD using machine learning techniques with feature selection is carried out. In the first stage, the data preprocessing is used for the preparation of Parkinson’s disease data. In the second stage, MFEA is used for extracting features. In the third stage, the feature selection is performed using multiple feature input with a principal component analysis (PCA) algorithm. Finally, a Darknet Convolutional Neural Network (DNetCNN) is used to classify the PD patients. The main advantage of using PCA- DNetCNN is that, it provides the best classification in the image dataset using YOLO. In addition to that, the results of various existing methods are compared and the proposed DNetCNN proves better accuracy, performance in detecting the PD at the initial stages. DNetCNN achieves 97.5 % of accuracy in detecting PD as early. Besides, the other performance metrics are compared in the result evaluation and it is proved that the proposed model outperforms all the other existing models.
Keywords: Parkinson’s disease; multi-variant feature extraction; DarkNet CNN; principle component analysis; feature selection; machine learning; deep learning
The damage in the nerve cells and the central nervous system in the brain leads to a drop in dopamine. This dopamine loss in brain results in Parkinson’s disease. Initially, Parkinson’s disease have tremors in one hand. It may have other symptoms like balance loss, slow work and movement, stiffness etc. These diseases consider as a disorder in Neuro-degeneration due to the damage in dopamine-producing neurons. Moreover, the area in the brain called substantia nigra which has dopamine-producing neurons. So, the disorder grows very slowly over the years and it also differs from one person to another. PD causing agents are unknown, not static in reasons. Also, this disease has no medicines for curing the problem permanently. The medication and surgery are available to lessen the symptom and slow down the disease to get progressed.
The treatment is dopaminergic based medications. PD became severe because neurons in the substantia nigra have been lost already. Instead of dopamine, it has accumulated with alpha-synuclein which is considered as abnormal. Many of the medical scientists are trying to explore their studies on PD biomarkers in order to predict the diseases at its early stage.
Generally, the brain neuron is an interconnected region with a more complicated network. The recent studies and the results have showed that the functioning of the brain is not just based on its regions; it is due to the functioning of network topology [1,2]. The brain can be demonstrated as a collection of nerve networks i.e., theory points, brains are connected with more body nodes. In the article [3,4] graph theory represents the regions of brain ‘ interactions among them and network activities. It is also proved that some of the abnormal functioning of the brain can be demonstrated with the prediction of disease using graph theory. It reveals that it is imperative to understand the brain networks in diagnosing PD at the earliest. Fig. 1. describes the stages of PD and its treatment-related details from WHO.
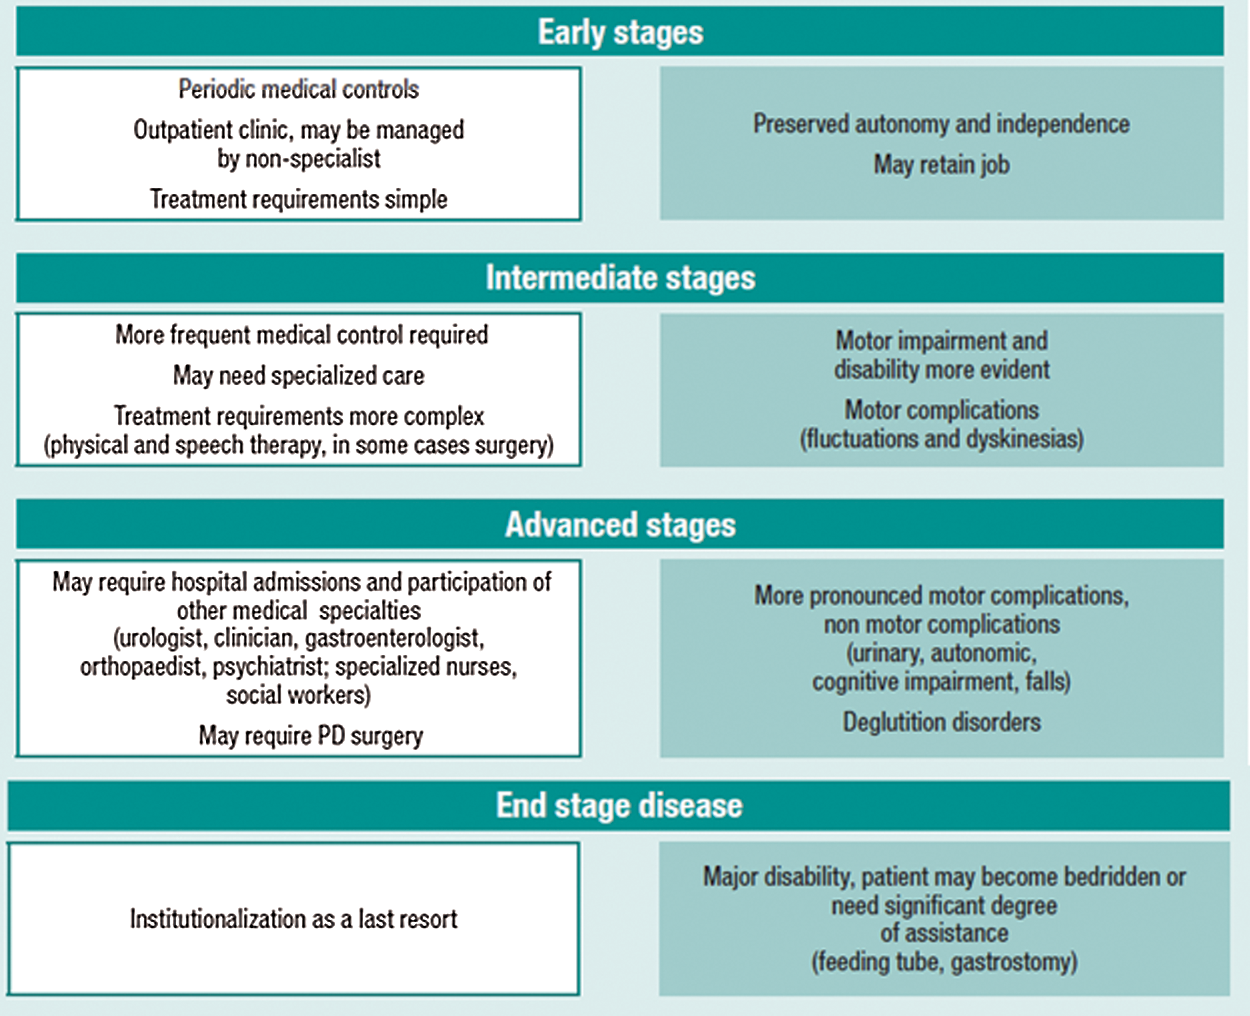
Figure 1: Stages of Parkinson’s disease
After Alzheimer’s disease, the second most age-based neurodegenerative disorder is Parkinson’s disease. At present, 7 to 10 million persons worldwide have been affected by Parkinson’s disease. Eighty years of old people are affected in the ratio of 1900 per 100000. Similarly, it is estimated that 4% of persons are diagnosed with Parkinson’s at their age of 50. Particularly, the men are being prone to this disease 1.5 times more than the women.
This disease makes the persons away from their social life, quality, and person to person interactions. The medical expense of this disease is more and it worsens their financial situation.
The neurological disorder of Parkinson’s disease shows its first symptom as a tremor in one of the hands, slowness in movements and stiffness in face. The second most dominant symptoms are vocal difficulties. Still now, the problem causing agent of Parkinson’s disease is not understood. Degeneration of cells in the nerves of selective brainstem happens without any specific reason. In this article, the marker of PD images of the patients is collected as a dataset and it is used for detecting the disease at its early stage.
The detection of speech variation among the patients is considered as an early detection stage in many research articles [5]. Now, the focus is on how accurately the dataset is processed and the patients of PD are predicted.
The PD detection techniques are nowadays looking for accurate prediction. The requirement was achieved in the proposed research article using more effective machine learning and deep learning methodologies. Various algorithms were implemented for detecting the PD symptoms at early stages. Also, the existing uses of techniques with some of the specific learning algorithms and detection modes are reviewed. The main drawbacks in these techniques were identified in terms of limited features. These issues were resolved in the proposed research work. By the current study, it is proved that the images of markers are used to detect the early symptoms or intermediate development stage of Parkinson’s disease as per the data of WHO (Fig. 1). The preferrable technologies in the detection of disease are as follows:
1. Various feature evaluation techniques are employed for selecting the appropriate feature from the data set without noisy data.
2. PCA-DarkNet Convolutional Neural Network (DNetCNN) is implemented for detecting the Parkinson’s disease.
The proposed techniques are used in predicting PD accurately when compared to the other neural networks in machine learning techniques. The process of finding the abnormalities using the image features helps successfully in early detection of PD.
The paper is organized as follows: Apart from the introduction, the literature survey is presented in Section 2. Section 3 explains the implementation of the proposed methodology with neural networks. Additionally, the extraction of multiple feature is implemented in the selection process. The performance of the proposed research work is evaluated and presented in Section 4. Finally, the Section 5 has the conclusion and future scopes of the research.
The speech attributes were used to predict the PD symptoms in the article of Biswajt et al. [5]. Voice features were processed using Naive Byes and SVM methodology. In regard to that, a novel method was designed using Machine learning techniques for analyzing the voice models and detecting the PD patients. Accurate outcomes were projected in the results. Nevertheless, the specified work used an old SVM classifier that could not understand the noise invoices. Data analysis using multi-agent system was proposed by Mostafa et al. [6] for detecting the vocal disorders. The vocal dataset of the patient is used with the decision trees and the strengthening of learning strategies. The final classification is done using Naive Bayes with random forest method. Real-time processing was complicated. In Bot et al. [7], it was proposed to collect the data using mobile and analyzing the PD. In the study, less problem-based datasets were used for the detection with less scalability. The symptoms of Idiopathic PD symptoms were utilised for detecting the diseases in early stages as reported by Bouwmans et al. [8].
An artificial neural network with backpropagation was suggested by Sadek et al. [9] for detecting PD. The method was used to track the continuous movements of the patients. Another pattern matching was performed using ANN. Movement patterns of various patients were evaluated for PD detection. The disorders of Synuclein protein were evaluated with the rate of aggregation by Espay et al. [10] in order to observe PD and Alzheimer’s symptoms. In the study, deep learning and machine learning were not used in the prediction of protein disorder. The nonmotor symptoms of PD were analyzed in the article by Seppi et al. [11]. PD treatment was suggested based on the nonmotor symptoms in the development of next level symptoms and treatment.
The prediction of PD symptoms using data preprocessing, cross fold and machine learning techniques was proposed by Gao et al. [12]. From the study, it was clear that the neuro and the tremor data were used so as to predict the PD in the early stages. The results were valuable but they were not sufficient enough in detecting PD. Model of information gain was suggested by Rastegari et al. [13] for PD prediction from the input dataset. Different machine learning with the information gain model was implemented. It was shown that the results in finding PD were good but not greater than the deep learning techniques. The process of analyzing images using deep learning methods such as a deep neural network with a convolutional neural network was proposed by choi et al. [14]. In the implementation, the images of dopamine transporter data features with profound variations were utilised. The DNN along with the CNN layers were used in order to predict the PD by frames in the images. Image processing techniques had positively evaluated the Parkinson’s disease. In the specified research, the main drawback was that the focus was only given to the dopamine levels of the image.
In the research work, Abdulhay et al. [15] had suggested tremor and gait disorders for PD detection at the earlier stages. Frequency differences were analyzed in the real-time for the purpose of detecting the disorders. In the study, the peak detection with gait algorithm was employed with the evaluations of kinetic features. The specified working frequency cut-off range was determined using machine learning with signaling filters in case of tremor and gait disorders. Moreover, only the body abnormalities and less training features were used in deep learning models. The approach for assessing the natural speeches was carried out using machine learning approaches. The original feedback of people with different age groups who were affected with PD were analyzed. Further, the speech abnormalities were identified in the detection of PD. The sensor-based PD detection was suggested by Pereira et al. [16]. The abnormalities in writing were identified using sensors by Kubota et al. [17]. In the study, a pen was fitted with different sensors for detecting the abnormalities of writing, and a pressure sensor was suggested for the detection of abnormalities in handwriting. Camps et al. [18] had used the body sensors in order to identify the abnormalities of motion in a moving body. Even though a wide variety of techniques and datasets are suggested, there is still a challenge in the early prediction of this silent disease. Therefore, it is clear that there is a need for an appropriate tool in the detection of the disease.
3 Parkinson’S Disease Detection Using Darknet Convolutional Neural Network
A detailed discussion about the proposed Parkinson’s disease detection based on Darknet Convolutional Neural Network (DNetCNN) model was discussed. There were four major stages in the specified model. In the first stage, data preprocessing was used for the preparation of Parkinson’s data. In the second stage, the MEEA model was used for extracting the features. The principal component analysis was used in the third stage for enhancing the accuracy of the classifier. Finally, PD was detected using Darknet Convolutional Neural Network (DNetCNN) in the fourth stage that was used for the training features. Fig. 2 shows the general architecture of the proposed PD detectors.
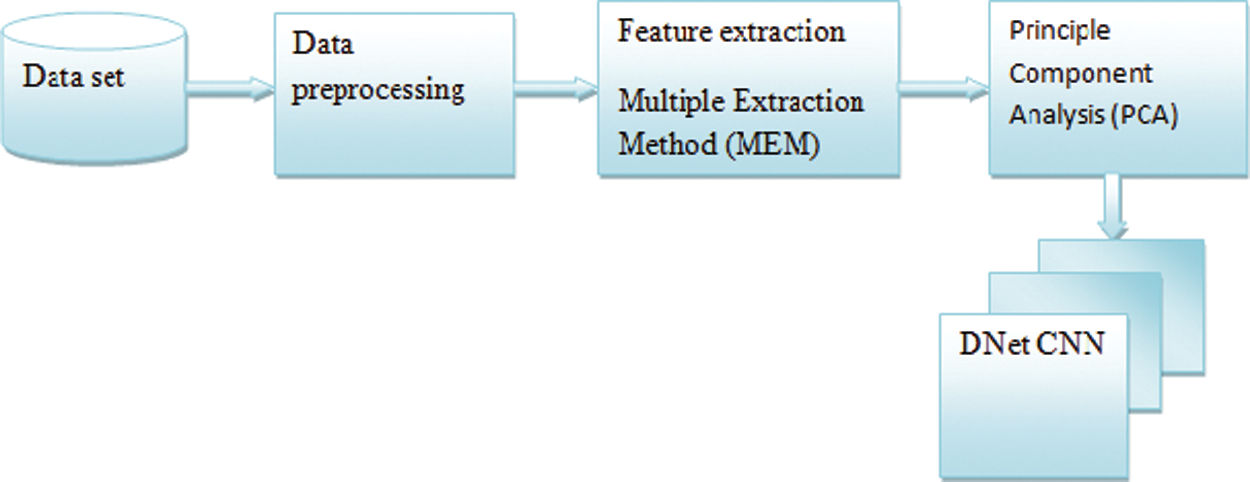
Figure 2: General architecture of the proposed system
For the experimental analysis, the dataset from Parkinson’s Progression markers Initiative (PPMI) had been taken. PPMI was the clinical study from the observation of PD progression. The images in the database were considered as 4+0.5h of DaTScan. The dataset was consisted of 269 samples. Among them, 158 images were PD patients and 111 images were of healthy controls. Among the dataset, 80% of the data were accounted for the training samples and 20% of the data were accounted for the testing samples. The specific partition was based on the k-fold-validation with k value of 5. The proposed DNet- CNN was trained with 100 epochs. Similarly, the experiment was repeated as (k-1) time for the training and testing of the data for five times.
Multiple Feature Evaluation Approach (MFEA) were used for evaluating the features of the input dataset. In the study, the intelligent agent sets were used for deciding the feature extraction, which in turn could interact with each other within the environment. Furthermore, when the problems were not solved by using the individual agents, a joint agent function was preferred in order to solve the case. So, in the system, flexibility was enhanced using the application of the agent. The agents were feature evaluator and evaluation function where the functionality was segregated. During the time of working, the interactions with its functional modules were enabled. Also, there were five agents that were encompassed in MFEA. The agent had operated its specific evaluation feature techniques. Moreover, the agent helped in ranking the features and search algorithm that was used for implementing and creating the subsets for the feature. Other weighted feature subsets were ordered based on the results of the evaluation process.
After the extraction of the features, the filtration process had taken place. The agents had filtered the subsets and produced preliminary vector copies. These copies were collaborated and produced optimized vectors. Fig. 3 explains the feature extraction process.
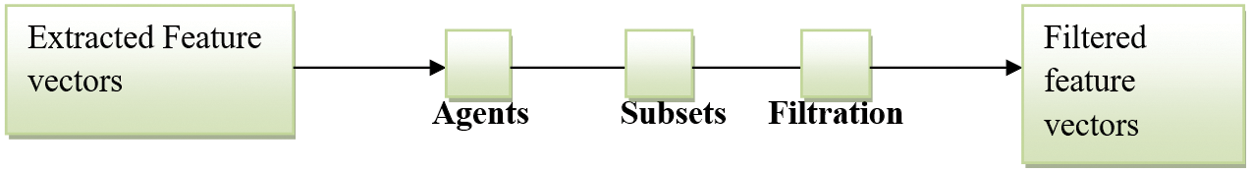
Figure 3: An overview of MFEA
In the evaluation process, five of the following agents were considered:
Autocorrelation evaluator:
The feature evaluator
Correlation feature selection:
Gain Ratio evaluator:
Third agent
Info Gain evaluator:
The feature evaluator
SVM Feature evaluator:
The
The values of the five agents were collaboratively measured as the mean of features rank and frequency of its appearance. The features that had high frequency and low mean value were utilised for the further process. The combination of selected subset features was used to form a feature filtered vectors. Highly ranked features were selected for the process of classification. Whereas, the features which had fewer weights were eliminated. Finally, the classifier had the choice of selecting only the vectors that were fitted in it.
Each of the operator had given different ranks by all the operators and eliminated the low ranked features respectively. Hence, the process of classification was enhanced using MEM. The global minimum value which was not suited for the classifier was eliminated.
Assume initial dataset D with feature vector V’s m instances length. V =
Every agent is inclined to generate the evaluated features as,
where, the feature is represented as xi, in X, total features count are represented as n and i=
Based on the results of the evaluation, the selected features count were computed by t. A human or an agent can set the value of t that can compute this autonomously. The agents compute a specific vector with the length D according to the expression (3).
where the size of D is represented as m, original features count in D is represented as n, for a test attempt, training diminutions is represented as d, attempt index is represented k0, and for every attempt, training dataset size is represented as s. MFEA algorithm of a multi-agent system is shown below where the filtered features are represented as
3.3 Feature Selection Using Principal Component Analysis
Features were extracted in the proposed work using PCA. From the images of MRI brain, the wavelet coefficient size can be minimized using a useful dimensionality reduction tool called principal component analysis (PCA). A dataset C with N size is assumed and it has d dimension. The jth feature sample mean mj is computed first as [19,20].
In the next stage, zero-mean dataset B is computed as
where a vector with all one is represented as e and it has N
In fourth stage, covariance matrix Z has Eigen decomposition expression as
Here, the eigenvector matrix is represented as X; the eigenvalue matrix is represented as Y, a diagonal matrix.
In the Fifth stage, X and Y are rearranged so that the eigenvalue will be in a decreasing way
In the sixth stage, for every eigenvector, the cumulative variance is computed as
This forms the following vector,
In the seventh step, threshold T is assumed and
At last, the highly important principal component is output
3.4 Darknet Convolutional Neural Network (DNetCNN)
In the current research, the artificial neural networks and the deep learning play a vital role in classification and regression [23,24]. Among the different deep learning models, the convolutional neural network had been proven to be the best classifier. Classical CNN had categorised the image objects as useful but noted lack of noise in the images. If the quality of the image was low, the classification by CNN got affected. In the proposed work, the DNetCNN [25] structure was added as the first layer of CNN in order to improve the classification accuracy of Parkinson’s disease prediction. Darknet-19 is the deep learning classifier model that is used to detect the real-time objects based on the detection system called YOLO (You only look once) [25]. Darknet structure consists of 19 convolutional layers and five pooling layers which are activated by the activation function. For binary classification, the sigmoid activation function is used. For multi-classification, the Softmax activation function is used. For the input image (if it is grey means 2D representation is used; else 3D representation used) X and kernel K, the 2D convolutional operation is performed using Eq. (13)
K- input matrix with the step parameter. In the proposed DNetCNN, the sigmoid function is used as an activation function since the testing dataset Parkinson’s disease is a binary classification using Eq. (14).
The input image from the dark convolution layer to the pooling layer then to the classification layer is shown in Fig. 4.
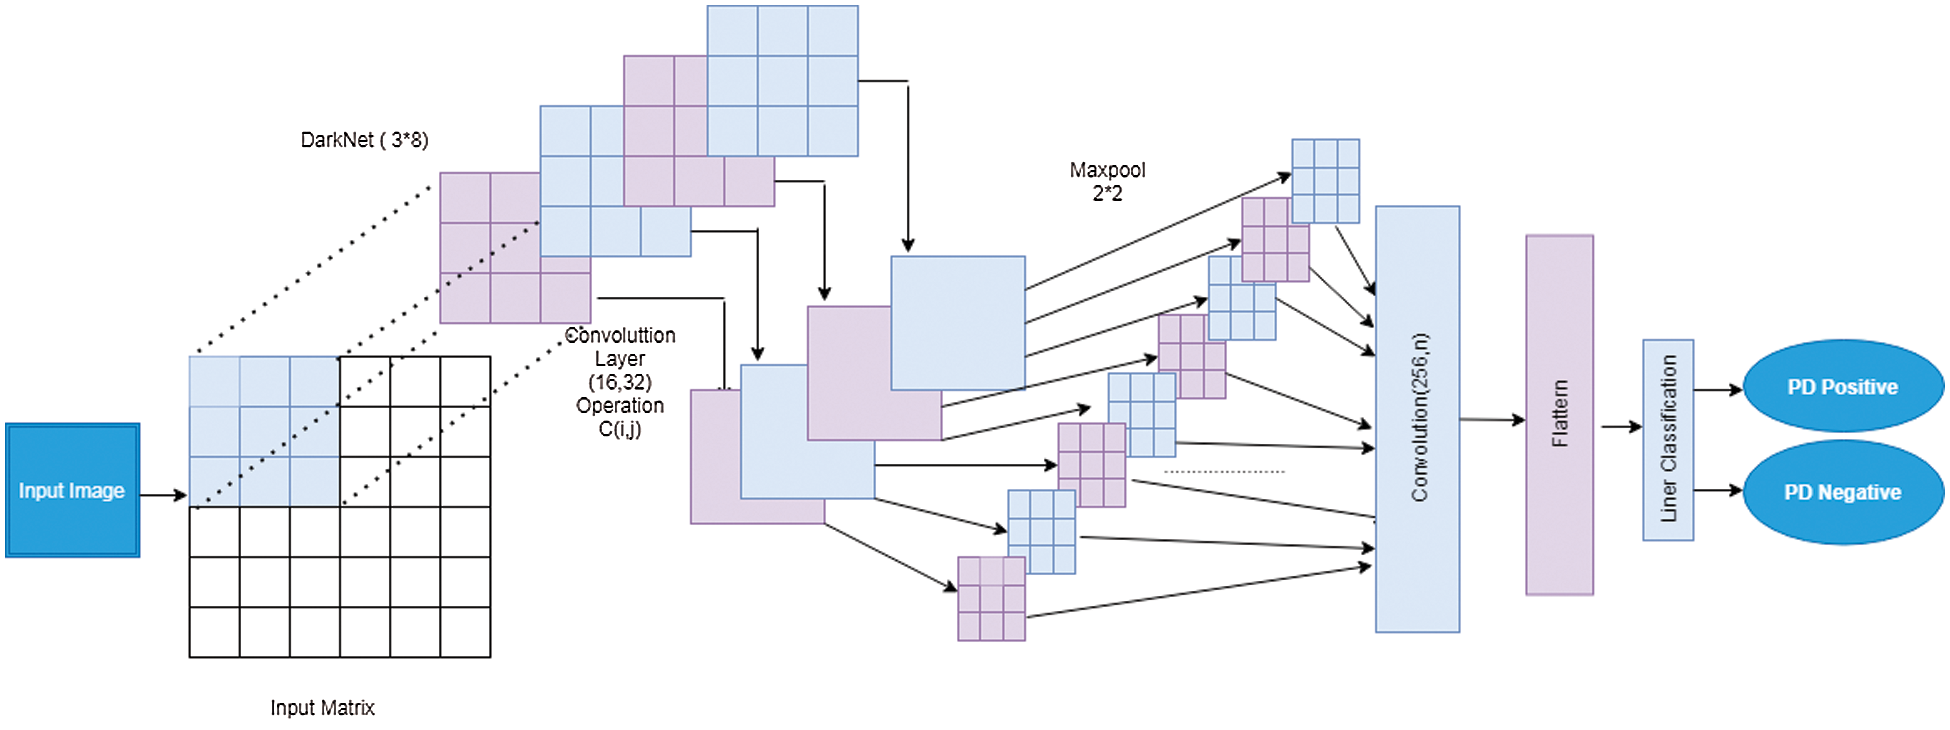
Figure 4: Structure of proposed DNetCNN
The proposed DNetCNN had 16 convolution layers. Each darknet layer had one convolutional layer with the convolution and activation operations. Each of the four convolution layers had the same follow up of three successive forms. The normal operation on the convolution layer was responsible for standardizing the input image, leading to reducing the training time. The activation function will prevent the neuron from dying. In the pooling layer, the Maxpool operation was performed based on 2*2. It will maximize the region which were used by the filters. The size of the filter varied from the darknet to the convolution layer in the range of 8,16,32 and 64. The layered structure of the proposed DNetCNN is shown in Fig. 5. The darknet layer with the filter of 3*8 was the first layer. Then the next consecutive layers were DN, pool and CNN. The last convolution layer had a filter value of 256. The DNetCNN had been used to predict the binary classification of the proposed experiment called Parkinson’s disease as PD positive or PD negative.
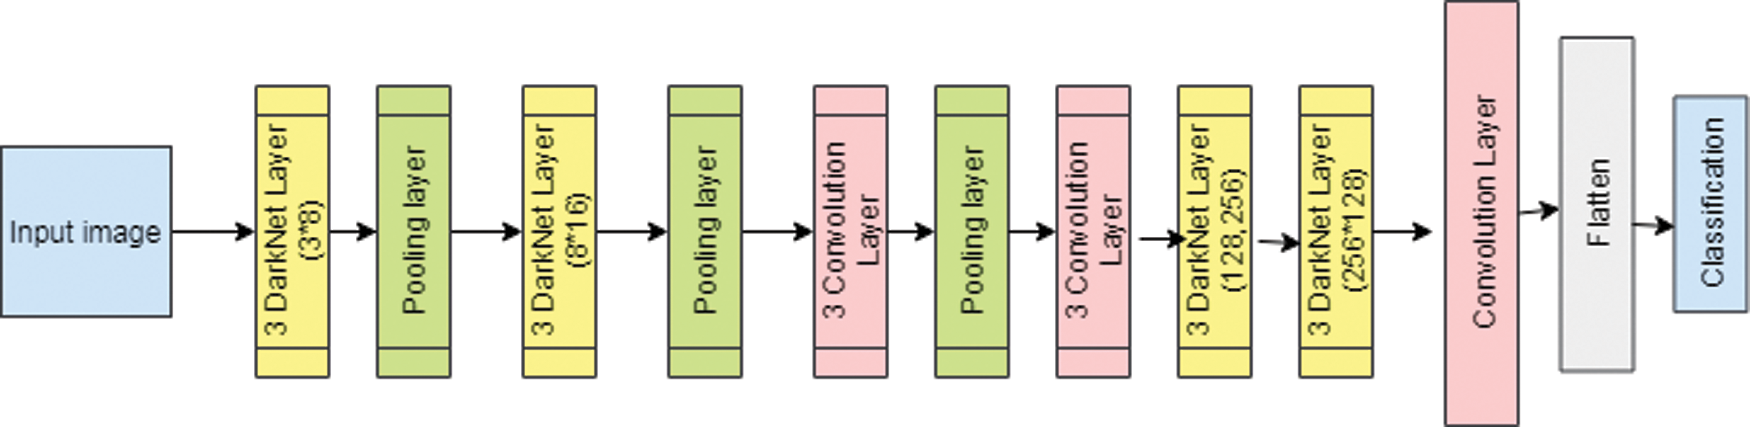
Figure 5: Layered structure of proposed DNetCNN
For the experimental analysis, the dataset from Parkinson’s Progression Markers Initiative (PPMI) had been taken. The data set was already described in section 3. For all the classification problems, the performance metrics such as accuracy, sensitivity, specificity, F-1 score and precision were calculated so as to prove the accuracy of classification using the following Equations.
The evaluated results on various folds are shown in Tab. 1. The training and the testing samples with 5-fold validation were performed and the results were analyzed based on the performance metrics. As a whole, the average of these five-folds was considered. The proposed work had obtained the classification accuracy of 97.5% as average. The illustration is shown in Fig. 6.

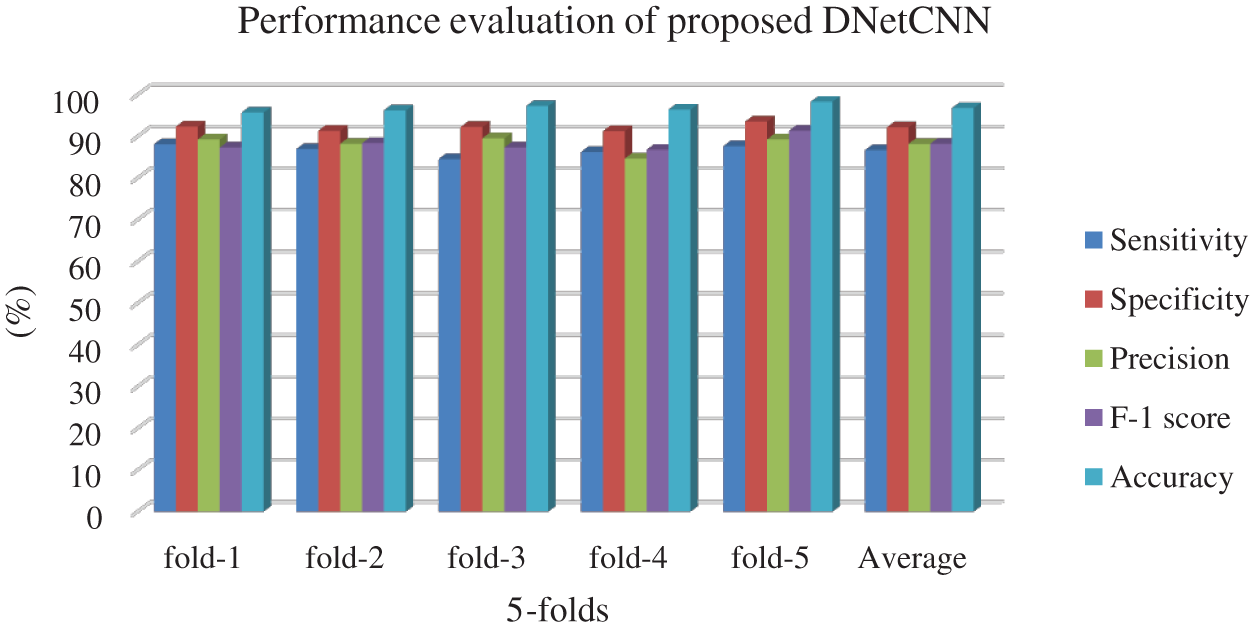
Figure 6: Performance of proposed work
In order to prove the efficiency of the proposed work, the algorithm with the existing algorithms such as LeNet based [26], AlexNet based [26], and AlexNet + Transfer learning were compared [27].
Tab. 2. shows the performance of different classification algorithm compared to the proposed algorithm. The metrics result had proven that the proposed DNetCNN obtained high-level accuracy of 97.54% than the other existing algorithms. The prediction result of PD with non-PD was high in accuracy in the proposed work. The visual comparison is shown in Fig. 7.

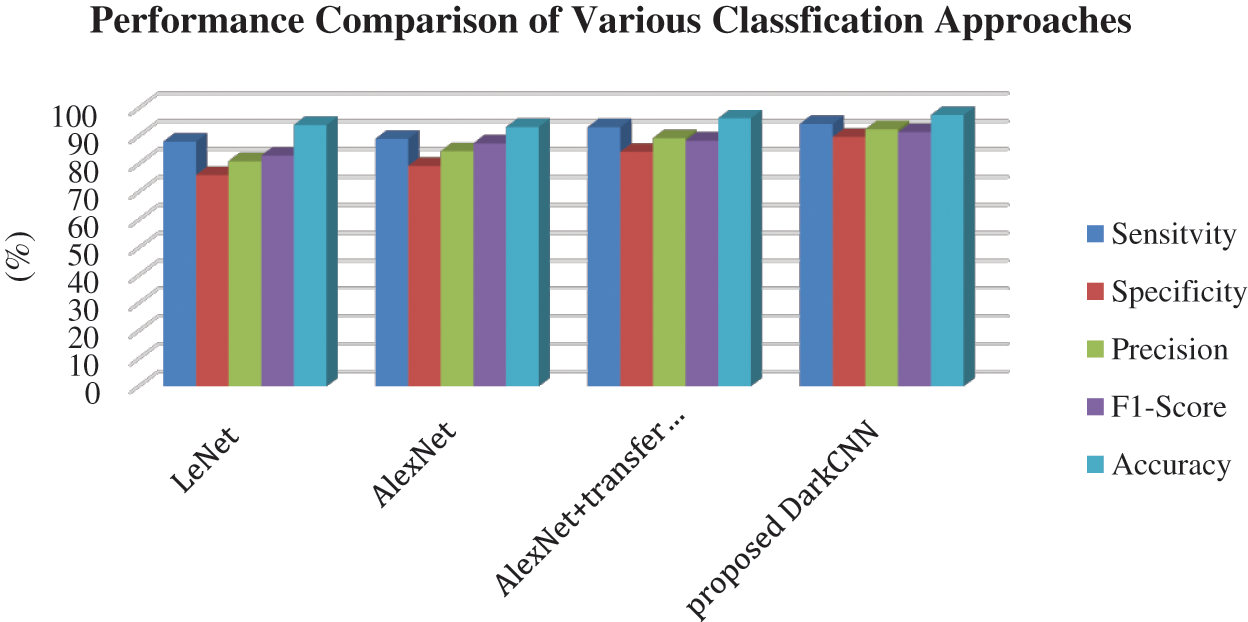
Figure 7: Efficiency of proposed dark CNN on PD prediction
Hence, the proposed approaches such as Multiple Feature Evaluation Approach (MFEA) for feature evaluation, PCA for feature extraction, and the proposed Dark Convolutional Neural Network for classification approaches in segregating the Parkinson’s disease patient from the normal control people with an accuracy of 97.54%.
In this research, a new classification model is proposed by embedding Darknet 19 with CNN for efficient image classification. Parkinson’s is very difficult to detect in its early stage. There are various ranking algorithms and feature evaluation algorithms in MFEA and it is used for weighting the feature worthiness, and the best feature set is selected accordingly. To increase the accuracy of the classifier, the principal component analysis is used for selecting the features. At last, for detecting PD, over these features, a Darknet Convolutional Neural Network (DNetCNN) is trained by the dataset. Concerning the accuracy, better results are achieved with 97.5% in the fivefold cross validation. In the proposed model, more feature selection models and the classifiers are eliminated and the deep learning model is used for minimizing the time consumption. However, high computational complexity is produced by deep learning with improvement techniques. Therefore, it is suggested that, ASPP-UNET model can be used for PD prediction in the future.
Funding Statement: The authors received no specific funding for this study.
Conflicts of Interest: The authors declare that they have no conflicts of interest to report regarding the present study.
1. E. Bullmore and O. Sporns, “Complex brain networks: Graph theoretical analysis of structural and functional systems,” Nature Reviews Neuroscience, vol. 10, no. 3, pp. 186–198, 2009. [Google Scholar]
2. O. Sporns, G. Tononi and R. Kötter, “The human connectome: A structural description of the human brain,” PLOS Computational Biology, vol. 1, no. 4, pp. e42, 2005. [Google Scholar]
3. M. P. van den Heuvel, C. J. Stam, M. Boersma and H. H. Pol, “Small-world and scale-free organization of voxel-based resting-state functional connectivity in the human brain,” NeuroImage, vol. 43, no. 3, pp. 528–539, 2008. [Google Scholar]
4. L. Yong, M. Liang, Y. Zhou, Y. He, Y. Hao et al., “Disrupted small-world networks in schizophrenia,” Brain, vol. 131, no. 4, pp. 945–961, 2008. [Google Scholar]
5. B. Karan, S. S. Sahu and K. Mahto, “Parkinson disease prediction using intrinsic mode function based features from speech signal,” Biocybernetics and Biomedical Engineering, vol. 40, no. 1, pp. 249–264, 2020. [Google Scholar]
6. S. A. Mostafa, A. Mustapha, M. Abed Mohammed, R. Ibraheem Hamed, N. Arunkumar et al., “Examining multiple feature evaluation and classification methods for improving the diagnosis of Parkinson’s disease,” Cognitive Systems Research, vol. 54, no. 1, pp. 90–99, 2019. [Google Scholar]
7. B. M. Bot, C. Suver, E. Chaibub, M. Kellen, A. Klein et al., “The mPower study, Parkinson disease mobile data collected using ResearchKit,” Scientific Data, vol. 3, no. 1, pp. 16006, 2016. [Google Scholar]
8. A. E. Bouwmans, A. M. Vlaar, W. H. Mess, A. Kessels and W. E. Weber, “Specificity and sensitivity of transcranial sonography of the substantia nigra in the diagnosis of Parkinson’s disease: Prospective cohort study in 196 patients,” BMJ Open, vol. 3, no. 4, pp. e002613, 2013. [Google Scholar]
9. M. R. Sadek, A. Salah, A. Mohammed, K. Abdul Rahman, H. Abdul Karim et al., “Parkinson’s disease prediction using artificial neural network,” Int. Journal of Academic Health and Medical Research, vol. 3, no. 1, pp. 1–8, 2019. [Google Scholar]
10. J. Albert, A. Joaquin, L. Marsili, E. Anthony, L. David et al., “Revisiting protein aggregation as pathogenic in sporadic Parkinson and Alzheimer diseases,” Neurology, vol. 92, no. 7, pp. 329–337, 2019. [Google Scholar]
11. K. Seppi, K. R. Chaudhuri, M. Coelho, S. H. Fox, R. Katzenschlager et al., “Update on treatments for nonmotor symptoms of parkinson’s disease—An evidence-based medicine review,” Movement Disorders, vol. 34, no. 2, pp. 180–198, 2019. [Google Scholar]
12. C. G. Hanbo Sun, T. Wang, M. Tang, N. I. Bohnen, L. T. M. Muller et al., “Model-based and model-free machine learning techniques for diagnostic prediction and classification of clinical outcomes in Parkinson’s disease,” Scientific Reports, vol. 8, no. 1, pp. 1–21, 2018. [Google Scholar]
13. E. Rastegari, S. Azizian and H. Ali, “Machine learning and similarity network approaches to support automatic classification of parkinson’s diseases using accelerometer-based gait analysis,” in Proc. ICSS, Honolulu, United States, 2019. [Google Scholar]
14. H. Choi, S. Ha, H. J. Im, S. H. Paek and D. S. Lee, “Refining diagnosis of Parkinson’s disease with deep learning-based interpretation of dopamine transporter imaging,” NeuroImage: Clinical, vol. 16, pp. 586–594, 2017. [Google Scholar]
15. E. Abdulhay, N. Arunkumar, K. Narasimhan, E. Vellaiappan and V. Venkatraman, “Gait and tremor investigation using machine learning techniques for the diagnosis of Parkinson disease,” Future Generation Computer Systems, vol. 83, no. 6, pp. 366–373, 2018. [Google Scholar]
16. C. R. Pereira, S. A. Weber, C. Hook, G. H. Rosa and J. P. Papa, “Deep learning-aided Parkinson’s disease diagnosis from handwritten dynamics,” in Proc. SIBGRAPI, Sao Paulo, Brazil, pp. 340–346, 2016. [Google Scholar]
17. K. J. Kubota, J. A. Chen and M. A. Little, “Machine learning for large-scale wearable sensor data in Parkinson’s disease: Concepts, promises, pitfalls, and futures,” Movement Disorders, vol. 31, no. 9, pp. 1314–1326, 2016. [Google Scholar]
18. J. Camps, A. Sama, M. Martin, D. Rodriguez, C. Perez Lopez et al., “Deep learning for freezing of gait detection in Parkinson’s disease patients in their homes using a waist-worn inertial measurement unit,” Knowledge-Based Systems, vol. 139, no. 2, pp. 119–131, 2018. [Google Scholar]
19. T. Yu, X. Wang and A. Shami, “Recursive principal component analysis-based data outlier detection and sensor data aggregation in IoT systems,” IEEE Internet of Things Journal, vol. 4, no. 6, pp. 2207–2216, 2017. [Google Scholar]
20. J. Zhang and G. Y. Tian, “UHF RFID tag antenna-based sensing for corrosion detection & characterization using principal component analysis,” IEEE Transactions on Antennas and Propagation, vol. 64, no. 10, pp. 4405–4414, 2016. [Google Scholar]
21. X. Shi, F. Nie, Z. Lai and Z. Guo, “Robust principal component analysis via optimal mean by joint l2, 1 and Schatten p-norms minimization,” Neurocomputing, vol. 283, no. 10, pp. 205–213, 2018. [Google Scholar]
22. S. X. Wu, H. T. Wai, L. Li and A. Scaglione, “A review of distributed algorithms for principal component analysis,” Proceedings of the IEEE, vol. 106, no. 8, pp. 1321–1340, 2018. [Google Scholar]
23. S. Maheswaran, B. Vivek, P. Sivaranjani, S. Sathesh and K. Pon Vignesh, “Development of machine learning based grain classification and sorting with machine vision approach for eco-friendly environment,” Journal of Green Engineering, vol. 10, no. 3, pp. 526–543, 2020. [Google Scholar]
24. S. Sathesh and S. Maheswaran, “Agricultural harvest with incarcerate image using single board computer,” Int. Journal of Advanced Research Trends in Engineering and Technology (IJARTET), vol. 2, pp. 11–15. [Google Scholar]
25. J. Redmon and A. Farhadi, “YOLO9000: Better, faster, stronger,” in Proc. CVPR, Honolulu, HI, USA, pp. 7263–7271, 2017. [Google Scholar]
26. A. Ortiz, J. Munilla, M. MartínezIbañez, J. M. Górriz, J. Ramírez et al., “Parkinson’s disease detection using isosurfaces-based features and convolutional neural networks,” Frontiers in Neuroinformatics, vol. 13, pp. 831, 2019. [Google Scholar]
27. S. Sivaranjini and C. Sujatha, “Deep learning based diagnosis of Parkinson’s disease using convolutional neural network,” Multimedia Tools and Applications, vol. 79, no. 21-22, pp. 15467–15479, 2020. [Google Scholar]
 | This work is licensed under a Creative Commons Attribution 4.0 International License, which permits unrestricted use, distribution, and reproduction in any medium, provided the original work is properly cited. |