DOI:10.32604/csse.2022.021431
| Computer Systems Science & Engineering DOI:10.32604/csse.2022.021431 | |
| Article |
Pattern Analysis and Regressive Linear Measure for Botnet Detection
1Department of Computer Science and Engineering, Sathyabama Institute of Science and Technology, Chennai, India
2Department of Computer Science and Engineering, Easwari Engineering College, Chennai, India
3Department of Computer Science and Engineering, United Institute of Technology, Coimbatore, India
*Corresponding Author: B. Padmavathi. Email: bpadma_cse@yahoo.com
Received: 02 July 2021; Accepted: 15 September 2021
Abstract: Capturing the distributed platform with remotely controlled compromised machines using botnet is extensively analyzed by various researchers. However, certain limitations need to be addressed efficiently. The provisioning of detection mechanism with learning approaches provides a better solution more broadly by saluting multi-objective constraints. The bots’ patterns or features over the network have to be analyzed in both linear and non-linear manner. The linear and non-linear features are composed of high-level and low-level features. The collected features are maintained over the Bag of Features (BoF) where the most influencing features are collected and provided into the classifier model. Here, the linearity and non-linearity of the threat are evaluated with Support Vector Machine (SVM). Next, with the collected BoF, the redundant features are eliminated as it triggers overhead towards the predictor model. Finally, a novel Incoming data Redundancy Elimination-based learning model (RedE-L) is built to classify the network features to provide robustness towards BotNets detection. The simulation is carried out in MATLAB environment, and the evaluation of proposed RedE-L model is performed with various online accessible network traffic dataset (benchmark dataset). The proposed model intends to show better trade-off compared to the existing approaches like conventional SVM, C4.5, RepTree and so on. Here, various metrics like Accuracy, detection rate, Mathews Correlation Coefficient (MCC), and some other statistical analysis are performed to show the proposed RedE-L model's reliability. The F1-measure is 99.98%, precision is 99.93%, Accuracy is 99.84%, TPR is 99.92%, TNR is 99.94%, FNR is 0.06 and FPR is 0.06 respectively.
Keywords: BotNet; threat; intrusion features; linearity and non-linearity; redundancy; regressive linear measure; classification; redundancy elimination-based learning model
The systems that are compromised over the network are termed as botnets or zombies. Botnets are attack platform in distributive nature [1]. The characteristics of botnet are to generate spam and distribute it among the networks and launches Distributed Denial of Service (DDoS) to perform fraudulent activities. The existence of botnet over the network lifecycle relies on the utilization and establishment of controlling and commanding channel among the zombies and botmasters [2]. The target of this research is to provide an efficient approach to identify the patterns (features) of malicious data to solve the multi-objective problem structured over the Peer-to-Peer network environment [3]. Most of the researchers, concentrates on designing the better commanding and controlling topology of centralized form for botnet. The topological model is provided by two or more servers [4]. It works as a terminating point of the channel while a botnet is identified. But, the major challenge with this topological model is the P2P framework which makes the termination process to be more complex [5]. These P2P topologies are either structured or unstructured. The former model adopts hash table-based distributed routing; while the latter model uses gossip, flooding, and random walks protocol for routing purpose [6]. The structured routing model is more feasible towards the attackers to launch the attack activities and coordinated further attack process. It makes the eavesdroppers to deal with all the malicious malware instances over diverse localities and triggers the functionality to deal with the typical churn-related with the host [7]. It cases on and off state of the model. Some of the examples of these kinds of attacks are: storm, TDL-4, and conficker. The botnets infects about 4.6 millions of host all over the world [8].
Recently, botnet detection is considered as the most active state of research. Some prevailing approaches of botnet detection are done with statistical feature computation with packet and traffic flow; whereas in some cases protective packet inspection is performed [9]. These approaches require comparison of traffic flow with other models for the isolation of C2 traffic. Therefore, it reduces the efficiency of attack propagation [10]. It is considered as the most efficient way when compared to flow clustering model as it eliminates the requirement of cross-layer flows among the dataset. The graph model shows three essential advantages: 1) it facilitates collection efficiency where the communication graph holds G(V, E) with edges and vertices as flows and hosts respectively [11]. It is parsed in a linear manner from the source to the destination address with Internet protocol header. With the upholding strength of the network, traffic data compression-based representation consumes lesser amount of storage and computational resources in association with other models. 2) Faster detection approaches are modelled for handing the relative compression. 3) It is the most significant method, i.e., graph analysis which leverages the fundamental properties of P2P botnet structure [12]. The controlling and commanding mechanism is robust towards node to maintain the network functionality. It requires higher internet connectivity among the P2P nodes. Some other features associated with P2P sub-graphs are assortative in nature. The nodes possess better degree for connectivity to establish connection among the networks. This property builds the robust way to fight against botnet [13]. The sharpness towards the node activity (benign) does not show assortativity with higher connectivity. The C2 mechanism over the P2P network model provides distinguishable topological characteristics during graph-based communication. Author in [14] proposes an idea with botgrep where the graph is constructed for providing network traffic and adopts the topological botnet command properties and C2-based communication to segregate the connectivity from the benign traffic. It adopts spatial relationship among the communication graph to a finest level in contrary to other graph based detection approach. It relies on fast-mixing P2P structural nature of sub-graphs which is relative to benign traffic [15]. This method is examined over the synthetic topologies imposed on graph construction from network traces and provides superior accuracy over testing datasets. A botnet is a collection of internet-connected devices infected by malware that allow hackers to control them. Cyber criminals use botnets to instigate botnet attacks, which include malicious activities such as credentials leaks, unauthorized access, data theft and DDoS attacks.
However, these approaches do not discuss the network patterns in linear and non-linear manner. The network patterns are composed of higher level and lower level features; in some cases the high level features are the most influencing features that trigger the attack activities over the network. The lower level features are not so severe and it does not influence the network communication. The linearity and non-linearity of the data patterns are analyzed efficiently by Support Vector Machine (SVM). The data patterns are validated by SVM and maintained over the bag of features (BoF). This process reduces the redundancy of data patterns to handle the computational overhead in an efficient manner. The process of redundancy elimination is carried out by Redundancy Elimination-based learning model (RedE-L) to categorize the features for predicting botnet. The theoretical complexity is reduced with the adoption of this model and maintains the prediction accuracy. The proposed model is evaluated and compared with benchmark dataset to show the efficiency of the model. The comparison is done with conventional SVM, C4.5, RepTree and so on, where the metrics like MCC, accuracy, detection rate are computed to show the model reliability. The major research challenge is the prediction of botnet dataset (benchmark dataset) and the analysis of botnet features.
The work is further organized as follows: Section 2 depicts the extensive review towards the background studies on botnet detection; Section 3 discusses the proposed methodology and the functionality of the model; Section 4 is numerical results and discussion of the proposed model; Section 5 is conclusion and future research directions.
The significance of predicting bot over the network is extensively reviewed using conventional approaches. Here, the relationship among the host towards the bot and the consequences are analyzed. Saad et al. [16] target at predicting the coordination and injection that happens during malware infection. Zhao et al. [17] discusses the similar approach termed as botnet sniffer for predicting the C2 channels which is required for the botnet prediction. Thus, it adopts similarity property and spatio-temporal correlation for predicting botnet. C2 server establishes the contact with every bot and analyzes the botnet functionality using the commanding process. These behaviours are constantly analyzed for identifying the C2 channel. Botnet sniffer and hunter carries out the evaluation process over the honeynet by executing the malware binaries. These traces are not publicly available and lack of appropriate algorithmic model is due to botnet public dataset. Therefore, the author anticipates a labelled dataset that includes background, normal and botnet traffic. Nagaraja et al. [18] discusses some learning approaches like k-NN, SVM, ANN, clustering, and DT which falls under the sub-categories like unsupervised, supervised, and hybrid approaches. The first approach learns the normal and abnormal characteristics of the attack. Hang et al. [19] provides an unsupervised model for predicting the unknown and known anomalies of IoT with auto-encoder and dissimilar graph model. Ding et al. [20] discuss the supervised approach that learns from the labelled data which includes normal and attack-traffic. There are diverse approaches like rule-based classifier, SVM, and ensemble learning model. With the finest generalization functionality, SVM is adopted for various security-based applications. Jai Kumar et al. [21] discusses the hybrid approach that provides huge benefits with lesser labelled traffic which is used for learning purpose. Some other methods are also adopted for botnet detection. It uses diverse entropy measures. For example, author in [22] anticipates a novel approach for predicting the anomalies from large-scale environment to predict network traffic by evaluating the deviation identified among the incoming flow records and normal traffic profiles. Chowdhury et al. [23] discusses the general botnet detection behaviour using Markov chain to examine the C2 channel states. This model is evaluated and trained with CTU-13 dataset and provides 93% F-measure value and 0.06% FPR. The author [24] concentrated on predicting the infected machine over the enterprise level by analysing the DNS activity of host over every one hour. Here, set of features are used for evaluating the network traffic (DNS) and the outcomes predicts the suspicious DNS connection for predicting the infected machine. Moreover, flow-based approaches determine some communication patterns among the hosts and predict the infected DNS connection. Thus, the host and flow process may occur with higher computational overhead.
Garcia et al. [25] discuss the graph-based model to establish the relationship among the host network. Various situations are analyzed for predicting the P2P botnets and to evaluate the DNS traffic from those malicious regions. Chen et al. [26] projects the difference among various traffic types and analyses the flow among 1) UDP/TCP port destination number 2) 11 different port number adopted by TCP and UDP and 3) ICMP flow. Here, the derived/plain features are used to train the unsupervised learning process over the normal traffic with essential features. As an outcome, the proposed k-NN model attains 99% detection accuracy and 6% FPR respectively. Latif et al. [27] discuss the unsupervised graph model for predicting the abnormal communication patterns and labelling of botnets. The graph sequences are constructed over the port of source/destination address and evaluate the graph edit distance among the graph. This model shows better prediction accuracy of 95%. But, the drawback is their costly natures for evaluating the graph edit distance for all pairs of graph. This computation process is known as NP-complete. Bhatia et al. [28] discusses the network communication model using graph where the edges and hosts communication is established with its host vertices. The graph-based features are analysed with the centralized measure and in/out degree. It also adopts hybridized method and evaluates various learning approaches to attain better detection rate. It possesses higher computational overhead with larger communication graph, for instance, shortest path algorithm for centralized measure. The outcomes of graph-based detection approach are more promising with higher complexity, and NP-complete.
Some statistical features of packets and the flow are analyzed for detecting C2 channels by author et al. [28]. Some of the solutions are provided over certain communication protocols like IRC. The author discusses the protocol-independent solutions to project the bot characteristics by communication patterns and malicious activities. It is a simple concept as botnet provides randomized communication and topological patterns with the sensing of newer attacks like Mirai. Hence, it is proved that non-protocol specific model is less vulnerable for bot detection. The major drawback with the existing research is the lack of pattern analysis and complexity in predicting the spatial location of botnet over the network.
This research work concentrates on providing an efficient approach to analyse the incoming data patterns over the distributed environment. The data patterns are either linear or non-linear, that support vector machine with regression analysis. The redundancy elimination is performed to eliminate the unnecessary features that leads to over-fitting and improves generalization.
It is a botnet traffic dataset acquired from CTU University, in 2011. The target of this dataset captures the real botnet traffic from the background and normal traffic. It is composed of 13 captures (scenarios) of various botnet samples. Over these scenarios, certain malware is executed with several protocols and actions. Each scenario is captured in pcap file which is composed of packets and of three different traffics. These files are processed to attain the information type known as weblogs, NetFlows and so on. The uni-directional netflows specifies the traffic and assigns the label. The bi-directional NetFlow is composed of various advantages. It shows the malware used to capture the number of infected computers over these scenarios. Fig. 1 shows the block diagram of the proposed model.

Figure 1: Block diagram of proposed model
The data collected from the online source needs to be normalized before performing the training and testing process. The linear transformation (host resource utilization) is expressed as in Eq. (1):
From Eq. (1),
3.3 Support Vector Machine (SVM)
SVM is an efficient classification approach that gains huge popularity which is mainly considered during the classification problem. However, the analysis with the huge dataset includes both linear and non-linear data (dependent and independent variables). Therefore, these kind of data needs to be analyzed for identifying the data patterns that triggers the attack activities over the network. The regression analysis is adopted over this model to measure the linearity of the data. The function is expressed as f(x) which is mathematically computed with training dataset. The dataset form the combination of input and output vectors (xi, yi) for the construction of training points. The input vectors xi is formed with finite sequential measurements where the output vectors are composed of n(n + 1) network traffic observations where ‘n’ specifies the observation towards the host-based resource utilization. The values are partitioned as x1, x2, …, xi into training and testing outputs. The provided training data with ‘X’ data points {xi, yi}, i = 1, 2, …, N with input data xi ∈ X ⊂ Rn and output data yi ∈ X ⊂ R. With regression analysis, the linear and non-linear data functionality is expressed as in Eq. (2):
Here, ‘x’ is input sample space towards multi-dimensional feature space (non-linear function
Here, Er is empirical risk analysis. The data pattern prediction functionality relies on hyper-parameters like ‘C’ and ‘ɛ’ respectively. Here, ‘C’ is provided to manage the training error and model complexity, ‘ɛ’ is to measure the prediction accuracy with optimal functionality. The kernel functionality is adopted for mapping the incoming data. However, the parameter functions are processed based on kernel type. The slack variables are included for optimizing the incoming data, expressed as in Eq. (4):
Here, slack variables
3.4 Regressive Linearity Measure
The linear regression is used to provide the assignment of provided class labels to all samples ′x′ based on the class label score. When x2 is a sample matrix with ith row in correspondence to sample xi which is composed of weighted patterns from SVM which is augmented as xi = [1 si1si2…sic]T. When θ1 is coefficient matrix with similar regression model the features (data patterns) are expressed as in Eq. (5):
Here, ′Y′ is class label matrix; θ1 is regression coefficient matrix; λ is a regularization term used for eliminating over-fitting issues. The optimal θ1 is expressed as in Eq. (6):
For any sort of unknown samples ′x′ is an augmented score vector, the output of all labels are computed using Eq. (7):
where

Figure 2: Support vectors and margins of feature (data pattern) analysis

Figure 3: Mapping high dimensional data
3.5 Regressive Non-Linearity Measure
The attributes of the dataset are translated to real-number as this model is considered as numerical data. The kernel function selection is performed for the manipulation of regression problem. The kernel parameters generate diverse outcomes like accuracy and prediction performance. The kernel functionality is used to map the originality of the data (linearity and non-linearity of the data) towards the higher dimensional space which is transformed to linear data. There are four diverse kernel functions such as Radial Bias Function (RBF), Linear function, Polynomial function, and sigmoid function. This work considers only the linear functionality which is expressed as in Eq. (8):
The linear function is considered as a special case which is determined to be an optimal parameter adjustment during computation process. However, non-linearity is measured using Kernel Principal Component Analysis. Here, the original linear PCA is transformed to non-linear data distributions. While adopting kernel PCA, the input data is non-linearly mapped towards high-dimensional feature space. The mapping function is expressed as in Eq. (9):
The mapping function
It is explicitly impossible to analyse the feature space as the mapping function is unknown (See Fig. 3). The kernel tricks are utilized over the kernel matrix. The samples are mapped over the feature space as in Eq. (11):
Here, the centralized version of mapped samples
The mapping data is unknown and cannot be computed explicitly. Moreover, the data is projected directly using the kernel trick. The data is mapped to attain the features (data patterns). The kernel among the mapped training sample and the mapped data (incoming new data (
Generally, lower level features are features with less information while the higher-level features hold some semantic information. It helps the researchers to have extensive insight towards the feature selection process.
Here, Linear/Non-linear Support Vector Machine (SVM) classifiers learn a model for predicting the image class from BoF based on kernels representation [29], [30]. It includes histogram intersection kernel, generalized Gaussian kernel and Euclidean distance which are expressed below.

3.7 Redundancy Elimination-Based Learning Model (Rede-L)
The redundancy elimination-based learning model (RedE-L) is for eliminating the redundancy identified during feature (data pattern) analysis. It is performed both in linear and non-linear way, to reduce the computational overhead identified during the tracing of botnet. The flow diagram of proposed model is shown in Fig. 4.

Figure 4: Flow diagram of proposed model
3.7.1 RedE-L for Linear Analysis
It is a backward elimination process which is adopted for SVM (linear and non-linear data). Here, the first feature elimination performed with
It is equivalent to maximal feature elimination only by satisfying the condition given in Eq. (17). Over the SVM, the RedE-L margin is placed over the right and the margin achieved by the SVM is over the left to eliminate the features explicitly, expressed as in Eq. (17):
By adopting Eq. (17), the features eliminated with RedE-L are not equivalent to preserve the maximal margin. Generally, margin maximization is achieved by performing computation with above-mentioned model and enhances the generalization accuracy and provides significance over the margin gain.
3.7.2 RedE-L for Non-Linear Analysis
In case of non-linear kernel, the choice of Gaussian kernel is expressed as K(u, v) = exp(− β||u − v||2), β > 0. It is consistent with weighted objective for reducing the weighted square for monotonically reducing the feature dimensionality. The objective of performing this analysis is to eliminate the feature redundancy for reducing the computational complexity. The RedE-L model eliminates the feature that outcomes in smaller variations (increase or decrease). It achieves greater SVM margin and lower test set error rates.
4 Numerical Results and Discussion
This section discusses the outcomes for earlier prediction of botnet with appropriate feature analysis. Here, the simulation is carried out in MATLAB environment. The target of this work is to detect bot with better accuracy, reducing false-negative and false positive. Some features like multiple systems submit as many requests as possible to a single Internet computer or service, overloading it and preventing it from servicing legitimate requests. Tab. 1 depicts the occurrence of following features over the network. Some set of features are given below:

Fig. 5 depict the test set classification error rate and Fig. 6 depicts the number of features retained over BoF. The given input dataset is randomly partitioned into equal sized sub-samples with k-fold CV. With these k-samples, some set of samples are reserved for testing data and other k-1 sub-samples are used for training data. CV is repeated for k-times and every sub-sample is used for verification data. The average ‘k’ values are computed. The performance metrics are discussed below as in Eqs. (18)–(25):

Figure 5: Test set classification error rate

Figure 6: Number of features retained
From the above Eqs. (18)–(25), TP is number of properly classified intrusions; TN is number of correctly classified normal traffic; FN is number of incorrectly classified intrusion (attack) as normal traffic; and FP is number of incorrectly classified normal traffic as intrusion (attack).
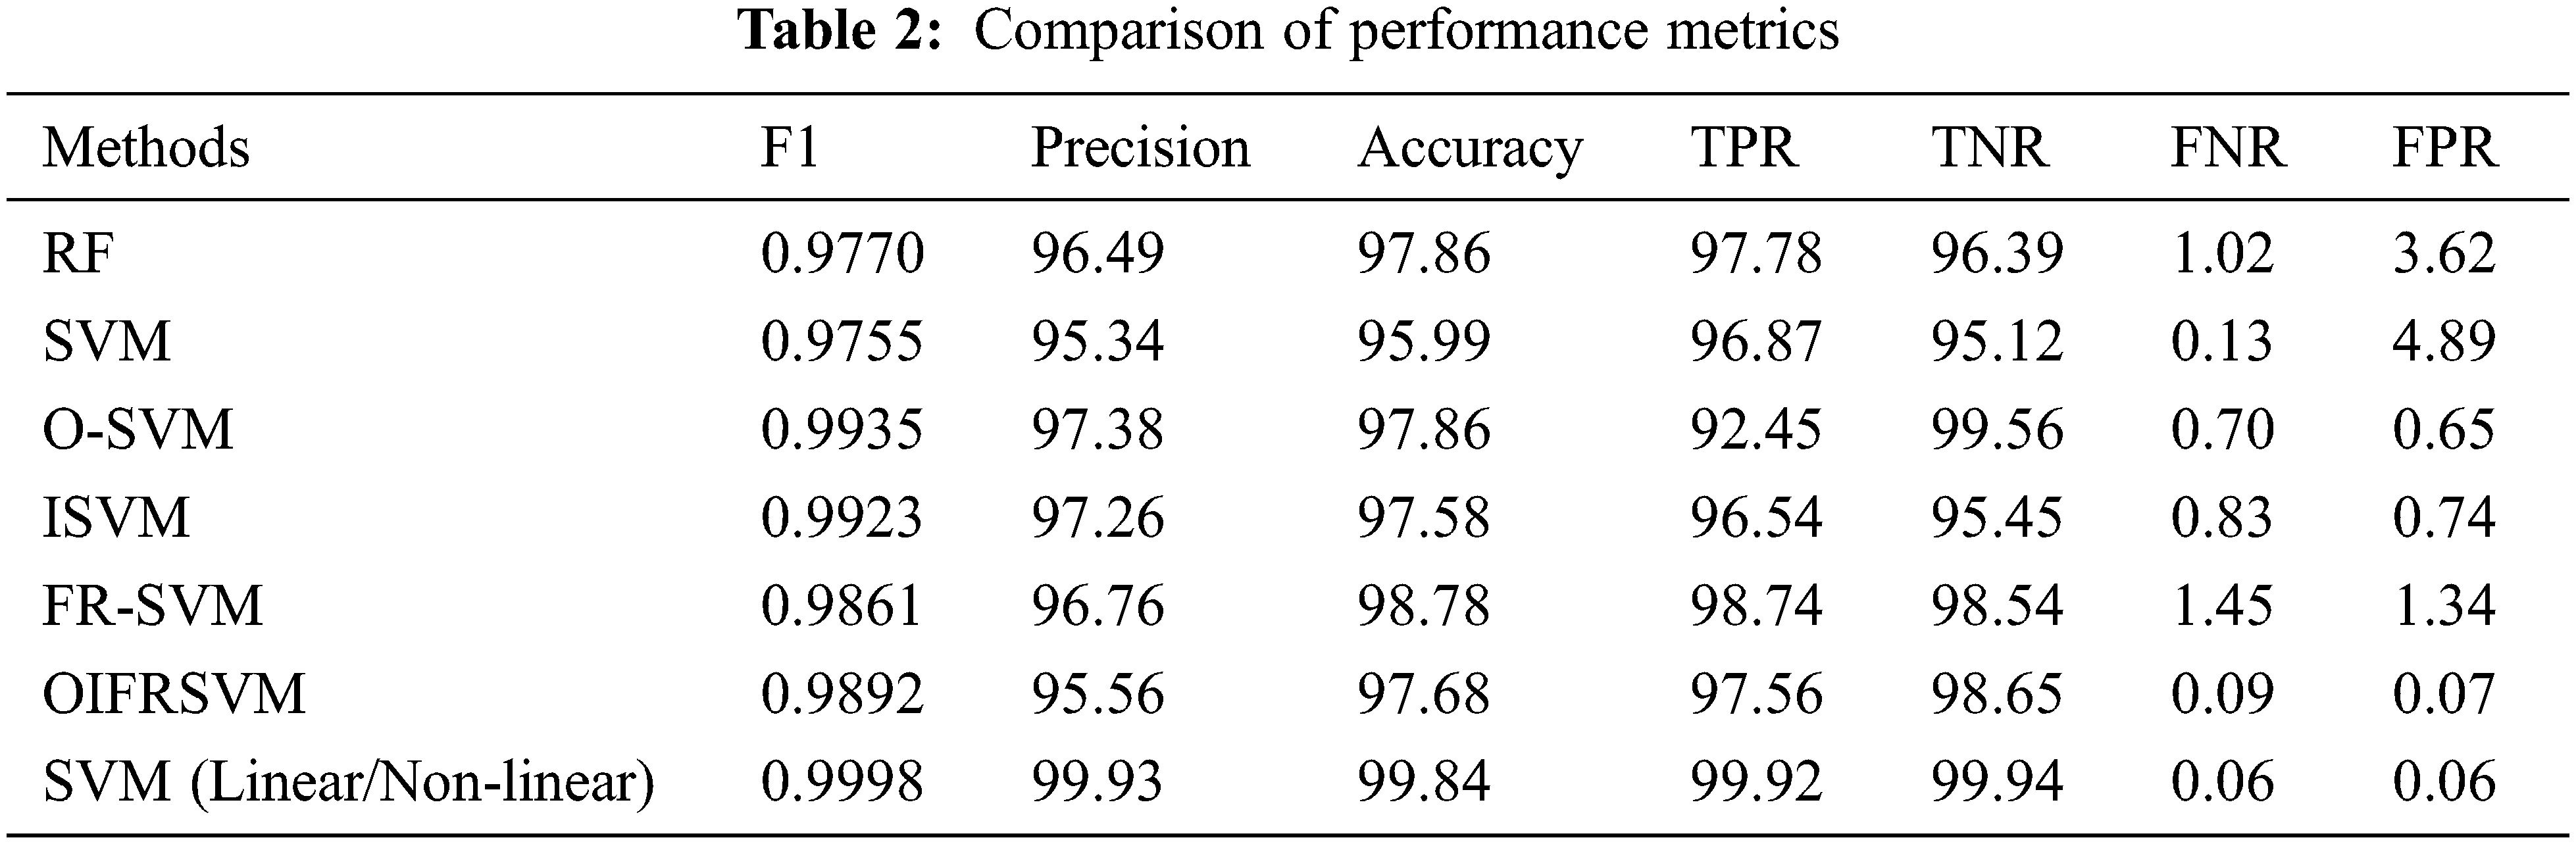
Tab. 2 depicts the comparison of performance metrics of the proposed method vs. the existing approaches. Here, RF, conventional SVM, O-SVM, ISVM, FR-SVM, OIFRSVM are compared with SVM (linear and non-linearity measure). The metrics like F1-score, precision, accuracy, TPR, TNR, FNR, and FPR are compared to show the significance of the model. The F1 score of SVM (Linear/Non-linear measures) is 0.9998 which is 0.0228, 0.0243, 0.0263, 0.0275, 0.0137, and 0.0106 higher than other approaches. The precision of proposed model is 99.93 which are 3.44%, 4.59%, 2.55%, 2.67%, 3.17%, and 4.37% higher than other models. The accuracy of the proposed SVM (linear and non-linearity measure) is 99.84% which is 1.98%, 3.85%, 1.98%, 2.26%, 2.06%, and 2.15% higher than other approaches. The TPR of the proposed mode is 99.92%, TNR is 99.94%, FNR is 0.06, and FPR is 0.06 which gives optimal outcomes when compared to other models (See Figs. 7–13).

Figure 7: Accuracy comparison

Figure 8: F-score comparison

Figure 9: TPR comparison

Figure 10: FPR comparison

Figure 11: TNR comparison

Figure 12: FNR comparison

Figure 13: Precision comparison
In Tab. 3, the proposed model is compared with existing approaches like REPTree, RTree, C4.5, DNN, SMO, and DT. The detection rate of this model is 99.56% which is better than other approaches. The FAR value is 0.00008, MCC is 0.9930, time for model construction (seconds) is 4.56, and execution time is 0.038 s (See Figs. 14–19). The efficiency and the reliability of the proposed idea are superior than other approaches and shows better trade-off in contrast to other approaches. From the graph plotted, it is known that the proposed model shows better results when compared to the existing approaches. The complexity with RepTree over high speed network environment is complex while with C4.5 the prediction process is handled only in a tree-based transformation which is time consuming. The major drawback with DNN is its response time and dependency. Similarly, SMO is also time consuming and provides false results. Finally, the drawback with DT is its unstable nature. However, the proposed model intends to deal with all these issues to attain better prediction accuracy.

Figure 14: Accuracy comparison

Figure 15: DR comparison

Figure 16: FAR comparison
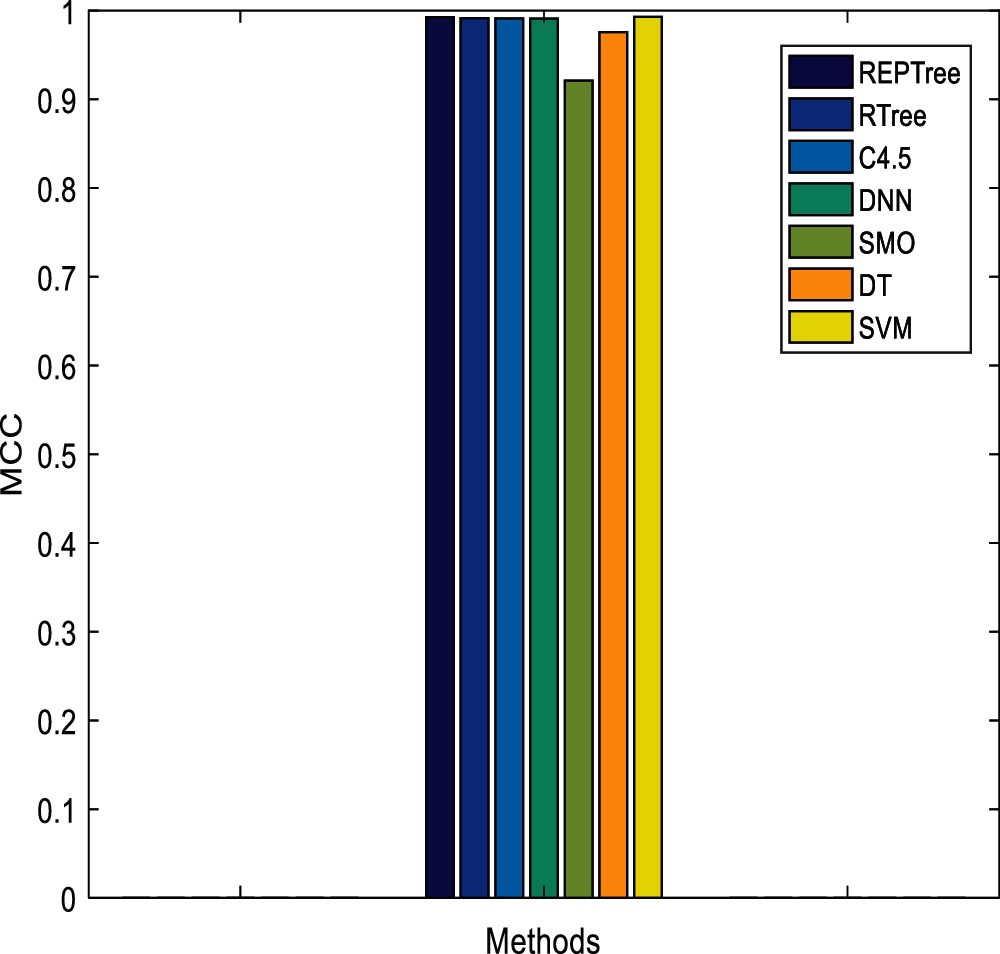
Figure 17: MCC comparison

Figure 18: Time to build the model (s)

Figure 19: Time taken (s)

In this research, a novel approach is proposed for analyzing the linearity and non-linearity of the data patterns using regression analysis to predict the bot over the distributed environment. The multi-objective constraints like detection rate, prediction accuracy, attacks features are resolved using the proposed SVM model. Here, higher-level and lower-level features are considered where the higher-level features are chosen and the lower-level features are eliminated using Redundancy Elimination-based learning model (RedE-L). The features are maintained over the feature set (bag of features). The robustness of the model is analyzed based on the prediction of traces of bot. The redundancy of the incoming patterns are measured with features (linear and non-linear manner) to reduce the over-fitting issues and gives better generalization outcomes. The experimental analysis shows that this model provides higher accuracy when compared to conventional SVM, C4.5, RepTree and so on. The detection rate of this proposed model is 0.9956 which is higher when compared to other prevailing approaches. Similarly, the FAR of the model is 0.00008 which comparatively lesser than other approaches. The time taken for the execution process is 0.038 s and the time for building the model is 4.56 s. The accuracy of the proposed model is 99.98%, MCC is 0.993 and DR is 0.9956 respectively. Based on this, the optimal features are chosen to measure the bot incidence over the distributed environment in an efficient manner. Thus, in future, better optimization approaches need to be adopted for resolving the multi-objective constraints. The major research constraint is the lack of recent benchmark dataset. The construction of recent dataset is highly solicited.
Funding Statement: The authors received no specific funding for this study.
Conflicts of Interest: The authors declare that they have no conflicts of interest to report regarding the present study.
1. R. Boutaba, M. A. Salahuddin, N. Limam, S. Ayoubi, N. Shahriar et al., “A comprehensive survey on machine learning for networking: Evolution, applications and research opportunities,” Journal of Internet Services and Applications, vol. 9, no. 1, pp. 1–99, 2020. [Google Scholar]
2. Y. Jin, N. Duffield, J. Erman, P. Heffner, S. Sen et al., “A modular machine learning system for flow-level traffic classification in large networks,” ACM Transactions of Knowledge Discovery from Data, vol. 6, no. 1, pp. 1–34, 2012. [Google Scholar]
3. S. Garcia, M. Grill, J. Stiborek and A. Zunino, “An empirical comparison of botnet detection methods,” Computers & Security, vol. 45, pp. 100–123, 2014. [Google Scholar]
4. S. Lagraa, J. Francois, A. Lahmadi, M. Miner, C. H. Schmidt et al., “BotGM: Unsupervised graph mining to detect botnets in traffic flows,” in Proc. of IEEE Int. Conf. on Cyber Security in Networking, Rio de Janeiro, Brazil, pp. 1–9, 2017. [Google Scholar]
5. A. A. Daya, M. A. Salahuddin, N. Limam and R. Boutaba, “A graph-based machine learning approach for bot detection,” in Proc. IFIP/IEEE Int. Symp. on Integrated Network Management Washington DC, USA, pp. 144–152, 2019. [Google Scholar]
6. S. Khattak, N. R. Ramay, K. R. Khan, A. A. Syed and S. A. Khayam, “A taxonomy of botnet behavior, detection, and defence,” IEEE Communication Surveys and Tutorials, vol. 16, no. 2, pp. 898–924, 2014. [Google Scholar]
7. H. R. Zeidanloo, A. B. Manaf, P. Vahdani, F. Tabatabaei and M. Zamani, “Botnet detection based on traffic monitoring,” in Proc. of Int. Conf. on Networking and Information Technology, Manila, Philippines, pp. 97–101, 2010. [Google Scholar]
8. A. Choi and H. Lee, “Identifying botnets by capturing group activities in DNS traffic,” Computer Networks, vol. 56, no. 1, pp. 20–33, 2012. [Google Scholar]
9. D. Zhao, I. Traore, B. Sayed, W. Lu, S. Saad et al., “Botnet detection based on traffic behavior analysis and flow intervals,” Computer Security, vol. 39, pp. 2–16, 2013. [Google Scholar]
10. J. François, S. Wang, W. Bronzi, R. State and T. Engel, “Botcloud: Detecting botnets using mapReduce,” in Proc. of IEEE Int. Workshop on Information Forensics and Security, Iguacu Falls, Brazil, pp. 1–6, 2011. [Google Scholar]
11. K. Henderson, B. Gallagher, T. E. Rad, H. Tong, S. Basu et al., “RoLX: Structural role extraction & mining in large graphs,” in Proc. of 18th ACM SIGKDD Conf. on Knowledge Discovery and Data Mining, Beijing, China, pp. 1231–1239, 2012. [Google Scholar]
12. P. J. Kumar and A. C. Kak, “A graph-theoretic framework for isolating botnets in a network,” Security and Communication Networks, vol. 8, no. 16, pp. 2605–2623, 2015. [Google Scholar]
13. S. Chowdhury, M. Khanzadeh, R. Akula, F. Zhang, S. Zhang et al., “Botnet detection using graph-based feature clustering,” Journal of Big Data, vol. 4, no. 1, pp. 1–14, 2017. [Google Scholar]
14. S. Ayoubi, N. Limam, M. A. Salahuddin, N. Shahriar, R. Boutaba et al., “Machine learning for cognitive network management,” IEEE Communications Magazine, vol. 56, no. 1, pp. 158–165, 2018. [Google Scholar]
15. P. Mulinka and P. Casas, “Stream-based machine learning for network security and anomaly detection,” in Proc. of Workshop on Big Data Analytics and Machine Learning for Data Communication Networks, Budapest, Hungary, pp. 1–7, 2018. [Google Scholar]
16. S. Saad, I. Traore, A. Ghorbani, B. Sayed, D. Zhao et al., “Detecting P2P botnets through network behavior analysis and machine learning,” in IEEE Conf. on Privacy, Security and Trust (PST), Montreal, QC, Canada, pp. 174–180, 2011. [Google Scholar]
17. D. Zhao, I. Traore, B. Sayed, W. Lu, S. Saad et al., “Botnet detection based on traffic behaviour analysis and flow intervals,” Computers and Security, vol. 39, pp. 2–16, 2013. [Google Scholar]
18. S. Nagaraja, P. Mittal, C. Y. Hong, M. Caesar and N. Borisov, “Botgrep: Finding p2p bots with structured graph analysis,” in Proc. of the 19th USENIX Conference on Security, Berkeley, CA, United States, vol. 10, pp. 95–110, 2010. [Google Scholar]
19. H. Hang, X. Wei, M. Faloutsos and T. E. Rad, “Entelecheia: Detecting p2p botnets in their waiting stage,” in IEEE IFIP Networking Conf., Brooklyn, New York, USA, pp. 1–9, 2013. [Google Scholar]
20. Q. Ding, N. Katenka, P. Barford, E. Kolaczyk and M. Crovella, “Intrusion as (anti) social communication: characterization and detection,” in Proc. of the 18th ACM SIGKDD Int. Conference on Knowledge Discovery and Data Mining, New York, NY, United States, pp. 886–894, 2012. [Google Scholar]
21. S. Jai Kumar and A. C. Kak, “A graph-theoretic framework for isolating botnets in a network,” Security and Communication Networks, vol. 8, no. 16, pp. 2605–2623, 2015. [Google Scholar]
22. D. Zhuang and J. M. Chang, “Enhanced peer hunter: Detecting peer-to-peer botnets through network-flow level community behaviour analysis,” IEEE Transactions on Information Forensics and Security, vol. 14, no. 6, pp. 1485–1500, 2018. [Google Scholar]
23. S. Chowdhury, M. Khanzadeh, R. Akula, F. Zhang, S. S. Zhang et al., “Botnet detection using graph-based feature clustering,” Journal of Big Data, vol. 4, no. 1, pp. 1–23, 2017. [Google Scholar]
24. A. N. Suresh, “A hybrid genetic-neuro algorithm for cloud intrusion detection system,” Journal of Computational Science and Intelligent Technologies, vol. 1, no. 2, pp. 15–25, 2020. [Google Scholar]
25. S. Garcia, V. Uhlir and M. Rehak, “Identifying and modelling botnet c&c behaviours,” in Proc. of the 1st Int. Workshop on Agents and Cyber Security, New York, NY, United States, pp. 12–18, 2014. [Google Scholar]
26. W. Chen, X. Luo and A. N. Z. Heywood, “Exploring a service-based normal behaviour profiling system for botnet detection,” in Proc. of the IFIP/IEEE Symp. on Integrated Network and Service Management (IM), Lisbon, Portugal, pp. 10–12, 2017. [Google Scholar]
27. A. A. Latif, B. A. E. Atty, W. Mazurczyk, C. Fung and S. E. V. Andraca, “Secure data encryption based on quantum walks for 5g internet of things scenario,” IEEE Transactions on Network and Service Management, vol. 17, no. 1, pp. 118–131, 2020. [Google Scholar]
28. R. Bhatia, S. Benno, J. Esteban, T. V. Lakshman and J. Grogan, “Unsupervised machine learning for network-centric anomaly detection in IoT,” in Proc. of the 3rd ACM CoNEXT Workshop on Big Data, Machine Learning and Artificial Intelligence for Data Communication Networks, New York, NY, United States, pp. 42–48, 2019. [Google Scholar]
29. R. Sathiyasheelan, “A survey on cloud computing for information storing,” Journal of Computational Science and Intelligent Technologies, vol. 1, no. 2, pp. 9–14, 2020. [Google Scholar]
30. R. Mugesh, “A survey on security risks in Internet of Things (IoT) environment,” Journal of Computational Science and Intelligent Technologies, vol. 1, no. 2, pp. 1–8, 2020. [Google Scholar]
 | This work is licensed under a Creative Commons Attribution 4.0 International License, which permits unrestricted use, distribution, and reproduction in any medium, provided the original work is properly cited. |