DOI:10.32604/csse.2022.022941
| Computer Systems Science & Engineering DOI:10.32604/csse.2022.022941 | |
| Article |
Assessing Asian Economies Renewable Energy Consumption Efficiency Using DEA with Undesirable Output
1Department of Industrial Engineering and Management, National Kaohsiung University of Science and Technology, Kaohsiung, 80778, Taiwan
2Department of Logistics and Supply Chain Management, Hong Bang International University, Ho Chi Minh, 723000, Vietnam
3Institute of Photonics Engineering, National Kaohsiung University of Science and Technology, Kaohsiung, 80778, Taiwan
*Corresponding Author: Ngoc-Ai-Thy Nguyen. Email: thy.logistics@gmail.com
Received: 23 August 2021; Accepted: 12 October 2021
Abstract: Along with vast non-fossil potential and significant expertise, there is a question of whether Asian nations are attaining efficient consumption and exploitation of renewable resources. From this perspective, the paper aims to evaluate the efficiency of 14 potential Asia countries in renewable energy consumption during the six-year periods (2014–2019). In analyzing the performance of the renewable energy sector, the data envelopment analysis (DEA) with an undesirable output model approach has been widely utilized to measure the efficiency of peer units compared with the best practice frontier. We consider four inputs and two outputs to a DEA-based efficiency model. Labor force, total energy consumption, share of renewable energy, and total renewable energy capacity are inputs. The outputs consist of CO2 emissions as an undesirable output and gross domestic product as a desirable output. The results show that United Arab Emirates, Saudi Arabia, Japan, and South Korea consistently outperform in the evaluation, achieving perfect efficiency scores during the research period. Uzbekistan is found to have the lowest average efficiency of renewable energy utilization.
Keywords: Asia; renewable energy; efficiency; frontier; data envelopment analysis; bad output
The new decade has begun with a negative sign for the world and the Asia region in particular. After a tumultuous 2019, with trade disputes and key uncertainties weighing on major economies in the region, the 2020 Covid-19 outbreak has disrupted the travel and business sectors. Uncertainty and anxiety persist over the impact of the virus, but at some point, the situation will return to normal, and the world will have to think once again about a dire threat that is far worse for human existence: climate change. Accounting for more than 50% of global emissions and home to the world’s largest (China) and fastest-growing emitting economies (India and Southeast Asia), Asia’s actions will control greenhouse gas emissions and make meaningful progress in combating climate change. In this context, with lower costs, technology maturity, and strong demand for energy growth, it will be easier for Asia to choose wind and solar over coal. Organizations and governments in the region will need to be ready to make major changes in the functioning of both the energy and economic systems.
With the most polluted areas concentrated in Asia, the energy transition in this continent is decisive for the world’s clean and sustainable future. Close to 60% of the world’s population resides in Asia and faces the environmental difficulties of deterioration caused by excessive consumption of fossil fuels [1]. Substantial contribution to promoting growth in Asian countries has long been made by non-renewable energy sources, resulting in high dependency, and continuing to generate negative externalities in the form of carbon emissions and global warming. The increased consumption of non-renewable energy concerning renewable energies shows that countries need an efficient policy design to limit environmental degradation and at the same time promote economic growth.
In view of vigorous growth targets, Asian countries have been developing renewable energy resources. Renewable energy infrastructure investment has been robust in the region, owing to government attempts to reduce carbon emissions and lower costs due to cheaper technology and economies of scale. At the regional level, the share of renewable energy in total energy consumption is around 41.44% in South Asia, 37.73% in Southeast Asia, 20.75% in Central Asia, 6.30% in West Asia, and 6.28% in East Asia [2]. The role of energy efficiency and renewable energy in ensuring energy security and reducing carbon emissions has been recognized in many regional and global forums [3,4]. Considering this, energy efficiency and renewable energy assessments of technical and technological trends and indicators play an essential role in accelerating clean energy transitions and have been received great attention both in academic and practice [5–8]. This process aids in better understanding the current state and outlook for energy consumption efficiency for various economies. In the context of the sustainability model, research on the effects of energy efficiency and renewable energy is of interest because the empirical understanding of the impact is critical for policymaking to achieve sustainable development [9]. Asia has great potential to contribute to global GDP growth and carbon reduction targets have significant implications for long-term sustainable development goals.
Regarding the Asian sphere, researchers are highly concerned about the linkages between economic growth, the amount of GDP, energy efficiency, and renewable energy consumption. Hanif et al. [1] investigated the impact of renewable and non-renewable energy consumption, tied to economic growth, on carbon emissions in developing Asian economies. According to the study, renewable energy use has a statistically significant and detrimental effect on carbon emissions in Asian countries, with a percentage increase in renewable energy consumption reducing carbon emissions. About 0.029%. The transition to renewable energy sources to control fossil fuel consumption has been advocated. With economic growth in mind, more production may indeed be needed, but efforts to boost the production of goods using non-renewable energy sources could reduce fossil fuel supplies [10]. Governments should emphasize the importance of the natural environment and the use of renewable energy alternatives to limit the dangers posed by fossil fuel consumption. The relationship between renewable energy consumption, GDP, and foreign direct investment has been studied [11]. In the long run, there is a stable relationship between the growth rate of total GDP per capita, the rate of renewable energy consumption per capita, and the growth rate of FDI per capita. Therefore, renewable energy development depends on ensuring balanced economic growth and FDI development.
In the evaluation of the energy production and consumption, as well as energy efficiency and renewable energy utilization assessments, literature and practice show that the data envelopment analysis (DEA) method is receiving popularity and becoming one of the most powerful tools that can provide a comparison of systems with multiple input and output factors. Chien et al. [12] used the DEA method to investigate the impact of renewable energy on the technical efficiency of 45 economies (OECD and non-OECD), with considering various factors such as labor, energy consumption, capital stock, and GDP. The results show that OECD economies have improved technical efficiency and a larger share of renewable energy in geothermal, solar, tidal, and wind fuels compared with non-OECD economies. However, non-OECD economies have a significantly larger share of renewable energy than OECD economies in their overall energy supply. Woo et al. [13] applied several DEA methods, including BCC, CCR, SE, and super-efficiency models as well as DEA-based Malmquist Productivity Index (MPI), to analyze environmental efficiency of renewable energy across 31 OECD countries, with investigating the carbon emissions as an undesirable output. The findings have encouraged policymakers to support the development of renewable energy technologies by demonstrating a significant impact on most authorities in OECD countries on renewable energy within the energy market. Zhou et al. [14] introduced the Malmquist CO2 emission performance index (MCPI) which is derived by solving several DEA typical models, examining the evolution path of the total factor carbon emission performance of the world’s top 18 largest contributing countries to CO2 emissions. The studies have shown that carbon emissions increased considerably during the study period and are the main reason for technological progress. Cicea et al. [15] adopted the DEA approach to establish the renewable energy investments’ efficiency and environmental efficiency index of investments in renewable energy, targeting a group of European countries. The authors revealed that the established efficiency index was a truly effective efficiency indicator as being calculated as a ratio between effects (the CO2 emissions) and efforts (the investments). Wang et al. [16] conducted a renewable energy utilization analysis of highly and newly industrialized countries using the DEA-Undesirable Output model. Some of the strategies recommended in this study to improve the utilization of renewable energy include improvements in the political and legal structure surrounding their use and regulation, tax incentives or exemptions for private power producers to encourage a shift away from conventional energy production, and partnerships with non-governmental and international organizations that can provide these services. Besides the DEA methodologies, assessment approaches for multi-input multi-output systems are ample in various research areas including the renewable energy sector: life cycle assessment (LCA) methodology of mixed municipal solid waste [17], multi-objective optimization, and chaotic time series based on optimal multi-input multi-output architecture for an offshore wind speed application [18], interval forecasting system for uncertainty modeling based on multi-input multi-output theory in a case study on modern wind stations [19], and global sensitivity analysis method based on variance and covariance decomposition of summatory functions for multi-input multi-output systems [20].
Through the above-reviewed studies that give some insights about the energy efficiency, economic growth, and renewable energy in pathways towards reducing greenhouse gas emissions and sustainable development goals, there are limited studies that employ samples of Asia countries. In this regard, this paper aims to investigate the period 2014–2019 of 14 potential Asia countries: the United Arab Emirates (UAE), Kuwait, Saudi Arabia, Turkey, Iran, India, Malaysia, Thailand, Indonesia, Japan, South Korea, China, Kazakhstan, and Uzbekistan. DEA undesirable output model is adopted to evaluate and compare the efficiency scores regarding the renewable energy consumption of the countries, or so-called the decision-making units (DMUs) obtained with considering the undesirable data. The model is used as an explicit function of four inputs (labor force (LF), total energy consumption (TEC), share of renewable energy (SRE), and total renewable energy capacity (TREC)). The outputs consist of carbon dioxide emissions (CO2) as an undesirable output and gross domestic product (GDP) as a desirable output. Within the involvement of these dimensions, the adoption of DEA models stems from that the approach is adequate as a nonparametric approach based on mathematical programming, that can take multiple inputs and outputs into account simultaneously. Second, DEA can solve the complex efficiency performance of the DMUs, in which the selected inputs and outputs have no available analytical relationship [21]. Considering this, the present study aims to identify whether countries are efficient in their progress in using renewable energies. Energy consumption has a vital effect on the gross domestic product of the country since the ratio of the two components affects numerous countries’ economic production as energy is an essential input in the constant consumption of energy-intensive products. Accordingly, the current study filled the gap in the literature by estimating the current renewable energy efficiency scenario in Asia and indicating major determinants of energy efficiency optimization towards sustainable development in this region.
The structure of the whole paper is organized as follows. In Section 2, the materials and methods used in this research are summarized and explained. Section 3 presents the sample of Asian countries being investigated. Results analysis is exhibited in Section 4. Discussions are reviewed in Section 5 while concluding remarks and future research directions are provided in Section 6.
The research is divided into three main parts, as can be seen in Fig. 1.
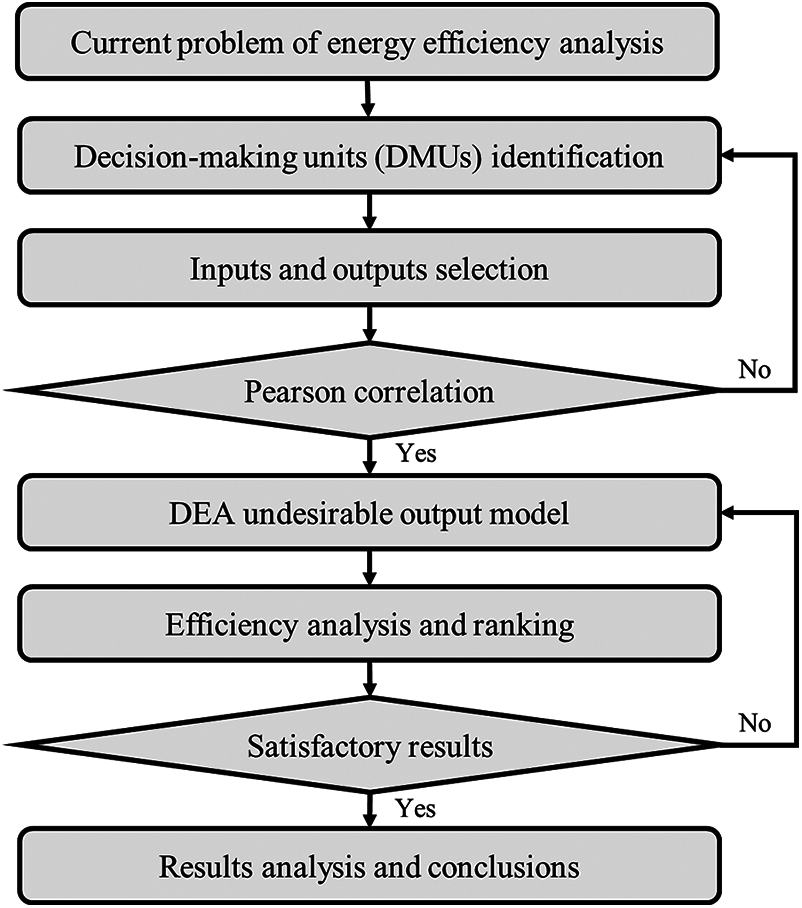
Figure 1: The process of research
Stage 1: Collect the data of the DMUs.
For the assessment, there are a total of 14 potential countries in Asia in the International Renewable Energy Agency (IRENA) [22], Enerdata [23], and World Bank [24]. The countries (DMUs) include UAE, Kuwait, Saudi Arabia, Saudi Arabia, Turkey, Iran, India, Malaysia, Thailand, Indonesia, Japan, South Korea, China, Kazakhstan, and Uzbekistan.
Stage 2: Identify input/output variables.
This study applied the Pearson correlation coefficients to examine input and output variables. It is found that input variables including labor force, total energy consumption, share of renewable energy, and total renewable energy capacity; outputs variables including CO2 emissions (undesirable output) and gross domestic product (desirable output) had positive correlations.
Stage 3: DEA undesirable output model.
The DEA-based efficiency approach in the presence of undesirable data is employed to determine the efficiency scores of the considered DMUs and the final ranking of the DMUs regarding output efficiency. Results and conclusions are then provided.
Data envelopment analysis (DEA), an application of linear programming, is used to measure the relative efficiency of decision-making units (DMUs) in terms of attempting to decrease inputs or increase outputs [25]. The objective of the DEA model is to maximize the ratio of weighted outputs to weighted inputs for the considered DMU, as can be seen in the model (1).
such that
where Zpq is the relative efficiency of DMUq (q = 1, 2,…, n) when evaluated using the weights associated with DMUp (p = 1, 2,…, n); n is number of evaluated DMUs; s is number of outputs; t number of inputs; uip is the weight attached to ith output (i = 1, 2,…, s) for DMUp (p = 1, 2,…, n); vjp is the weight attached to jth input (j = 1, 2,…, t) for DMUp (p = 1, 2,…, n); yiq is value of ith output (i = 1, 2,…, s) for DMUq (q = 1, 2,…, n); xjq is value of jth input (j = 1, 2,…, t) for DMUq (q = 1, 2,…, n); and ∈ is infinitesimal constant.
The optimal value of the objective function (i.e., the efficiency score) in the model (1) is at 1 (or 100%), the considered DMUs satisfy the necessary condition as DEA efficiency. Otherwise, they are considered as DEA inefficiency.
Homogeneity and isotonicity are two crucial DEA assumptions. Before using the DEA model, the association between input and output variables must be checked, which means that it should be in a total positive linear relationship (when the value of one variable increases, the other variable value will also increase). One of the best statistical tests for estimating the association between two variables is the Pearson correlation index. The correlation formula of Pearson of two variables is calculated as Eq. (2) [26].
2.3 DEA Undesirable Output Model
Cooper et al. [27] proposed DEA undesirable output model which can handle the bad outputs during efficiency and inefficiency analysis. This research applied the undesirable output model (BadOutput-C), which is presented as follows. The matrices of inputs and outputs of the DMUs will be standing for (x0, y0). The outputs of the matrix y will be disintegrated into undesirable outputs (Yb) and desirable outputs are Yg. Each country will be declared as DMU
The production possibility set is shown by Eq. (3).
where λ is the intensity vector, L is the lower bound, and U is the upper bound of λ.
In the existence of bad output, a DMU
The adjustment of SBM to obtain the undesirable output model is shown by Eq. (4).
constraint to
The excesses in inputs, bad outputs, lack of good outputs are expressed by the vector s−, sb, sg, respectively. s1 and s2 are the number of components in sb, sg, and s = s1 + s2.
A DMU
Through Charnes–Cooper transformation approach, the fractional model can be transformed into the linear model with the consequential variables
such that
where v, ub, ug are assigned as the virtual costs of inputs, bad outputs, good outputs, respectively.
The weights of good and bad outputs must be set in accordance with w1, w2, respectively. Then, the model computed the relative weights as W1 = sw1/(w1 + w2) and W2 = sw2/(w1 + w2). The objective function will be converted to Eq. (10). In this research, the authors used the default value with w1 = w2 = 1.
3 A Case Study in Asia Countries
3.1 Selection of Decision-Making Units (DMUs)
According to data collected from the Enerdata Yearbook 2020 [23], this research studied the top 14 potential countries in Asia for efficient evaluation of renewable energy consumption, which are United Arab Emirates, Kuwait, Saudi Arabia, Saudi Arabia, Turkey, Iran, India, Malaysia, Thailand, Indonesia, Japan, South Korea, China, Kazakhstan, and Uzbekistan. Note that other Asia countries are not included due to the data access limitation. The list of countries and their population in 2019 are shown in Tab. 1.

3.2 Selection of Inputs and Outputs
The research process is depicted in Fig. 2. This research assesses the efficiency of renewable energy consumption which refers to the economic and energy resources in order to improve the GDP of countries while reducing greenhouse gas emissions. Hence, the economic indexes (i.e., labor force) and related energy factors are selected as inputs, while CO2 emission and GDP are chosen as undesirable output and desirable output, respectively. The description of those variables is presented as follows.
• Labor force (LF): includes people aged 15 and up who provide labor for the manufacture of goods and services for a set period of time, unit: million people.
• Total energy consumption (TEC): is the balance of primary production, external trade, marine bunkers, and stock changes, unit: million tons of oil equivalent (Mtoe).
• Share of renewable energy (SRE): the share of renewable energy in electricity production is the ratio of renewable energy production to total electricity production (i.e., hydro, wind, geothermal and solar) and the total electricity production, unit: percentage (%).
• Total renewable energy capacity (TREC): represents the overall net generating capacity of power plants and other installations that generate electricity using renewable energy sources, unit: megawatt (MW).
• CO2 emission (CO2): CO2 emissions cover only the emissions from the fossil fuel combustion (coal, oil, and gas), unit: million tons of carbon dioxide (MtCO2).
• Gross domestic product (GDP): is the amount of all resident producers’ gross value-added plus any commodity taxes in the economy, unit: billion USD.
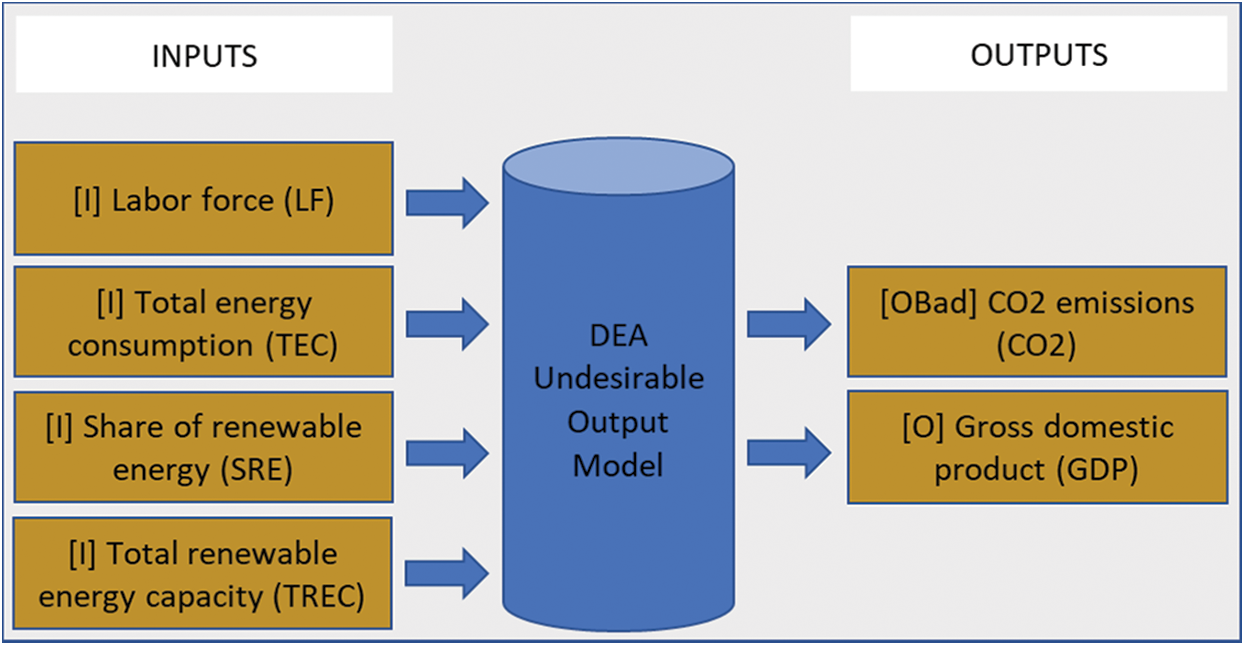
Figure 2: The inputs and outputs used in the DEA model
In this research, the dataset is obtained for the six-year period from 2014 to 2019. Data related to total energy consumption, share of renewable energy, total renewable energy capacity, and CO2 emission are collected from the International Renewable Energy Agency (IRENA) [22] and the Enerdata yearbook 2020 [23], while data of labor force and gross domestic product are provided by the Work Bank [14]. The descriptive statistics on input and output variables for the period from 2014 to 2019 including maximum value, minimum value, average value, and standard deviation, are presented in Tab. 2.

The isotonic condition between the input and output variables must be satisfied before running the DEA model. It implies that as the values of the input variables rise, the values of the output variables do not fall. The Pearson correlation coefficient has a significant range from –1 (negative correlation) to 1 (positive correlation). The DEA model needs data in a positive relationship. The results of the Pearson correlation test for the considered periods, from 2014 to 2019, are shown in Tab. 3. The matrix of Pearson coefficients is accompanied by p-values, which are significant at the 0.01 level (2-tailed). The results show that all Pearson values range from 0.437 to 1, which shows a positive linear relationship, and the dataset can be used for the DEA undesirable output model in the next step.

4.2 Efficiency Utilization and Ranking
DEA calculates the efficiency of each DMU as its distance from the frontier, which ranges from 0 to 1. A DMU that is right on the frontier is considered efficient and given a score of 1, whereas a DMU that is below the frontier is considered inefficient and given a score less than 1. Tab. 4 reports the detailed efficiency scores of the DMUs. The UAE, Saudi Arabia, Japan, and South Korea achieve absolute performances every single year in 2014–2019. Their perfect efficiency scores based on DEA indicate that these four countries, which are the UAE, Saudi Arabia, Japan, and South Korea, were able to generate the best possible outcomes in CO2 emissions reduction and gross domestic product given their current input resources.

Fig. 3 depicts the evolution of the efficiency indexes for the remaining countries, which obtained lower and more unstable performances than the UAE, Saudi Arabia, Japan, and South Korea over the periods covered in 2014–2019. As can be seen, the figures for Kuwait are much higher than the others in all research periods, followed by China’s figures. Kuwait achieved perfect efficiency scores in 2014, 2015, and 2018 but obtaining the worst performance of 0.5906 in 2016. China only had the best efficiency in renewable energy consumption in 2019, growing from the lowest of 0.3881 in 2014. The remaining countries achieve lower and more stable efficiencies during 2014–2019, in which the figures of Uzbekistan form the lowest graph.
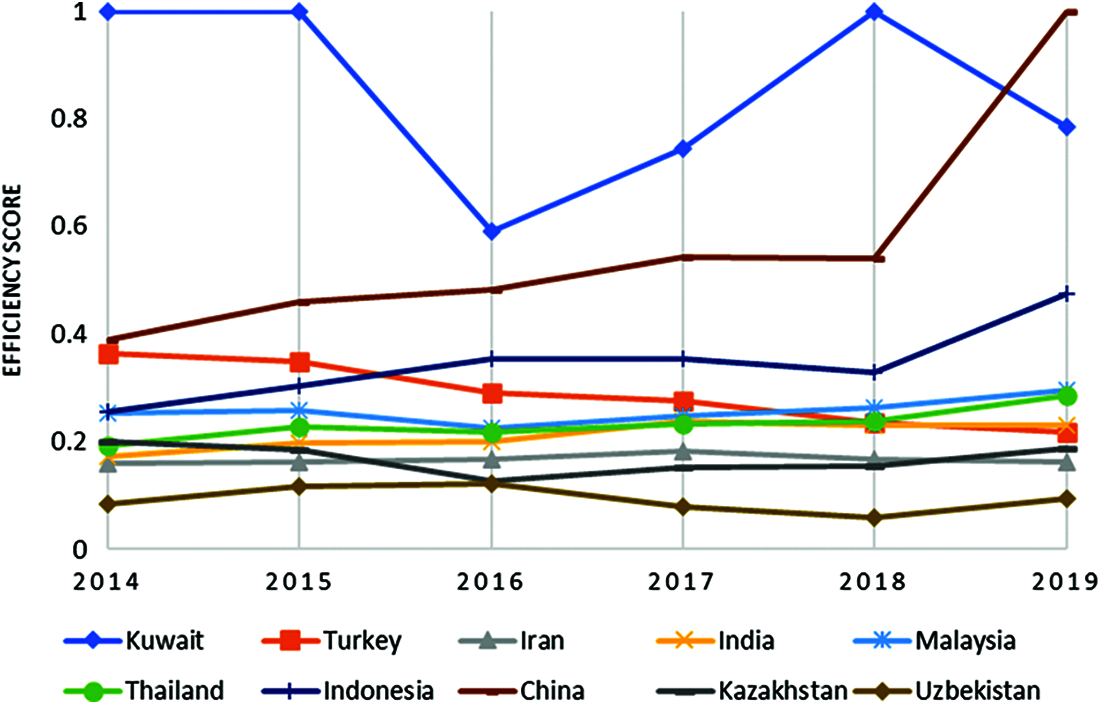
Figure 3: Graphical presentation of countries efficiency score
5.1 Comparison Between Efficiency and Input Variables
Fig. 4 presents the comparison between the average efficiency of renewable energy utilization and the considered input variables during the six-year periods (2014–2019) including labor force, total energy consumption, the share of renewable energy, total renewable energy capacity (Figs. 4a–4d, respectively). In terms of the labor force in Fig. 4a, most countries used a large number of labor force, which are recorded with a low value of the average renewable energy utilization efficiency, such as China and India. Meanwhile, UAE, Saudi Arabia, Japan, and South Korea are four countries that obtained the highest efficiency despite they had a large number of laborers. A similarity in the relation between the total energy consumption and the average efficiency is indicated, as shown in Fig. 4b. With respect to the share of renewable energy (Fig. 4c), Turkey and China are accounted for the high percentage of renewable energy but still low in the efficiency consumption in renewable energy. China also is an example of a similar pattern of renewable energy capacity in Fig. 4d.

Figure 4: Comparison between average efficiency and inputs (a) Efficiency and labor force (b) Efficiency and total energy consumption (c) Efficiency and share of renewable energy (d) Efficiency and total renewable energy capacity
5.2 Comparison Between Efficiency and Output Variables
The comparison between the average efficiency of renewable energy consumption and the considered output variables (gross domestic product (GDP), CO2 emissions) is shown in Fig. 5. As the result in Fig. 5a, the relationship between GDP and the average renewable energy utilization is a similarity to input variables, i.e., labor force, total energy consumption, and total renewable energy capacity. In terms of CO2 emissions (i.e., undesirable output or bad output), Fig. 5b depicts a negative correlation between the average efficiency in renewable energy consumption and the CO2 emissions. There is no country with a high-efficiency score that accounted for the high value of bad output as CO2 emissions such as Japan, South Korea, UAE, and Saudi Arabia. The results suggest that one of the ways to reduce CO2 emissions is utilizing renewable energy consumption efficiency.

Figure 5: Comparison between average efficiency and outputs (a) Efficiency and CO2 emissions (b) Efficiency and gross domestic product
5.3 Improving Efficiency of DMUs
Based on the projection in the analysis of variance, the efficiency of renewable energy consumption in Asia countries can be enhanced by decreasing excess in inputs and undesirable output and augmenting the shortfalls in desirable output. The projections of input and output variable in 2019 is shown in Tab. 5. For instance, Turkey (DMU04) has the value of renewable energy consumption efficiency of 0.218, it can be improved by reducing 69.4% of the number of the labor force, or 57.1% of the amount of total energy consumption; or 93.68% the amount of share of renewable energy; and 67.25% of the amount of total renewable energy capacity in 2019. Moreover, the results show the projections of undesirable output variables that Turkey can consider in getting down 58.45% in the amount of CO2 emission, and there is no need for GDP to change. With such improvements, Asia’s overall efficiency in renewable energy use can be improved, and its growth would be more sustainable. In reality, however, making such modifications is much more difficult. There are numerous other considerations that a government must consider. Despite the fact that sustainable aspects of renewable energy are global trends, each nation has a unique policy orientation in many areas, such as supporting the rule of law, unemployment, and economic position.

This study used the DEA efficiency model with considering the undesirable output. The results obtained by implementing the model have indicated that only six countries achieved upper-middle efficiency performance in renewable energy consumption on average of 2014–2019 (China, South Korea, Japan, Saudi Arabia, Kuwait, and the UAE). Despite the possible unfavorable situation regarding energy consumption or emissions reduction in general, these countries were able to achieve high efficiency in transforming their input resources into the best possible outcomes. Governments at higher levels of governance must take a larger role in guaranteeing the management system’s efficiency and avoid malfunctions to encourage the implementation in their country of renewable energy policy. In Japan, there are expanded opportunities for the utilization of renewable energy [28]. In the low-emission energy industry and domestic renewable investment, China is a leading worldwide player [29]. Cooperation between China and Japan might have a favorable impact on the growth of renewable energy in both countries, increasing Japan’s capacity to extend its market share in China while simultaneously developing China’s renewable energy technology through technology transfer from Japan. Korea is a leading Asian country in green development and considers green growth as part of its national strategy. Korea’s green strategy consists of three elements: industry, energy, and investment. This strategy aims to maintain the scale of economic production activities to optimize natural resources, minimize the environmental impact on energy and natural resources, and at the same time convert the investment to other activities. environment and economic growth. The Korean government is committed to increasing the share of renewable energies in the electricity supplier progressively phasing out the energy mix of coal and nuclear power, boosting the energy efficiency of the country significantly and encouraging the emerging hydrogen industry [30]. The transition towards greater use of renewables for desalination, especially solar power, is accelerated in Saudi Arabia, Kuwait, and the UAE, three of the six members of Gulf Cooperation Council (GCC) countries, to reduce fossil fuel consumption for exports or more economic uses [31]. For the remaining research countries, average efficiencies are extremely low, with indexes not exceeding 0.4, with Uzbekistan having the worst efficiency, with an index of less than 0.1. It implies that they have not been utilizing their resources most efficiently. There is therefore enormous potential for them to increase efficiency performance. Improving this by using the existing resources in a more effective manner, going together with expanding the resources [32].
The primary focus of this study is to identify whether the researched countries, including the United Arab Emirates (UAE), Kuwait, Saudi Arabia, Turkey, Iran, India, Malaysia, Thailand, Indonesia, Japan, South Korea, China, Kazakhstan, and Uzbekistan, are efficient in their progress in using renewable energies. To the best of the authors’ knowledge, there has not been such an investigation in the existing literature. In this research, the proposed methodology and the results can serve as the step-stone for sustainable development studies in Asia and globalization studies in which renewable energy is a cornerstone. For managerial implications, this study could be a significant material for renewable energy stakeholders, governments, and authorities of not only researched nations but also other countries to expedite the transition from non-renewable to renewable energy sources and to facilitate the expansion of green bond markets to developing countries, which may prove helpful for mitigating carbon emissions and for increasing investment in clean energy projects.
Future studies should aim at evaluating further aspects affecting renewable energy consumption in other nations within and outside Asia, as well as extending the proposed methodology to two-stage DEA models or network DEA models. Additionally, more novel dimensions of quantitative and qualitative factors should be considered in future studies under uncertain environments, i.e., using fuzzy multiple criteria decision-making such as FAHP, FTOPSIS, FVIKOR to obtain more robust results. Assessing producing capability in various types of renewable energy sources of each nation is also a vital strategy in the energy sector [33] in which the decision-making of the best sources can signify avenues for further research.
Acknowledgement: The authors appreciate the support from the National Kaohsiung University of Science and Technology, Ministry of Sciences and Technology in Taiwan.
Funding Statement: This research was partly supported by the National Kaohsiung University of Science and Technology, and project number MOST 109-2622-E-992-026 from the Ministry of Sciences and Technology in Taiwan.
Conflicts of Interest: The authors declare that they have no conflicts of interest to report regarding the present study.
1. I. Hanif, B. Aziz and I. S. Chaudhry, “Carbon emissions across the spectrum of renewable and nonrenewable energy use in developing economies of Asia,” Renewable Energy, vol. 143, pp. 586–595, 2019. [Google Scholar]
2. Key world energy statistics: International Energy Agency, 2016. [Online]. Available: https://www.ourenergypolicy.org/wp-content/uploads/2016/09/KeyWorld2016.pdf. [Google Scholar]
3. Z. Zhang, “China in the transition to a low-carbon economy,” Energy Policy, vol. 38, no. 11, pp. 6638–6653, 2010. [Google Scholar]
4. J. S. Riti, D. Song, Y. Shu, M. Kamah and A. A. Atabani, “Does renewable energy ensure environmental quality in favour of economic growth? empirical evidence from China’s renewable development,” Quality & Quantity, vol. 52, no. 5, pp. 2007–2030, 2018. [Google Scholar]
5. L. W. Wang, K. D. Le and T. D. Nguyen, “Assessment of the energy efficiency improvement of twenty-five countries: A DEA approach,” Energies (Basel), vol. 12, no. 8, pp. 1535, 2019. [Google Scholar]
6. J. L., Zofı́o and A. M. Prieto, “Environmental efficiency and regulatory standards: The case of CO2 emissions from OECD industries,” Resource and Energy Economics, vol. 23, no. 1, pp. 63–83, 2001. [Google Scholar]
7. B. C. Xie, L. F. Shang, S. B. Yang and B. W. Yi, “Dynamic environmental efficiency evaluation of electric power industries: Evidence from OECD (Organization for economic cooperation and development) and BRIC (Brazil, Russia, India and China) countries,” Energy (Basel), vol. 74, pp. 147–157, 2014. [Google Scholar]
8. T. Yang, W. Chen, K. Zhou and M. Ren, “Regional energy efficiency evaluation in China: A super efficiency slack-based measure model with undesirable outputs,” Journal of Cleaner Production, vol. 198, pp. 859–866, 2018. [Google Scholar]
9. M. Irfan, B. Mahapatra and R. K. Ojha, “Examining the effectiveness of low-carbon strategies in South Asian countries: The case of energy efficiency and renewable energy,” Environment, Development and Sustainability, vol. 23, pp. 1–17, 2021. [Google Scholar]
10. I. Hanif, S. M. F. Raza, P. Gago-de-Santos and Q. Abbas, “Fossil fuels, foreign direct investment, and economic growth have triggered CO2 emissions in emerging Asian economies: Some empirical evidence,” Energy, vol. 171, pp. 493–501, 2019. [Google Scholar]
11. W. Fan and Hao, Y. “An empirical research on the relationship amongst renewable energy consumption, economic growth and foreign direct investment in China,” Renewable Energy, vol. 146, pp. 598–609, 2020. [Google Scholar]
12. T. Chien and J. L. Hu, “Renewable energy and macroeconomic efficiency of OECD and non-OECD economies,” Energy Policy, vol. 35, no. 7, pp. 3606–3615, 2007. [Google Scholar]
13. C. Woo, Y. Chung, D. Chun, H. Seo and S. Hong, “The static and dynamic environmental efficiency of renewable energy: A malmquist index analysis of OECD countries,” Renewable and Sustainable Energy Reviews, vol. 47, pp. 367–376, 2015. [Google Scholar]
14. P. Zhou, B. W. Ang and J. Y. Han, “Total factor carbon emission performance: A malmquist index analysis,” Energy Economics, vol. 32, no. 1, pp. 194–201, 2010. [Google Scholar]
15. C. Cicea, C. Marinescu, I. Popa and C. Dobrin, “Environmental efficiency of investments in renewable energy: Comparative analysis at macroeconomic level,” Renewable and Sustainable Energy Reviews, vol. 30, pp. 555–564, 2014. [Google Scholar]
16. C. N. Wang, H. Tibo and D. H. Duong, “Renewable energy utilization analysis of highly and newly industrialized countries using an undesirable output model,” Energies (Basel), vol. 13, no. 10, pp. 2629, 2020. [Google Scholar]
17. G. Fiorentino, M. Ripa, G. Protano, C. Hornsby and S. Ulgiati, “Life cycle assessment of mixed municipal solid waste: Multi-input versus multi-output perspective,” Waste Management, vol. 46, pp. 599–611, 2015. [Google Scholar]
18. T. Niu, J. Wang, H. Lu and P. Du, “Uncertainty modeling for chaotic time series based on optimal multi-input multi-output architecture: Application to offshore wind speed,” Energy Conversion and Management, vol. 156, pp. 597–617, 2018. [Google Scholar]
19. T. Liu, Q. Zhao, J. Wang and Y. Gao, “A novel interval forecasting system for uncertainty modeling based on multi-input multi-output theory: A case study on modern wind stations,” Renewable Energy, vol. 163, pp. 88–104, 2021. [Google Scholar]
20. Q. Liu, N. Tong, X. Wu, X. Han and C. Chen, “A generalized sensitivity analysis method based on variance and covariance decomposition of summatory functions for multi-input multi-output systems,” Computer Methods in Applied Mechanics and Engineering, vol. 385, pp. 114009, 2021. [Google Scholar]
21. C. N. Wang and T. T. Dang, “Location optimization of wind plants using DEA and fuzzy multi-criteria decision making: A case study in Vietnam,” IEEE Access, vol. 9, pp. 116265–116285, 2021. [Google Scholar]
22. Data & Statistics: International Renewable Energy Agency, 2020. [Online]. Available online: https://www.irena.org/. [Google Scholar]
23. Global Energy Transition Statistics: Global Energy Statistical Yearbook, 2020. [Online]. Available: https://yearbook.enerdata.net/. [Google Scholar]
24. DataBank: The World Bank Database, 2020. [Online]. Available online: https://databank.worldbank.org/home.aspx. [Google Scholar]
25. A. Azadeh, S. F. Ghaderi and M. R. Nasrollahi, “Location optimization of wind plants in Iran by an integrated hierarchical data envelopment analysis,” Renewable Energy, vol. 36, no. 5, pp. 1621–1631, 2011. [Google Scholar]
26. C. N. Wang, T. T. Dang, N. A. T. Nguyen and T. T. H. Le, “Supporting better decision-making: A combined grey model and data envelopment analysis for efficiency evaluation in e-commerce marketplaces,” Sustainability (Basel), vol. 12, no. 24, pp. 10385, 2020. [Google Scholar]
27. W. W. Cooper, L. M. Seiford and K. Tone, “DEA model with undesirable output,” In Introduction to Data Envelopment Analysis and its Uses: With DEA-Solver Software and References, Springer Science and Business Media: Berlin, Germany, 2006. [Google Scholar]
28. S. R. Sharvini, Z. Z. Noor, C. S. Chong, L. C. Stringer and R. O. Yusuf, “Energy consumption trends and their linkages with renewable energy policies in east and Southeast Asian countries: Challenges and opportunities,” Sustainable Environment Research, vol. 28, no. 6, pp. 257–266, 2018. [Google Scholar]
29. J. Yu, K. Zhou and S. Yang, “Regional heterogeneity of China’s energy efficiency in “new normal”: A meta-frontier super-SBM analysis,” Energy Policy, vol. 134, pp. 110941, 2019. [Google Scholar]
30. Renewable energy in Korea: Energy policy review, 2020. [Online]. Available: https://www.iea.org/reports/korea-2020. [Google Scholar]
31. A. Z. Amin, Renewable energy market analysis: International Renewable Energy Agency, 2016. [Online]. Available: https://www.irena.org/-/media/Files/IRENA/Agency/Publication/2016/IRENA_Market_GCC_2016.pdf. [Google Scholar]
32. D. D. Wang, “Performance assessment of major global cities by DEA and malmquist index analysis,” Computers, Environment and Urban Systems, vol. 77, pp. 101365, 2019. [Google Scholar]
33. C. N. Wang, T. T. Dang, H. Tibo and D. H. Duong, “Assessing renewable energy production capabilities using DEA window and fuzzy TOPSIS model,” Symmetry (Basel), vol. 13, no. 2, pp. 334, 2021. [Google Scholar]
 | This work is licensed under a Creative Commons Attribution 4.0 International License, which permits unrestricted use, distribution, and reproduction in any medium, provided the original work is properly cited. |