DOI:10.32604/csse.2022.023320
| Computer Systems Science & Engineering DOI:10.32604/csse.2022.023320 | |
| Article |
A Sensitive Wavebands Identification System for Smart Farming
Department of Computer Science and Engineering, Sri Krishna College of Engineering and Technology, Coimbatore, 641025, India
*Corresponding Author: M. Kavitha. Email: kavitham@skcet.ac.in
Received: 03 September 2021; Accepted: 27 October 2021
Abstract: Sensing the content of macronutrients in the agricultural soil is an essential task in precision agriculture. It helps the farmers in the optimal use of fertilizers. It reduces the cost of food production and also the negative environmental impacts on atmosphere and water bodies due to indiscriminate dosage of fertilizers. The traditional chemical-based laboratory soil analysis methods do not serve the purpose as they are hardly suitable for site specific soil management. Moreover, the spectral range used in the chemical-based laboratory soil analysis may be of 350–2500 nm, which leads to redundancy and confusion. Developing sensors based on the discovery of spectral wavebands that respond to soil macronutrient concentrations, on the other hand, is an innovative and successful technology since the results are dependable and timely. The goal of this article is to use a supervised neuro-fuzzy based dimensionality reduction approach in the sensor development process to determine sensitive wavebands of soil macronutrients. Accordingly, the spectral signatures of the soil are collected in an outdoor environment and mapped with its macronutrient concentrations. In this spectral analysis, the spectral reflectance of 424 wavelengths has been obtained and these wavelengths are evaluated through combined and individual modes as well. Appropriate wavelengths are selected in each case by minimizing the fuzzy reflectance assessment index. The effectiveness of these selected wavelengths in each mode is validated by modeling the relation between the reduced reflectance space and each macronutrient concentration using Partial Least Squares Multi Variable Regression (PLS-MVR) method. Set of optimal wavebands are identified and the results are compared with the existing systems.
Keywords: Sensitive waveband determination; macronutrients; feuro-fuzzy based dimensionality reduction; partial least squares; multi variable regression; reflectance
Precision farming typically relies on technology to get the optimum performance out of agricultural resources. It involves studying the soil to ascertain its quality. Sensing of soil macronutrients is essential for effective agricultural production. It helps in Site Specific Crop Management System (SSCMS) where the application of fertilizers is determined based on local requirements. The soil testing is performed in laboratory by Jove test. The soil samples are preserved under chemical conditions and observed for 3 days. This destructive method of soil testing requires established labs with skilled laborers. Even though this is a time-consuming method till now, it’s one of the accurate methods for NPK (Nitrogen, Phosphorus and Potassium) analysis. So, the laboratory results are used for mapping, in the proposed nondestructive analysis.
Macronutrient detection can be done nondestructively by two types of sensing systems: i) Optical sensors using reflectance spectroscopy to detect the level of nutrients in the form of reflectance/absorbance by soil particles and nutrient ions ii) Electromagnetic sensors using ion selective membranes that produce a voltage output in response to ion activity of selected ions, mainly concentrated on H, NO3, K, Na etc. Due to reliable and high-speed data transmission, optical sensors are used more widely. The use of Near Infra-Red (NIR) Spectroscopy in optical sensing system helps to measure directly the composition of soil or food products by use of diffuse reflection techniques. The NIR wavelength in optical sensing system ranges from 800 to 2500 nm in the spectrum. Real-time analysis, measuring multiple constituents simultaneously, nondestructive testing, no chemical waste stream, environment friendly, less sample waste, decreased operation costs and increased yield are the distinct advantages of NIR Spectroscopy in soil testing.
NIR spectroscopy provides spectral signature of the soil, which is the variation of reflectance or emittance of the soil with respect to wavelengths (i.e., reflectance/emittance as a function of wavelength). In the present system, the spectral signature of the soil has been measured by a Spectro-radiometer. The purpose of this spectroradiometer is to perform spectral data processing across 700 to 2500 nm bandwidth for operations on soil. The instrument possesses very high resolution, a fast response and operates across the 350 to 2500 nm spectral range with exceptional accuracy and stability. The scan time of the spectroradiometer is 50 ms. Waveband selection or waveband reduction or dimension reduction is the process of reducing the number of wavebands by obtaining a set of principal component variables. The two most important waveband selection methods used in the past literature are: i) Partial Least Squares (PLS) and ii) Competitive Adaptive Reweighted sampling (CARS). Therefore, the proposed method is compared with these two methods.
A supervised neuro-fuzzy technique has been newly introduced in the paper, for the identification of appropriate wavelengths in spectral curve. Neuro-fuzzy system is a combination of neural network and fuzzy logic. Fuzzy logic is created to model human reasoning processes. It uses variable with truth values between 0 and 1. Neuro-fuzzy technique incorporates fuzziness into neural network and develops a learning algorithm by adjusting weight. Neuro-fuzzy technique has been used so far as feature selection method in image processing, where the image consists of overlapped textures [1–3]. In the present study, the neuro-fuzzy technique has been introduced in waveband selection and two different procedures are followed in setting up the soil classes. The selected wavelengths in each procedure are evaluated using PLS multi variable regression, and their performances were analyzed by applying the PLS and CARS on the whole NIR reflectance space. The main contributions of this work are:
• The significance of neuro-fuzzy approach in determining sensitive wave bands for quantifying macro-nutrients in the soil is examined.
• The outdoor spectral data is explored in the soil nutrient analysis
• Two different experiments were conducted using neuro-fuzzy approach. The class labels were assigned to the spectral reflectance features in two different modes namely: combined mode and individual mode.
• PLS regression model was applied on the wavebands identified using the proposed approach in order to determine the quantity of soil macronutrients
The next Section 2 analyzes the efforts taken by the researchers in quantifying the soil macronutrients; Section 3 presents the details about study area and input data. Section 4 deals with the present neuro-fuzzy based wavebands identification algorithm. Section 5 deals with application modes. This paper concludes with Section 6 by providing the experimental results.
Soil nutrient analysis is mandatory and it is performed prior to cultivation and throughout as well since the macronutrients directly influences the growth of the crop. One possible way for estimating soil properties in the field is through spectral reflectance measurement. Compared to laboratory soil analytical techniques, the application of optical sensors to estimate macronutrient content has a greater advantage due to its instant outcome, rapidity, cost efficiency and scalability. There are a lot of literature surveys that use optical diffuse reflectance spectroscopy to detect the level of energy reflected by the nutrient ions and soil particles.
Shi et al. [4] compared the performances of multiple linear regression, partial least squares regression and support vector regression to estimate organic nitrogen content in heterogeneous soils based on visible/near infrared (NIR) spectra, and proposed the 1450, 1850, 2250, 2330 and 2430 nm bands for analysis. They used only 64 samples in their study. They have measured the spectra of the soil samples in a dark room with a 50W halogen lamp as the light source [4]. A few efforts have been taken in the present work, to improve the performance of the PLS regression model. The number of soil samples was increased to 800. A neuro-fuzzy approach was employed to assist the PLS regression through the identification of important wavelengths.
Pudelko et al. [5] explored the spatial variability of soil nutrients and their availability ratios in paddy soils. They calculated the Pearson’s correlation coefficients for each variable to reveal the relationships between the availability ratios of macronutrients and the selected soil properties. The contents of Total Nitrogen (TN), Available Nitrogen (AN), and Total potassium (TK) in paddy fields have relatively longer correlation ranges than those of Total Phosphorus (TP), Available Phosphorus (AP), and Available Potassium (AK). They determined the main factors controlling the availability ratios of N, P, and K using stepwise regression analysis. N availability ratio was mainly related to TN, AN, pH, AP, AZn, and AB; P availability ratio was mainly controlled by AP, TP, AFe, and pH; and K availability ratio was mainly affected by AK, TK, pH, and AB. Therefore, generating spatial distribution maps of macronutrient availability ratios is essential to guide site-specific soil management.
Qu et al. [6] and Devey et al. [7] used near-infrared (NIR) and mid-infrared (Mid-IR) instruments for calculating Total Nitrogen (TN) and Total Carbon (TC) and discussed the predictive performance of calibrations using New Zealand soils. The authors concluded that the calibration statistics and performance of both NIR and Mid-IR were closer. However fine-ground soil samples were needed for Mid-IR due to its smaller viewing area, whereas, NIR requires 2 mm fraction of soil as the viewer area was wider.
Sudduth et al. [8] assessed visible and Near Infrared reflectance (NIR) data for the estimation of organic matter in Illinois soil. The data was analyzed using Partial least squares regression and the performance was evaluated by R2 and standard error of prediction, whose values were 0.9 and 0.34 respectively. The reflectance data used for this experiment was taken in the spectral range 1720–2380 nm on 60 nm spacing for a total of 12 reflectance points.
Fan et al. [9] employed three wavelength selection methods which include competitive adaptive reweighted sampling (CARS), Monte Carlo Uninformative variable Elimination (MC-UVE) and Moving Window Partial Least Squares (MWPLS) to predict total acid of vinegar. Least square regression model was built on the selected wavelengths and concluded that CARS method was a rapid and effective alternative to all other classical methods for prediction, while it improved the speed and rate of modeling by reducing the number of variables.
Mehrjardi et al. [10] used an adaptive neuro-fuzzy inference system and ant colony optimization technique for digital soil mapping of Particle Size Fractions (PSF). They used ant colony optimization (ACO) and correlation-based feature selection (CFS) for dimensionality reduction of feature space and predicted the spatial models for each PSF using an adaptive neuro-fuzzy. Three spatial data-mining models such as Multiple Linear Regression (MLR), Artificial Neural Networks (ANN) and the Artificial Neuro-Fuzzy Inference System (ANFIS) were applied to predict vertical and horizontal distributions of soil PSFs.
Goodarzi et al. [11] performed statistical tests such as Pearson and partial correlation analysis and used the past histories (results of previous literatures) to choose the appropriate spectral range and the most effective spectral regions. They applied Multiple Linear Regression (MLR), Partial Least Squares Regression (PLSR), Artificial Neural Network (ANN) [12] and Fuzzy Neural Network (FNN) [13] models on these selected spectral regions for lead (Pb) concentration estimation and proved that FNN model was more powerful than the other models. Unlike Goodarzi et al.’s approach, the present approach introduces the NF model for waveband determination, since wave band determination is more important than its modeling in any material concentration estimation system.
Zhang et al. [14] collected 34 topsoil samples in the coastal wetland and measured their reflectance in a dark room. They used Savitzky–Golay (S–G) filtering to preprocess the reflectance spectra and computed four differential transformations. They estimated the soil SOM, TN, and TC contents in coastal wetland soil using support vector machine (SVM) and BP neural network algorithms. The following subsection explains the motivation and justification for the present work, based on the existing methodologies.
Jackson [15] performed a study on alluvial (Typic Haplaquent), lateritic (Typic Haplustalf), and coastal (Typic Haplaquept) soils, determine the persistence of butachlor applied at the recommended dose (2 kg ai/ha), as well as its impact on microbial activity and colonial bacteria and fungi growth. Butachlor permanence was lowest in alluvial soil, followed by lateritic and coastal soil, in that order. Butachlor is safe to use in all soil types, even alluvial soil, Tab. 1 shows existing methods.

The experiment was conducted in Coimbatore region, Tamil Nadu, India. The soil samples were collected from all the twelve blocks of Coimbatore district. Each sample was collected at a depth of 0–15 cm and then grained, sieved and homogenized to separate any coarse aggregate or brushwood. 150 grams of each soil sample was sent to the laboratory for the determination of NPK concentrations using alkaline potassium permanganate method, ascorbic acid method and Jackson method [15] respectively.
The alkaline potassium permanganate procedure involved distilling the soil with alkaline potassium permanganate solution and absorbs the ammonia liberated in boric acid which is then titrated with Standard sulphamic acid. The ascorbic acid method estimated the relative bioavailability of ortho-phosphate (PO4-P) in soils by extraction using alkaline sodium bicarbonate (pH 8.5) solution and determining the P concentration in the extract colorimetrically.
Available potassium was extracted from the 5 grams soil with the help of suitable extractant neutral normal ammonium acetate by shaking, followed by filtration or centrifugation and K was determined in the extract using flame photometer [16]. The availability of potassium was estimated by the method described by Jackson. The photometer analysis was based on the measurement of the intensity of characteristic line emission given by the element to be determined.
The number of samples collected for this experiment was 800. The laboratory soil test was conducted for these samples, which enabled us to get 800 records with the quantity of macronutrients in the data size 800 × 3.
The remaining soil samples were used for spectrometry. A spectro-radiometer was used to obtain the reflectance of each sample. In order to deal with the probable non-lambertian behavior of soil sample, the spectral reflectance of each one was measured from four different directions and then their mean was considered as the representative spectral reflectance curve. Three different spectral resolutions were used in three different ranges. The 1.5 nm resolution was used in 700 to 1050 nm range and thus the number of wavebands collected in this range was 230. Similarly, the resolution, range and number of wavebands in second and third sets were 6.5 nm; 1050 to 1900 nm; 131 and 9.5 nm; 1900 to 2500 nm; 63 respectively. Therefore, the total number of wavebands for which the reflectance is measured through the spectro-radiometer was 424. Fig. 1 shows the pictorial representation of the data acquisition process.
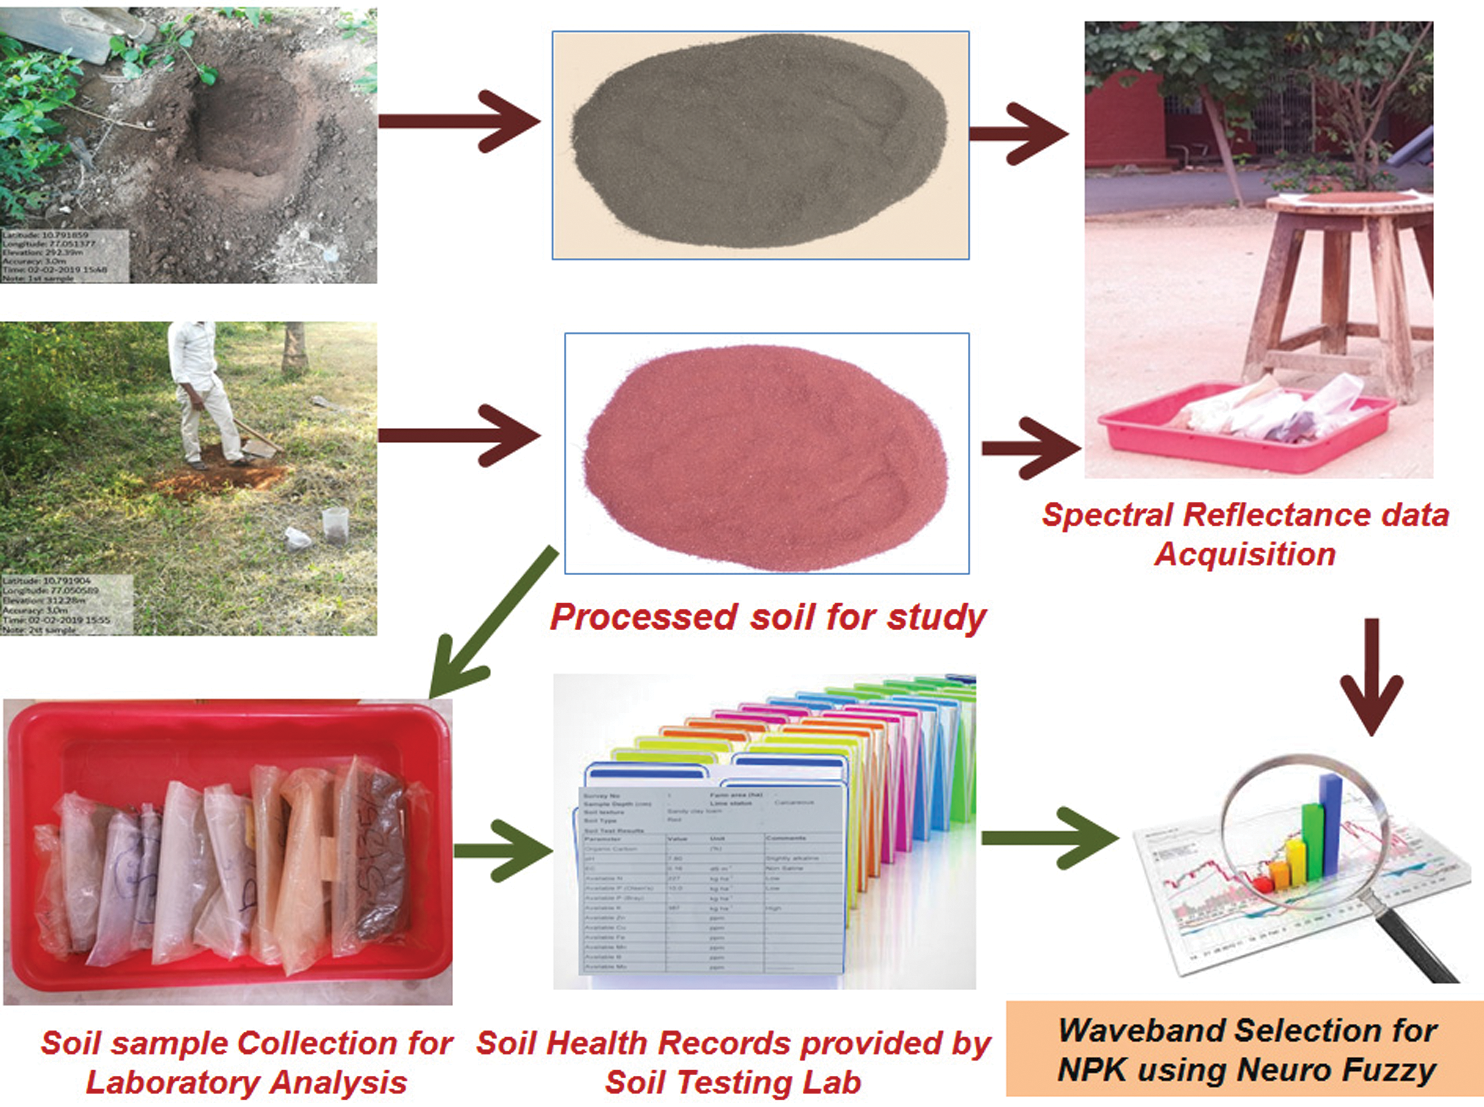
Figure 1: Pictorial representation of the data acquisition process for the present system
The soil samples were further grouped into 3 categories as Red soil, Black soil and Reddish-brown soil, based on their color. Since there were 250, 300 and 250 samples under Red soil, Black soil and Reddish-brown soil groups respectively, the dimension of the input data in each group was 250 × 424, 300 × 424 and 250 × 424 respectively. The NIR reflectance data (r) obtained from the above setup was normalized for further processing using the Eq. (1).
Fig. 2a shows the normalized reflectance spectra of 250 samples in red soil for the bandwidth 700 to 2500 nm. Similarly Figs. 2b and 2c show the corresponding spectra of 300 samples in black soil and 250 samples in reddish brown soil for the same bandwidth respectively.
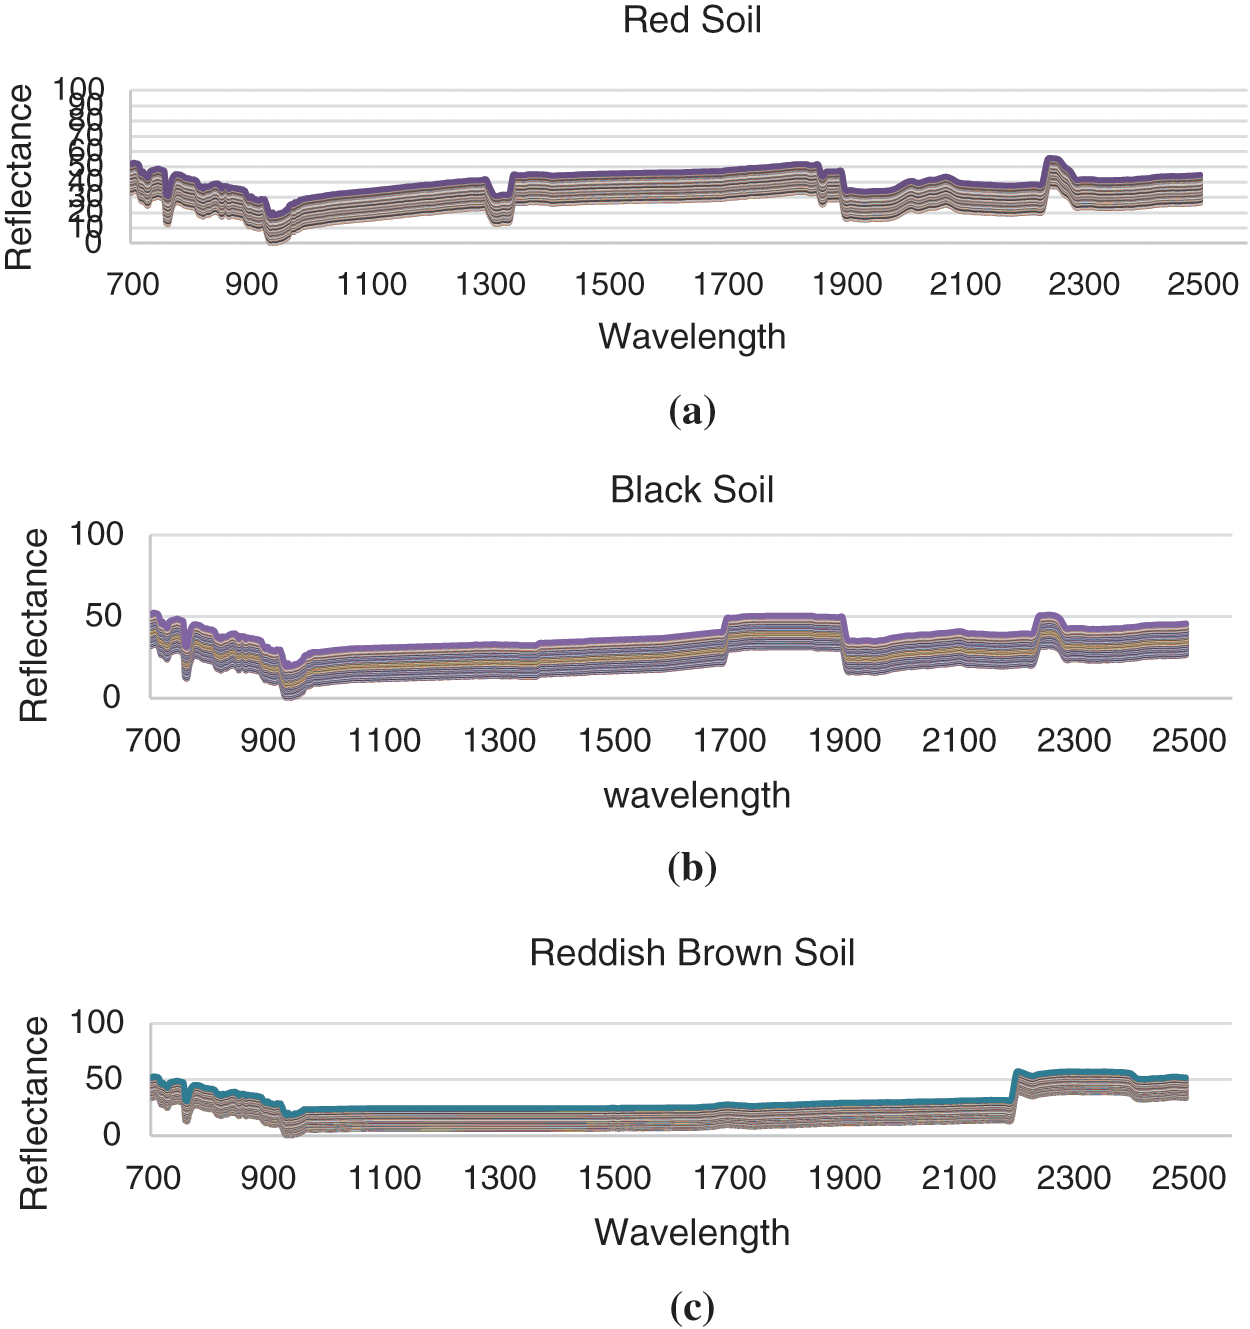
Figure 2: The normalized NIR reflectance pattern of (a) Red (b) Black (c) Reddish-Brown soil
4 The Proposed Sensitive Waveband Identification System
The present work concentrates on the study of applying neuro-fuzzy approach [17] for determining responsive waveband. The reflectance spectrum obtained using an array based spectro-radiometer was evaluated in a neuro-fuzzy [17] framework under supervised learning.
A three-layered network was formulated for minimization of a fuzzy waveband assessment index. The fuzzy index for a set of wavebands has been defined in terms of membership values both in the given and reduced spaces. The fuzzy membership values indicate the degree of similarity between two reflectance models. The assessment index calculated for a set of wavebands was inversely proportional to the importance of the set in discriminating or characterizing various classes of interested components. Therefore, the objective of the approach was to select the wavebands which reduce the assessment index and assign the weights to the wavebands by obtaining the feedbacks from the output through comparing the original instances with the derived output.
4.1 Waveband Assessment Index and Membership Function
The waveband assessment index for a set of reduced wavebands is defined as
In Eq. (2), n is the number of soil samples on which the waveband assessment index was calculated.
where the distance
The fuzzy membership value
where the distance
the term ωb ∈ [0, 1] represented weighting parameter corresponding to the bth band and rib and θjb were the values of the bth band (in the corresponding band-reflectance space) of the ith signature and jth class centre respectively. The relationship between dij and ηij was demonstrated as follows:
when dij = 0, ηij = 1 and dij = D then ηij = 0.
D is the factor which reflected the minimum separation between a signature and a class centre. In the present system, we have chosen D = δdmax, where dmax was the maximum separation between a signature and a class center in the entire reflectance space and 0 < δ < 1 was a user defined constant. δ determined the degree of flattening of the membership function. The higher the value of δ, more will be the degree and vice versa. The dmax in both the given and reduced spaces were defined as:
where rmax b and rmin b were the maximum and minimum values of the bth band-reflectance in the corresponding band-reflectance space. The membership value
The neuro-fuzzy network Fig. 3 consisted of an input, a hidden, and an output layer. The input layer consists of 2 N nodes, where the first N nodes gave the reflectance (r) of a soil sample and the second N nodes gave the mean reflectance (θ) of a class pertaining to each band. The hidden layer consisted of N number of nodes which computed the part (rib − θjb) in (4) and (6) for ith signature and jth class. The output layer consisted of two nodes. One of them computed
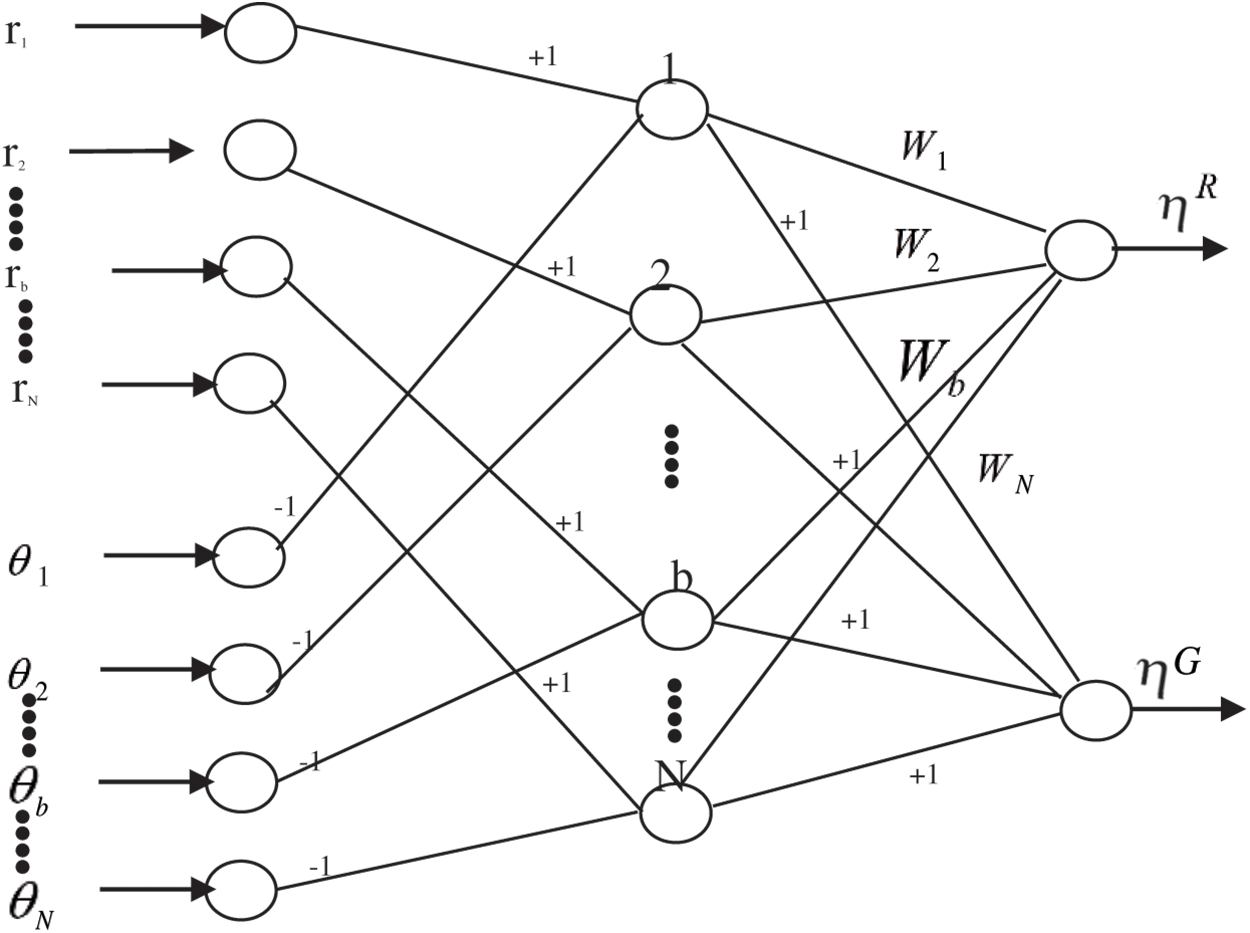
Figure 3: Neuro-fuzzy network for sensitive waveband determination
A in (2), after convergence, attained a local minimum and then the weights (
4.2 Waveband Assessment Index and Membership Function-Algorithm
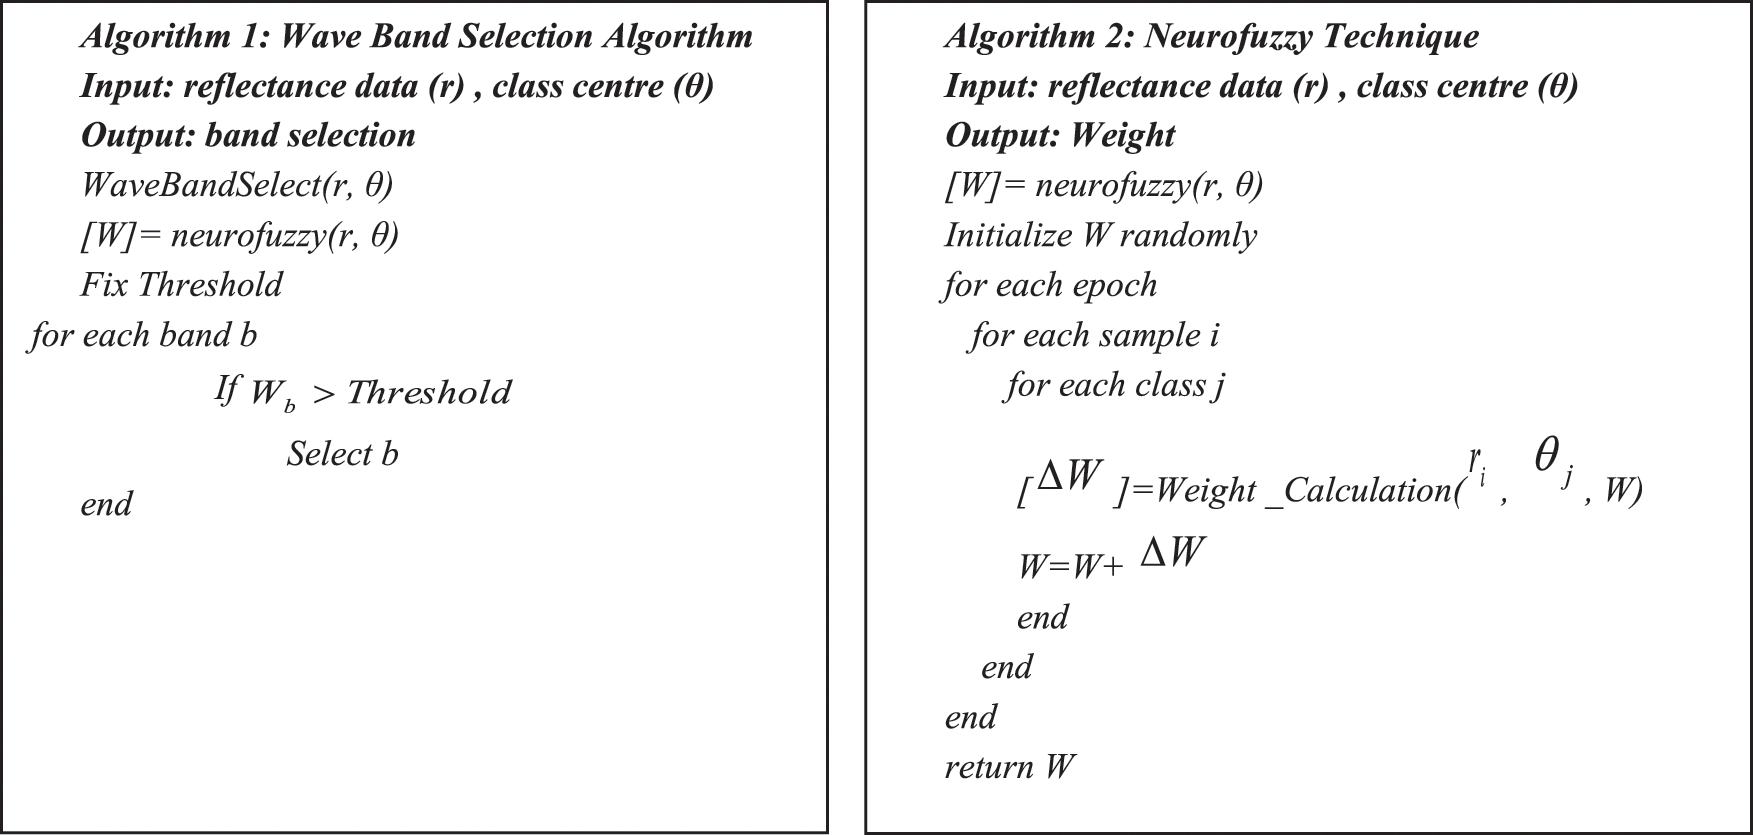
Figure 4: Algorithm for neuro-fuzzy based wave band selection
5 Application Modes of NF Algorithm
Two different experiments were carried out based on the grouping of soil samples. The impact of grouping of dataset was observed through these experiments. The NF algorithm was applied on two modes namely: Combined and Individual mode. The class formation in both these modes was explained in the following subsections.
In the first experiment, the input data were classified in combined mode of macro-nutrient levels. In this combined mode, the soil was classified into eight classes such as: LLL (Low N, Low P and Low K), LLH (Low N, Low P and High K), etc. as shown in Tab. 2. Analyzing Nitrogen [18–20] using rapid procedures. The input data were selected in such a way that each class has got approximately 20 records. Therefore, the size of the dataset considered for this experiment was 160 × 424 and it was split into training and testing sets of size 120 × 424 and 40 × 424 respectively.

Two levels were considered for each macronutrient in this combined mode. The range of macronutrient contents at each level was tabulated in Tab. 3 and the number of classes obtained through the combination of levels of macronutrients was eight as in Tab. 4.


In the second experiment, the levels of macro-nutrients were considered individually and three special data sets of size 140 × 424 each, were designed for selecting the appropriate wavebands in individual mode. The number of classes in this mode was 4 (very low, low, medium and high) as indicated in Tab. 4.
After selecting the effective wavebands in both combined and individual modes, the PLS multivariate analysis technique was applied to estimate the quantity of macronutrient by correlating the reflectance information of the wavelength with each macronutrient concentration.
The concentration of macronutrients was predicted in the proposed multivariate analysis. The capability of neuro-fuzzy dimensionality reduction was explored by applying the PLS regression model on the entire spectrum as well as neuro-fuzzy selected spectral wavebands. The performance of these methods was measured by coefficient of determination (R2), Root Mean Square error (RMSE), Normalized Root Mean Square Error and Ratio of Performance to Deviation. The CARS model was also applied on the entire spectrum and its performance was also compared with the present system.
The dataset for Nitrogen were constructed following the individual mode procedures and used in this analysis. The PLS and CARS algorithms were applied on the training samples of these datasets. These two models were tested with 35 test samples of these datasets. Then the PLS algorithm was applied on the reduced feature space with the set of wavebands (B0.8) and (B0.9) of Nitrogen given in Tab. 3 separately. Fig. 5 depicts the scatterplot of nitrogen analysis with PLS, CARS and NeuroFuzzy and comparison also made to show the result of research process. Fig. 6 ensure the performance of PLS, CARS and Neurofuzzy in individual mode. Weights are allocated at random because at the beginning its not sure what they should be, and the Fuzzy neural network adjusts them incrementally as it learns to provide more accurate results. During our research process we found the proper threshold which is 0.8 and 0.9 for more accurate outputs.
6.1 Performance Comparison of the Proposed NF_CM + PLS with PLS and CARS
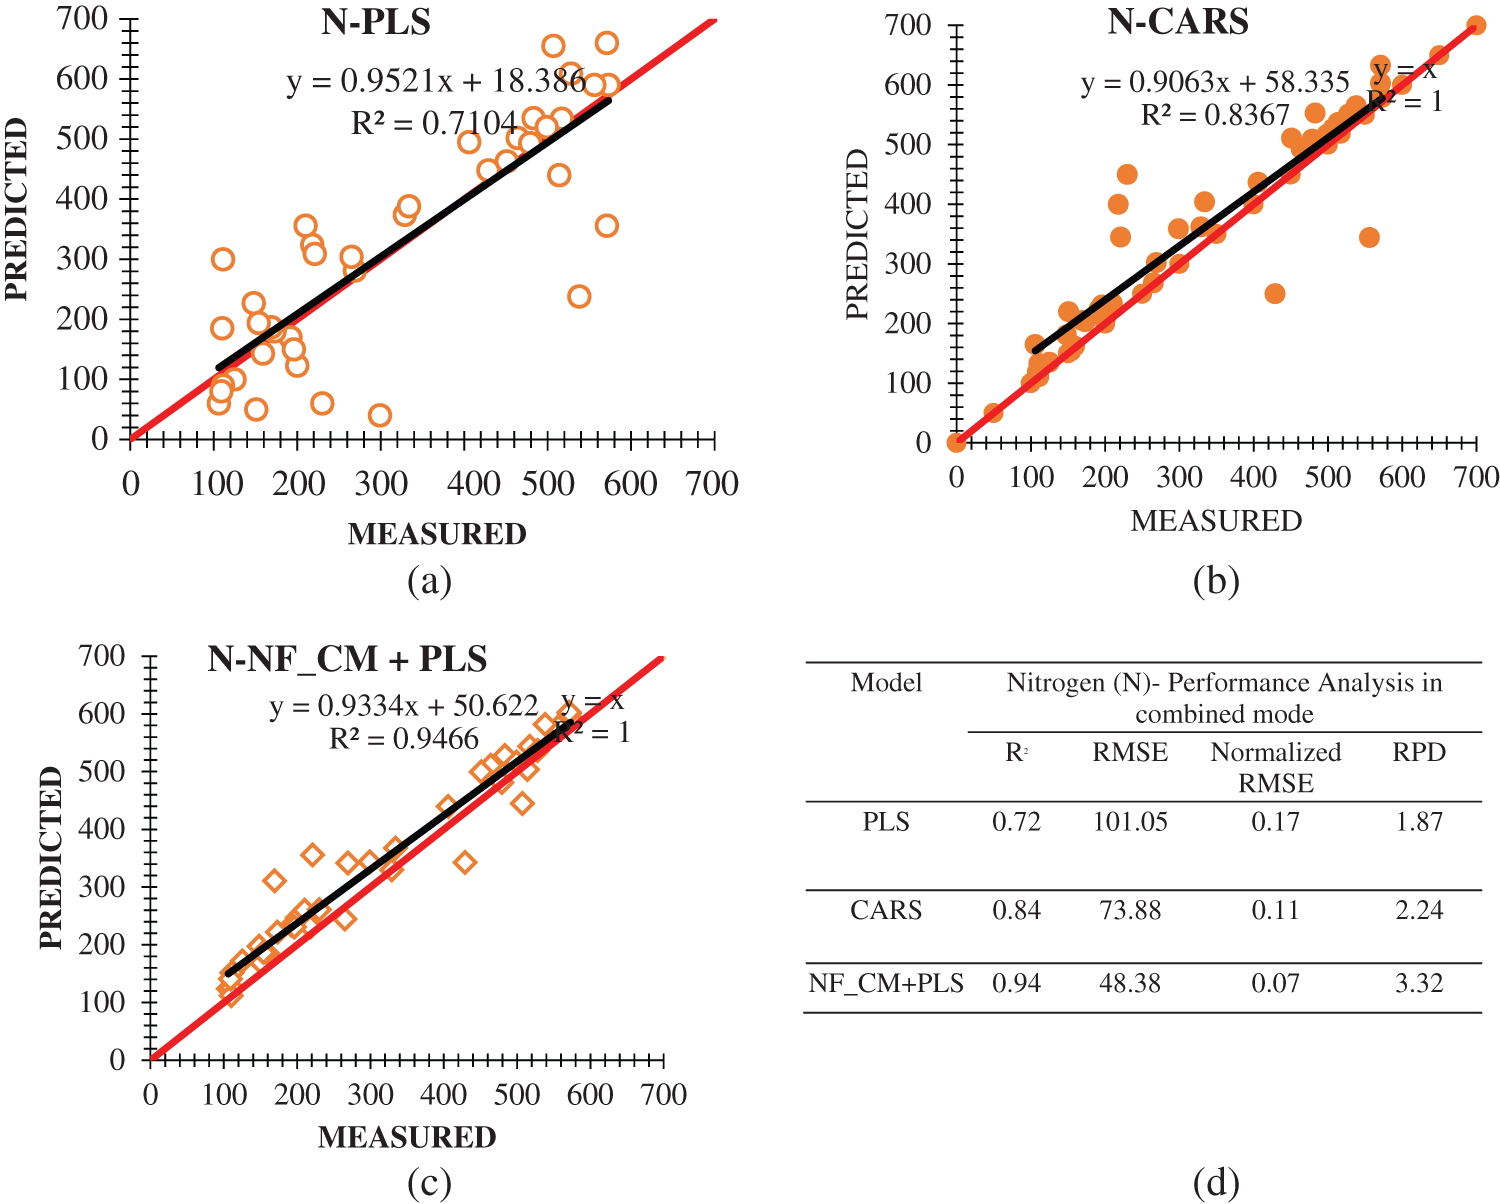
Figure 5: Scatterplot of measured and estimated nitrogen concentration with (a) PLS (b) CARS (c) neuro-fuzzy combined mode + PLS (d) performance comparison
6.2 Performance Comparison of the Proposed System with PLS and CARS in Individual Mode
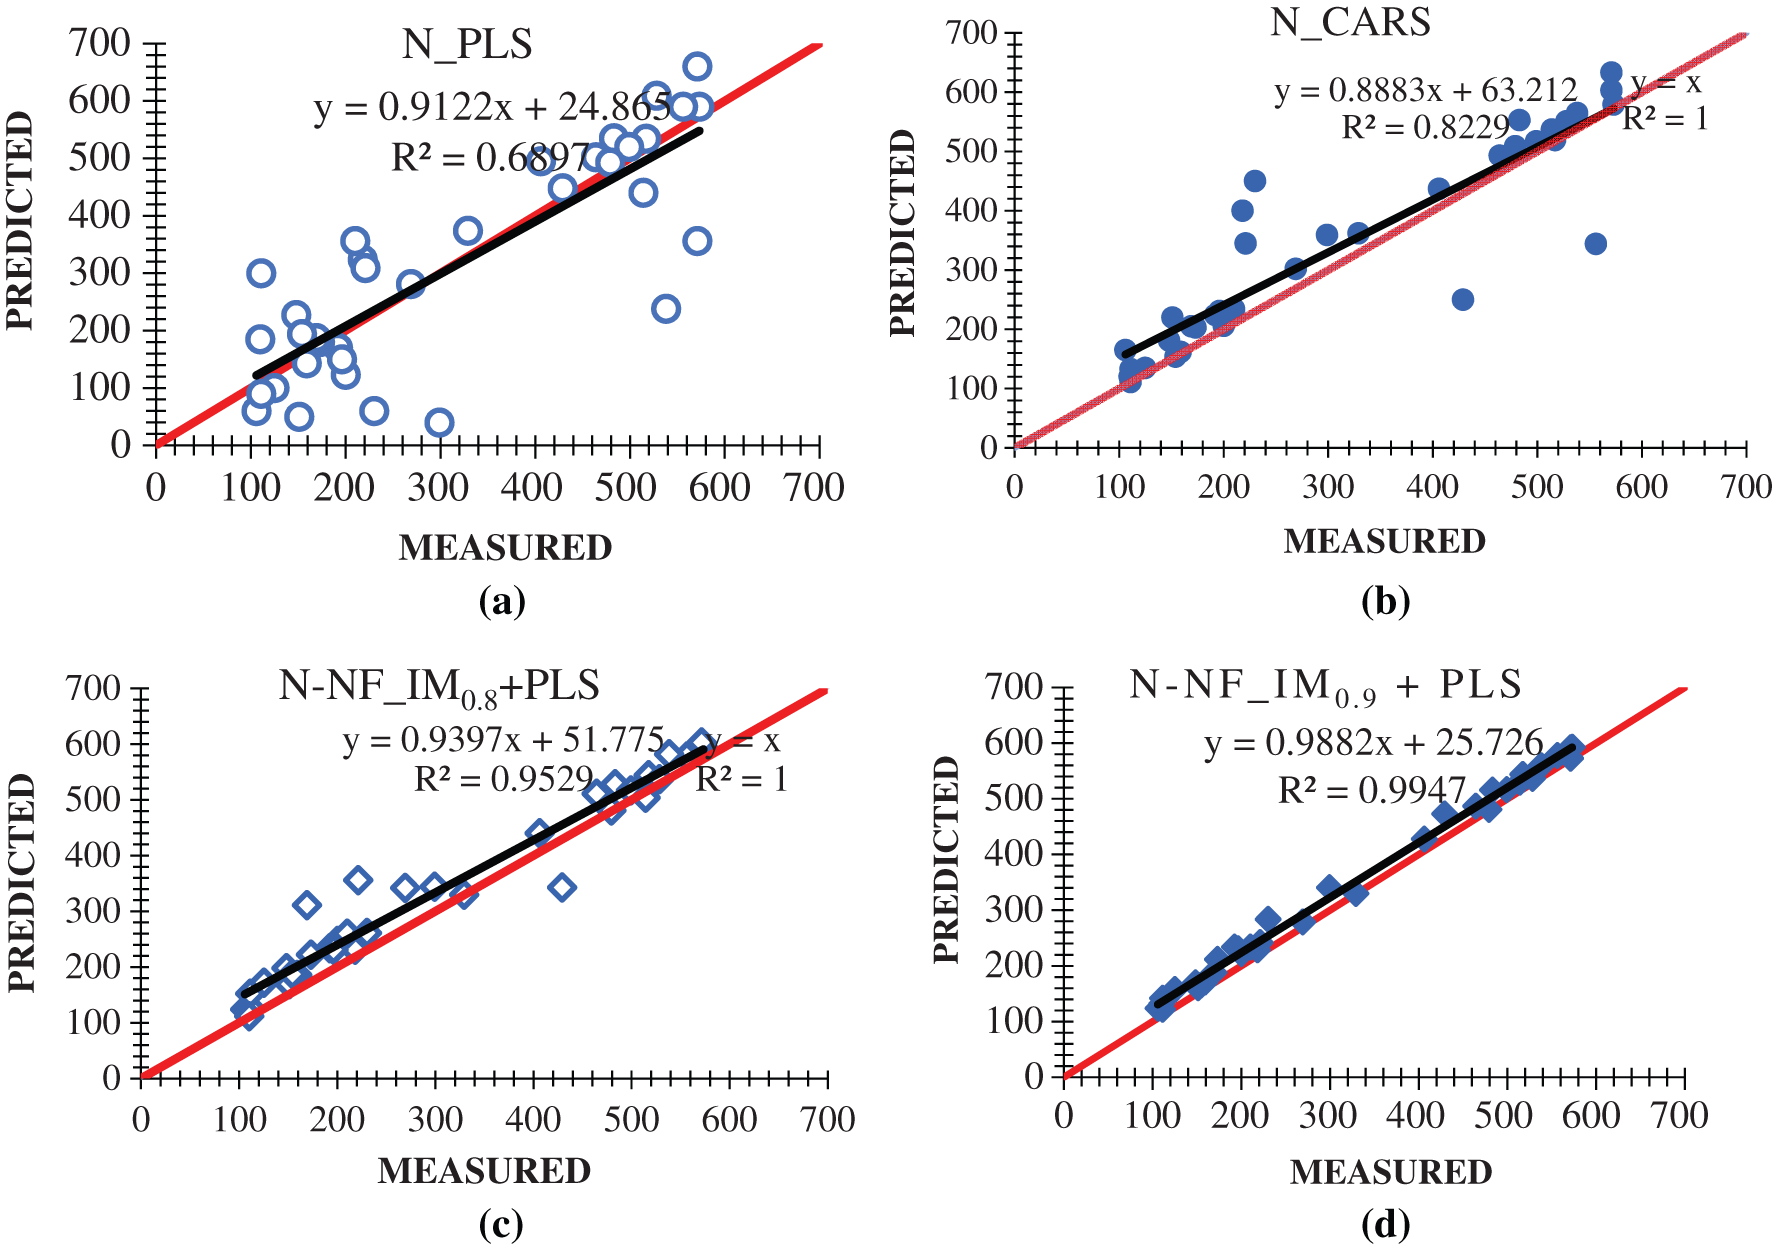
Figure 6: Scatterplot of measured and estimated nitrogen concentration with (a) PLS (b) CARS (c) neuro–fuzzy (individual Mode) with 0.8 threshold + PLS (d) neuro-fuzzy (individual mode) with 0.9 threshold + PLS
The soil health can be preserved by applying appropriate level of macronutrients such as nitrogen, phosphorus and potassium in the soil. The yield is affected by a lack of macronutrients in the soil. Excessive use of soil macronutrients, on the other hand, might pollute surface and ground water. Therefore, a nondestructive and pragmatic strategy is required to sense the soil macronutrients. Optical sensing method that uses reflectance spectroradiometer to acquire the spectral signature of the soil, has been discussed in this paper . The sensitive wavebands can be determined using the fuzzy waveband assessment index, which was developed in terms of membership values denoting the degree of similarity between a signature and a class both in the provided and reduced spaces. This concept can be used to create low-cost, high-efficiency optical sensors. The analysis was conducted for Nitrogen combined class mode and individual mode. The set of wavebands that minimizes the fuzzy index was identified in a neural network formulation under supervised learning mode. The new supervised neuro-fuzzy approach for sensitive waveband selection was the contribution of this paper. The threshold for the weight in both modes was set as 0.8. The set of optimal wavebands identified in the present system is tested using PLS model. The performance of the present system is comparable with the popular existing approaches.
Funding Statement: The authors received no specific funding for this study.
Conflicts of Interest: The authors declare no conflict of interest regarding the publication of the paper.
1. M. Acharyya, K. D. Rajat and M. K. Kundu, “Extraction of features using M-band wavelet packet frame and their neuro fuzzy evaluation for multi texture segmentation,” IEEE Transactions on Pattern Analysis and Machine Intelligence, vol. 25, no. 12, pp. 1639–1644, 2003. [Google Scholar]
2. A. Xiaofei, L. Minzan and L. Zheng, “Estimation of soil total nitrogen and soil moisture based on NIRS technology,” in Proc. CCTA, Germany, vol. 369, pp. 639–646, 2011. [Google Scholar]
3. X. An, M. Li, L. H. Zheng, Y. Liu and H. Sun, “A portable soil nitrogen detector based on NIRS,” Precision Agriculture, vol. 15, no. 1, pp. 3–16, 2014. [Google Scholar]
4. T. Shi, L. Cui, J. Wang, T. Fei,Y. Chen et al., “Comparison of multivariate methods for estimating soil inorganic nitrogen with visible/near-infrared spectroscopy,” Plant and Soil, vol.17, no.5 pp. 363–375, 2013. [Google Scholar]
5. A. Pudelko and M. Chodak, “Estimation of total nitrogen and organic carbon contents in mine soils with NIR reflectance spectroscopy and various chemometric methods,” Geoderma, vol. 368, pp. 702–709, 2014. [Google Scholar]
6. M. Qu, L. Weidong and C. Zhang, “County scale spatial variability of macronutrient availability ratios in paddy soils,” Applied and Environmental Soil Science, vol.3, 2014. [Google Scholar]
7. G. Rajendram and K. Devey, “Comparison between mid-infrared and near-infrared for soil analysis,” Applied Spectroscopy, vol. 1, pp. 1–10, 2011. [Google Scholar]
8. K. A. Sudduth and J. W. Hummel, “Evaluation of reflectance methods for soil organic matter sensing,” Transaction of the ASAE, vol. 34, no.4, pp. 1900–1909, 1991. [Google Scholar]
9. W. Fan, Y. Shan, G. Li and Y. Liang, “Application of competitive adaptive reweighted sampling method to determine effective wavelengths for prediction of total acid of vinegar,” Food Analytical Methods, vol. 5, no. 3, pp. 585–590, 2012. [Google Scholar]
10. R. T. Mehrjardi, N. Toomanian, A. R. Khavaninzadeh, A. Jafari and J. Triantafilis, “Predicting and mapping of soil particle size fractions with adaptive neuro-fuzzy inference and ant colony optimization in central Iran,” European Journal of Soil Science, vol. 67, pp. 707–725, 2016. [Google Scholar]
11. R. Goodarzi, M. Mokhtarade and Z. M. Javad, “Robust fuzzy neural network model for soil lead estimation from spectral features,” Remote Sensing, vol. 7, pp. 8416–8435, 2015. [Google Scholar]
12. K. W. Daniel, N. K. Tripathi and K. Honda, “Artificial neural network analysis of laboratory and in situation spectra for the estimation of macronutrients in soils of lop buri,” Australian Journal of Soil Research, vol. 41, pp. 47–59, 2003. [Google Scholar]
13. B. S. Harish and C. K. Roopa. “Automated ECG analysis for localizing thrombus in culprit artery using rule based information fuzzy network,” International Journal of Interactive Multimedia and Artificial Intelligence, vol. 6, pp. 16–25, 2020. [Google Scholar]
14. S. Zhang, L. Xia, Z. Yuanzhi, G. Nie and Y. Li, “Estimation of soil organic matter, total nitrogen and total carbon in sustainable coastal wetlands,” Sustainability, vol. 11, no. 667, pp. 1–18, 2019. [Google Scholar]
15. M. L. Jackson, “Soil chemical analysis,” Prentice Hall of India Pvt. Ltd, New Delhi, 1967. [Google Scholar]
16. M. Mohammad, M. G. Nooghabi and Z. Ahmedi, “An intelligent technique for grape fanleaf virus detection,” International Journal of Interactive Multimedia and Artificial Intelligence, vol. 6, pp. 62–67, 2020. [Google Scholar]
17. P. K. Mutuo, K. D. Shepherd, A. Albrecht and G. Cadisch, “Prediction of carbon mineralization rates from different soil physical fractions using diffuse reflectance spectroscopy,” Soil Biology and Biochemistry, vol. 38, pp. 1658–1664, 2006. [Google Scholar]
18. B. G. Barthes, D. Brunet, H. Ferrer, J. L. Chotte and C. Feller, “Determination of total carbon and nitrogen content in a range of tropical soils using near infrared spectroscopy influence of replication and sample grinding and drying,” Journal of Near Infrared Spectroscopy, vol. 14, pp. 341–348, 2006. [Google Scholar]
19. B. V. Subbaiah and G. L. Asija, “A rapid procedure for the estimation of available nitrogen in soil,” Current Science, vol. 25, no. 8, pp. 259–260, 1956. [Google Scholar]
20. H. Yang, B. Kuang and A. M. Mouazen, “Quantitative analysis of soil nitrogen and carbon at a farm scale using visible and near infrared spectroscopy coupled with wavelength reduction,” European Journal of Soil, vol. 63, pp. 410–420, 2012. [Google Scholar]
 | This work is licensed under a Creative Commons Attribution 4.0 International License, which permits unrestricted use, distribution, and reproduction in any medium, provided the original work is properly cited. |