DOI:10.32604/csse.2022.023737
| Computer Systems Science & Engineering DOI:10.32604/csse.2022.023737 | |
| Article |
Breast Mammogram Analysis and Classification Using Deep Convolution Neural Network
1Department of Computer Science and Engineering, Sathyabama University, Chennai, 600119, India
2Department of Electrical, Electronics and Communication Engineering, NITTTR, Chennai, 600113, India
3Centre for Cyber Physical Systems, School of Computer Science and Engineering, Vellore Institute of Technology (VIT), Chennai, 600127, India
4School of Computer Science and Engineering, Vellore Institute of Technology (VIT), Chennai, 600127, India
*Corresponding Author: G. Kulanthaivel. Email: gkvel@nitttrc.ac.in
Received: 19 September 2021; Accepted: 27 October 2021
Abstract: One of the fast-growing disease affecting women’s health seriously is breast cancer. It is highly essential to identify and detect breast cancer in the earlier stage. This paper used a novel advanced methodology than machine learning algorithms such as Deep learning algorithms to classify breast cancer accurately. Deep learning algorithms are fully automatic in learning, extracting, and classifying the features and are highly suitable for any image, from natural to medical images. Existing methods focused on using various conventional and machine learning methods for processing natural and medical images. It is inadequate for the image where the coarse structure matters most. Most of the input images are downscaled, where it is impossible to fetch all the hidden details to reach accuracy in classification. Whereas deep learning algorithms are high efficiency, fully automatic, have more learning capability using more hidden layers, fetch as much as possible hidden information from the input images, and provide an accurate prediction. Hence this paper uses AlexNet from a deep convolution neural network for classifying breast cancer in mammogram images. The performance of the proposed convolution network structure is evaluated by comparing it with the existing algorithms.
Keywords: Medical image processing; deep learning; convolution neural network; breast cancer; feature extraction; classification
One of the main factors that increases the mortality rate in women worldwide is carcinoma. The number of cancer instances anticipated in 2025 is 19.3 million, the Ministry of Health (WHO) reports. Cancer is a growing issue in Egypt, with carcinoma in particular. As of now, mammography has become one of the key premature breast cancer detection techniques. A more appealing option to mammograms is magnetic resonance testing (MRI). Moreover, MRI is used to verify the presence of cancer by radiologists. MRI is a disadvantage if the person can create an adverse response to the competing drug, or inflammation of the body can grow at the initiation site. As a result, Claustrophobia may be caused. Two major premature indications of cancer, as shown in Fig. 1, are masses and micro calcifications.
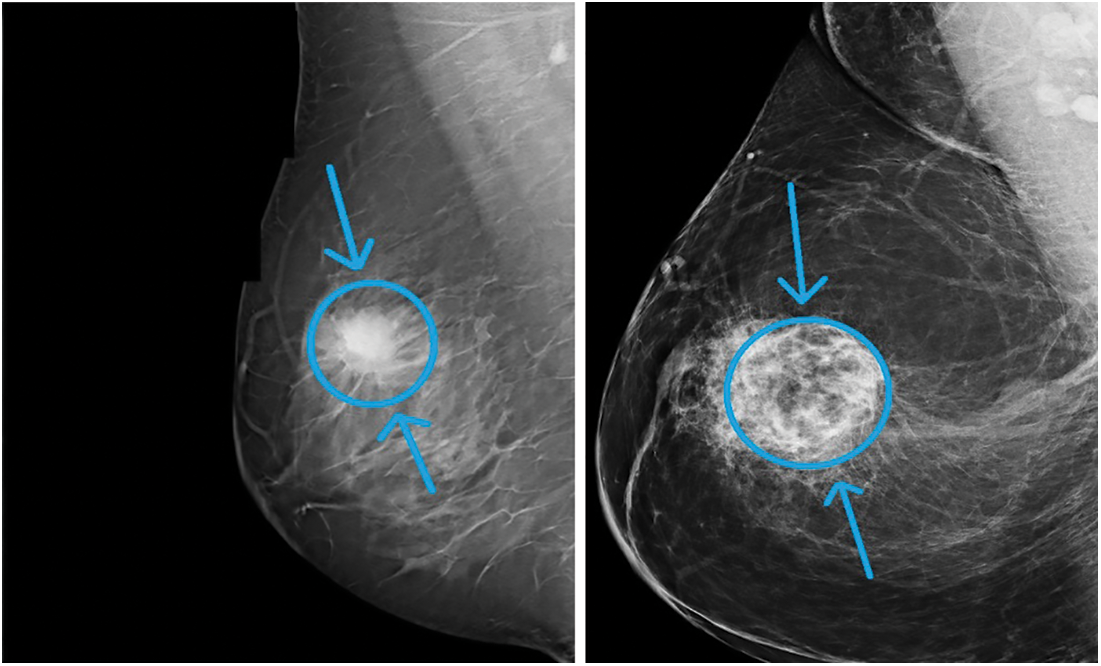
Figure 1: Sample breast mammogram
According to recent research, carcinoma is the most frequent form of the disease in females, [1]. It accounts for roughly one-fifth of the finely discovered disease in America, said in [2]. The female death level is also elevated with 17% of fatalities from disease, given in [3]. Precise premature identification and evaluation of breast disease are essential in lowering the death frequency. Till date, mammography is the most helpful instrument for testing the overall public. Furthermore, the exact identification and analysis of a chest lesion based on mammographic results alone are hard and very dependent on the radiologist’s knowledge which contributes to many fake benefits and further examinations [4].
In the decision-making phase of radiologists, computer-aided identification and treatment (CAD) technologies are already being employed. Substantial work can be reduced by these technologies in clinical exercise to evaluate a lesion and reduce the number of incorrect positives leading to useless and troublesome biopsies. CAD mammography technologies can handle two distinct functions: mammogram suspected lesions identified (CADe) and CADx (Classification as harmless or malignant).
Deep knowledge in multiple computers training functions, including identifying objects and ranking, is a major ground-breaking technique in the latest years. In contrast to standard computer training techniques, which involve a handcrafted, complex function analysis phase based on subject expertise, the proper functional analysis method is appropriately learned from initial information regarding the destination performance. This avoids the complex design process and investigates the capacity of characteristics to discriminate while enabling techniques to be reproduced. This paper focused on providing an automatic and efficient breast cancer classification algorithm for breast cancer images. A deep convolutional neural network algorithm is used to learn, extract, and classify the features of the breast input images. Finally, the performance of the proposed convolution neural network algorithm is evaluated.
Apart from conventional signs there are other signs of breast cancer, like structural deformation [5], which are less important. Either a healthy or malignant body may be. The distinction between healthy and malicious tumors is that the former is round or rectangular, whereas the latter has an irregularly curved form. Moreover, the harmful mass appears whiter than any adjacent tissue [6]. Some scientists recently suggested techniques for the estimation of breast mass in mammographic pictures. A separate transformer wavelet (DWT), transforming the contourlet, and the major element (PCA) techniques for extracting characteristics are used by [7]. That scheme could identify ordinary and unusual cells and rank them. There are several classifications for both tumors. Nearly 98% of the level was attained. As a removal method for mass defects in the breast, [8] used DWT. A reference was also implemented to classify ordinary, unusual cells and harmless and cancerous micro-organisms utilizing the supporting vector devices (SVM) with Robotic Neural Networks (ANN). The identification frequency for ANN was accomplished at 96% and for SVM at 98% [8]. The Daubechies wavelet group features db2, db4, db8 and db16 were implemented to identify MCs by [9]. The level of precision attained was nearly 80 percent. Mass mutations were identified by DWT and SVM from [10], with the resulting frequency at 92 times. The profound co-evolutionary wireless (DCNN) network was used in [11] by implementing the transition knowledge in the DCNN. The awareness of distinguishing force from ordinary tumors was 89.9 percent using the electronic mammography imaging system (DDSM), [12]. The survey showed the DCNN mammographic CAD apps for the first time. The cross-scale trust service in detecting numbers in mammograms was used by [13]. As a result of INbreast and DDSM-BCRP, data achieved a sensitiveness of 85 percent to 90 percent. The authors in [13] have a small volume of the practice data range as its primary disadvantage. There were 39 and 40 instances in the practice and screening. The DCNN and SVM were used by [14]. Using an INbreast set of data, the awareness attained was 98.44%. The MRI chest tumors used by the sensory mirror propagation network (BPNN) were categorized by [15].
The region below the receiver working features (ROC) profile was discovered to be 0.913. For classifications of ordinary and unusual breast lesions, [16] used the convolutional neural network (CNN). They utilized average and sub-samples in two segmentation methods—the next method used removal techniques of texture used in the ROI for tiny sub-regions. The findings were 90% real favourable (TPR) and 31% fake favourable (FPR), and findings were acquired. Harmless and malicious weights were classified [17] by AlexNet in a DDSM set of data mammograms with 66% accuracy. In order to identify harmless and malicious cancers, [18] have used DCNN characteristics. The region below the AUC (curve) was 0.81. and the latest BCDR-F03 dataset was launched by [19]. The GoogleNet and AlexNet were used to categorize breast lesions, with an AUC of 0.88 and 0.83. The authors in [20] suggested an outcome to deep multipurpose mass-classification networks trained based on the mammogram and not the area of interest.
The premature identification of carcinoma is the most accurate radiological method. Mammograms are successful in decreasing the mortality levels of carcinoma by 30–70 percent, [21]. Mammograms are hard to understand because the identification of lesions in them relies on the knowledge of radiologists and also on the accuracy of the picture. Misinterpretation or ignoring breast cancer indications causes mis diagnostic mistakes. Some 43 percent of the missed defects were triggered by 52 percent mistakes while ignoring signs, [22]. The increased identification of defects in the mammogram is because of radiologists ‘bad picture performance, nose exhaustion, and supervision. Double learning and computer helped detection and diagnostics (CAD), [23] have been implemented to address the challenges that occurred with mammogram screening, thereby increasing the accuracy of breast cancer detection at its earliest stage and thereby reduces the number of needless breast biopsies. Two radiologists examine a certain mammogram and adopt a choice in the Dual Reading solution. While double learning can considerably boost testing sensitivity and efficiency, it is impossible to do so with the related heavy price and volume of work. The CAD method was also presented. It mixes forensic imagery with software physics, imagery and model identification, and technology for robotics. CAD thus is the perfect pair of radiologists ‘eyes, which makes it necessary to read the mammogram instead of two, by only one radiologist. It decreases the burden of the radiologists and decreases the price while enhancing the awareness of premature identification of breast cancer. CAD has improved its breast cancer identification by 7.62 times in its study by [24]. Furthermore, [25] reported a substantial increase in radiologist awareness by 21,2% due to CAD, which resulted in improved identification of skin disease.
A range of technologies has been created over the last years to improve the precision of current CAD structures. Still, some are entirely reliant on preprocessing, fragmentation, and handmade processing methods that influence the effectiveness of CAD structures. Deep-search methods currently provide excellent achievement in addressing computer design and teaching tasks. The authors in [26], in addition to handmade characteristics, can learn instantly several high-level characteristics which therefore enhance the precision of the CAD system, [27,28].
In particular, the CAD technology for the identification of carcinoma was developed and enhanced with profound learning, [29]. This article mainly implements a profound training strategy to classify and locate carcinoma population based on two associated phases: firstly, the pre-trained ResNet 50 method is used to extract and classify representatives of high-level characteristics from mammograms into normal or mass. Then a Class Activation Map (CAM) method for locating the carcinoma population was applied.
The existing manuscript described by [30] provides a fresh CAD scheme concerning literary works for classifying harmless and malicious mammograms with MSVM (Multiclass SVM), depending on a deeper teaching environment. A pair of segmentation methods are used as the primary input: (1) manual segmentation of the ROIs and (2) limit and regional technique. It is used as the instrument for extracting features, whereas the last (FC) part of the SVM is attached to the SVM to provide more substantial rankings outcomes. The trials are also conducted on two data sources; (1) the DDSM and (2) the DDSM Curated Breast Visualization Subset (CBIS-DDSM). The results obtained using this existing algorithm are used for comparing with the proposed approach.
Very recently a multi-scale attention network with hierarchical block-wise and layer-wise feature representation capability [31] has been proposed. Also, A YOLOV4 based CAD system [32] to localize lesions in full and cropped mammograms was developed to classify lesions to obtain their pathology type. Another approach based on Generative Adversarial Networks (GAN) and bilateral asymmetry [33] has been used for detection of breast cancer. An ISFET based CMOS integrated Lab-on-Chip (LoC) system, coupled with variant-specific isothermal amplification chemistries, for detection and discrimination of wild type (WT) from mutant (MT) copies of the ESR1 gene [34] was also carried out. The proposed approach out performs these approaches in terms of accuracy of classifying.
Most modern research works proposed the use of pre-trained systems against scratch learning. However, the latest networks are intended and evaluated on many distinct datasets, distinct in design and various groups of size, more extensively than the mammographic data sets accessible. As a result, the capability and difficulty of such networks can far exceed the requirements of larger data sets, contributing to significant negative reactions in test practice. Consequently, there have been several books whose writers suggest instruction from scratch. Taking this into account, we examine the efficiency of various networks in this article. We analyze each network’s efficiency in two situations: first includes initiation of pre-trained weights practice, and, secondly, discrete weights are applied to the networks.
3.1 AlexNet Algorithm in Deep Learning
The first CNN network that displayed excessive advances in object tracking and recognition was AlexNet. As Fig. 2 shows, this network consists of 8 parts, with the first five being fully associated with the other three. A system’s first screening level (224 × 224) controls the entry picture, using 96 × 11 × 11 kernels, with a range of 4 pixels. The kernel size equates to the amount of reference picture streams. After local reaction normalization and max-pooling have been implemented and 256 kernels of volume 5 × 5 × 96 are filtered, the second element requires the yield of the first level variable. Without interfering bundling or normalization, the 3rd, 4th, and 5th strata are linked. 384 kernels in the 3rd level are 3 × 3 × 256 kernels. This fourth phase consists of 384 3 × 3 × 394 kernels and 256 3 × 384 kernels. Two fully linked plates with 4096 cells are attached to the bottom of the coevolutionary plates. In the fifth phase, fully integrated strata, the number of cells equals the number of courses. In addition to the specific design of the network writers also implemented some new characteristics to add significantly to the network’s learning and generalization capacity. The most significant characteristic of this process is that the normal equation for activation of the neuron (logistic and hyperbolic) has been substituted by the resolved linear equation
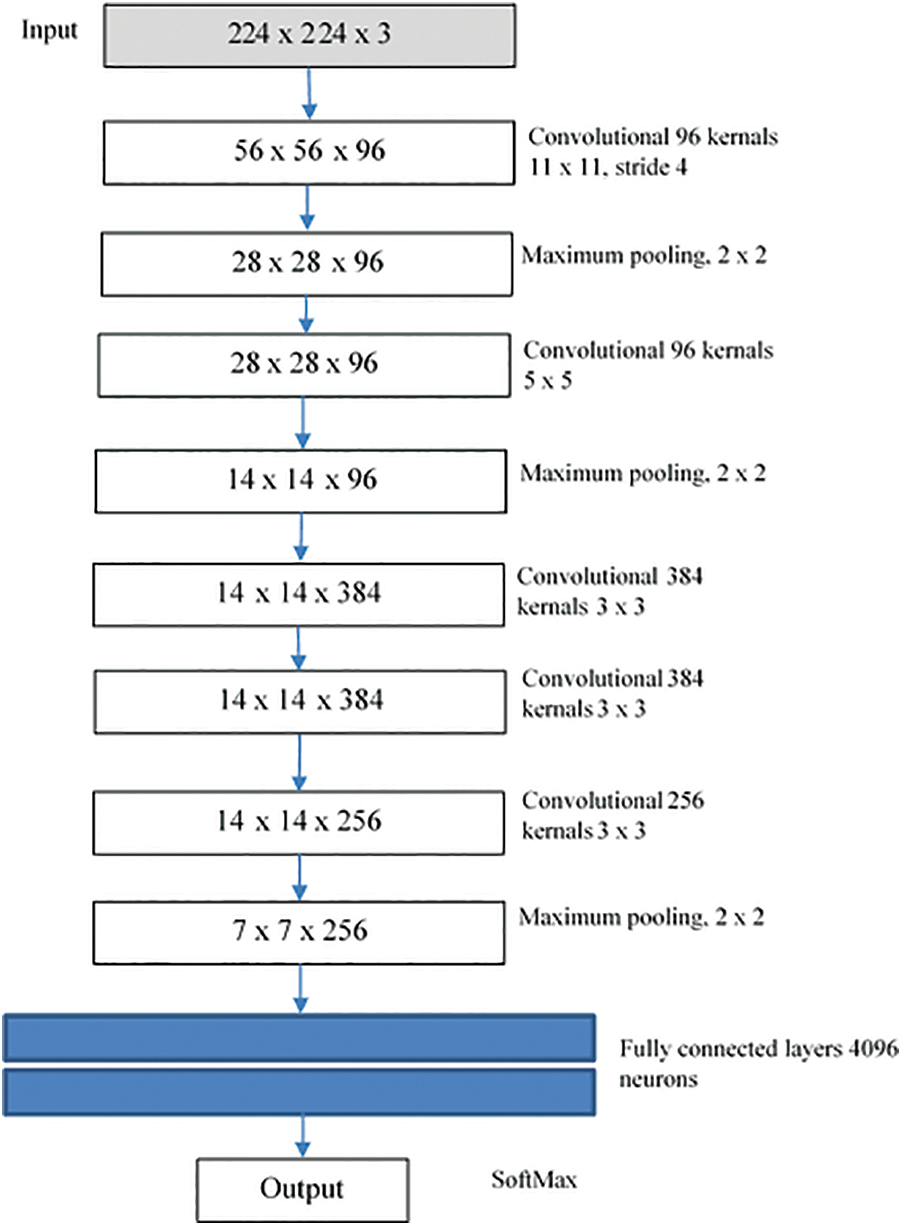
Figure 2: AlexNet structure
The use of drop-out (probably 0.5) for the three interconnected parts was especially crucial in practice. This method involves putting the production of each concealed neuron to null with some likelihood. The selected neurons do not add to either front or rear spread. Therefore, a distinct structure is sampled in each practice iteration. The withdrawal method functions as a regularize and forces the network to know relevant characteristics but reduces learning time.
For improving the accuracy of the proposed approach, training and testing phases are carried out. 60% of the dataset is used in the training phase, and the remaining dataset is used for the testing process. The mammogram image is collected from datasets such as MIAS from the various benchmark (available publicly on the internet). The performance of the proposed convolution neural network is evaluated by experimenting on various datasets like DDSM-400 (Digital Database for Screening Mammography) and CBIS-DDSM (saturated Beast Imaging Subset of DDSM). A set of sample images under benign and malignant are taken from the dataset, trained, and fine-tunned for the testing process. DDMS dataset comprises 400 images, mass extracted using ROI method from the screening process. Expert radiologists verify the dataset to obtain an accurate region of the mass. CBIS-DDSM dataset is updated up to date, having 10,300 mammogram images with two classes of benign and malignant. The two phases of the proposed approach are given in Fig. 3.

Figure 3: Two phases of proposed approach
In this paper, AlexNet is designed for detecting the available patterns in the input image. Initially, the convolution layers learn the available features of the images and can be interpreted easily. The next layers learn the small and hidden features. Finally, the last layer has done a detailed classification by integrating all the features obtained from the previous layers. The deep convolution network comprises eight layers depicted in Fig. 3. The first two layers are convolution and pooling layers, the next three layers are convolution layers, then one pooling layer, and finally two fully connected layers. The input image is grayscale. All the neurons calculate the dot product of the local region and weight connected with the volume of the input image.
In the experimental setup, the input layers are changed in the AlexNet from 224 × 224 into 512 × 512. Sometimes, instead of Fully Connected layers, ReLU and max-pooling is included in the same size.
The FC layer size is decreased, and it follows the ReLU layer, where again it is followed by the FC layer for each class. The performance is verified in each round of various AlexNet architectures. Finally, the training model of each architecture is used in the testing phase.
In this architecture, while thinking about the fully connected layer, each neuron in the neural network in the previous layers is connected with its own defined weight. A flattened image is fed as input to the model for easy feature processing. It is not shared among the neurons. One of the main things to be followed in the implementation is to convert the 3D to 2D, 2D to 1D for classification. In this paper, one architecture converts the 2D into a 1D array with a size of 1600. The hidden layers in this architecture are 512, 256, and 128 nodes. These hidden layers convert the output from the input layer. The final output layer provides only two results which say the input is benign or malignant. This kind of architecture is illustrated in Fig. 4.

Figure 4: Architecture model-4 CNN for breast cancer classification
All the above-said models are experimented with many times by changing the learning rate and number iterations. Then the performance is compared with one another in terms of classification accuracy.
4 Performance Evaluation Parameters
Various evaluation parameters are used for evaluating the performance of the proposed approach. Some of the performance measures included in the classifier are uncertainty matrix, precision, ROC, AUC, and F1 score value. So many methods are available in assessing the performance. They will determine the accuracy of the detected and segmented region from the input image is verified as negative or positive. It determines the accuracy of the classifier. A confusion matrix is created for the classifier based on the accuracy values as TP, TN, FP, and FN. The term accuracy is the precision is the measure of the classifier’s accurate prediction. It gives the performance capacity of the entire classification. The precision in Eq. (1) is defined.
4.1 Receiver Operating Characteristic
One of the well-known techniques used to assess the accuracy of the proposed approach is ROC. First of all, the medical decision-making was carried out with a ROC analysis; therefore, it was used in medical imagery. ROC is a diagram representing the rate of true positive and the rate of false positive obtained by the proposed approach and is used to calculate the sensitivity and specificity, which are calculated using (3) and (4), respectively.
In the medical image processing methods, the AUC is used to evaluate designs depending on the mean of each stage in the ROC curve. The AUC rating should always be between ‘0’ and ‘1’ for the classification results, and including a more excellent AUC value provides a stronger rating performance.
Precision is the closest value positive ratings. It shows the exact measure not depending on the accuracy. It can be calculated as,
F1 is the weighted median accuracy and reminder. The classifier efficiency is evaluated by using it as a statistical measure. That is why this rating brings into consideration both false positives and false negatives. The rating for F1 is described in:
5 Experimental Results and Discussion
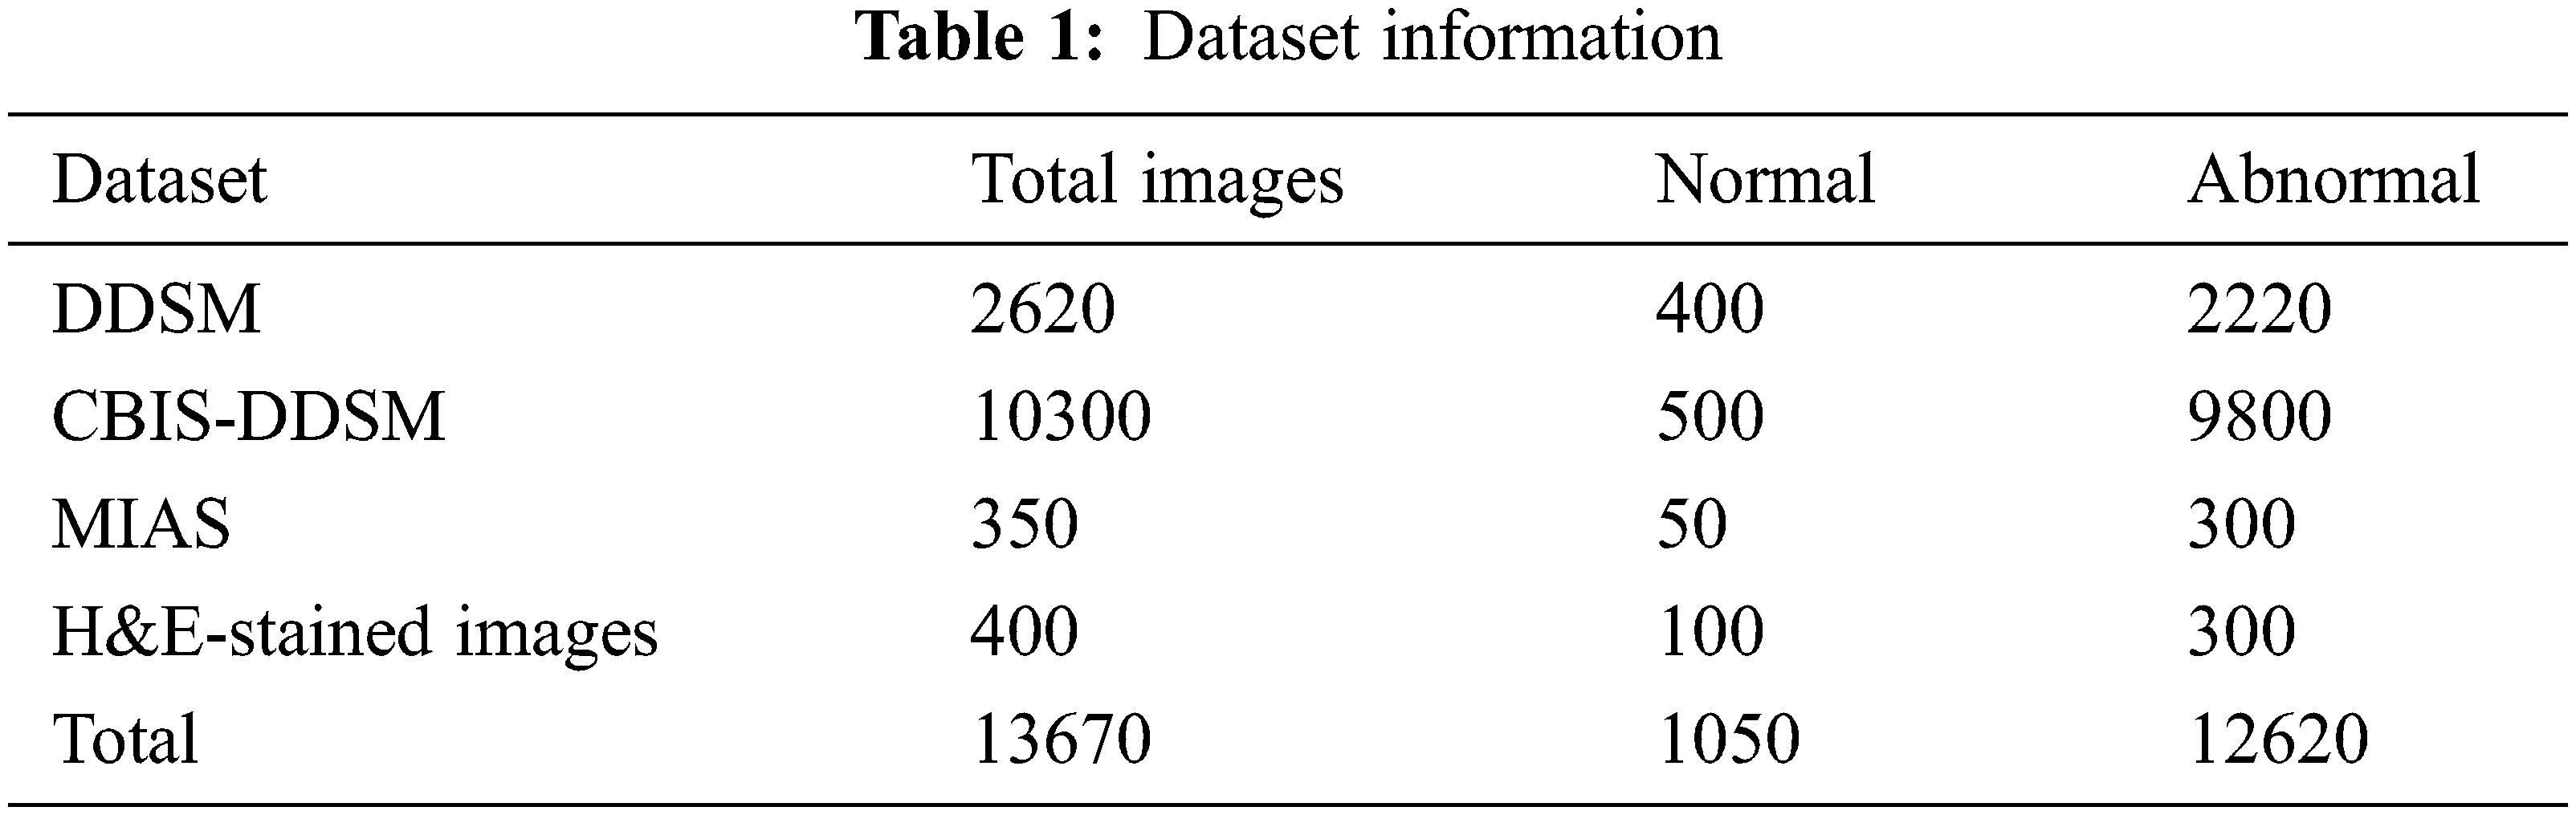
This paper implements and experiments with the proposed AlexNet Model for diagnosing mammogram images. It analyses the mammogram images for predicting benign and malignant. The datasets used in the experiment are DDSM, MIAS, and CBIS-DDSM. The proposed model is implemented in MATLAB software, and the dataset information is given in Tab. 1. All the datasets have two different categories of images, such as normal and abnormal. The datasets provided in Tab. 2 are benchmark datasets. By experimenting and comparing the results obtained on these datasets help evaluate the proposed model’s performance.
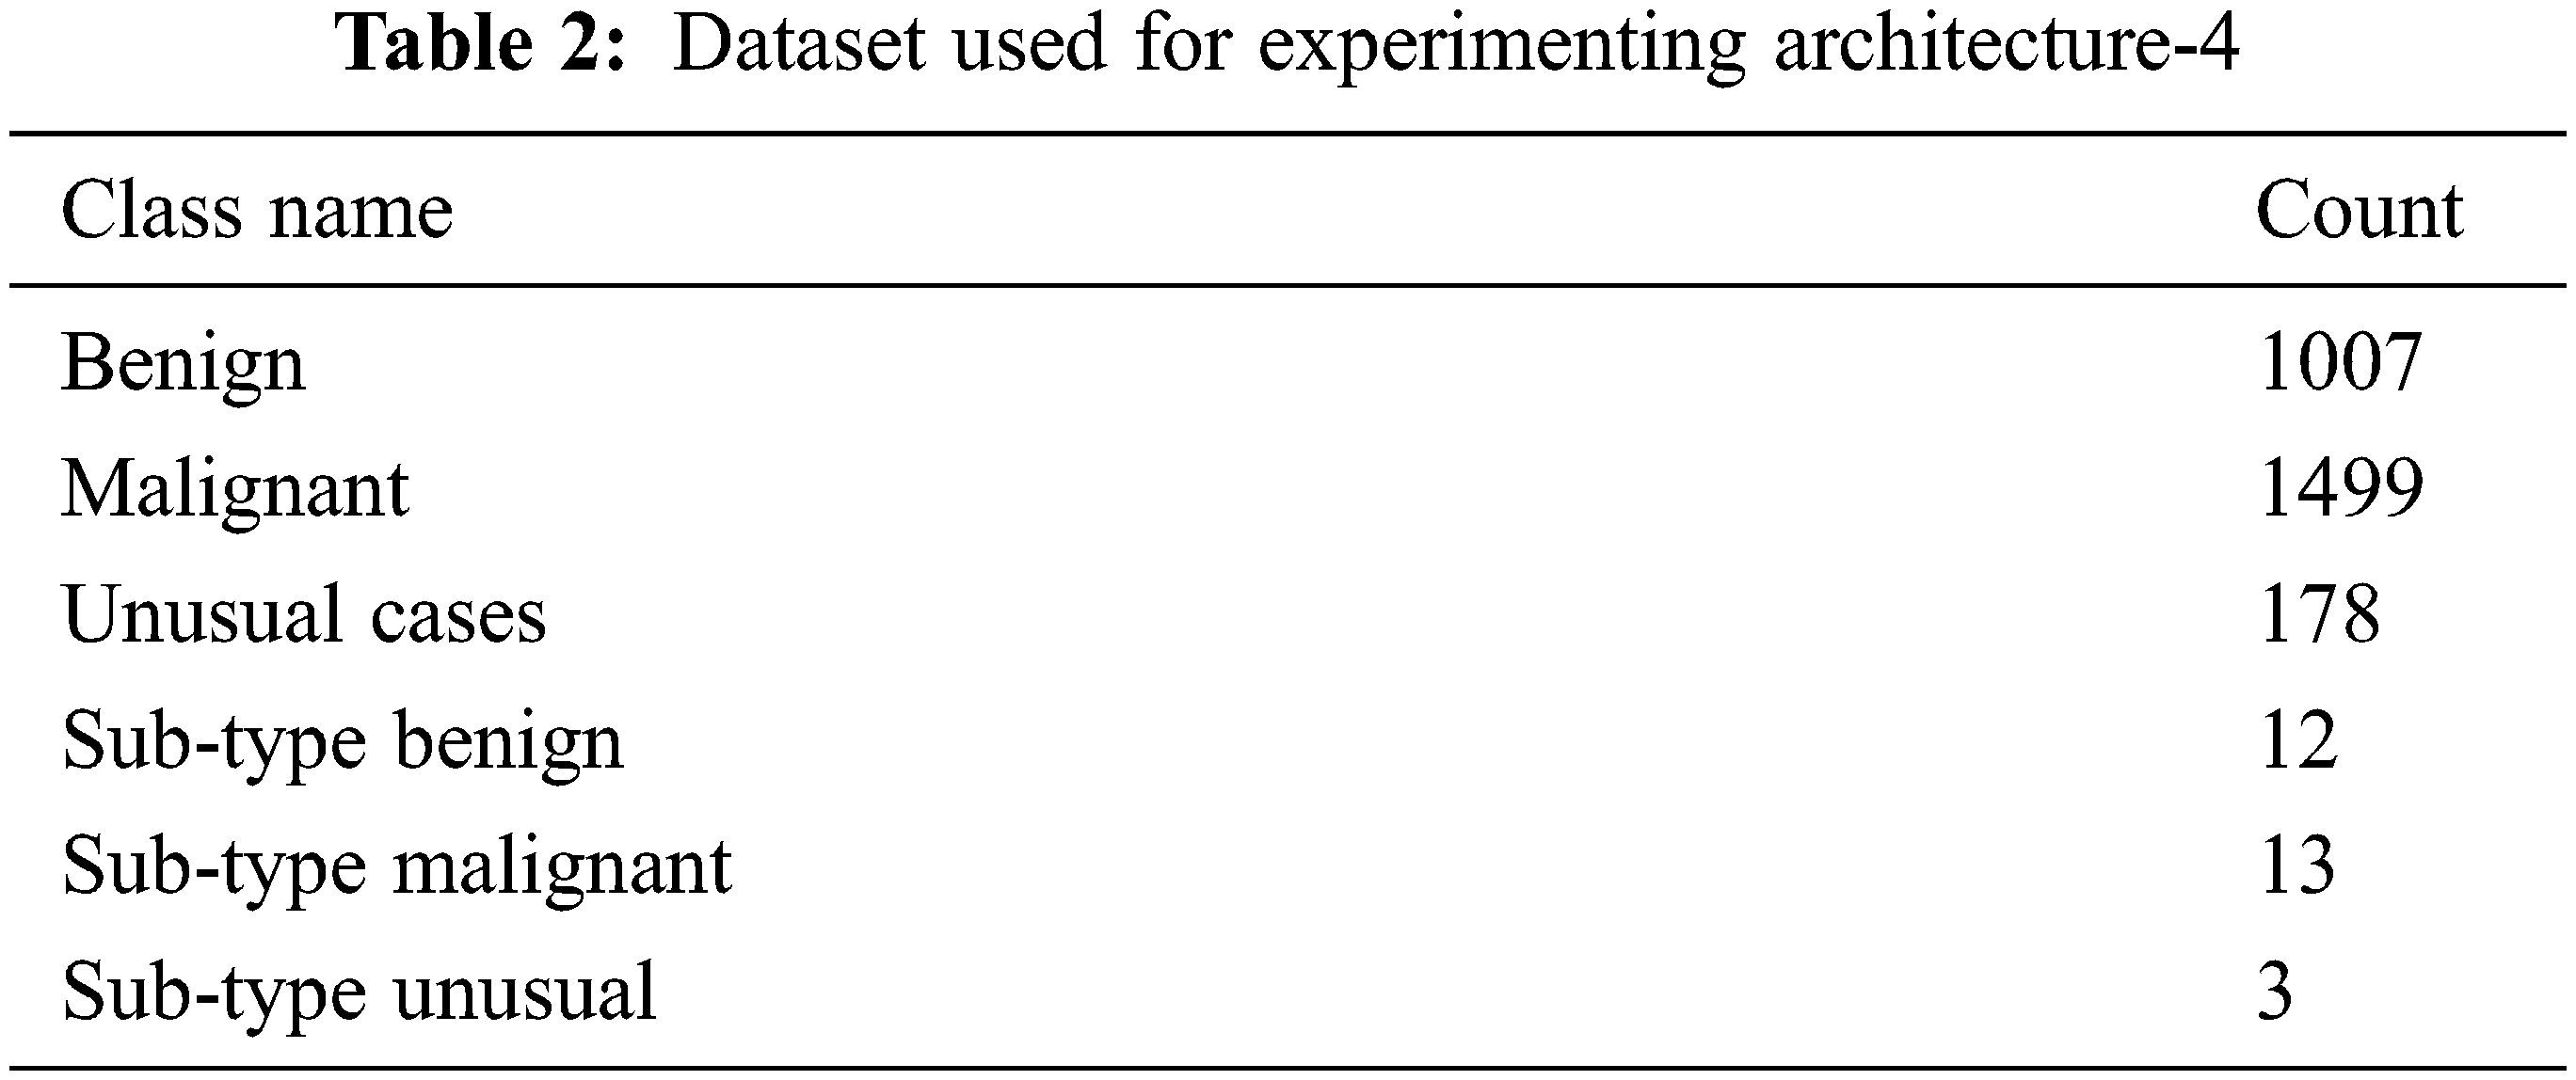
The dataset used to experiment and verify the performance of the proposed architecture-4 is given in Tab. 3. It is a raw dataset contains 2684 2D images (ultrasound images) in JPEG format. All the images used in this dataset are 400 × 400 pixels sized, and the pixel values are 0 to 255. This dataset also has subtypes of benign and malignant. All the images used in the dataset are not from the same source. So, the properties of the images are different. Experimenting with the proposed CNN architecture using this dataset can really help evaluate the approach’s performance. For understanding the classes of breast cancer, including the sub-types, a sample image is an input in the experiment. The corresponding classification results are shown in Fig. 5. It shows benign and malignant with various sub-types. Also, in the experiment, the input images are selected randomly from a huge number of images. There were 2000 images have been selected randomly and build a model (trained model) for evaluating the performance (testing process). The final classification result is compared with the predefined classes already available in the dataset. It ensures the performance evaluation is perfect.

Figure 5: Various cancer types and sub-types
The performance of the architecture-4 model is compared with the CNN and FCNN explained in [35], based on their results. The comparison results are shown in Fig. 6. From Fig. 6, it is identified that the proposed CNN architecture-4 model outperforms the other CNN and FCNN models. The performance is calculated by constructing a confusion matrix—the threshold value used for this is 0.5. By tuning the threshold values below 0.5 and above 0.5, the highest value of sensitivity is obtained. Also, it reduces the false-negative ratio.

Figure 6: Performance evaluation of various CNN models
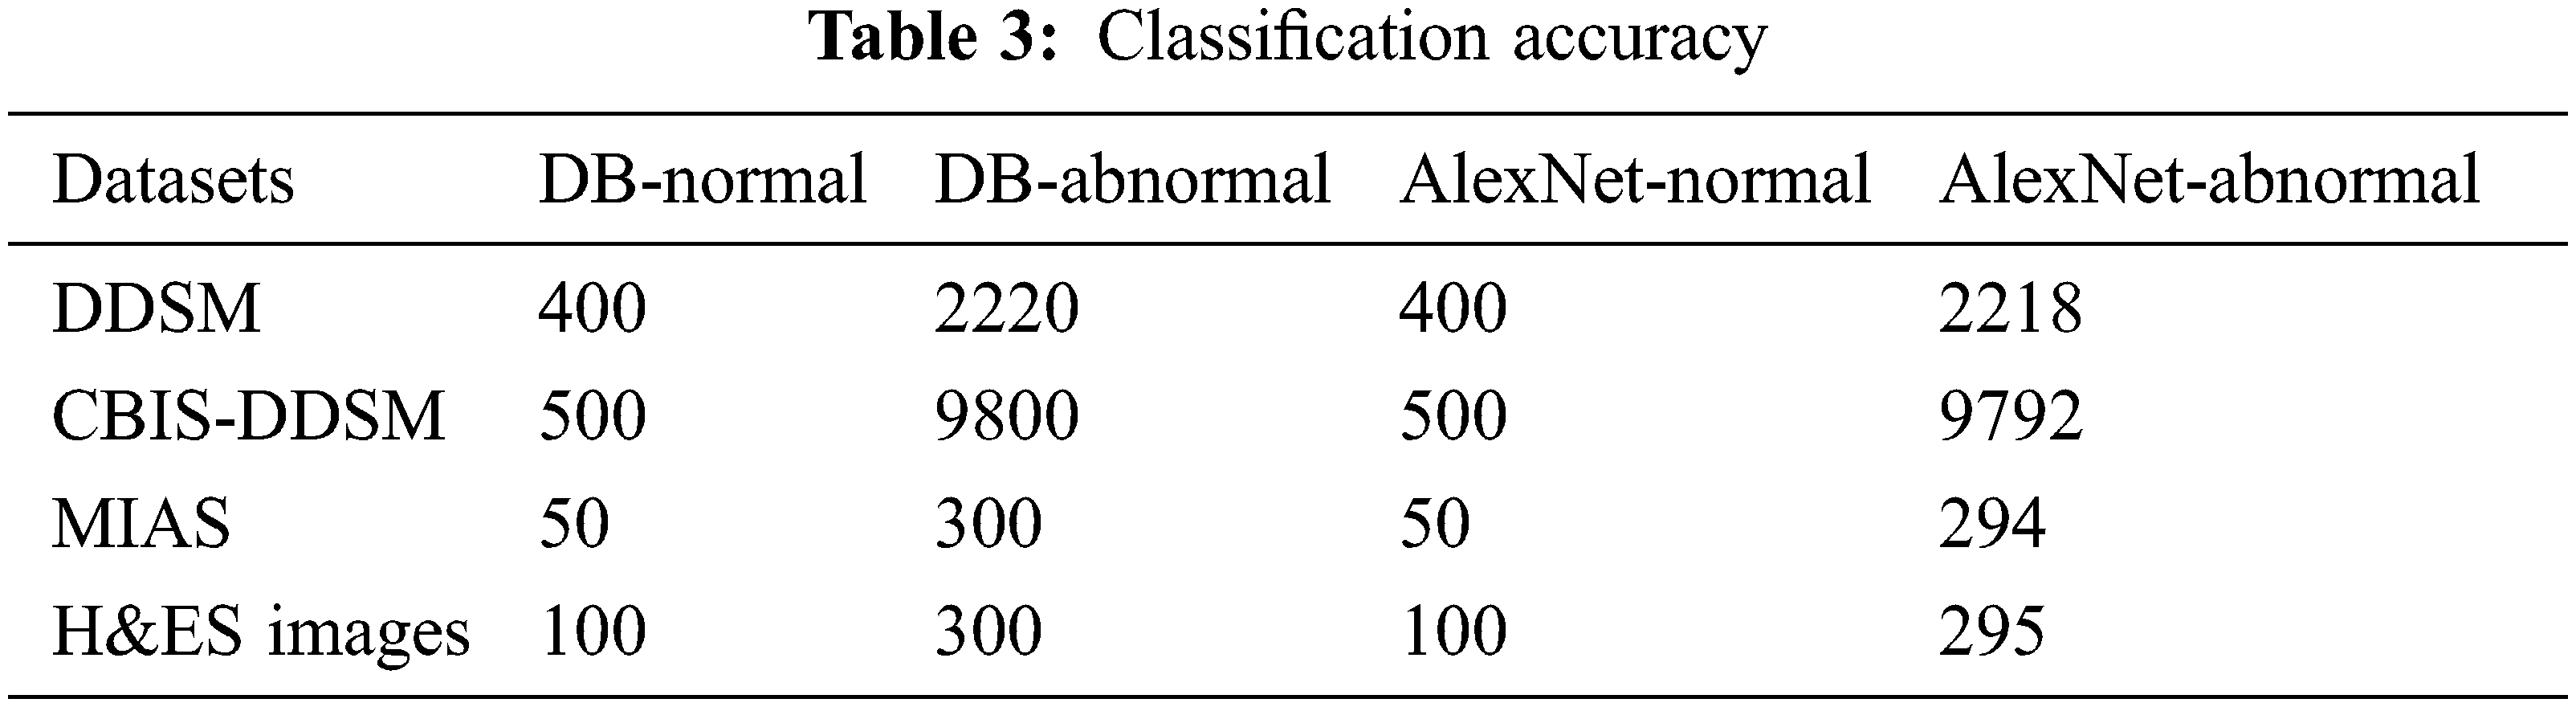
The classification accuracy of is calculated for the proposed AlexNet on various datasets is given in Tab. 3. The classification accuracy is calculated using the performance measures obtained from the experiment, such as true-positive, true-negative, false-positive, and false-negative. The first column in the Tab. 3 shows the dataset, and the other columns show the normal and abnormal data available in the DB and predicted by the proposed AlexNet.
The proposed AlexNet obtained is 99.04% of accuracy for normal image classification and 99.9% for abnormal images. Also, using the DDSM dataset, the prediction accuracy of the proposed AlexNet is 99.9%, the CBIS-DDSM dataset is 99.91%, the MIAS dataset is 98%, and using the H&ES dataset, the obtained accuracy is 98.33%. This variation is due to image quality and resolution.
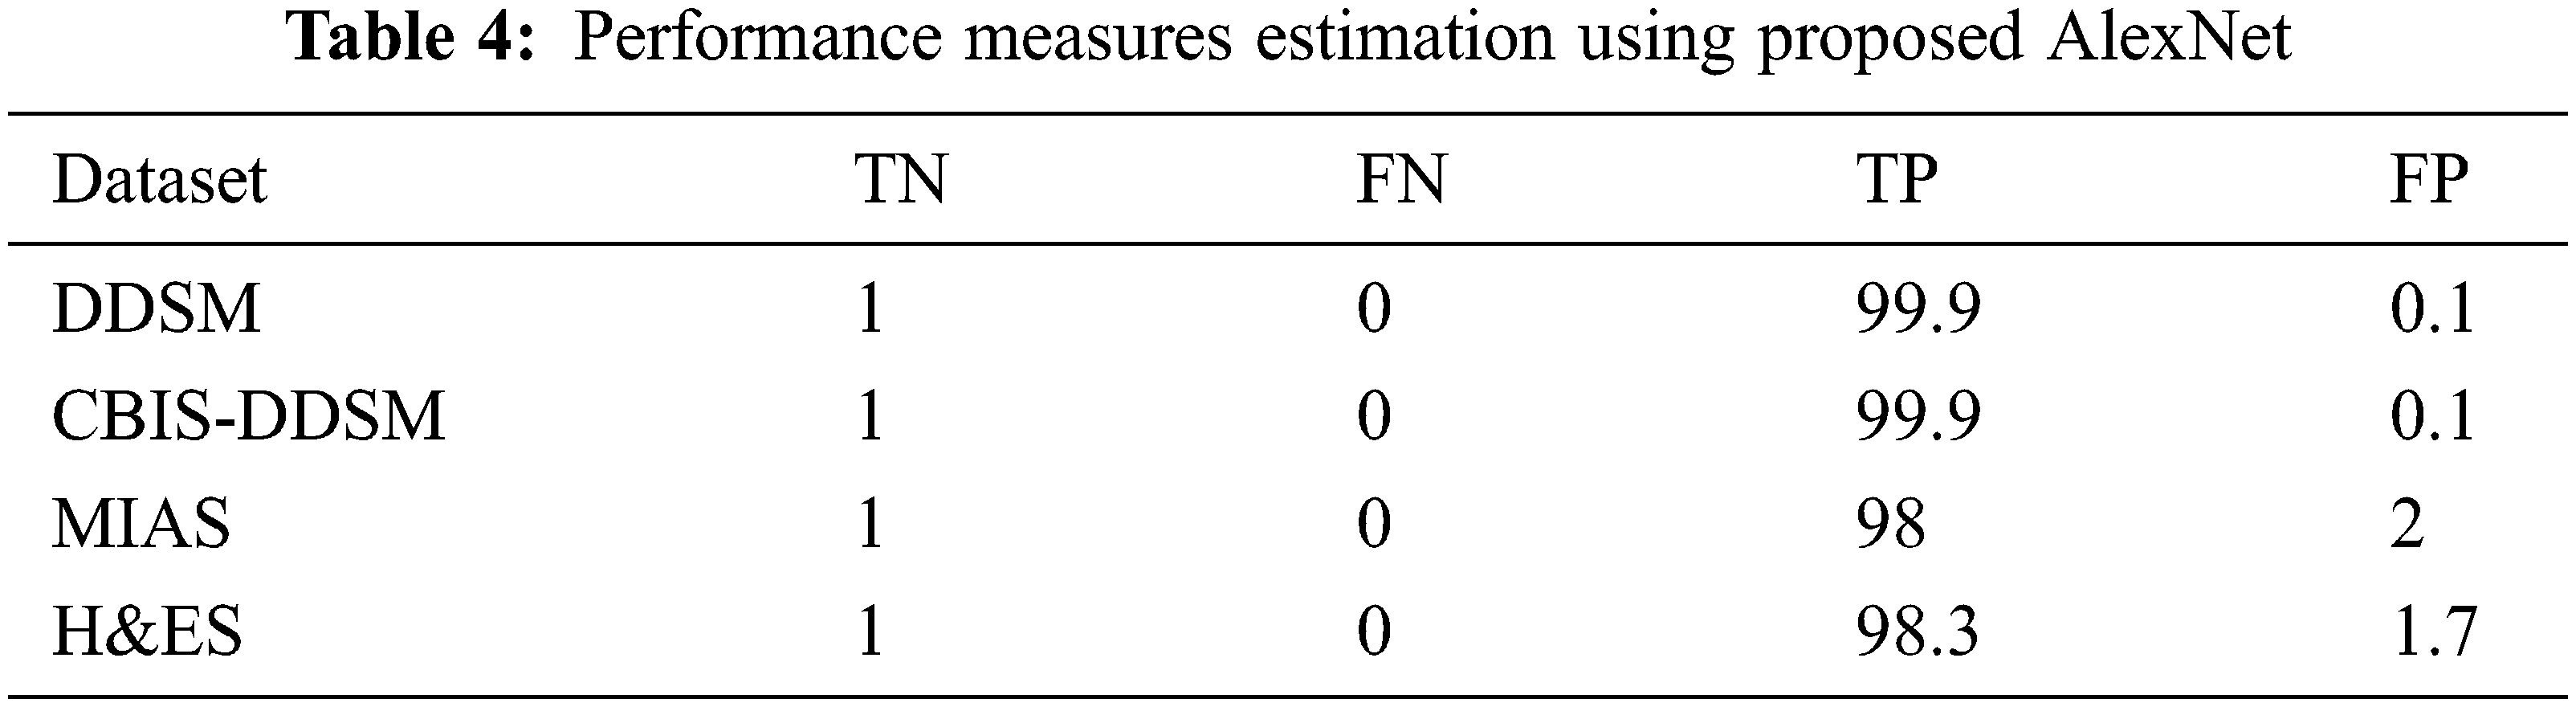
Following the values are given in Tab. 3, the performance measures are estimated for the DDSM dataset experimented using the following equations for the proposed AlexNet. The values substituted in the following equations are applied only for the DDSM datasets. For the other datasets, the obtained performance measures are given in Tab. 4.
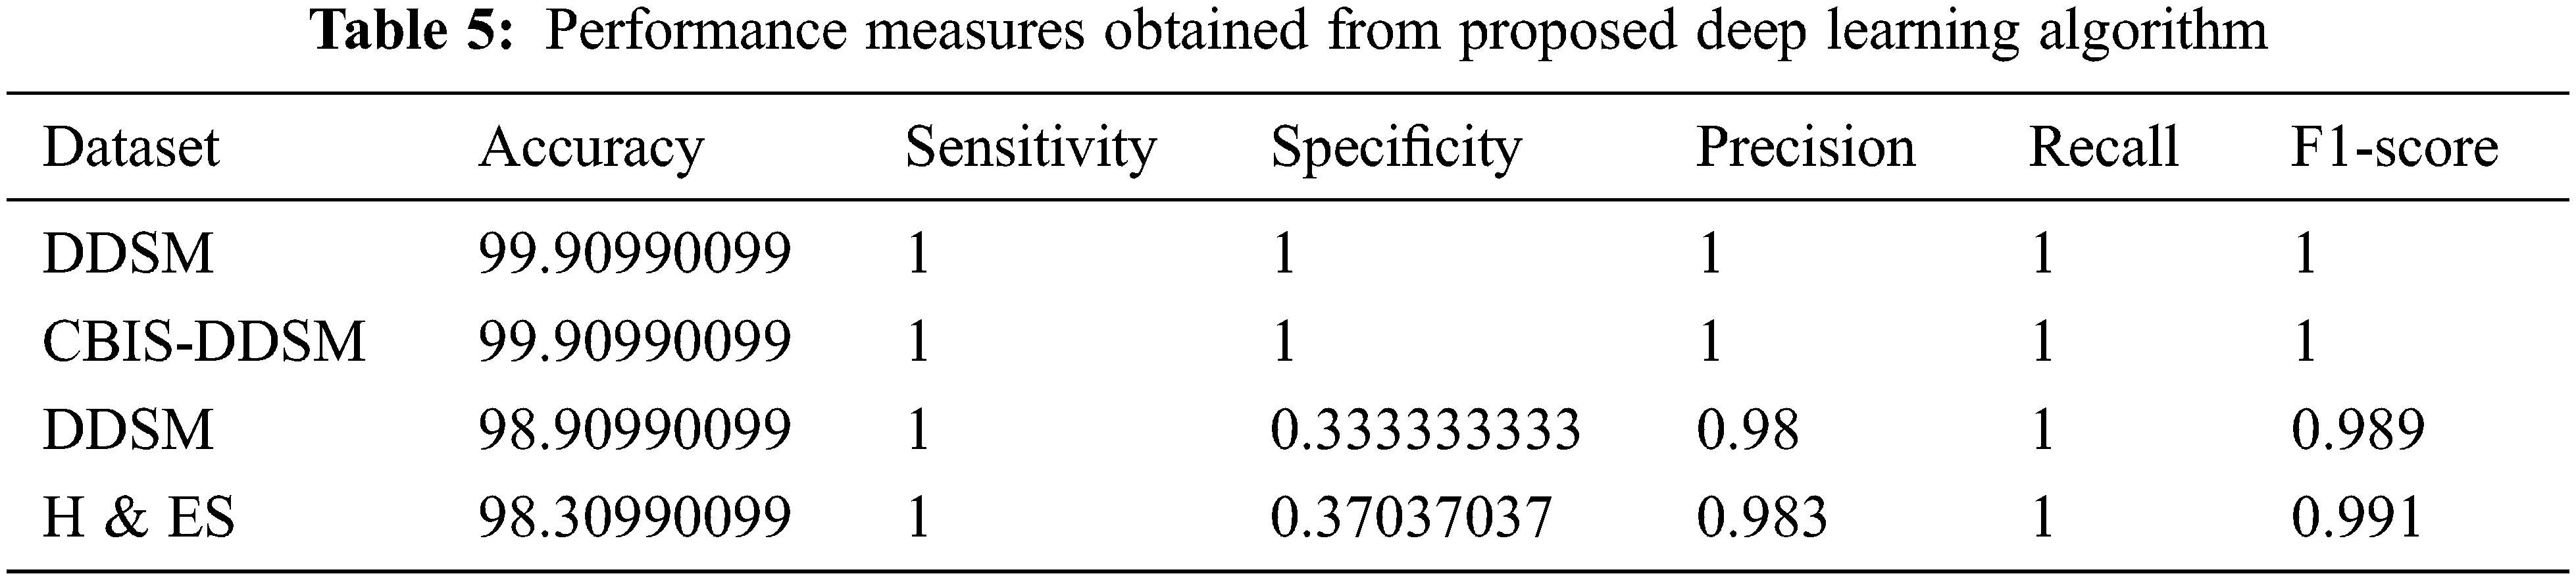
The above formulas are used to calculate the performance measures for all the datasets given in Tab. 5. A higher sensitivity and low specificity are desirable qualities for a proposed approach. From the values, it is noticed that the proposed AlexNet outperforms the other approaches on different datasets. The performance is estimated on tumor detection and classification. The performance is also ensured by computing the AUC. Based on the performance and AUC calculation, it is concluded that the proposed AlexNet outperforms the other methods. Also, it is concluded that the proposed AlexNet is highly suitable for medical image processing and diagnosing.
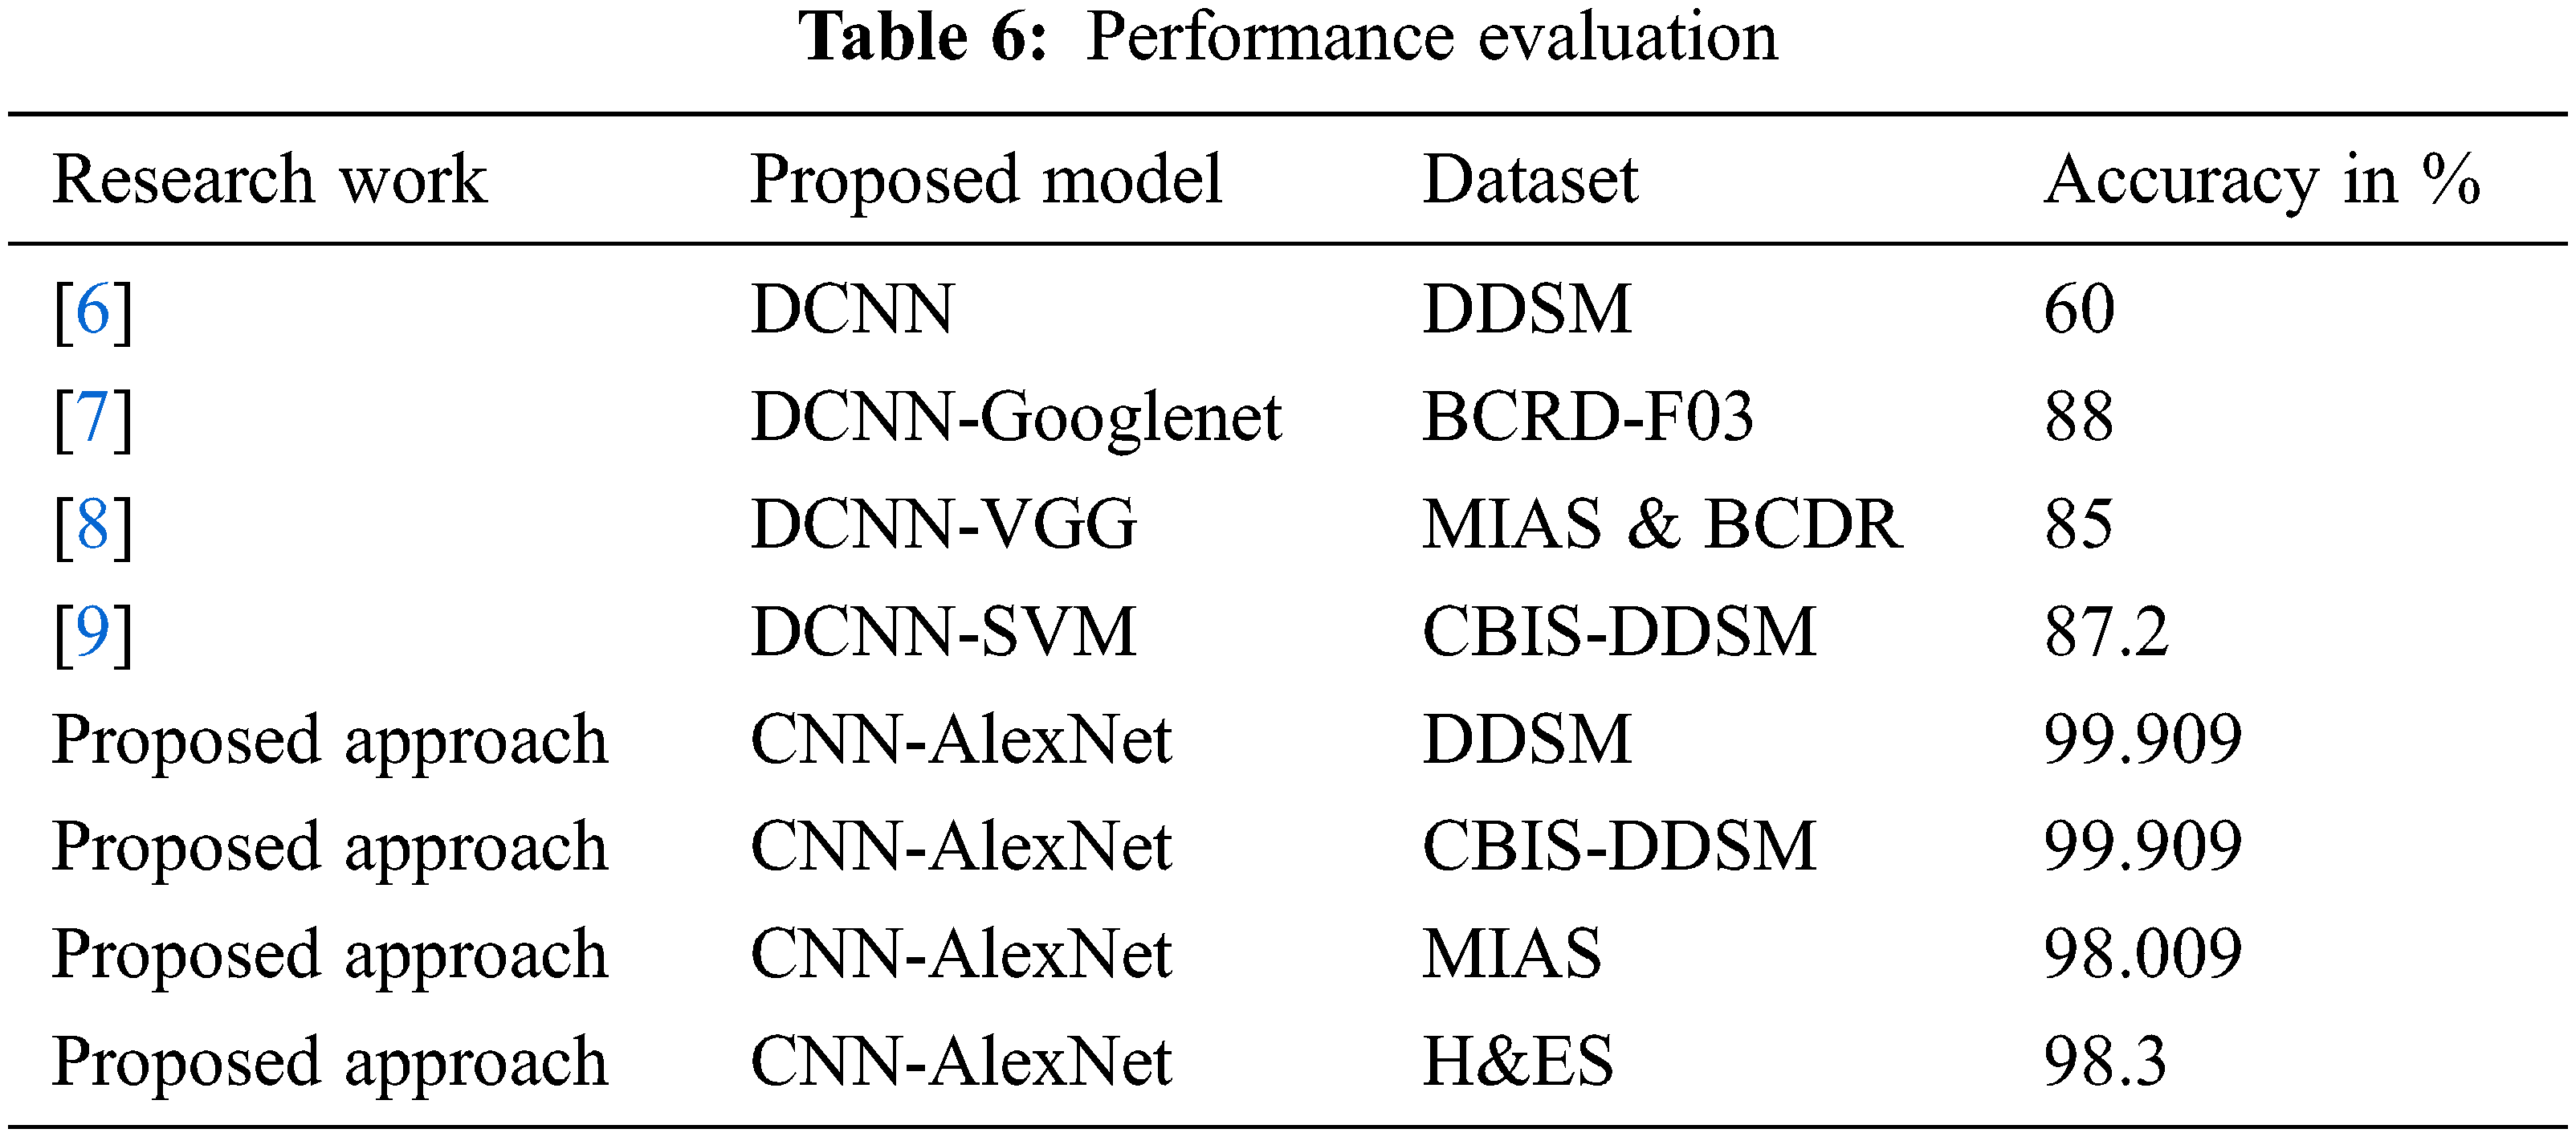
The classification results obtained from the proposed method are compared with the existing techniques that used DDSM, BCDR-F03, MIAS, and BCDR datasets and obtained 60%, 88%, and 85% respectively and the same is indicated in Tab. 6. The existing method given by Regab et al. (2019) received the highest accuracy from the comparison. From the overall comparison, the average accuracy obtained by the proposed method is 99.90%, which is increased than other methods. Also, the accuracy of the proposed approach has been compared to four contemporary works recently carried out [31–34] and the results indicate that the proposed approach yields a higher classification accuracy of 99% when compared to the recent works.
The advantages of the proposed architecture-4 model are obtained from Fig. 7. The number of iterations is increased, and the validation accuracy of the proposed model is verified. The accuracy of the CNN is speedily and gradually ramped up to 0.9 after the iteration of 3000. At the same time, the existing FCNN did not reach 0.9 after 10000 iterations also. At the same time, the loss value of the proposed CNN is lesser than the FCNN, and it shows the performance of the proposed model. Also, it is identified that the convergence rate of the proposed CNN is the minimal local point. The cost function obtains the loss value to determine the desired output, and all the parameters are minimized as much as possible.

Figure 7: Accuracy comparison in terms of training loss and validation
The above discussion and the experimental results show that the proposed CNN architecture models are better than the existing models and proved it as better.
The main objective of this research work is to design and implement an automatic identification, detection, and classification of breast cancer from mammogram images. So, this paper used one of the deep convolution neural network algorithms such as AlexNet to detect and classify breast cancer accurately. Deep learning algorithms are fully automatic in learning, extracting and classifying the features and highly suitable for any kind of image from natural images to medical images. Whereas deep learning algorithms are highly efficient, fully automatic, have more learning capability using more hidden layers, fetch as much as possible hidden information from the input images, and provide an accurate prediction. Deep CNN AlexNet is implemented, experimented in MATLAB software and results are verified. The obtained results show that the AlexNet obtained 99.90% accuracy, which is higher than the existing algorithms. Not only the accuracy, all the performance measures such as sensitivity, specificity, Precision, Recall, and F1-Score are also high than the others.
In future, various Deep Learning algorithms will be implemented, experimented with, and their performance is compared for choosing the best one in Deep learning. Also, the work will be scaled up to validate other form of images as well.
Acknowledgement: The authors wish to express their thanks to one and all who supported them during this work.
Funding Statement: The authors received no specific funding for this study.
Conflicts of Interest: The authors declare that they have no conflicts of interest to report regarding the present study.
1. R. L. Siegel, K. D. Miller and A. Jemal, “Cancer statistics,” CA Cancer J. Clinics, vol. 65, no. 2, pp. 5–29, 2015. [Google Scholar]
2. S. Rajiv, “Breast cancer facts & figures,” American Cancer Society, Atlanta, GA, USA, vol. 8, no. 3, pp. 17–31, 2015. [Google Scholar]
3. K. Krish, “Eurostat. health statistics: Atlas on mortality in the european union,” Office for Official Publications of the European Union, Luxembourg, vol. 2, no. 7, pp. 12–26, 2009. [Google Scholar]
4. R. A. Hubbard, K. Kerlikowske, C. I. Flowers, B. C. Yankaskas, W. Zhu et al., “Cumulative probability of false-positive recall or biopsy recommendation after 10 years of screening mammography: A cohort study,” Annals of International Journal of Medicine, vol. 155, no. 2, pp. 481–492, 2011. [Google Scholar]
5. J. Bozek, M. Mustra, K. Delac and M. Grgic, “A survey of image processing algorithms in digital mammography,” in Recent Advances in Multimedia Signal Processing and Communications, Berlin: Springer, vol. 7, no. 11, pp. 631–657, 2009. [Google Scholar]
6. J. Tang, S. Member, R. M. Rangayyan, J. Xu and I. El Naqa, “Computer-aided detection and diagnosis of breast cancer with mammography: Recent advances,” IEEE Transactions on Information Technology in Biomedicine, vol. 13, no. 1, pp. 236–251, 2009. [Google Scholar]
7. M. Sharkas, M. Al-Sharkawy and D. A. Ragab, “Detection of microcalcifications in mammograms using support vector machine,” in UKSim 5th European Symp. on Computer Modeling and Simulation, Madrid, Spain, vol. 1, no. 2, pp. 12–29, 2011. [Google Scholar]
8. D. Ragab, M. Sharkas and M. Al-sharkawy, “A comparison between support vector machine and artificial neural network for breast cancer detection 2 the cad system,” IEEE Transactions on Information Technology in Biomedicine, vol. 12, no. 2, pp. 171–176, 2013. [Google Scholar]
9. L. Cristina Juarez, V. Ponomaryov and R. Luis Sanchez, “Detection of microcalcifications in digital mammograms images using wavelet transform,” in IEEE Proc. of the Electronics, Robotics and Automotive Mechanics Conf. (CERMA’06), Cuernavaca, Mexico, vol. 12, no. 1, pp. 4–7, 2013. [Google Scholar]
10. M. Al-Sharkawy, M. Sharkas and D. Ragab, “Breast cancer detection using support vector machine technique applied on extracted electromagnetic waves,” Applied Computational Electromagnetics Society Journal, vol. 27, no. 4, pp. 292–301, 2012. [Google Scholar]
11. S. Suzuki, X. Zhang, N. Homma, K. Ichiji, N. Sugita Zhu et al., “Mass detection using deep convolutional neural network for mammographic computer-aided diagnosis,” in Proc. of the SICE Annual Conf., Tsukuba, Japan, vol. 34, no. 2, pp. 1382–1386, 2016. [Google Scholar]
12. M. Heath, K. Bowyer, D. Kopans, R. Moore and P. Kegelmeyer, “The digital database for screening mammography,” in M. J. Yaffe, (edProc. of the Fifth Int. Workshop on Digital Mammography, Medical Physics Publishing, Hong Kong, China, vol. 2001, no. 4, pp. 212–218, 2016. [Google Scholar]
13. N. Dhungel, G. Carneiro and A. P. Bradley, “Automated mass detection from mammograms using deep learning and random forest,” in Int. Conf. on Digital Image Computing: Techniques and Applications (DICTA), vol. 11, no. 5, pp. 1–8, 2015. [Google Scholar]
14. L. Arbach, A. Stolpen and J. M. Reinhardt, “Classification of breast MRI lesions using a backpropagation neural network (BNN),” in 2nd IEEE Int. Symp. on Biomedical Imaging: Macro to Nano (IEEE Cat No. 04EX821), Arlington, USA, vol. 2, no. 12, pp. 253–256, 2004. [Google Scholar]
15. Wichakam, P. Vateekul, K. Learning and C. N. Convnets, “Combining deep convolutional networks and svms for mass detection on digital mammograms,” in 8th Int. Conf. on Knowledge and Smart Technology (KST), Chiang Mai, Thailand, vol. 4, no. 9, pp. 239–244, 2016. [Google Scholar]
16. B. Sahiner, H. Chan, N. Petrick, D. Wei, M. A. Helvie, D. D. Adler Zhu et al., “Classification of mass and normal breast tissue: A convolution neural network classifier with spatial domain and texture images,” IEEE Transactions on Medical Imaging, vol. 15, no. 7, pp. 598–610, 1996. [Google Scholar]
17. A. Jain and D. Levy, “Breast mass classification using deep convolutional neural networks,” in 30th Conf. on Neural Information Processing Systems (NIPS 2016), Barcelona, Spain, vol. 6, no. 8, pp. 1–6, 2016. [Google Scholar]
18. Q. Huynh and M. L. Giger, “Digital mammographic tumor classification using transfer learning from deep convolutional neural networks transfer learning from deep convolutional neural networks,” Journal of Medical Imaging, vol. 3, no. 5, pp. 1–5, 2016. [Google Scholar]
19. F. Jiang, “Breast mass lesion classification in mammograms by transfer learning,” ICBCB ‘17, Hong Kong, vol. 11, no. 4, pp. 59–62, 2017. [Google Scholar]
20. W. Zhu, Q. Lou, Y. S. Vang and X. Xie, “Deep multi-instance networks with sparse label assignment for whole mammogram classification,” in Lecture Notes in Computer Science (Including Subseries Lecture Notes in Artificial Intelligence and Lecture Notes in BioinformaticsLNCS, Springer, Switzerland, vol. 12, no. 6, pp. 603–611, 2017. [Google Scholar]
21. N. Dhungel, G. Carneiro and A. P. Bradley, “A deep learning approach for the analysis of masses in mammograms with minimal user intervention,” Medical Image Analysis, vol. 37, no. 5, pp. 114–128, 2017. [Google Scholar]
22. R. M. Rangayyan, F. J. Ayres and J. E. L. Desautels, “A review of computer-aided diagnosis of breast cancer: Toward the detection of subtle signs,” Journal of Franklin Institute, vol. 344, no. 3, pp. 312–348, 2007. [Google Scholar]
23. R. M. L. Warren and W. Duffy, “Comparison of single reading with double reading of mammograms, and change in effectiveness with experience,” Journal of Radiology, vol. 68, no. 813, pp. 958–962, 1995. [Google Scholar]
24. J. Tang, R. M. Rangayyan, J. Xu, I. El Naqa and Y. Yang, “Computer-aided detection and diagnosis of breast cancer with mammography: Recent advances,” IEEE Transactions on Information Technology and Biomedicine, vol. 13, no. 2, pp. 236–251, 2009. [Google Scholar]
25. R. F. Brem, J. Baum, M. Lechner, S. Kaplan, S. Souders Zhu et al., “Improvement in sensitivity of screening mammography with computer-aided detection: A multi-institutional trial,” American Journal of Roentgenology, vol. 181, no. 3, pp. 687–693, 2003. [Google Scholar]
26. A. Cruz-Roa, A. Basavanhally, F. Gonzalez, H. Gilmore, M. Feldman et al., “Automatic detection of invasive ductal carcinoma in whole slide images with convolutional neural networks,” SPIE Medical Imaging, vol. 5, no. 8, pp. 56–74, 2014. [Google Scholar]
27. J. M. Park, “Detection and classification of the breast abnormalities in digital mammograms via regional convolutional neural network,” Engineering in Medicine and Biology Society, vol. 12, no. 10, pp. 1230–1233, 2017. [Google Scholar]
28. Y. Bengio, A. Courville and P. Vincent, “Representation learning: A review and new perspectives,” IEEE Trans. Pattern Anal. Mach. Intell, vol. 35, no. 8, pp. 1798–1828, 2013. [Google Scholar]
29. M. A. Jaffar, “Deep learning based computer aided diagnosis system for breast mammograms,” International Journal of Advanced Computer Science Applications, vol. 8, no. 7, pp. 34–51, 2017. [Google Scholar]
30. R. S. Lee, F. Gimenez, A. Hoogi, K. K. Miyake, M. Gorovoy Zhu et al., “A curated mammography dataset for use in computer-aided detection and diagnosis research,” Scientific Data, vol. 4, no. 5, pp. 1–9, 2017. [Google Scholar]
31. C. Songsaeng, P. Woodtichartpreecha and S. Chaichulee, “Multi-scale convolutional neural networks for classification of digital mammograms with breast calcifications,” IEEE Access, vol. 9, no. 1, pp. 114741–114753, 2021. [Google Scholar]
32. G. Hamed, M. Marey, S. E. Amin and M. F. Tolba, “Automated breast cancer detection and classification in full field digital mammograms using Two full and cropped detection paths approach,” IEEE Access, vol. 9, no. 1, pp. 116898–116913, 2021. [Google Scholar]
33. C. Wang, “Bilateral asymmetry guided counterfactual generating network for mammogram classification,” IEEE Transactions on Image Processing, vol. 30, no. 1, pp. 7980–7994, 2021. [Google Scholar]
34. G. Alexandrou, “Detection of multiple breast cancer ESR1 mutations on an ISFET based Lab-on-chip platform,” IEEE Transactions on Biomedical Circuits and Systems, vol. 15, no. 3, pp. 380–389, 2021. [Google Scholar]
35. D. A. Ragab, M. Sharkas, S. Marshall and J. Ren, “Breast cancer detection using deep convolutional neural networks and support vector machines,” PeerJ Journal, vol. 7, no. 12, pp. 28–41, 2019. [Google Scholar]
 | This work is licensed under a Creative Commons Attribution 4.0 International License, which permits unrestricted use, distribution, and reproduction in any medium, provided the original work is properly cited. |