DOI:10.32604/csse.2022.023792
| Computer Systems Science & Engineering DOI:10.32604/csse.2022.023792 | |
| Article |
Soil Nutrient Detection and Recommendation Using IoT and Fuzzy Logic
1Department of Computer Science and Engineering, Sri Ramakrishna Engineering College, Coimbatore, 641022, India
2ICAR-Sugarcane Breeding Institute, Coimbatore, 641007, India
*Corresponding Author: R. Madhumathi. Email: madhumathi.r@srec.ac.in
Received: 22 September 2021; Accepted: 23 October 2021
Abstract: Precision agriculture is a modern farming practice that involves the usage of Internet of Things (IoT) to provide an intelligent farm management system. One of the important aspects in agriculture is the analysis of soil nutrients and balancing these inputs are essential for proper crop growth. The crop productivity and the soil fertility can be improved with effective nutrient management and precise application of fertilizers. This can be done by identifying the deficient nutrients with the help of an IoT system. As traditional approach is time consuming, an IoT-enabled system is developed using the colorimetry principle which analyzes the amount of nutrients present in the soil and a fuzzy expert system is designed to recommend the quantity of fertilizers to be added in the soil. A set of 27 IF-THEN rules are framed using the Mamdani inference system by relating the input and output membership functions based on the linguistic variable for fertilizer recommendation. The experiments are conducted using MATLAB for different ranges of Nitrogen (N), Phosphorous (P) and Potassium (K). The NPK data retrieved by the system is sent to the ThingSpeak cloud and displayed on a mobile application that assists the farmers to know the nutrient information of their field. This system delivers the required nutrient information to farmers which results in efficient green farming.
Keywords: Precision agriculture; nutrient detection; fertilizer recommendation; internet of things; fuzzy logic
Agriculture is one of the major sectors that contribute to the growth of the country’s economy and it provides numerous employment opportunities to people in developing countries. Crop production must be increased in order to meet the demands of the growing population. Several crop, soil and weather parameters should be monitored continuously to increase production [1]. In the current scenario, technological development has created a valuable impact in the field of agriculture. The usage of new technologies has created an extensive shift from the traditional way of farming to modern farming practices. One of the modern farming methods that improve productivity is precision agriculture. It uses sensors, controllers and software systems to obtain real-time information and enhance crop cultivation [2]. An IoT-based precision agricultural system focuses on automating the entire agricultural process with the help of Internet and makes it more efficient and cost-effective with less human interaction [3]. Several challenges like interoperability, compatibility, uninterrupted power supply, low internet connectivity, insufficient security and data heterogeneity should be handled while implementing precision agricultural systems [4]. The application of sensors provide data to the farmers for effective monitoring of crops and enhances the cultivation. Hence, IoT techniques can be used in agriculture to perform soil testing, increase productivity, maintain security, conserve resources and provide quick response during measurement. Various support systems are established with sensor networks that overcomes the disputes of IoT in the area of agriculture [5,6]. These technological advancements provide more opportunities for numerous inventions in agriculture and enhances the productivity.
Soil testing is essential for farmers to know the quantity of fertilizers required for the crops. At present, soil samples are collected in the field and then taken to the laboratory for analysis by performing a variety of tests that involves different chemical compounds or minerals [7]. Soil testing is frequently skipped by the farmers due to its time consumption, resulting in soil degradation and loss of fertility. Various instruments are involved in soil testing by using different principles like chemical analysis, spectrometry, electrochemical and colorimetric analysis. Separate individual tests are carried out for each macronutrient namely Nitrogen, Phosphorous and Potassium in the laboratory. The conventional laboratory soil testing mechanism is time consuming so, it is necessary to bring precision agriculture into practice. Hence, this paper suggests an IoT based system to overcome these limitations and perform energy-efficient soil testing by measuring the macronutrients present in the soil using colorimetry principle. The fuzzy expert system recommends the amount of fertilizers to be added according to the values in the membership function. The performance metrics such as throughput and delay assess the effectiveness of the system [8].
The major contributions of this research are
• Development of an IoT-based system by integrating color sensor and photodetectors for sensing the nutrient values.
• Development of fertilizer recommendation system using fuzzy logic for finding the amount of fertilizers to be added based on the sensed value.
• Intimating farmers at regular intervals to apply fertilizers through an Internet-enabled user-friendly mobile application based on the data retrieved from the cloud.
The rest of the paper is organized as follows: Section 2 describes the research gaps related to NPK detection. Section 3 explains the experimental design of the proposed IoT-based system for sensing NPK and the working of fuzzy system. In Section 4, the results for NPK detection and fertilizer recommendation are discussed and Section 5 concludes the paper.
This section briefs about the research gaps related to IoT in agriculture for analysis of soil nutrients and fertilizer recommendation involved in various systems. Colorimetry aims to be an accurate and cost-efficient principle for analyzing the chemical composition of a solution. Agarwal et al. [9] developed a system using the colorimetric principle to determine the soil fertility values by preparing an aqueous soil solution mixed with certain reagents. Depending on the color produced, the output was classified and verified using Naïve Bayes Classification algorithm. The macronutrients and the soil pH were analyzed in the soil using color sensor by obtaining the Red, Green, Blue (RGB) values of the soil after mixing it with the reagents available in the soil test kit [10]. A low-cost microfluidic-based system [11] based on suspension mechanism was developed to measure nitrite, pH and Electrical Conductivity (EC). This system was not capable of measuring the other two macronutrients namely phosphorous and potassium. Karolina et al. [12] developed an android-based smart phone application for soil nutrient analysis which relates the color obtained from the test strips to the concentration of the available nutrients. However, these experiments performed by numerous researchers seemed to be challenging for farmers to analyze and obtain the results.
Different types of sensors are designed using colorimetry principle to analyze the concentration of the solution. Lavanya et al. [13] designed an automated IoT-based fertilizer intimation system by developing a NPK sensor based on colorimetry to identify the deficiency of nutrients using fuzzification. The amount of fertilizers required were intimated through an SMS in the mobile. In [14], the amounts of NPK were classified as low, medium or high based on the light transmission and detection system of the optical transducer and the data acquisition was performed through an Arduino microcontroller. Puno et al. [15] developed a vision system which captured the image of the soil, performed various image processing techniques and the macronutrient level was classified from the extracted features using fuzzy logic mechanism. In [16], soil nutrient analysis was characterized using Near Infrared (NIR) spectroscopy and Artificial Neural Network (ANN) by determining the absorption spectra of the soil. Liu et al. [17] fabricated a novel chip-level colorimeter to detect NPK elements. The colorimeter consists of a microchannel photodetector using MEMS (Micro-Electro-Mechanical-System) technology. In [18] a sensor was designed to measure fluoride and hardness with an automated mechanism using colorimetric approach with a reagent and complexometric titration. A fuzzy expert system was simulated using MATLAB to calculate the required amount of macronutrients based on the laboratory soil testing values [19,20]. Hence a low-cost and less complex system is proposed in this study that uses the colorimetric principle to decide the level of NPK and analyze the amount of fertilizers to be added in the soil.
3 Proposed IoT-based System for NPK Detection
The functional architecture design of IoT has four layers namely the device layer (perception layer), network layer, data processing layer and application layer as shown in Fig. 1. Data is produced in the perception layer and its transmission occurs in network layer through gateway devices; data is processed and stored in the data processing layer and finally, the stored data is viewed and manipulated in the application layer [21,22].

Figure 1: IoT functional architecture design
IoT-based system for NPK detection as shown in Fig. 2 consist of a NPK sensing unit comprising of light transmission and light detection system, processing unit, cloud and mobile application. The NPK sensing unit is integrated with a processing unit and a process logic code is given to the system for nutrient measurement. The processed data is pushed to the ThingSpeak cloud and is simultaneously sent to a mobile application through an Application Programming Interface (API). The sensor data in the cloud is stored in JavaScript Object Notation (JSON) format and can be retrieved at any time for further analysis. A graphical view of the data is obtained in the ThingSpeak channel and this aids farmers to know the variations in the NPK values and improve their decision-making capabilities. The development of this system consists of two phases for nutrient detection and recommendation. The first phase involves developing a NPK sensing unit for nutrient measurement and the second phase consists of analyzing the soil nutrients using fuzzy system and recommending the amount of fertilizers required.

Figure 2: Proposed IoT-based system for NPK detection
3.1 Development of NPK Sensing Unit
The proposed NPK sensing unit comprising of various devices are used to measure the amount of nutrients in the soil by collecting the soil solution and performing colorimetry analysis after mixing it with appropriate reagents. Based on the color developed in the solution, the concentration of nutrients can be determined. This part of the system performs the device layer functionalities and it is responsible for gathering data from the devices that are integrated. The photo transmission and detection system consist of a color sensor that has four Light Emitting Diodes (LED’s) for transmission of light and photodetectors that detects light based on the light intensity reflected on them. Fig. 3 shows the circuit diagram of the color sensing system consisting of four LED’s namely D1, D2, D3 and D4 connected with four resistors R1, R2, R3 and R4 that resist the flow of current in the LED’s respectively. Vcc is the input voltage and Vout is the output voltage obtained across the array of photodiodes.

Figure 3: Circuit diagram of NPK sensing unit
The light is emitted to the soil solution by the four LED’s at the corners of the color sensor for sensing the nutrient values. The colorimetry principle based on Beer Lambert’s Law is applied to determine the concentration of the nutrients. According to Beer Lambert’s Law, the amount of light absorbed by the solution depends on the chemical concentration of the solute present in the soil. The solution becomes more electrically conductive when light is transmitted through it and the array of photodiodes present in the sensor absorbs the reflected light. Knowing the light intensity obtained from the photodiodes, the absorbance of the solution is obtained as given in Eq. (1).
where,
A – absorbance of the sample
I – transmitted light intensity
K – molar absorptivity
l – path length of the light
c – concentration of the solution
From Eq. (1), the concentration of a solution is obtained by Eq. (2).
A direct relationship exists between absorbance and the concentration of the analytes in the solution as shown in Fig. 4. The photodiodes provide a photocurrent output which is then converted to voltage using a current to voltage converter. The amount of light reflected varies with the resistance value and the output voltage (V0) is obtained using NPK sensing unit by Ohm’s Law.

Figure 4: Relation between absorbance and concentration
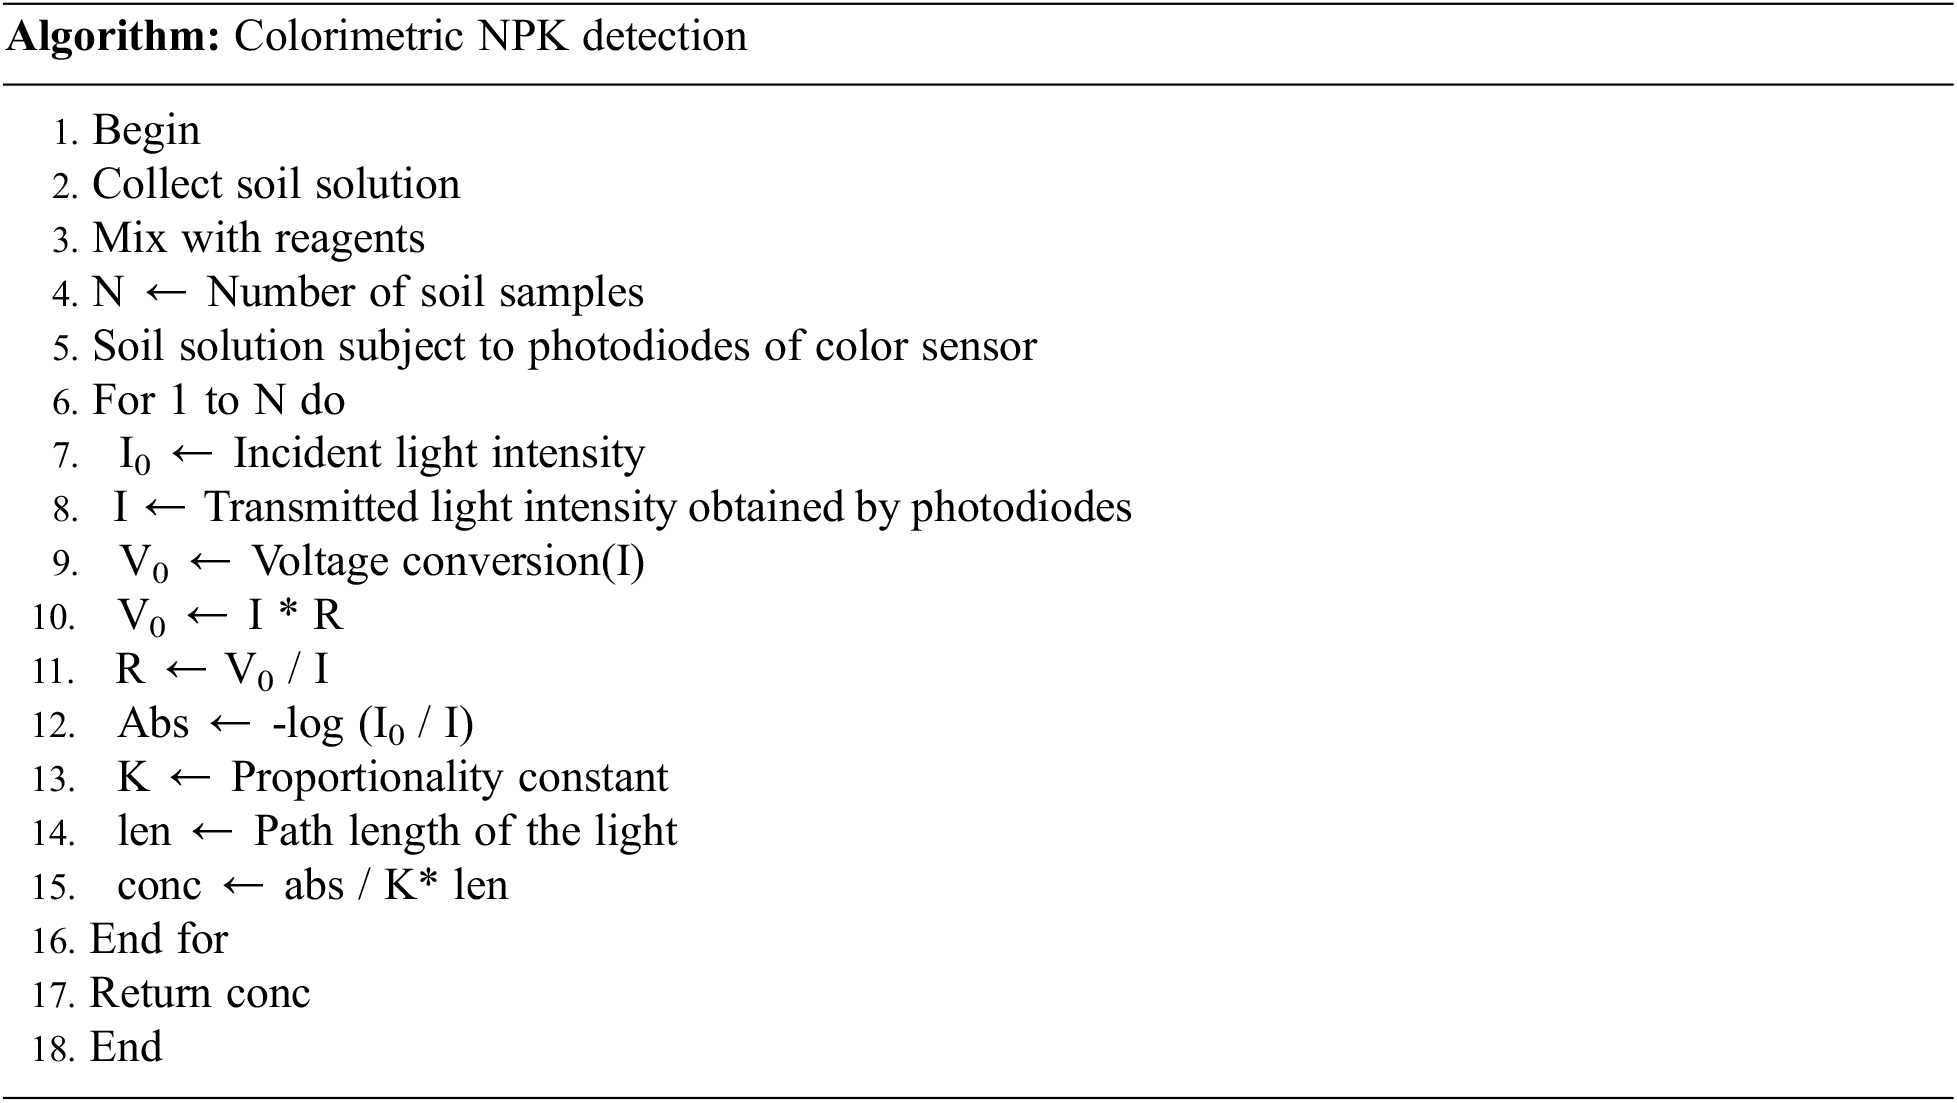
The voltage obtained from the proposed NPK sensing unit is given to the processing unit for calibration and the NPK values are determined precisely. These values are pushed to the cloud and are displayed in the mobile application. The colorimetric NPK detection algorithm given below uses Beer Lambert’s law for finding the concentration of the soil solution.
3.2 Analysis of Soil Nutrients for Fertilizer Recommendation
Fuzzy logic is used in this system which is a soft computing-based approach that partitions the input variable by assigning a label for each partition. Fuzzy expert systems contain a knowledge base and inference system that stimulates the decision-making power of human experts [23,24]. In this system, Mamdani’s fuzzy inference method is used as it has a simple structure of min-max operations. The inference system consists of three modules namely fuzzification, rule-based evaluation and defuzzification [25]. The representation of the fuzzy expert system is illustrated in Fig. 5.

Figure 5: Representation of Mamdani fuzzy expert system
Fuzzification process generalizes a theory from the discrete form into a continuous form using linguistic variables and membership functions representing the individual fuzzy set [26]. The fuzzification module converts the crisp values into fuzzy input. The degrees of membership are associated with the linguistic variable and this plays a major role in the expert system. In this work, the values of NPK are classified into three linguistic labels namely low, medium and high based on the amount of NPK present in the soil.
The general definition of membership function for a given fuzzy set Aj, where the value x is mapped between 0 and 1 is defined in Eq. (3).
For a smooth characteristic curve, the triangular function defined by a lower limit and an upper limit is selected as the membership function µAj for the term Aj as given in Eq. (4).
where,
a is the upper limit
b is the lower limit
m lies between a and b
The Fuzzy inference system uses rule-based system that contains a collection of conditional IF-THEN rules for representing the decision conditions. This collection of rules becomes the knowledge base and a database is formed which defines the fuzzy set membership functions used in the rule-based system. Mamdani inference system triggers all the rules simultaneously in order to map the NPK values against each linguistic label for obtaining the fuzzified values. When the fuzzified values reaches the calibrated range, the corresponding rule will be triggered. The output of each rule is a fuzzy set that is derived from the membership function.
The defuzzification process converts the fuzzy set output into crisp value by interpreting the fuzzy set’s membership degrees. The fuzzy set of the aggregated rule base system is converted to a crisp value in order to determine the recommended amount of fertilizers using the Center of Gravity (CoG) defuzzification method as given in Eq. (5). The defuzzified output using CoG is given by
After defuzzification, the Mamdani fuzzy inference system’s editor tool recommends the range of fertilizers to be added in hectare by analyzing the nutrients in the soil. The recommended quantity of fertilizer obtained from the fuzzy inference system algorithm is suggested for the farmers to apply nutrients efficiently.
The responses of the photodiode array due to the illumination of four LED’s at different path lengths are described in Fig. 6. The comparison of these responses are shown as the optimal path length that ranges between 1.0 and 4.0 and there is a significant reduction in the voltage values as the path length increases.

Figure 6: Determination of path length of LED’s
The NPK sensing unit is first tested for nutrients by varying the concentration of the soil solution and finding the change in the absorbance ratio. An input voltage is provided and the test is performed for loamy, clay and sandy soil. It is observed that the NPK sensing unit output increases as the concentration of the solution increases as shown in Fig. 7.

Figure 7: Nitrogen values for different concentration
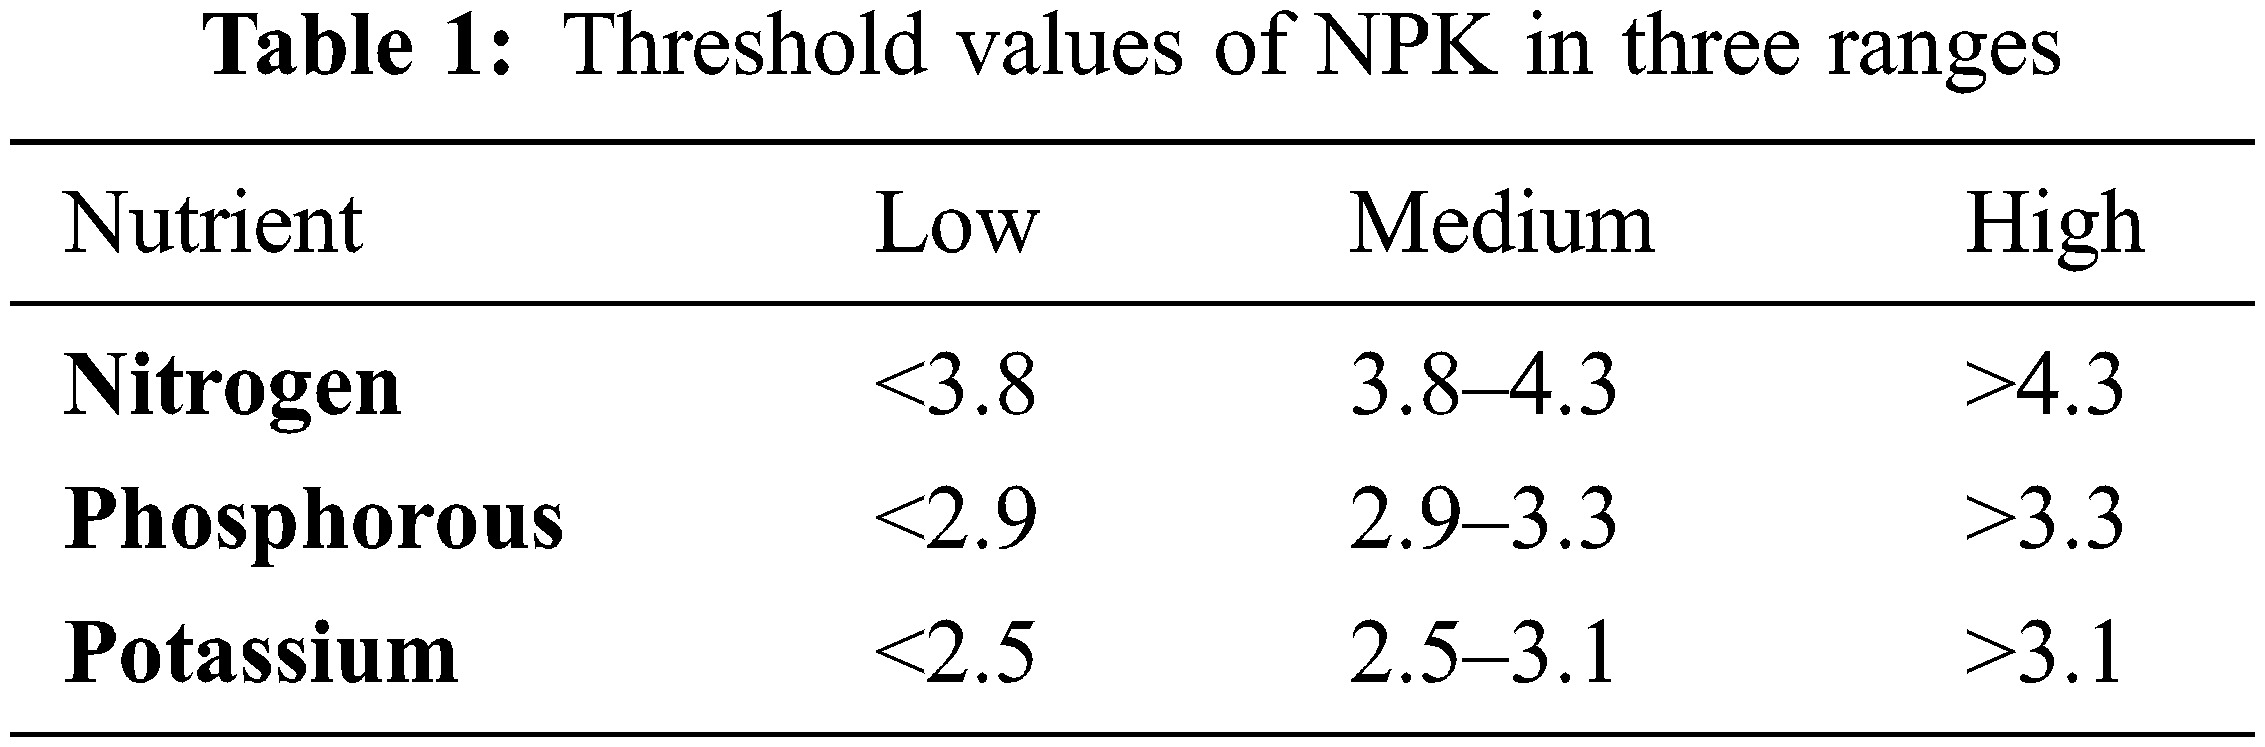
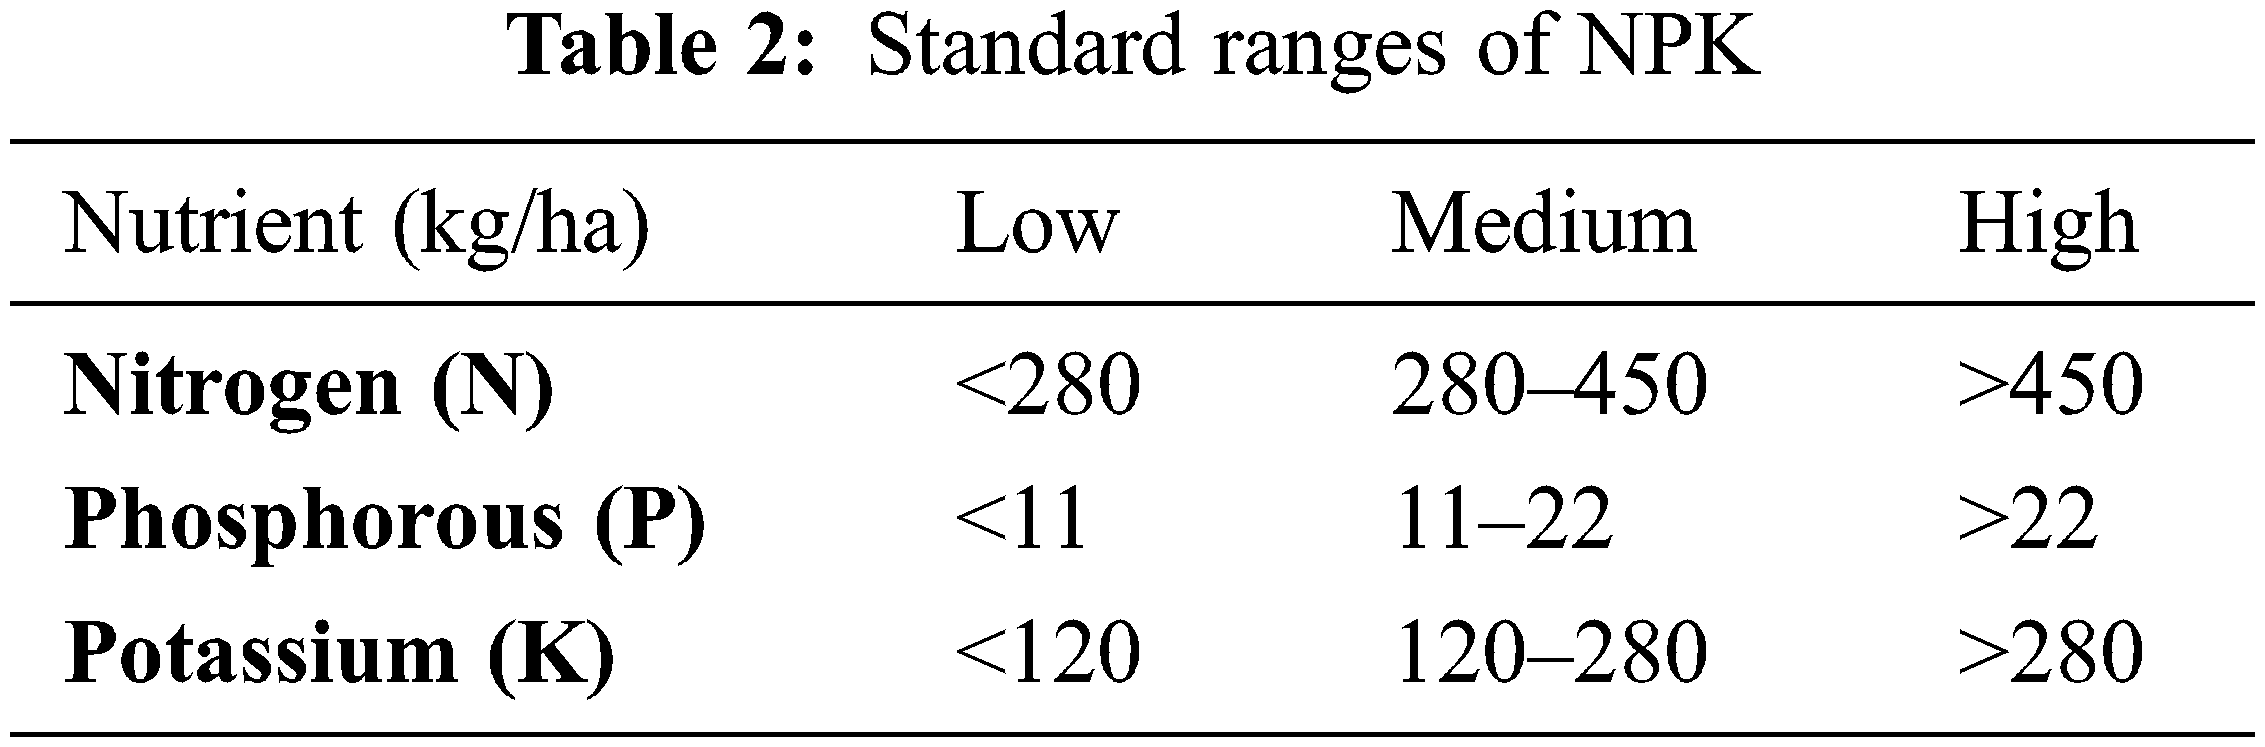
Depending on the voltage obtained by illuminating the photodiodes, the NPK values can be calibrated by knowing the type of the soil and their standard properties. The NPK range as high, medium or low is obtained after calibration by the processing unit with response to the voltage value for each individual nutrient. Tab. 1 displays the threshold values of NPK in three voltage ranges namely low, medium and high [14]. The range of voltage values obtained are mapped with the standard ranges of NPK as shown in Tab. 2 [27]. Using a unique program logic, the individual amount of NPK present in the soil are produced. These values are given to the fuzzy inference system for nutrient analysis and fertilizer recommendation.
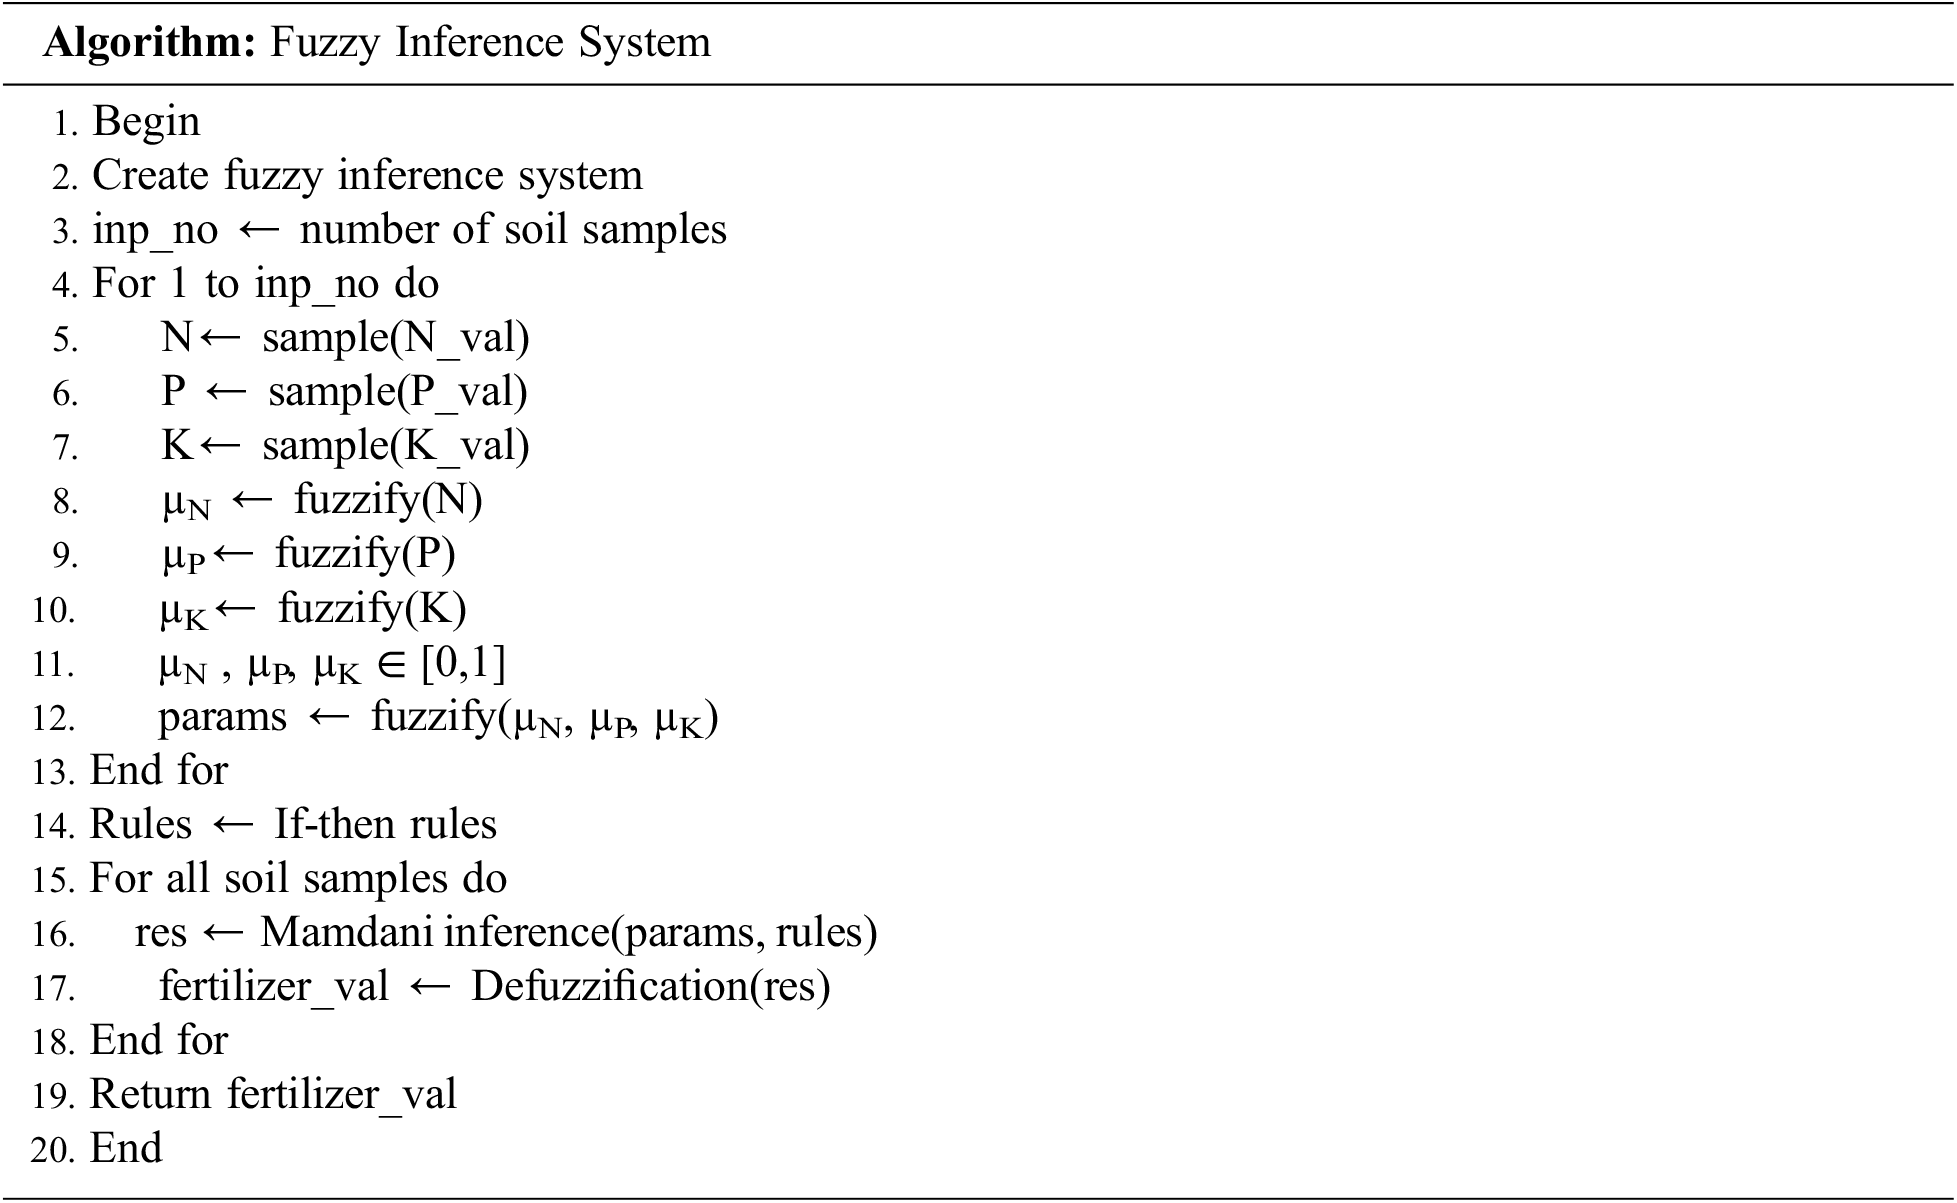
4.1 Fuzzy Inference System for NPK Recommendation
In this Mamdani inference system, three input variables are taken as the present levels of nitrogen, phosphorous and potassium and the output variables are defined as the recommended amount of nitrogen, phosphorous and potassium. The ranges of input and output membership functions are selected by examining the data based on the standard ranges of NPK table and are plotted in MATLAB. The universe disclosure for input variables are taken as (0–600 kg/ha) for nitrogen, (0–30 kg/ha) for phosphorous and (0–350 kg/ha) for potassium. Similarly, the output variables of NPK are defined as (0–120 kg/ha) for nitrogen, (0–30 kg/ha) for phosphorous and (0–100 kg/ha) for potassium respectively. A separate membership function plot is constructed for every input and output variable using triangular membership function. The membership plots are constructed based on the standard ranges of NPK for fertilizer recommendations.
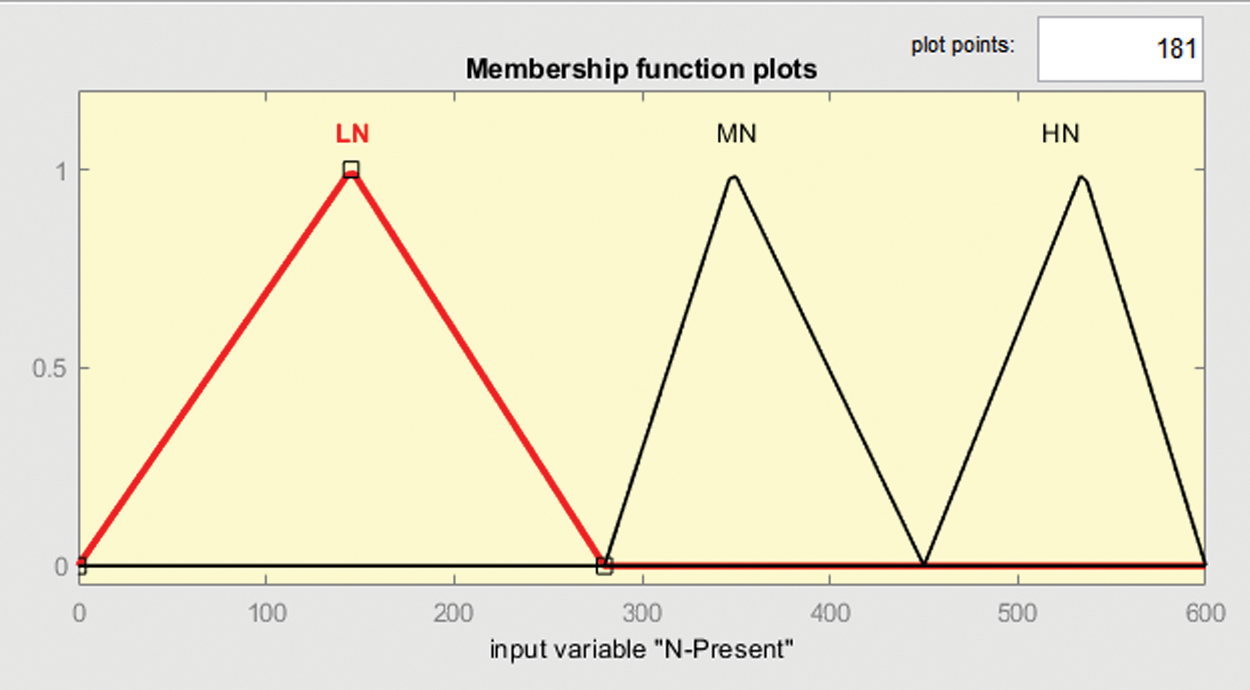
Figure 8: Membership function plot for input variable N-present
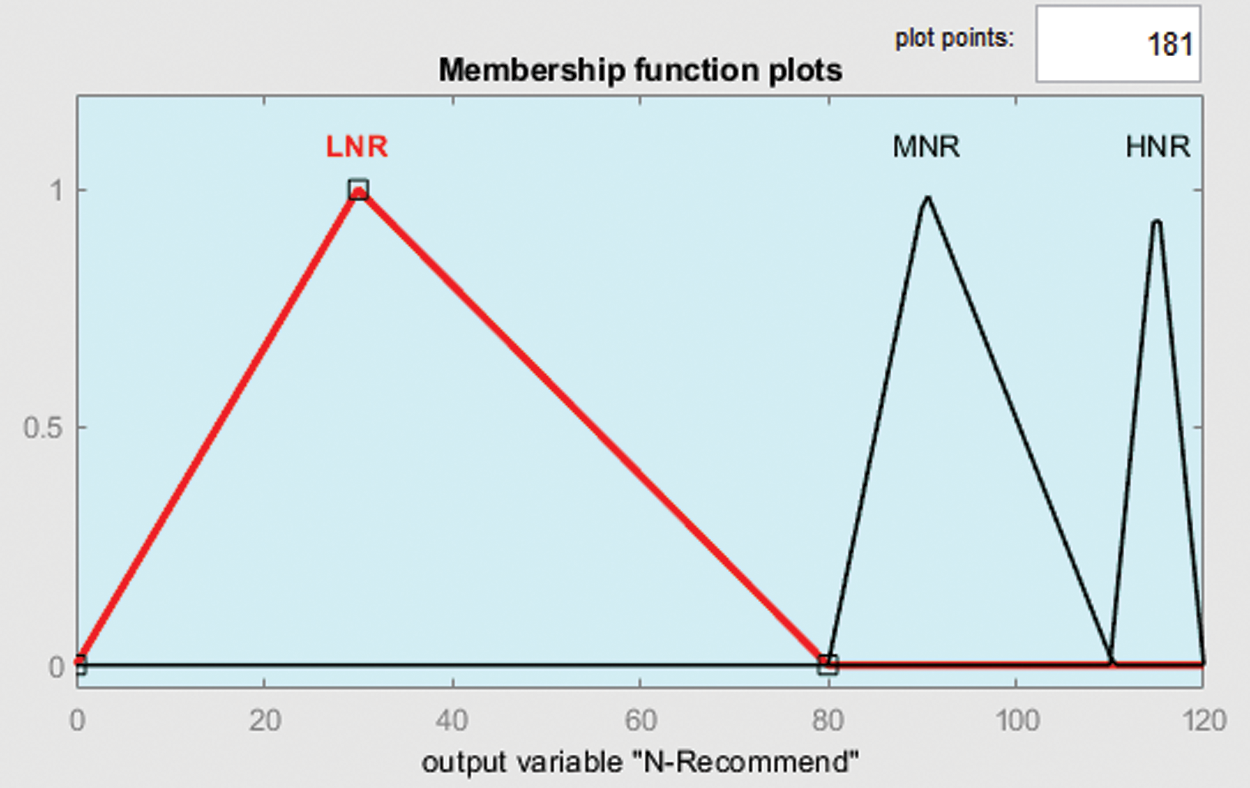
Figure 9: Membership function plot for output variable N-recommend
Fig. 8 represents the input membership function plot for nitrogen values in three ranges low, medium and high. The values range between 0 and 280 for low nitrogen, 280 to 450 for medium nitrogen and 450 to 600 for high nitrogen. The output plot as shown in Fig. 9 illustrates the output membership function for the recommended nitrogen values.

Figure 10: Membership function plot for input variable P-present

Figure 11: Membership function plot for output variable P-recommend
The input membership function plot for phosphorous is represented in Fig. 10. The plot shows that the phosphorous value lies between 0 and 11 when it is low, between 11 and 22 when it is medium and between 22 and 30 when it is high. Fig. 11 illustrates the output membership function plot for recommended levels of phosphorous in three ranges low, medium and high.
Fig. 12 shows the input plot of potassium where the values are in the range 0 to 120 for low, 120 to 280 for medium and 280 to 350 for high potassium. The output plot for potassium is displayed in Fig. 13 and based on this the NPK values are recommended in the mobile application.

Figure 12: Membership function plot for output variable K-present
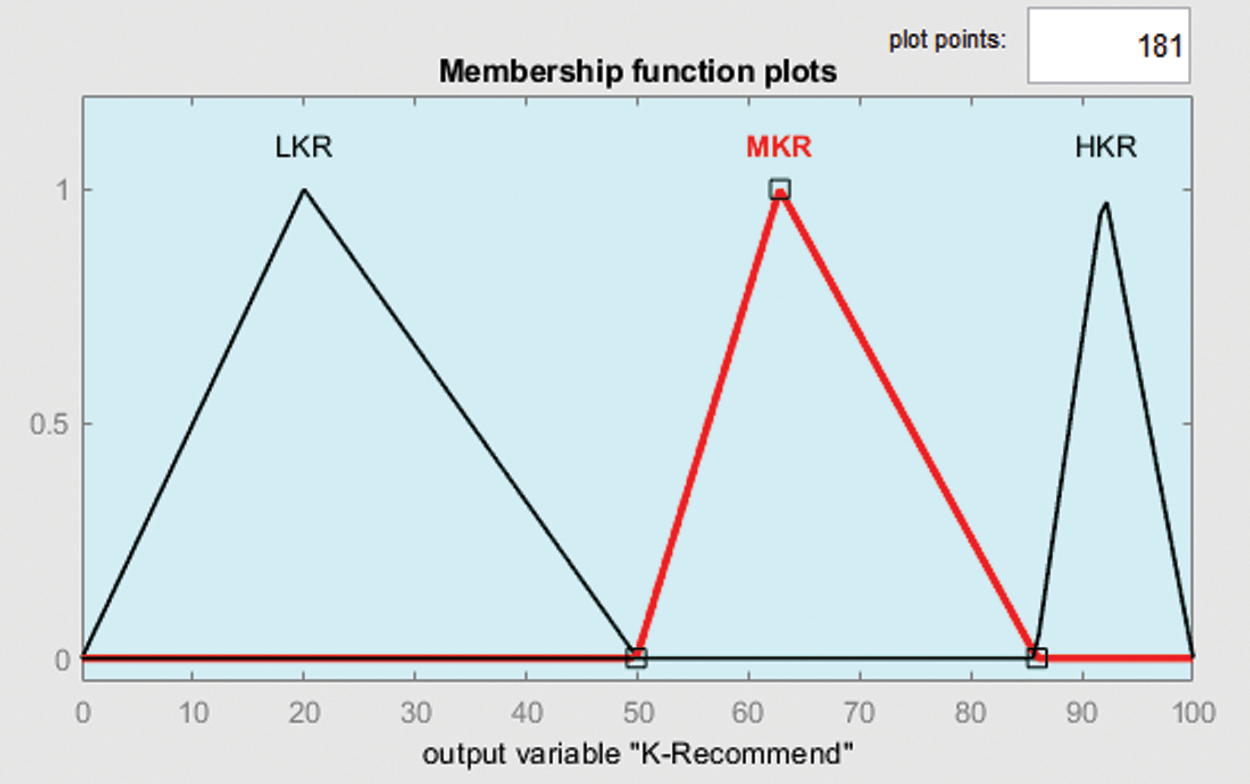
Figure 13: Membership function plot for output variable K-recommend
Totally 27 rules are generated in the MATLAB fuzzy inference system which efficiently describes the relation between three input variables of NPK present in the soil and output variables of NPK that recommends the needed nutrients in the soil. Some of the IF-THEN rules generated are given below.
a) If Nitrogen, Phosphorous and Potassium are low, then recommend high Nitrogen, high Phosphorous and high Potassium.
b) If Nitrogen, Phosphorous and Potassium are medium, then recommend medium Nitrogen, medium Phosphorous and medium Potassium.
c) If Nitrogen, Phosphorous and Potassium are high, then recommend low Nitrogen, low Phosphorous and low Potassium.
d) If Nitrogen is low, Phosphorous and Potassium are high, then recommend high Nitrogen, low Phosphorous and low Potassium.
e) If Nitrogen is low, Phosphorous is medium and Potassium is high, then recommend high Nitrogen, medium Phosphorous and low Potassium.
f) If Nitrogen is medium, Phosphorous and Potassium low, then recommend medium Nitrogen, high Phosphorous and Potassium.
Similarly, the other 21 fuzzy rules are taken to describe the relationship between input and output variables. The crisp values are computed by finding the CoG of the membership function using the fuzzy sets. The snapshot of the fuzzy expert system is shown in Fig. 14 and this describes the recommended quantity of NPK based on the input and output membership functions.
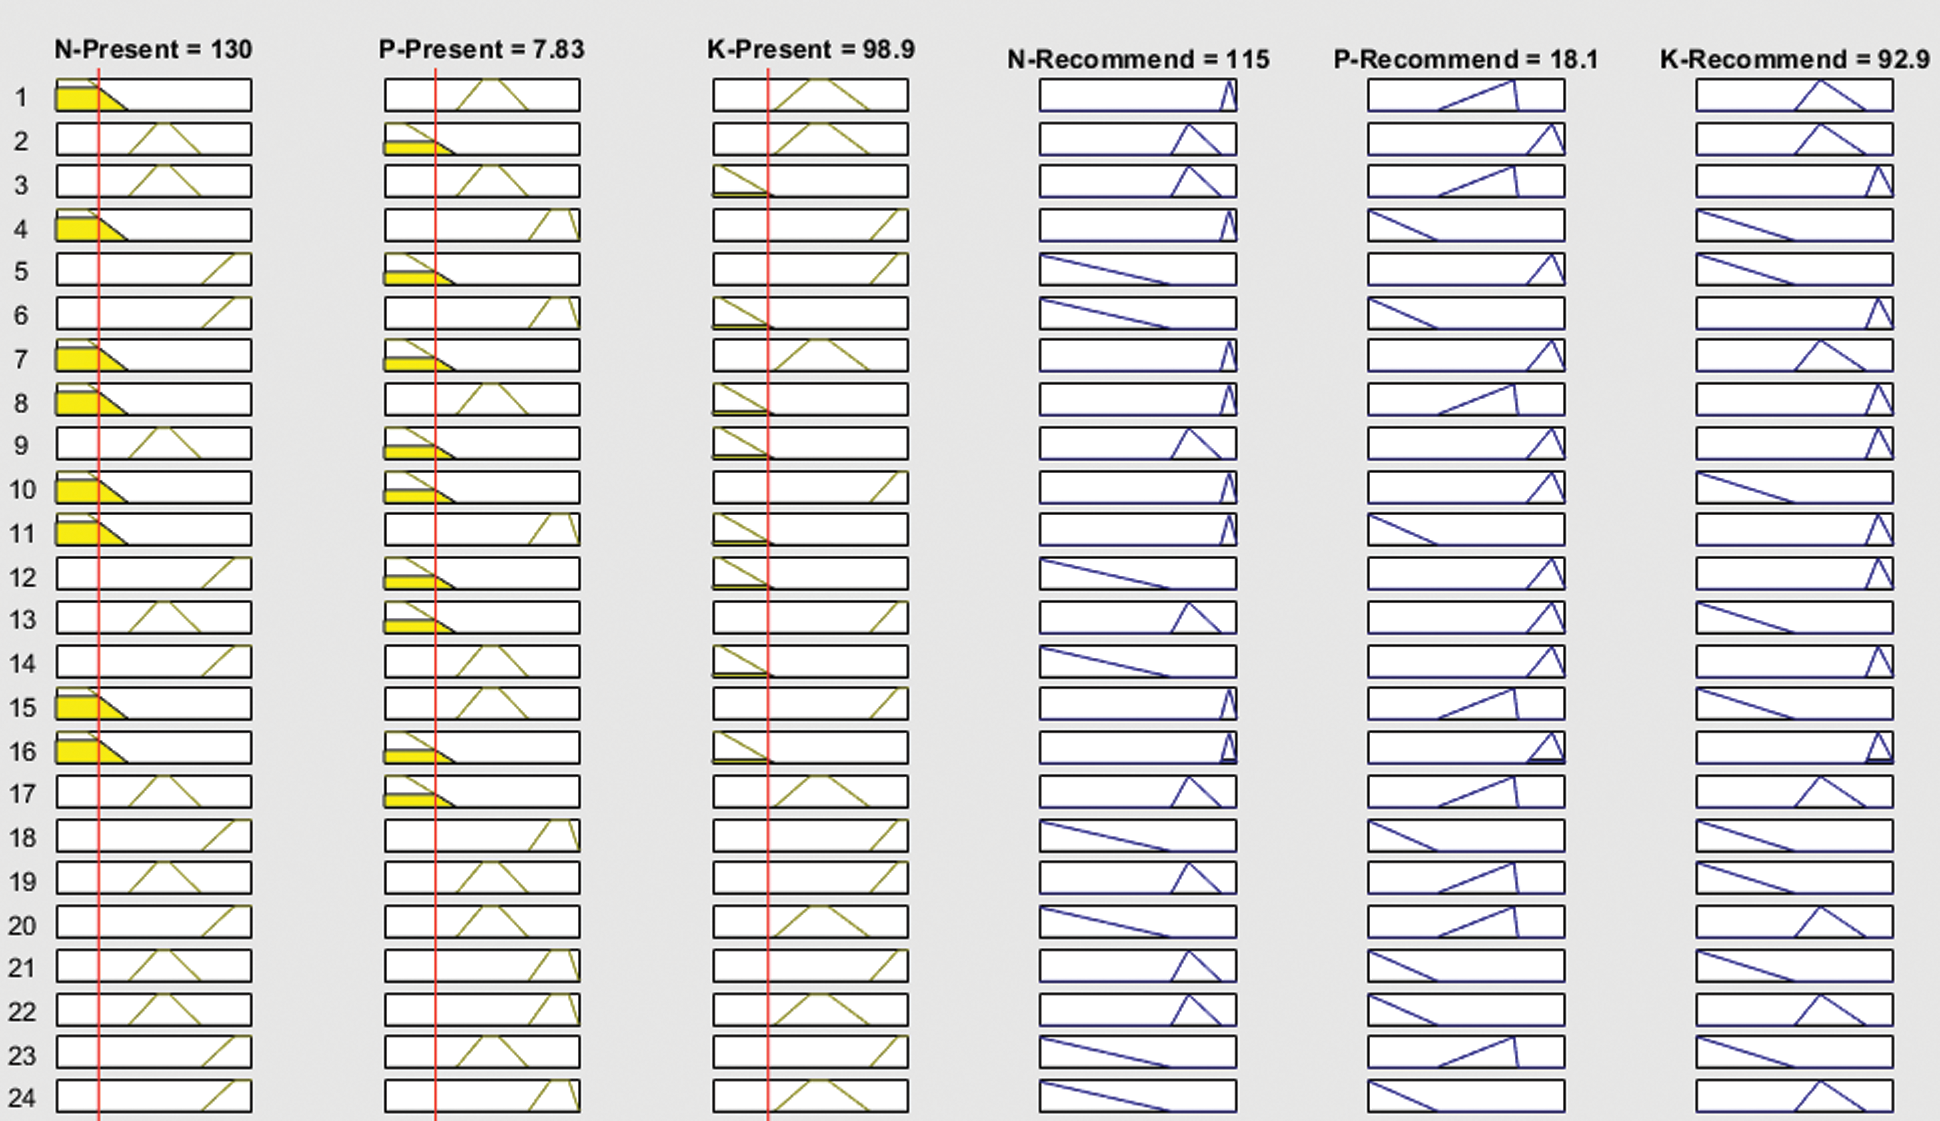
Figure 14: Snapshot of the fuzzy expert system
The fuzzy expert system’s capability allows the calculation time to be reasonable and it provides a reduction in the problem’s complexity. These values are transferred to the ThingSpeak cloud in JSON format using Wi-Fi communication technology in the network layer. An API is interfaced in the application layer which connects the ThingSpeak cloud and the mobile application is used for displaying the soil NPK data. The loaded sensor data may also be useful in future for data analytics.
4.2 Analysis of IoT Network Performance Metrics
The different performance metrics like throughput and delay are considered in the simulation environment for calculating the efficiency of the system The performance of the system is degraded according to the increase in the network traffic [28].
Throughput refers to the measure of data that can be transferred from one place to another place and it varies according to the density of the network. The frequency is fixed constant and the throughput variation for different node density is simulated as shown in Fig. 15. The saturation level of the throughput is reached only when the node density goes higher than 20.

Figure 15: Variation in throughput
Delay is the measure of time taken for the data to be transferred from the sensor node to the cloud server and it varies for different node densities. Fig. 16 illustrates the variation in delay and it is concluded that as the node density increases the delay also increases.

Figure 16: Variation in delay
The present NPK and the recommended values are displayed in the mobile application and this paves the way to apply precise amount of fertilizers, decreases expenditure and improves yield. The overall contribution of this research is to find an efficient mechanism for finding the quantity of soil nutrients and recommend right quantity of fertilizers.
Precision agriculture offers numerous benefits to the agricultural industry. Current technologies like IoT, Artificial Intelligence (AI) and drones are useful for farmers to protect their farms from any hazardous conditions. Introducing these technologies and conducting various experimental simulations help in understanding the functionalities of the system. The proposed colorimetry principle is used to measure the macronutrients based on the absorption of light in the soil solution. The measured nutrient data along with the standard ranges of NPK in a fuzzy inference system is used for fertilizer recommendation. These results are stored in the ThingSpeak cloud and displayed on a mobile application. Hence, the proposed IoT-based system has the intelligence to assist farmers to know about the nutrient deficiency and recommend the amount of fertilizers accordingly. For progressive growth of a crop, this method can be expanded to measure the soil micronutrients along with macro-nutrients to increase yield.
Acknowledgement: The authors sincerely thank the Science and Engineering Research Board (SERB) of DST for the financial support and the Director, ICAR-SBI, Coimbatore and the Management and Principal of Sri Ramakrishna Engineering College, Coimbatore for extending the required facilities for this study.
Funding Statement: This research project was supported by the Science and Engineering Research Board (SERB) of DST, Grant Number, TAR/2019/000330, R. Madhumathi, http://www.serb.gov.in/home.php.
Conflicts of Interest: The authors declare that they have no conflicts of interest to report regarding the present study.
1. M. S. Sirsat, E. Cernadas, M. Fernández-Delgado and R. Khan, “Classification of agricultural soil parameters in India,” Computers and Electronics in Agriculture, vol. 135, pp. 269–279, 2017. [Google Scholar]
2. Aqeel-Ur-Rehman, A. Z. Abbasi, N. Islam and Z. A. Shaikh, “A review of wireless sensors and networks’ applications in agriculture,” Computer Standards & Interfaces, vol. 36, no. 2, pp. 263–270, 2014. [Google Scholar]
3. S. Peets, A. M. Mouazen, K. Blackburn, B. Kuang and J. Wiebensohn, “Methods and procedures for automatic collection and management of data acquired from on-the-go sensors with application to on-the-go soil sensors,” Computers and Electronics in Agriculture, vol. 81, pp. 104–112, 2012. [Google Scholar]
4. M. Noura, M. Atiquzzaman and M. Gaedke, “Interoperability in Internet of Things: Taxonomies and open challenges,” Mobile Networks and Applications, vol. 24, no. 3, pp. 796–809, 2019. [Google Scholar]
5. O. Elijah, T. A. Rahman, I. Orikumhi, C. Y. Leow and M. H. D. N. Hindia, “An Overview of Internet of Things (IoT) and data analytics in agriculture: Benefits and Challenges,” IEEE Internet of Things Journal, vol. 5, no. 5, pp. 3758–3773, 2018. [Google Scholar]
6. N. L. Tsakiridis, T. Diamantopoulos, A. L. Symeonidis, J. B. Theocharis, A. Iossifides et al., “Versatile Internet of Things for agriculture: An eXplainable AI approach,” in Proc. IFIP Int. Conf. on Artificial Intelligence Applications and Innovations, Neos Marmaras, Greece, pp. 180–191, 2020. [Google Scholar]
7. D. R. Keeney and J. M. Bremner, “Comparison and evaluation of laboratory methods of obtaining an index of soil nitrogen availability,” Agronomy Journal, vol. 58, no. 5, pp. 498–503, 1966. [Google Scholar]
8. F. Ullah, A. H. Abdullah, O. Kaiwartya, S. Kumar and M. M. Arshad, “Medium Access Control (MAC) for Wireless Body Area Network (WBANSuperframe structure, multiple access technique, taxonomy, and challenges,” Human-centric Computing and Information Sciences, vol. 7, no. 1, pp. 1–39, 2017. [Google Scholar]
9. S. Agarwal, N. Bhangale, K. Dhanure, S. Gavhane, V. Chakkarwar et al., “Application of colorimetry to determine soil fertility through Naïve Bayes classification algorithm,” in Proc. 9th Int. Conf. on Computing Communications and Networking Technologies, Bengaluru, India, pp. 1–6, 2018. [Google Scholar]
10. R. G. Regaldo and J. C. D. Cruz, “Soil pH and nutrient analyzer using colorimetry,” in Proc. IEEE Region 10th Conf. (TENCON), Singapore, pp. 2387–2391, 2016. [Google Scholar]
11. S. Dudala, S. K. Dubey and S. Goel, “Microfluidic soil nutrient detection system: Integrating nitrite, pH, and electrical conductivity detection,” IEEE Sensors Journal, vol. 20, no. 8, pp. 4504–4511, 2020. [Google Scholar]
12. G. Karolina, H. Stephen, S. Ruben and G. Joy, “Adapting smartphone app used in water testing, for soil nutrient analysis,” Computers and Electronics in Agriculture, vol. 175, pp. 1–9, 2020. [Google Scholar]
13. G. Lavanya, C. Rani and P. Ganeshkumar, “An automated low cost IoT based Fertilizer Intimation System for smart agriculture,” Journal of Sustainable Computing, vol. 4, no. 3, pp. 1–12, 2019. [Google Scholar]
14. M, Masrie, M. Rosman, R. Sam and Z. Janin, “Detection of Nitrogen, Phosphorus and Potassium (NPK) nutrients of soil using optical transducer,” in Proc. 4th Int. Conf. on Smart Instrumentation, Putrajaya, Malaysia, pp. 1–4, 2017. [Google Scholar]
15. J. C. V. Puno, A. A. Bandala, E. P. Dadios and E. Sybingco, “Vision system for soil nutrient detection using fuzzy logic,” in Proc. IEEE Region 10th Int. Conf. TENCON, Jeju, Korea (Southpp. 0617–0622, 2018. [Google Scholar]
16. R. E. N. Macabiog, N. A. Fadchar and J. C. D. Cruz, “Soil NPK levels characterization using near infrared and artificial neural network,” in Proc. 16th IEEE Colloquium on Signal Processing and its Applications, Langkawi, Malaysia, pp. 141–145, 2020. [Google Scholar]
17. R. T. Liu, L. Q. Tao, B. Liu, X. G. Tian, M. A. Mohammad et al., “A miniaturized on-chip colorimeter for detecting NPK elements,” Sensors, vol. 16, no. 8, pp. 1–9, 2016. [Google Scholar]
18. S. A. D. A. N. Dissanayake, H. Pasqual and B. C. L. Athapattu, “Economical colorimetric smart sensor to measure water quality of drinking water in CKDu prevalence areas,” IEEE Sensors Journal, vol. 17, no. 18, pp. 5885–5891, 2017. [Google Scholar]
19. R. Aarthi and D. Sivakumar, “Expert system for soil macronutrient recommendation,” Int. Journal of Innovative Works in Engineering and Technology, vol. 3, no. 2, pp. 209–215, 2017. [Google Scholar]
20. U. Aadithya, S. Anushya, N. B. Lakshmi and S. Rajeswari, “Fuzzy logic-based hybrid recommender of maximum yield crop using soil, weather and cost,” ICTACT Journal on Soft Computing, vol. 6, no. 4, pp. 1261–1269, 2016. [Google Scholar]
21. A. Tzounis, N. Katsoulas, T. Bartzanas and C. Kittas, “Internet of Things in agriculture, recent advances and future challenges,” Biosystems Engineering, vol. 164, no. 15, pp. 31–48, 2017. [Google Scholar]
22. M. Ammar, G. Russello and B. Crispoa, “Internet of Things: A survey on the security of IoT frameworks,” Journal of Information Security and Applications, vol. 38, no. 9, pp. 8–27, 2018. [Google Scholar]
23. G. O. Ogunleye, S. G. Fashoto, P. Mashwama, S. A. Arekete, O. M. Olaniyan et al., “Fuzzy logic tool to forecast soil fertility in Nigeria,” Scientific World Journal, vol. 2018, no. 2, pp. 1–7, 2018. [Google Scholar]
24. H. Singh and N. Sharma, “Optimization of fertilizer rates for wheat crop using fuzzy expert system,” Int. Journal of Computer Applications, vol. 100, no. 1, pp. 36–40, 2014. [Google Scholar]
25. S. Nirosha and R. Srininvasan, “Application of soft computing algorithm for the fertigation of horticulture crops,” Int. Journal of Innovative Research in Computer and Communication Engineering, vol. 3, no. 2, pp. 854–858, 2015. [Google Scholar]
26. G. Prabakaran, D. Vaithiyanathan and M. Ganesan, “Fuzzy decision support system for improving the crop productivity and efficient use of fertilizers,” Computers and Electronics in Agriculture, vol. 150, pp. 88–97, 2018. [Google Scholar]
27. B. Sundara, “Sugarcane Cultivation,” in Sangam Books Limited, 1st ed., 1998. [Google Scholar]
28. F. Ullah, A. H. Abdullah, O. Kaiwartya and M. M. Arshad, “Traffic priority-aware adaptive slot allocation for medium access control protocol in wireless body area network,” Computers, vol. 6, no. 1, pp. 1–26, 2017. [Google Scholar]
 | This work is licensed under a Creative Commons Attribution 4.0 International License, which permits unrestricted use, distribution, and reproduction in any medium, provided the original work is properly cited. |