DOI:10.32604/csse.2022.027211
| Computer Systems Science & Engineering DOI:10.32604/csse.2022.027211 | |
| Article |
Vulnerability of Regional Aviation Networks Based on DBSCAN and Complex Networks
1Civil Aviation Flight University of China, Guanghan, 618307, China
2Webchain Pty Ltd., Sydney, NSW, 2118, Australia
*Corresponding Author: Hang He. Email: 43162164@qq.com
Received: 12 January 2022; Accepted: 08 March 2022
Abstract: To enhance the accuracy of performance analysis of regional airline network, this study applies complex network theory and Density-Based Spatial Clustering of Applications with Noise (DBSCAN) algorithm to investigate the topology of regional airline network, constructs node importance index system, and clusters 161 airport nodes of regional airline network. Besides, entropy power method and approximating ideal solution method (TOPSIS) is applied to comprehensively evaluate the importance of airport nodes and complete the classification of nodes and identification of key points; adopt network efficiency, maximum connectivity subgraph and network connectivity as vulnerability measurement indexes, and observe the changes of vulnerability indexes of key nodes under deliberate attacks and 137 nodes under random attacks. The results demonstrate that the decreasing trend of the maximum connectivity subgraph indicator is slower and the decreasing trend of the network efficiency and connectivity indicators is faster when the critical nodes of the regional airline network are deliberately attacked. Besides, the decreasing trend of the network efficiency indicator is faster and the decreasing trend of the maximum connectivity subgraph indicator is slower when the nodes of four different categories are randomly attacked. Finally, it is proposed to identify and focus on protecting critical nodes in order to better improve the security level of regional airline system.
Keywords: DBSCAN algorithm; regional airlines; key node; vulnerability
Regional airlines are an important part of the national route network [1] and exert a vital role in the construction of a strong civil aviation country, but regional airlines are also a topic that has long plagued the development of China’s air transportation industry. With the in-depth study of complex network characteristics, the study of node importance has become an important topic in complex networks. This study analyzes the topology and network performance of regional aviation, identifies the key nodes of regional aviation network effectively, and evaluates the node importance to improve the safety of regional aviation network.
Scholars both at home and abroad have proposed various evaluation methods, such as single-indicator evaluation. P. Bonacich proposed the degree centrality based on node degree value [2]. He proposed the mesoscopic centrality by considering from the propagation path perspective [3] and the proximity centrality considering the distance between nodes in the network [4]. There are also multi-indicator fusion evaluations. YANG et al. [5] considered that the importance of nodes depends on the degree and the mesonumber of two indicators, and Yu Tian applies the aggregation coefficient and network importance to evaluate the importance of nodes [6]. With the idea of multi-attribute information fusion, Hongming Mo proposed a node multi-attribute identification method for complex networks [7]. Xiping Zhang introduced the concept of m-order neighbor nodes and proposed a node importance method for complex networks based on the importance contribution of m-order neighbor nodes [8]. Feng Wang put forward the concept of m-order neighbor node importance contribution coefficient matrix to establish the evaluation model after considering the node’s own attributes, the node’s position in the network as well as the degree importance contribution and meso-importance contribution of m-order neighbor nodes [9]. Besides, an estimation mechanism for assessing critical nodes in IoT systems has been proposed. The estimation of critical nodes consists of two components, respectively, the utilization relationship between nodes and the impact on the system if the node is attacked, quantifying these two components in terms of node importance value and node risk value [10]. In summary, the existing literature is based on degree, proximity, mesonumber, and aggregation coefficients to evaluate the importance of network nodes or to propose a new method to optimize and innovate these indicators [11].
Clustering is an important component of unsupervised learning in the field of machine learning, and clustering algorithms have important applications in industry and have also received extensive attention and research in academia [12]. Sun et al. [13] first classified the heartbeats into five common Arrhythmia classes. The heartbeats classified as S and V by Rist are further classified by Morst to enhance the classification accuracy. Hassan et al. [14] proposed a simple oversampling method based on Multivariate Gaussian distribution and K-means clustering, called GK-Means. Clustering proves an effective data mining method to discover data distribution and hidden features from featureless online learning data [15]. The common clustering analysis methods include hierarchical methods, partitioning methods, grid-based methods, density-based methods, and model-based methods. This study adopts DBSCAN clustering algorithm. DBSCAN algorithm is a classical density-based clustering algorithm, which was first published in the journal science. DBSCAN algorithm does not need to pre-specify the number of clusters for clustering, and can discover any number and shape of clusters in noise-containing datasets [16], which has the advantages of strong interpretability, good visualization and easy understanding.
Recently, several scholars have introduced complex network topologies into the field of airport networks, and Yaru Dang constructs a Chinese air passenger flow network and adopts a deliberate attack with three centrality degrees to explore the network’s resistance to destruction [17]. Some scholars have also investigated the evolution of aviation airport networks. Xinwei Yang analyzed the basic nature of Chinese airline networks and their evolution in recent years, and studied the destructiveness of the network structure through the maximum connectivity subgraph index [18]. Lingling Yan used five methods such as degree centrality and near centrality to rank the importance of nodes in Chinese airline networks, and used vulnerability indicators to confirm the effectiveness of the ranking methods [19]. Delong Wang combined the complex network topological characteristics with the traffic and economic characteristics of the airport itself in order to comprehensively evaluate the importance of the airport network [11]. Based on the complex network, the degree of influence of different influencing factors on flight punctuality, whether it is positive or negative, is studied. Moreover, the study of these factors will provide some references for the practical application of improving flight punctuality [20]. With the purpose of improving the objectivity of urban rail network vulnerability assessment, Chaoqun Ma et al. [21] integrated passenger demand characteristics into the calculation of network vulnerability, and analyzed the characteristics of urban rail network and its vulnerability from the perspective of network passenger flow with Xi’an urban rail network as an example. Based on the disturbance events influencing the vulnerability of the subway system, a directed complex network of disturbance events is constructed, and it is concluded that only a few key nodes can directly affect the vulnerability of the subway [22]. The vulnerability of the global network is higher than that of the local network when the central node of the urban express network is deliberately attacked. The vulnerability of the global network and the local network are synchronized when the transit node is deliberately attacked. The impact of the sequential failure of individual nodes on the network is small, while the impact of the cascade failure of nodes on the network is larger, and the failure of nodes with high importance in successive deliberate attacks can cause the network to collapse rapidly [23]. He linked community detection in the field of complex networks with clustering algorithms in machine learning, explored new methods for community structure detection, and provided certain reference ideas for cross research of related disciplines [24].
The current aviation network performance studies are based on complex network topologies, and the selection of key nodes is relatively simple, lacking a perfect index system. Besides, the analysis of network performance uses a single index. In fact, the importance of airport network nodes is also related to the attributes of the airport and its region, and the comprehensive consideration of multi-layer indicators makes it reasonable to assess the importance of nodes. In addition, several indicators that can measure the network performance are selected to explore the degradation trend of the performance of regional airline network and propose optimization suggestions.
2.1 Construction of Regional Airline Network Model
In this paper, airports with less than 2 million passengers per year are defined as feeder airport. Besides, the routes connecting feeder airports at one end or both ends are positioned as feeder routes. All feeder routes form a feeder airline network. Using Gephi visualization software, the undirected regional airline network diagram is drawn, as shown in Fig. 1 below.
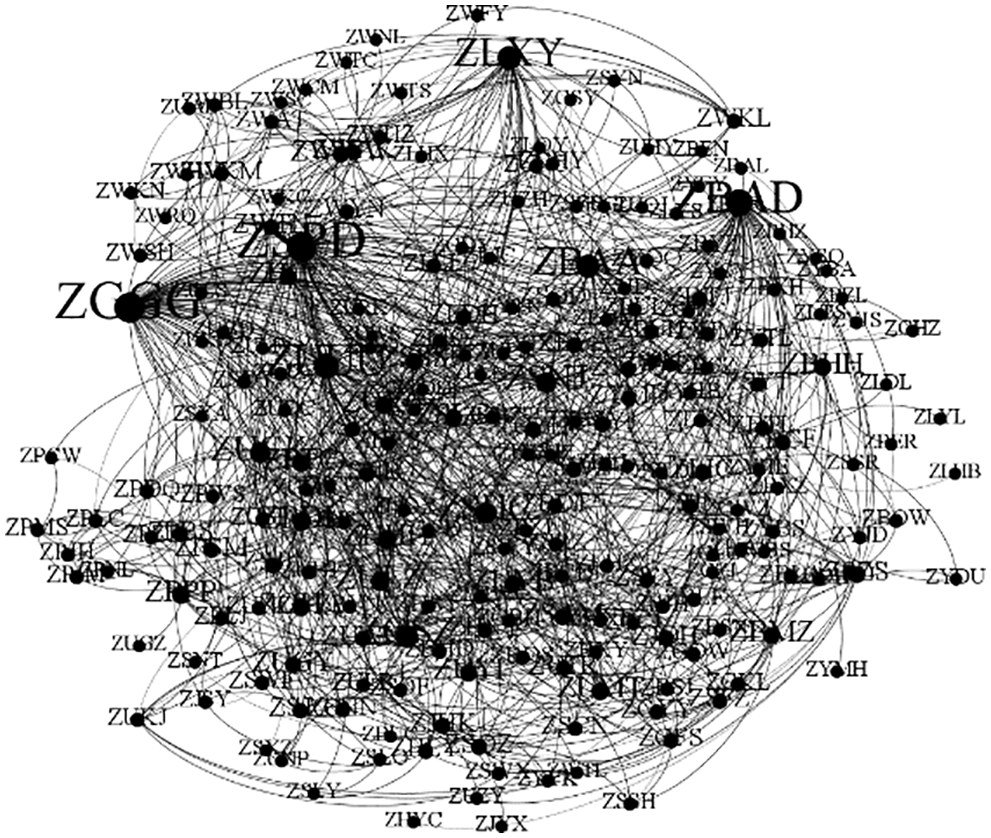
Figure 1: Regional airline network map (2020 data)
There are 161 nodes and 2290 edges in the figure. The nodes represent the regional airports and the edges represent the direct connection between two airport nodes. The size of a node in the graph depends on its degree value, indicating the higher the degree value, the larger the node.
2.2 Airport Node Importance Assessment Index
The identification of airport key nodes is important for the vulnerability analysis of the regional airline network. To establish a perfect index system of airport node importance, the selected indexes should be comprehensive and representative. They should not only reflect the nature of complex network topology, but also combine with the attributes of the airport and the region where the airport is located. Therefore, the selected indicators are shown in Tab. 1 below.
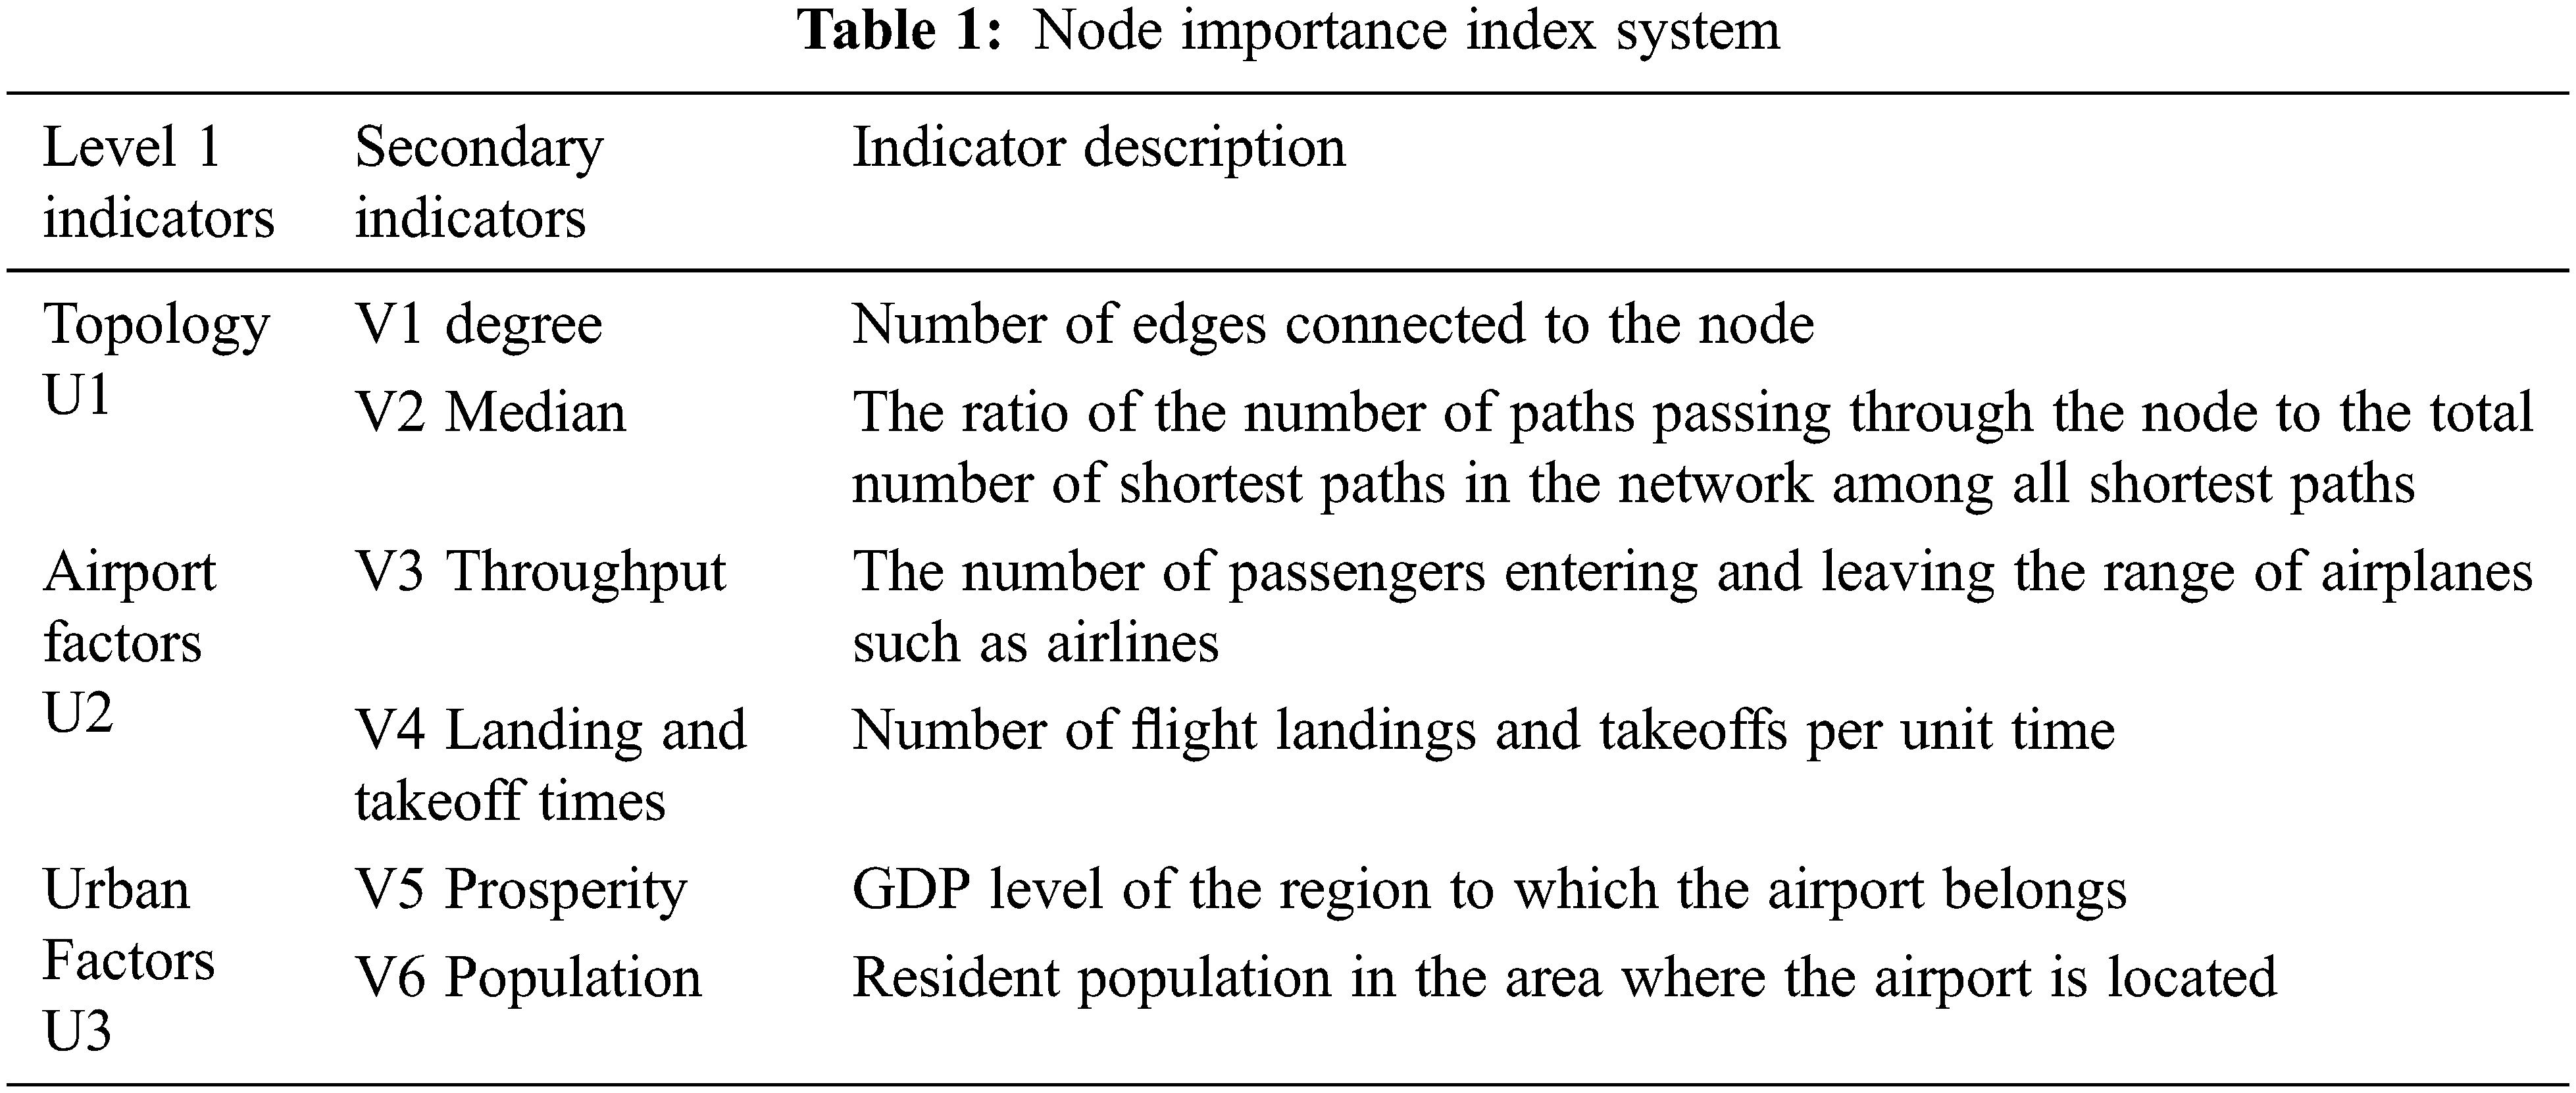
The greater the degree of a node in an airport network, the more routes the airport has, and the higher its importance. The number of nodes reflects the role and influence of the nodes in the network, which is a vital global geometric quantity.
Airport attributes are reflected by passenger throughput and landings. Passenger throughput is one of the most intuitive signs of an airport’s capacity and busyness, and airports with higher throughput have more flights and are more important. City attributes include prosperity and population. A city’s population reflects a city’s consumption demand and spending power, and the higher the population of the city where the airport is located, the higher the demand for air travel, the higher the level of city GDP, the higher the spending power of residents, the higher the possibility of choosing air travel, and the higher the importance of the airport. Therefore, the selected indicators are presented in Tab. 1 below.
where the V1 node degree is calculated as
The formula for calculating the number of points is
The commonly used vulnerability metrics include network efficiency, network connectivity, and maximum connectivity subgraph size. The network efficiency metric measures the effectiveness of the network, the connectivity metric calculates the overall working performance of the network, and the maximum connectivity subgraph metric computes the connectivity of the network.
Network efficiency is expressed as:
where i and j denote nodes, G denotes the network, N denotes the number of airport nodes, and
The network connectivity is expressed as:
The formula eG denotes the number of edges of the network G, and
The maximum connected subgraph dimensions are expressed as:
where N and N′ refer to the maximum connected subgraph size before and after node damage, respectively, that is, the maximum number of connected subgraph nodes formed by the network.
2.4 Entropy Weight Topsis Method
The entropy topsis method is an assignment method based on the entropy method to improve the TOPSIS method model, which can determine the weights according to the amount of information reflected by the degree of variation of each index value, and can calculate the closeness to the optimal solution by the value of the difference between the evaluation object and the positive and negative ideal solutions.
Step 1: Standardization of indicators.
Positive indicators:
where, i denotes the year, j denotes the indicator, and i, j represent non-zero natural numbers.
Step 2: The normalization of the indicator is processed to calculate the weight of the ith indicator in the jth year.
Step 3: Calculate the information entropy of the indicators ej:
Step 4: Calculate the coefficient of variation of each indicator and the weight of the indicator.
Step 5: Construct the weighted normalized decision matrix Vij, Vij = WjZij, Z = (Zij) m×n.
Step 6: Determine the ideal solution and negative ideal solution. It indicates the larger the value of the element V in the decision matrix Vij, the better the solution.
Step 7: Calculate the distance of each node to the ideal solution
Step 8: The relative proximity of each ne is calculated and ranked, indicating the larger the value of Ci, the more important the node is.
DBSCAN is a representative of a typical clustering method that divides classes based on data density and can be effective in automatically discovering the number of target clusters without setting initial values and effectively discovering clusters of different shapes. Given a sample set of D = (x1, x2, …, xm), the parameters (ε, MinPts) are adopted for describing the closeness of the sample distribution in the neighborhood. In the formula, ε describes the neighborhood distance threshold of a sample, and MinPts depicts the threshold of the number of samples in the neighborhood of a sample with distance ε. The clustering process of the DBSCAN algorithm can be expressed as follows.
(1) An arbitrary selection of a data object point p from the data set.
(2) If the selected data object point p is a core point for the parameters Eps and MinPts, find all data object points that are reachable from the density of p to form a cluster.
(3) If the selected data object point p is an edge point, select another data object point.
(4) Repeat steps (2) and (3) until all points are processed.
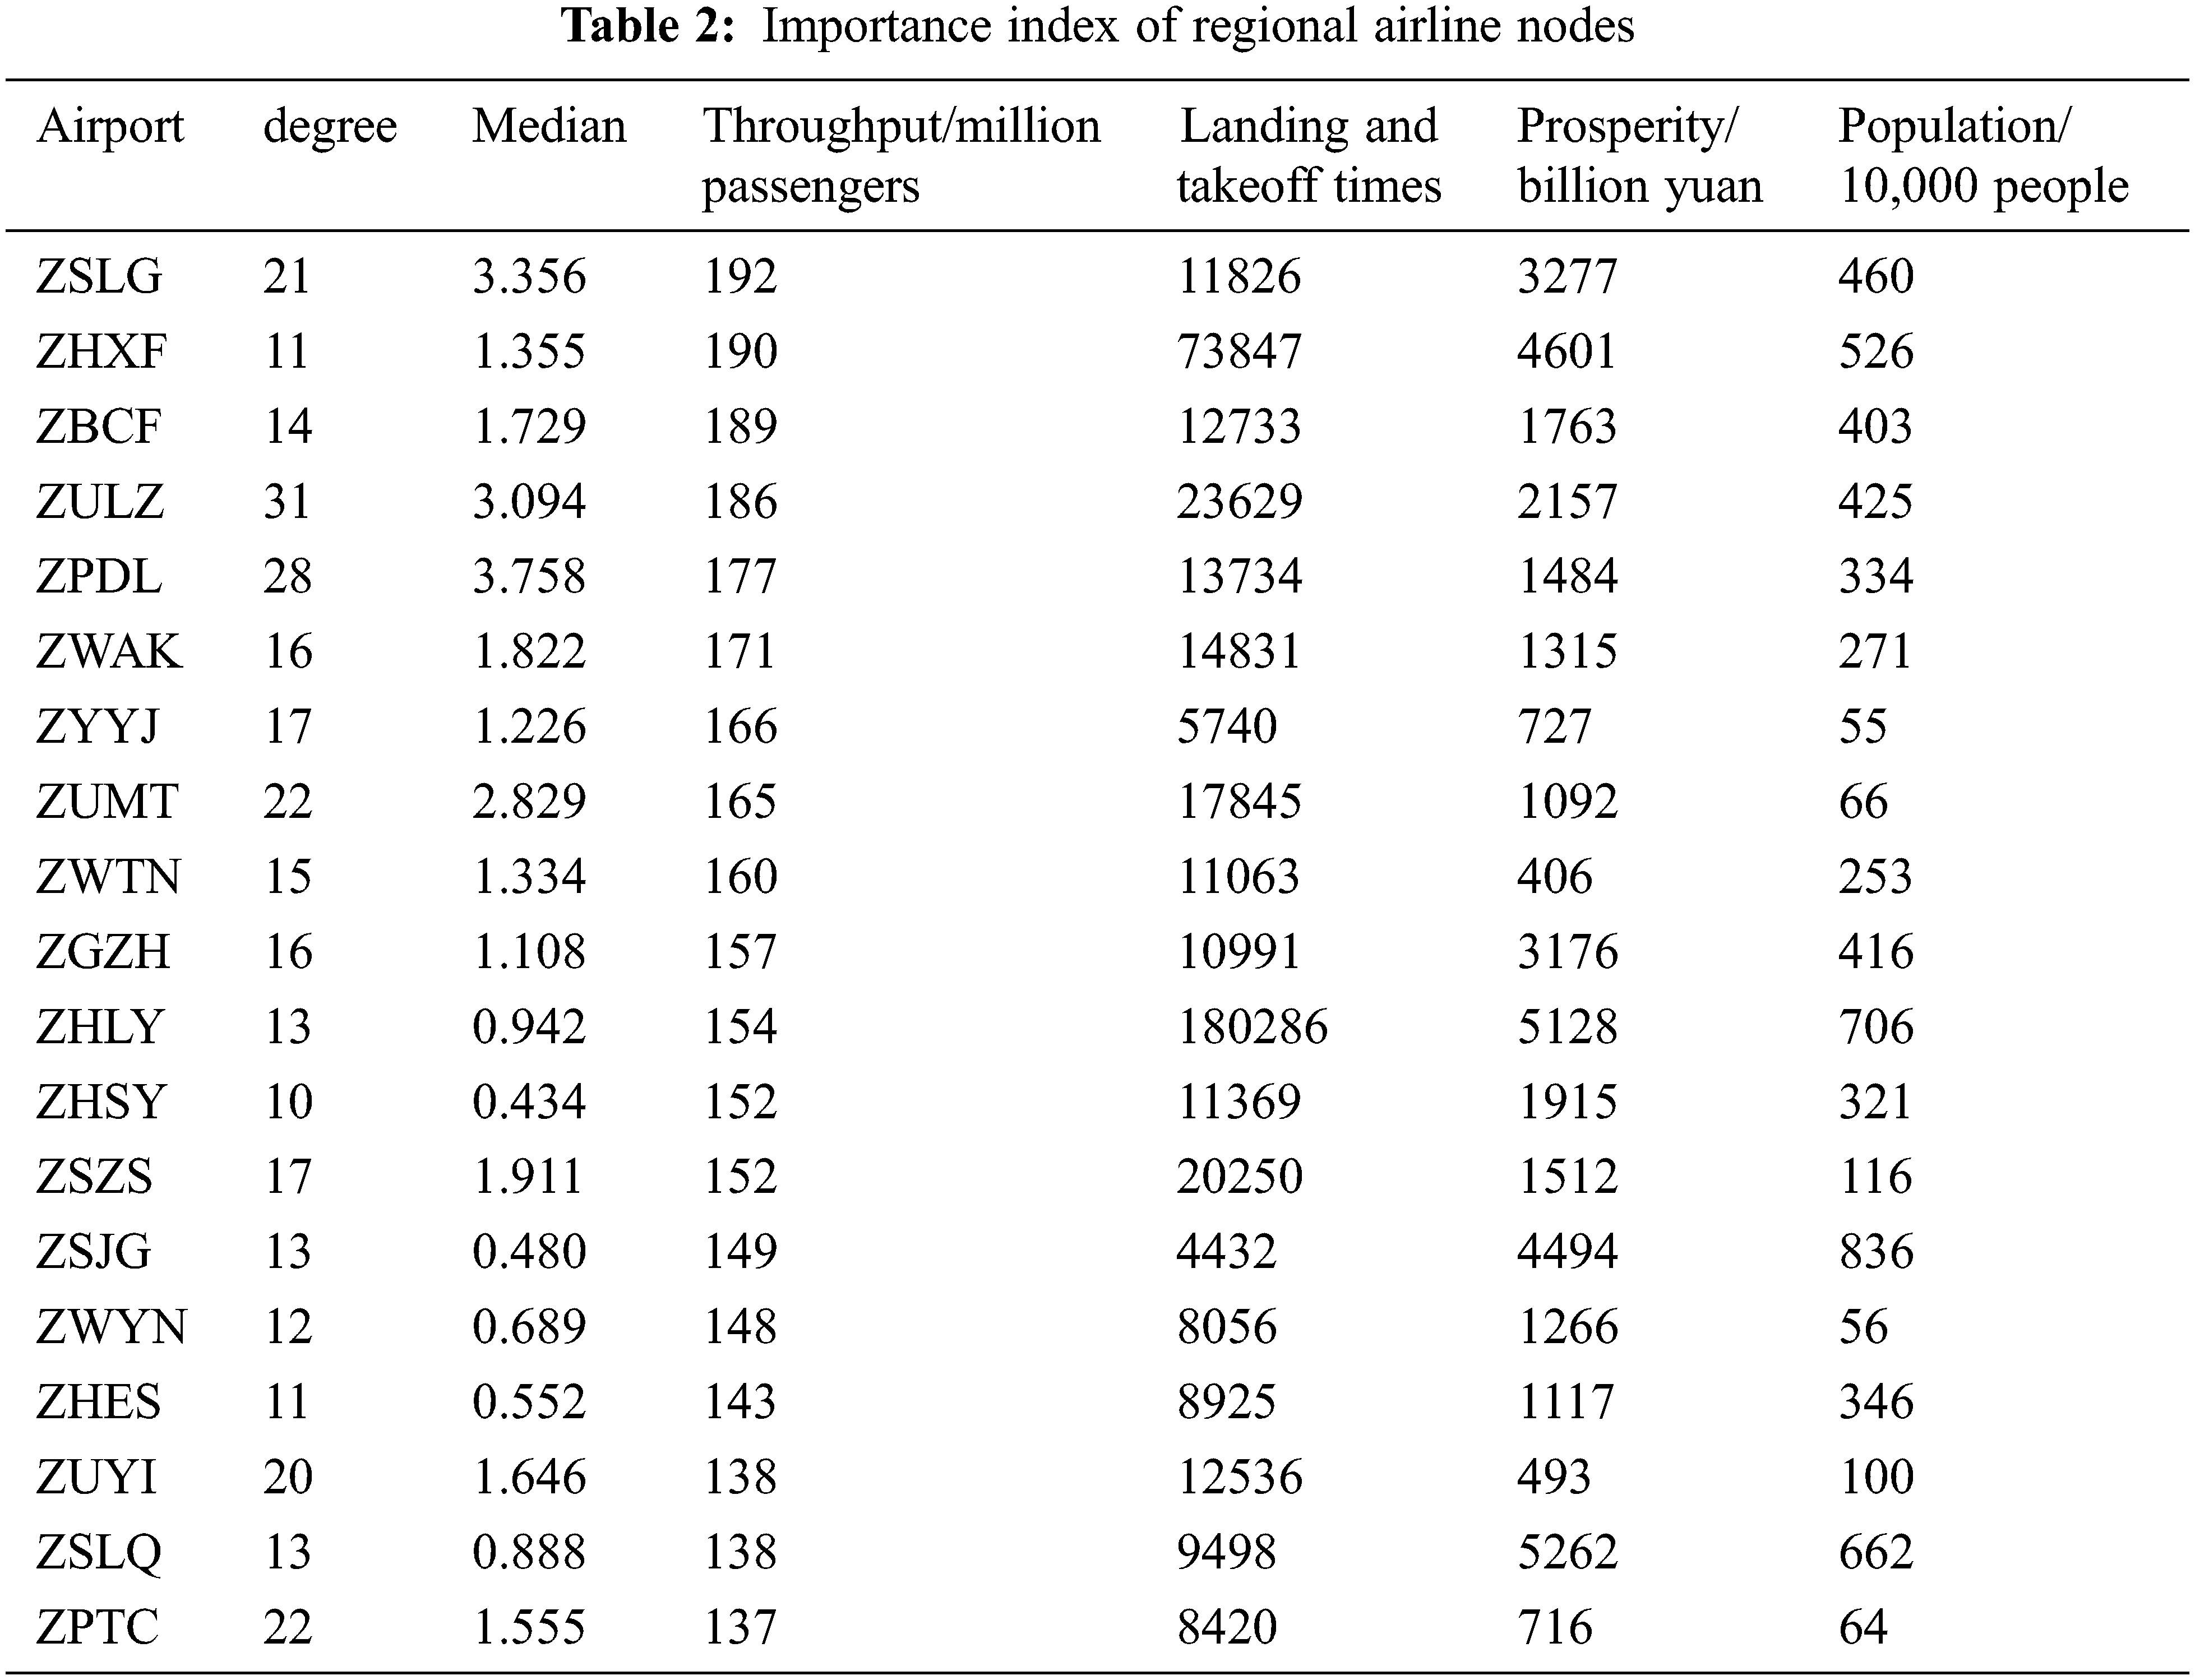
In this study, U1 indicators have been calculated and the data are obtained from the Civil Aviation Administration of China (CAAC) Civil Aviation Advance Flight Plan Management System. Besides, the domestic flight schedule for China’s summer and autumn seasons in 2020 is selected. Specifically, a total of 2148 flight segments data of 161 airport nodes are included. U2 indicator data are obtained from Civil Aviation from Statistics, and U3 indicator is obtained from the official website of National Bureau of Statistics. In summary, the partial data of the importance index of regional airline network nodes are summarized in Tab. 2 below.
3.1 Node Clustering Based on DBSCAN Algorithm
Based on the implementation process of DBSCAN clustering, the key parameters Eps and Minpts are set. A point p is arbitrarily selected from the sample set of clustered data X. If the condition of the point satisfies the determination of the core object, then all data points from that point density can become a cluster, while the data points that do not belong to any cluster are marked as noise points [25].
Fig. 2 provides the aggregation effect when different Eps and MinPts are combined respectively. By comparison, it can be observed that Minpts = 10 has only one class, Minpts = 8 clustering has poor accuracy of only 2 classes, Minpts = 7 has more clustering noise points, and Minpts = 3 clustering result has higher accuracy. By observing the clustering results with different Minpts values, the number of noise points represents the accuracy. Therefore, the key parameters selected in this paper in the DBSCAN algorithm are: Eps = 0.15, Min Pts = 3.
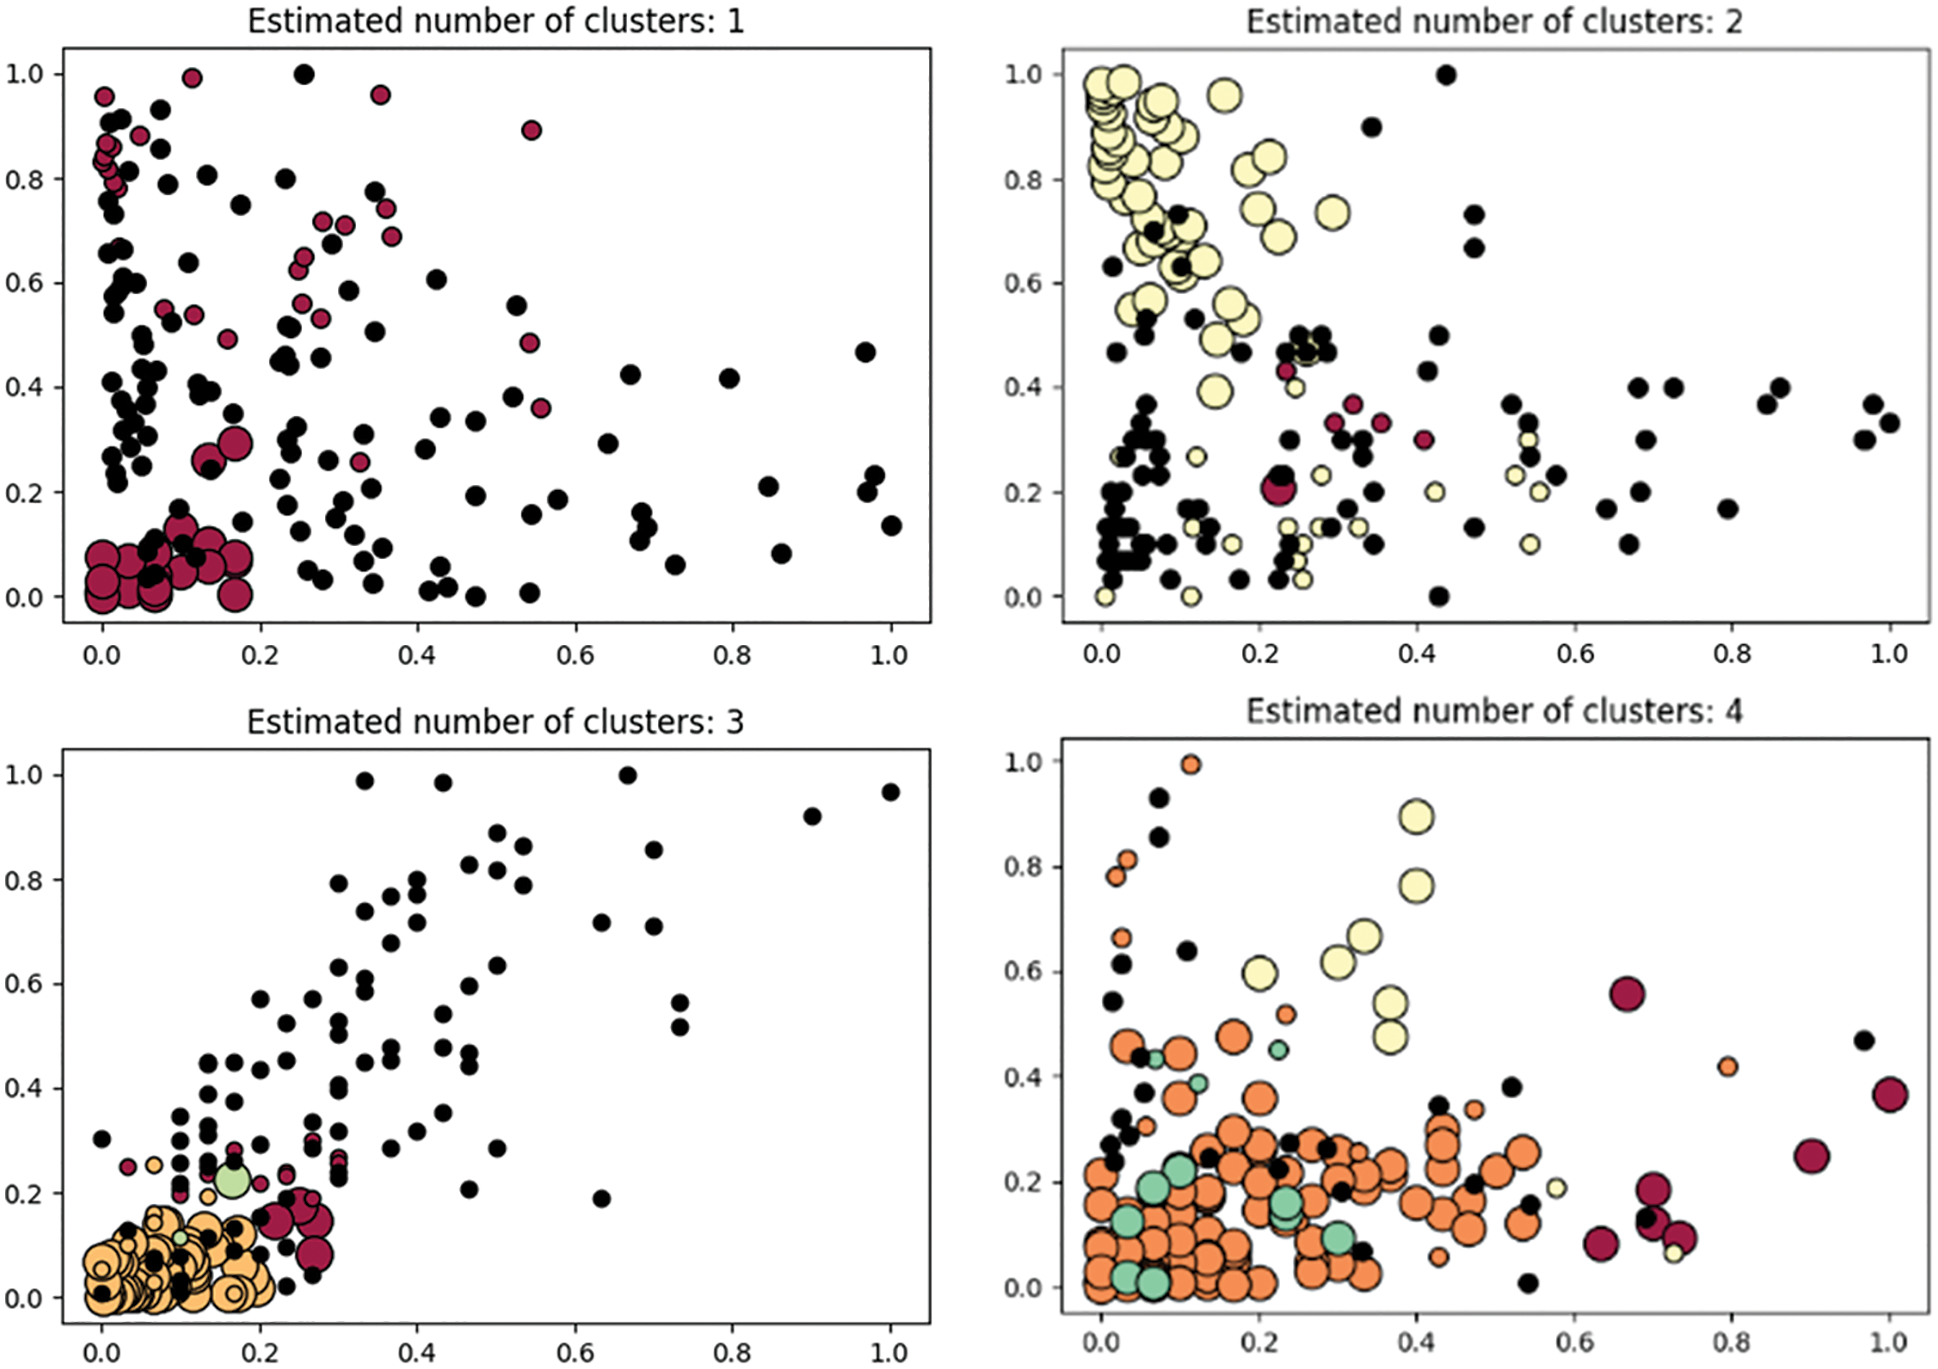
Figure 2: DBSCAN cluster classification results
The clustering results are shown in Fig. 3 below, and the algorithm divides the nodes into 4 clusters. There are 8 airports in the first cluster, respectively, ZHLY, ZPDL, ZULZ, ZGCD, ZUMT, ZSZS, ZBCF and ZSFY. They are basically consistent with the rankings calculated by the entropy-weighted TOPSIS method, demonstrating the accuracy of the algorithm.
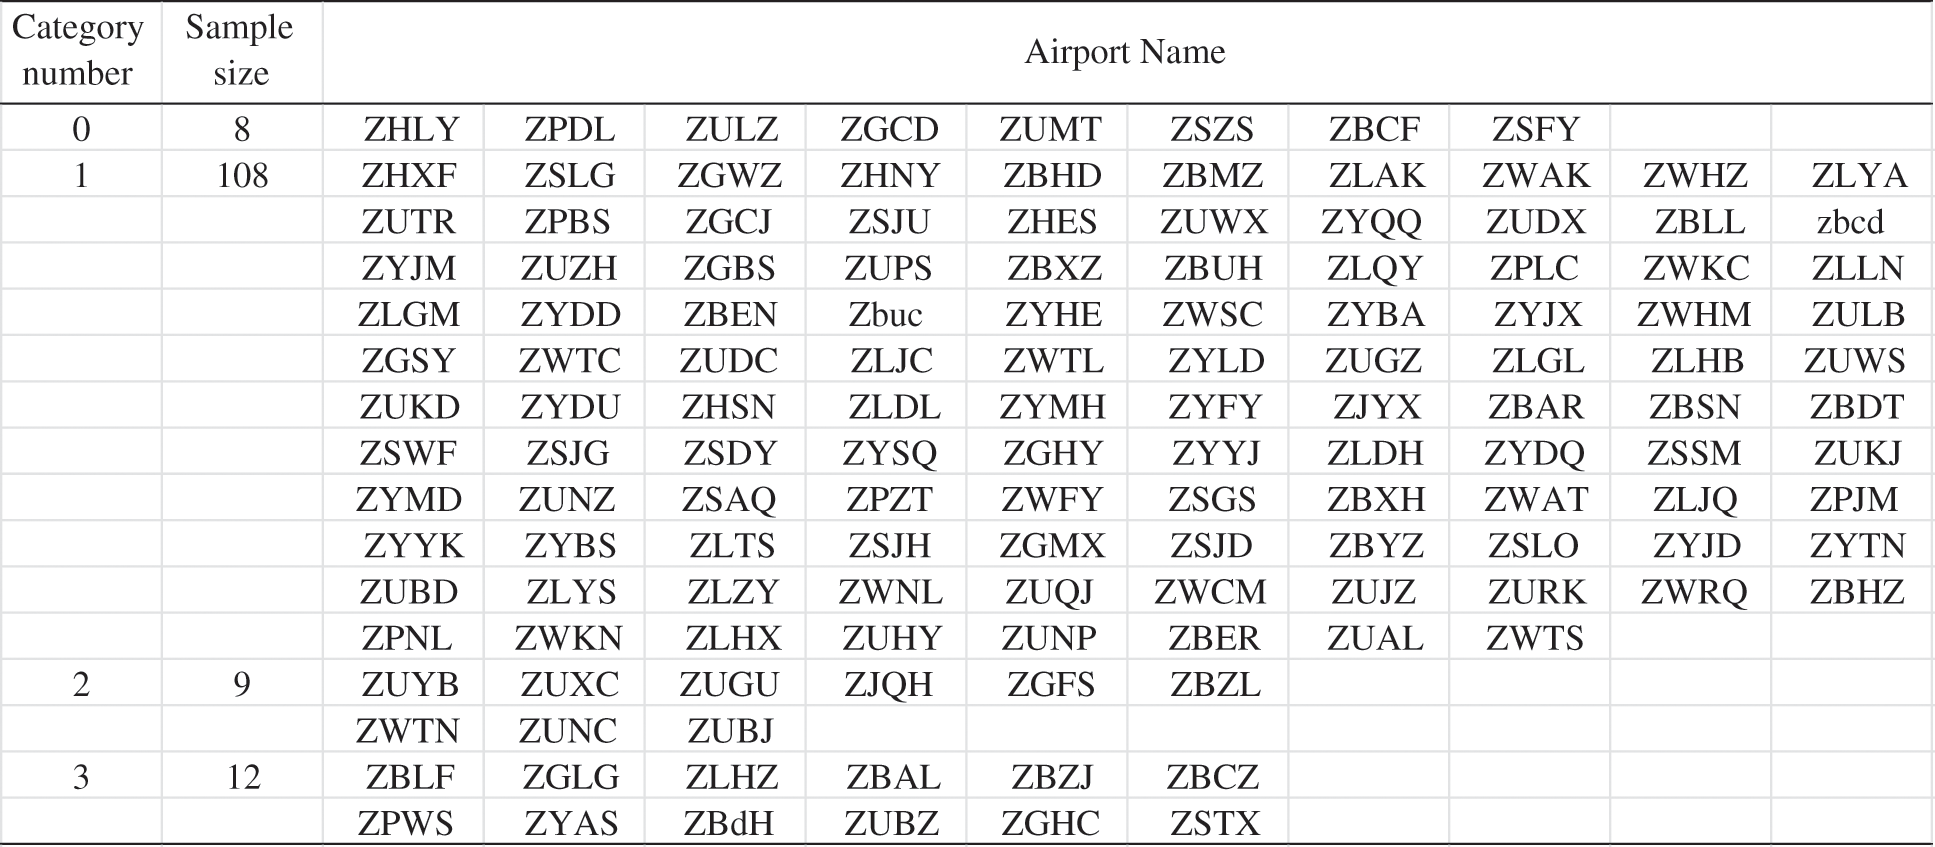
Figure 3: Final clustering results
3.2 Entropy Weight TOPSIS Method to Determine Node Importance Ranking
The entropy weight TOPSIS comprehensive evaluation method was applied to calculate the above 161 nodes, and the entropy weights of the six secondary indicators were 0.103667, 0.238827, 0.113405, 0.255894, 0.131915 and 0.156294. The specific ranking is shown in Tab. 3 below.
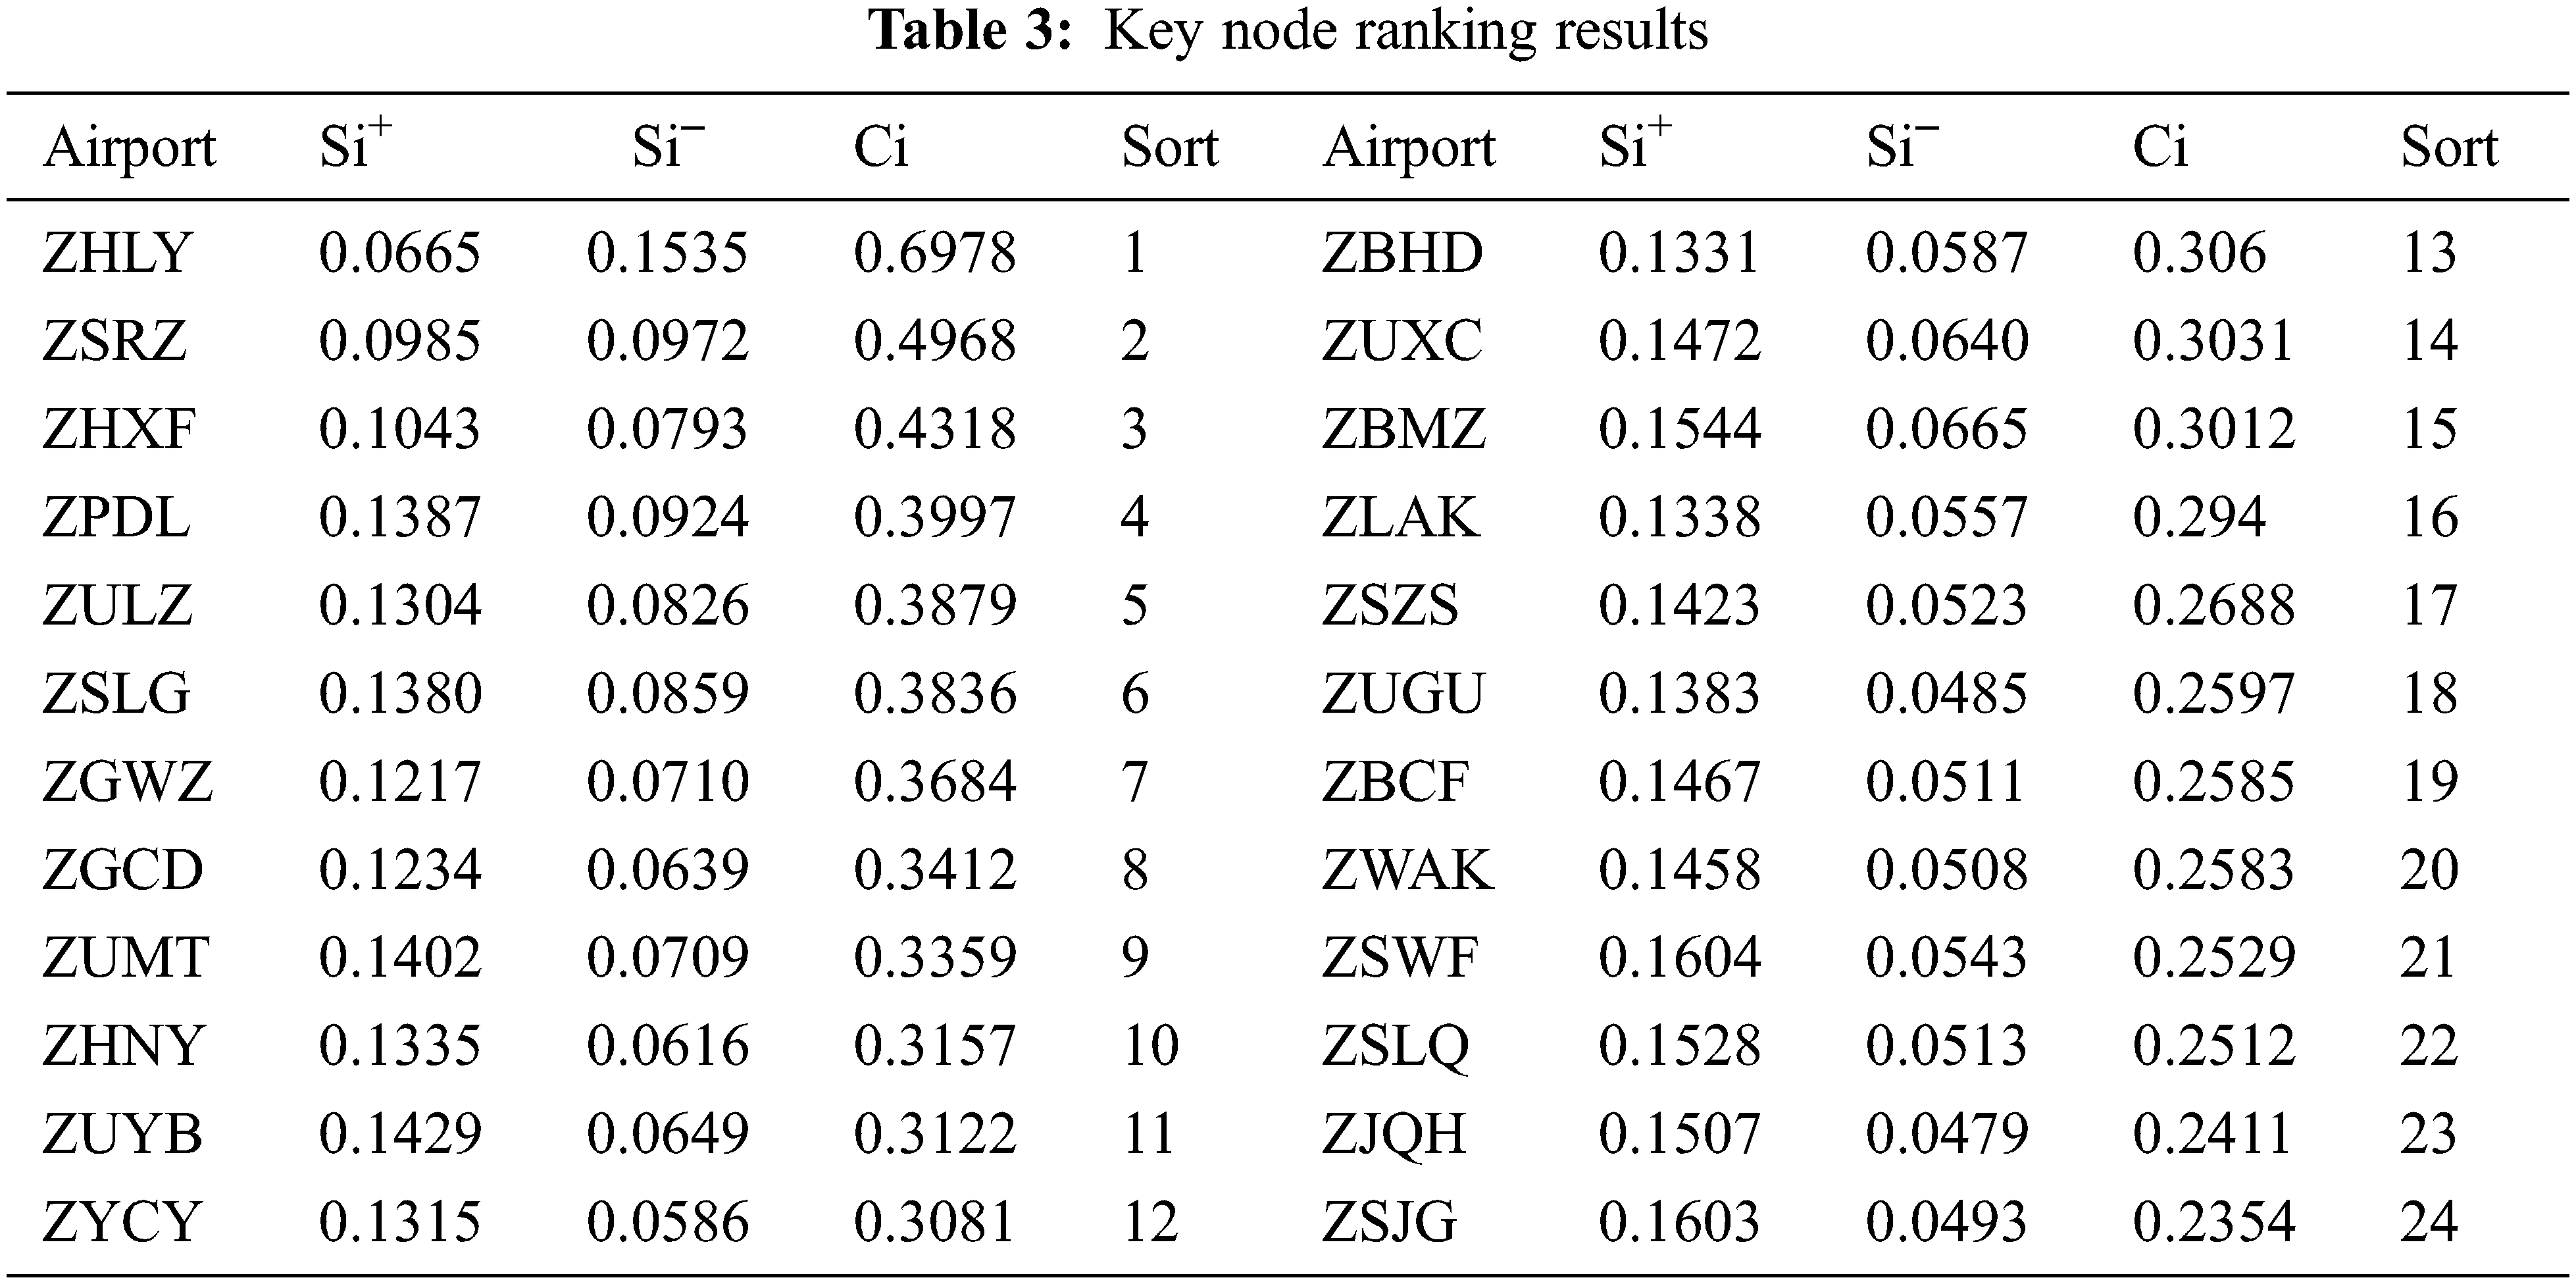
Throughput is ZSLG, ZHXF, ZBCF, ZULZ, and ZPDL. Landing and takeoff times are ZHLY, ZSRZ, ZGWZ, ZHXF, and ZYCY. Prosperity is ZSWF, ZSLQ, ZHLY, ZHXF, and ZSJG, indicating the high economic level of the regions where they are located. Besides, the population is ZHNY, ZGFS, ZBHD, ZSWF, and ZSJG. Based on the data of each index and the comprehensive evaluation results, ZHLY, ZULZ, ZPDL and ZUMT rank relatively high, indicating that they are more important in all aspects of the regional airline network, and the key nodes with higher importance generally have more routes opened, more influence and higher annual throughput.
4 Vulnerability Analysis of Feeder Airlines
Vulnerability was first started in disaster research and gradually introduced into transportation and social fields in the 1970s. Till the present, there has been no unified definition. Vulnerability of the transportation system refers to the vulnerability of the transportation system to a certain event, consequently leading to a significant reduction in service capacity. Combined with the characteristics of regional aviation, its vulnerability can be defined as the extent to which network connectivity is affected when some airports and routes cannot operate normally due to natural disasters or terrorist attacks, etc [26]. The vulnerability of a regional airline network can be measured by the maximum connectivity subgraph size, network efficiency, and connectivity.
According to the entropy weight TOPSIS method ranking of nodes’ importance in the previous section, the degree to which nodes fail under deliberate attacks and affect the change in vulnerability of the feeder airline network can be observed as follows.
Step1 Attack and remove the nodes in order from the highest to the lowest according to the node importance ranking.
Step2 Calculate the vulnerability index after removing the nodes
Step3 Plot and explore and draw conclusions.
Using Sublime Text software, write Python programs for node attacks and follow the steps to damage the nodes in the airline network with the aim to destroy the connectivity of the network. The default initial performance is 100%, and the key nodes are attacked intentionally. In addition, the relationship between the decreasing trend of vulnerability and the damaged nodes is analyzed, as shown in Fig. 4 below.
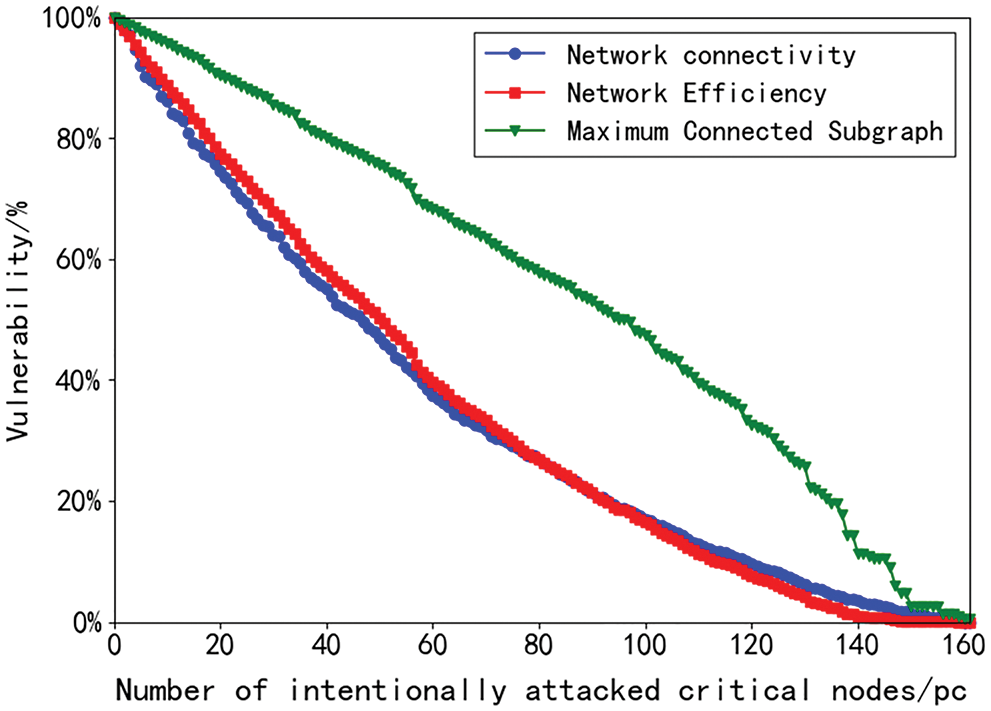
Figure 4: Vulnerability change under deliberate attack
The change of vulnerability after each node is attacked in Fig. 3 is not consistent. Besides, the nodes with greater importance cause more damage to the network vulnerability. The network efficiency and connectivity indexes change similarly, when the attack reaches the 79th node, the network efficiency decreases faster compared to the maximum connectivity subgraph size, which tends to decrease more slowly and finally converges to approximately 3%. On the whole, the network efficiency and connectivity drop faster and then slower. Meanwhile, the maximum connectivity subgraph size is almost constant throughout the paralysis rate, presenting a linear downward trend. When the network is deliberately attacked, the feeder airline is vulnerable, and when the critical nodes are attacked, the network effectiveness and overall working performance are significantly affected.
Based on the previous DBSCAN clustering of nodes into four classes of nodes class_0-class_3, the degree of vulnerability change of the feeder airline network is found by observing the four classes of nodes that fail under random attacks and influence the feeder airline network, as follows.
Step1: Randomly attack the nodes in each category according to category 1, category 2, category 3 and category 4 as the attack objects, respectively, and remove the corresponding nodes.
Step2: Calculate the vulnerability index after removing the nodes
Step3: Plot, analyze, and draw conclusions.
Using Sublime Text software, write Python programs for node attacks. The nodes in the airline network are damaged sequentially based on the steps to destroy the connectivity of the network. The default initial performance is 100%. Random attacks are performed on nodes in the four categories. Besides, the relationship between the decreasing trend of vulnerability and the damaged nodes is analyzed, as shown in Fig. 5 below.
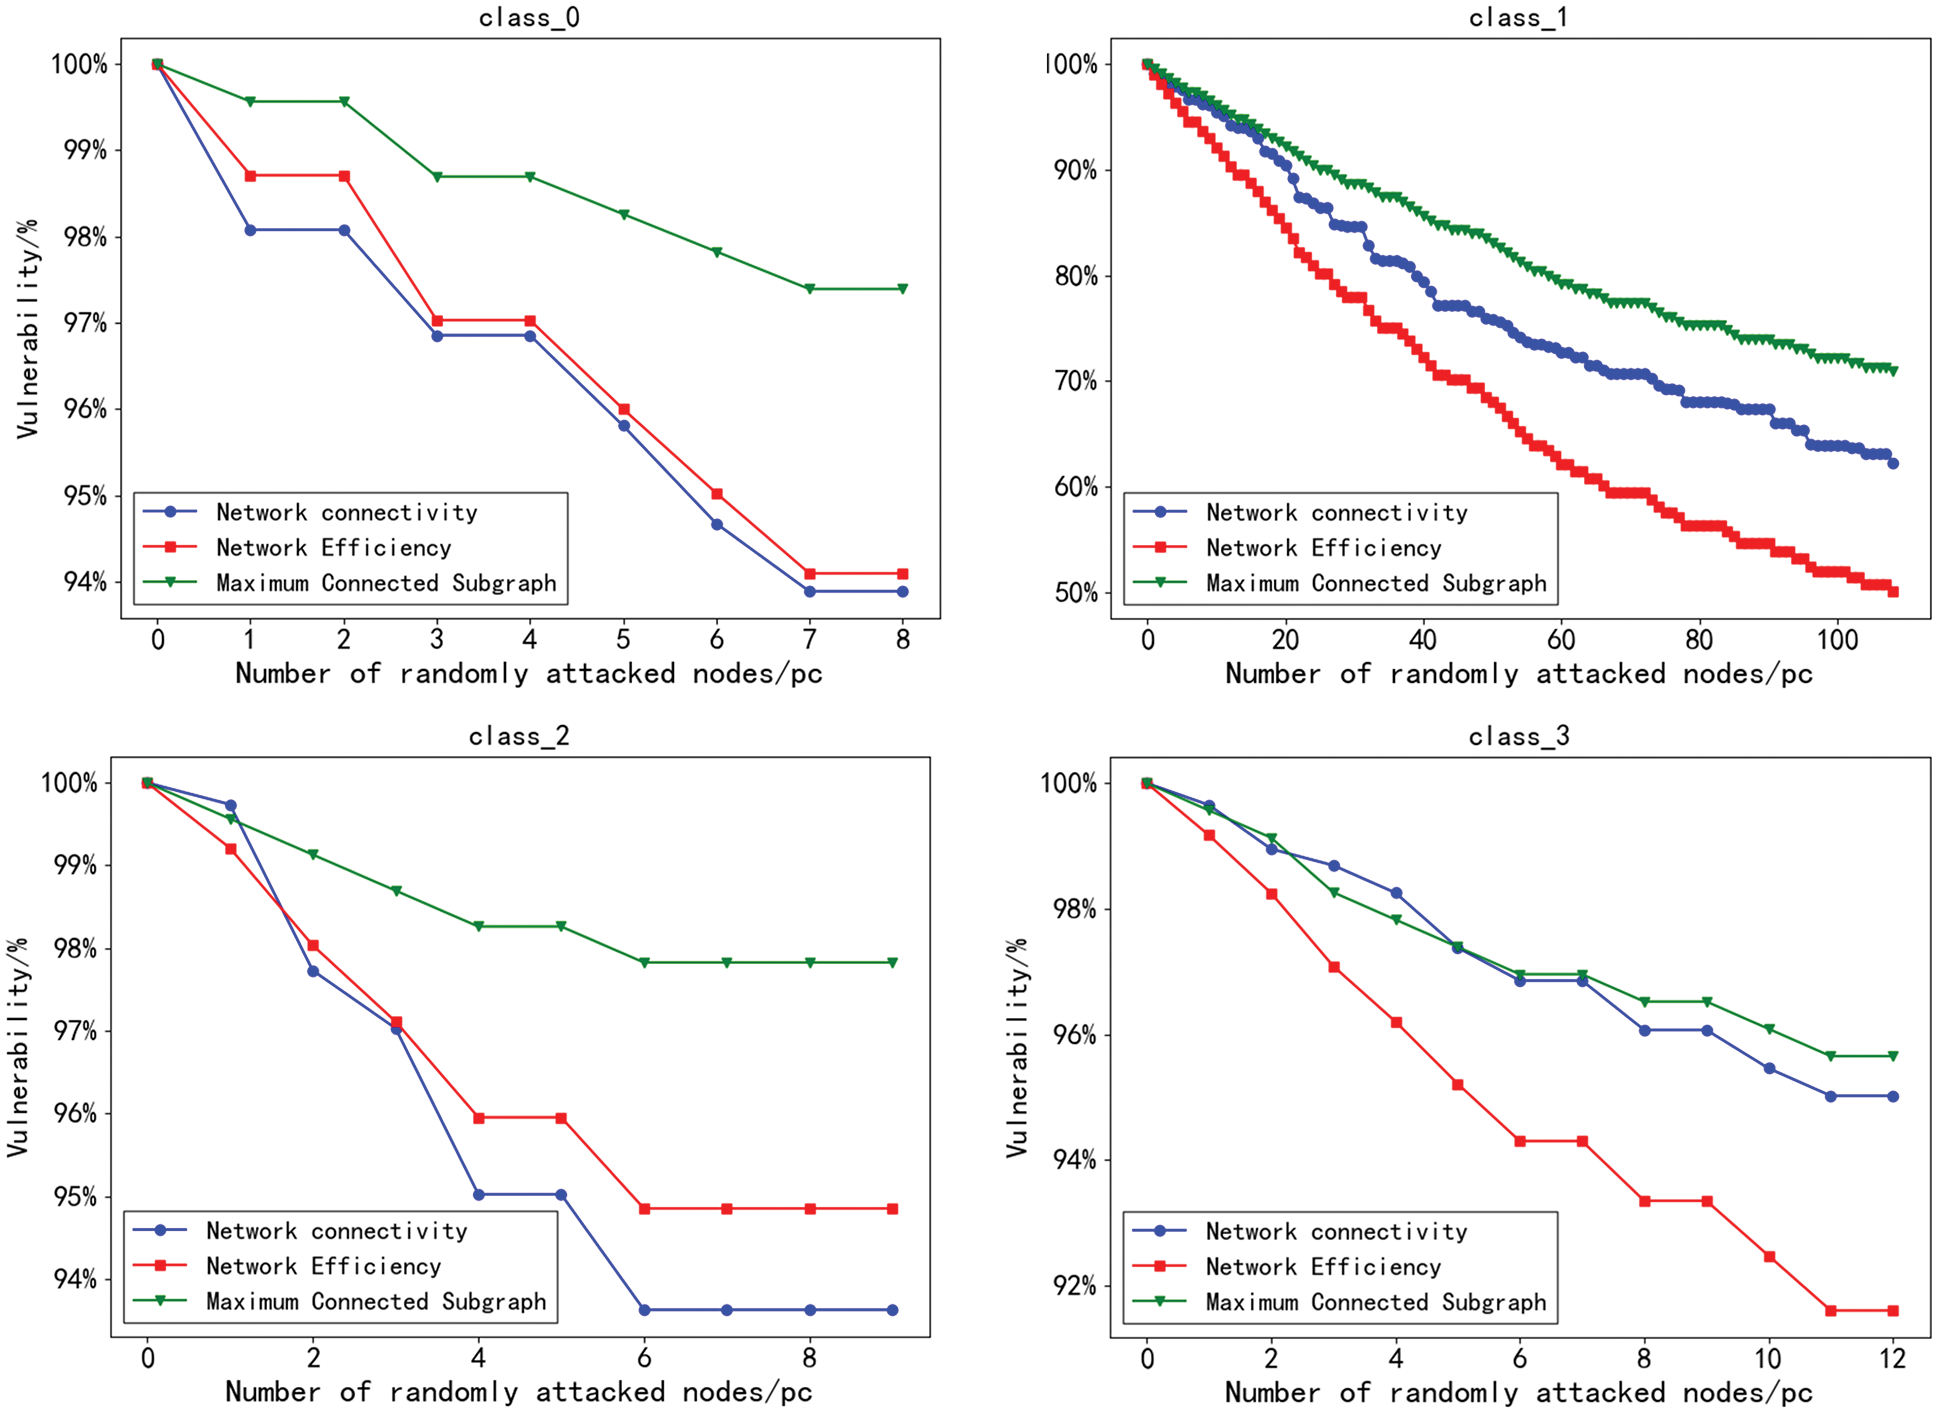
Figure 5: Vulnerability change under random attack
According to Fig. 5, when the nodes in class_0 are attacked first by random attacks, the maximum connectivity subgraph size indicator has a slow decreasing trend, and when the attacks reach 1, 3 and 8 nodes, the network efficiency and connectivity are significantly influenced. When the nodes in class_1 are attacked first, the paralysis rate of the maximum connectivity subgraph and network connectivity is almost constant with a linear decreasing trend, and when 40 nodes are attacked, the network efficiency decreases to 75%, showing that the airport node importance exerts a greater impact on the network effectiveness. Compared with deliberate attacks, the vulnerability index decreases slowly, and the regional airline network under random attacks exhibits some robustness and better stability than deliberate attacks. In addition, the stability of the whole network can be improved after protecting critical nodes.
To conclude, by combining the complex network theory and the related research of DBSCAN clustering algorithm, we have performed an applied study on the regional airline network based on the previous research results, which mainly includes the following aspects.
(1) This study links the indicators in complex networks with the DBSCAN algorithm in machine learning, explores new node clustering methods, and provides certain reference ideas for the cross research of related disciplines.
(2) Based on complex network theory, complex network indicators such as node degree and number of point mediators of regional airline network, as well as vulnerability indicators such as network efficiency, maximum connectivity subgraph and network efficiency can reflect the problems of insufficient connection between airports and topological waste, which can thus provide a basis for further planning and adjustment of subsequent routes.
(3) After a comprehensive assessment of 161 regional aviation nodes, it was found that airports such as Luoyang, Rizhao and Xiangyang, which do not have high node degrees and node meshes, can also be applied as key nodes for key prevention due to higher landing and takeoff times and prosperity.
(4) Through deliberate attacks on airport nodes and random attacks on four types of classified nodes, it is found that the maximum connectivity subgraph index has less impact, the network efficiency and connectivity indexes change in a similar trend, and that the network stability is improved after protecting the critical nodes.
During the research of this study, some areas were also found to be improved.
(1) The selection for parameters Eps and Minpts in DBSCAN algorithm needs to be optimized, and the classification of clusters needs to be verified.
(2) Due to the epidemic, the passenger volume of regional airports is small and the disparity is small, leading to the poor entropy weight method and clustering results.
Funding Statement: The authors received no specific funding for this study.
Conflicts of Interest: The authors declare that they have no conflicts of interest to report regarding the present study.
1. P. W. Zhang and H. Sun, “Study on the current situation of regional airline development and support strategies,” Journal of Civil Aviation Flight Academy of China, vol. 26, no. 1, pp. 11–15, 2015. [Google Scholar]
2. P. Bonacich, “Factoring and weighting approaches to status scores and clique identification,” Journal of Mathematical Sociology, vol. 2, no. 1, pp. 113–120, 2010. [Google Scholar]
3. L. C. Freeman, “A set of measures of centrality based on betweenness,” Sociometry, vol. 40, no. 1, pp. 35–41, 1977. [Google Scholar]
4. L. C. Freeman, “Centrality in social networks: Conceptual clarification,” Social Network, vol. 1, no. 3, pp. 215–239, 1979. [Google Scholar]
5. Y. Yang, Y. Liu and M. Zhou, “Robustness assessment of urban rail transit based on complex network theory: A case study of the Beijing subway,” Safety Science, vol. 79, no. 79, pp. 149–162, 2015. [Google Scholar]
6. Y. Tian, “Network node importance assessment algorithm based on network structured metrics,” Mobile Communication, vol. 42, no. 8, pp. 62–66, 2018. [Google Scholar]
7. H. M. Mo,“A Multi-attribute based method for identifying the importance of complex network nodes,” Journal of Lanzhou College of Arts and Sciences (Natural Science Edition), vol. 32, no. 5, pp. 68–74, 2018. [Google Scholar]
8. X. P. Zhang, Y. S. Li, G. Liu and L. Wang, “A node importance assessment method for complex networks with node importance contribution,” Complex Systems and Complexity Science, vol. 11, no. 3, pp. 26–32+49, 2014. [Google Scholar]
9. F. Wang, L. W. Xu and Y. F. Zheng, “Critical node evaluation of complex networks based on m-order neighbor nodes,” Journal of Fuzhou University (Natural Science Edition), vol. 47, no. 2, pp. 237–243, 2019. [Google Scholar]
10. B. Che, L. Liu and H. Zhang, “KNEMAG: Key node estimation mechanism based on attack graph for IOT security,” Journal of Internet of Things, vol. 2, no. 4, pp. 145–162, 2020. [Google Scholar]
11. C. F. Wang and D. L. Wang, “Importance assessment of airport network nodes based on TOPSIS model,” Mathematical Practice and Understanding, vol. 51, no. 1, pp. 79–87, 2021. [Google Scholar]
12. Y. Z. Wang, “Research on multi-density clustering algorithm,” Ph.D. dissertation, University of Jilin, Jilin, 2020. [Google Scholar]
13. L. Sun, Y. L. Wang, Z. G. Qu and N. N. Xiong, “BeatClass: A sustainable ECG classification system in IoT-based eHealth,” IEEE Internet of Things Journal, vol. 99, pp. 1, 2021. https://doi.org/10.1109/JIOT.2021.3108792. [Google Scholar]
14. M. M. Hassan, A. S. Eesa, A. J. Mohammed and W. K. Arabo, “Oversampling method based on Gaussian distribution and k-means clustering,” Computers, Materials & Continua, vol. 69, no. 1, pp. 451–469, 2021. [Google Scholar]
15. Y. Xue, J. Qin, S. Su and A. Slowik, “Brain storm optimization based clustering for learning behavior analysis,” Computer Systems Science and Engineering, vol. 39, no. 2, pp. 211–219, 2021. [Google Scholar]
16. A. Rodriguez and A. Laio, “Clustering by fast search and find of density peaks,” Science, vol. 344, no. 6191, pp. 1492, 2014. [Google Scholar]
17. Y. R. Dang and S. Z. Song, “Destructiveness analysis of Chinese air passenger network based on centrality,” Complex Systems and Complexity Science, vol. 10, no. 1, pp. 75–82, 2013. [Google Scholar]
18. X. Z. Yang and Z. X. Wang, “Structural characteristics and survivability of China’s passenger route network,” Journal of Henan University of Science and Technology (NATURAL SCIENCE EDITION), vol. 41, no. 2, pp. 21–26 + 5-6, 2020. [Google Scholar]
19. L. L. Yan, Z. Q. Chen and Q. Zhang, “Analysis of important nodes in China’s aviation network based on degree and clustering coefficient,” Journal of Intelligent Systems, vol. 11, no. 5, pp. 586–593, 2016. [Google Scholar]
20. P. Wei, M. D. Lu, X. H. Zhang and Y. L. Teng, “Analysis of flight punctuality rate based on complex network,” Journal of Quantum Computing, vol. 3, no. 1, pp. 13–23, 2021. [Google Scholar]
21. C. Q. Ma, S. Zhang, Q. Chen, R. Cao and L. Ren, “Characteristics of rail transit network and its vulnerability from the perspective of passenger flow characteristics,” Journal of Transportation Engineering, vol. 20, no. 5, pp. 208–216, 2020. [Google Scholar]
22. X. L. Wang, J. Y. Li, M. K. Lian and Z. J. Sun, “Vulnerability analysis of metro system based on complex network model,” Urban Rail Transit Research, vol. 24, no. 8, pp. 47–50, 2021. [Google Scholar]
23. N. Y. Mou, Q. P. Kang and C. F. Jia, “Vulnerability assessment of urban express network under the impact of emergency events,” Chinese Journal of Security Science, vol. 30, no. 12, pp. 125–132, 2020. [Google Scholar]
24. H. He, Z. Zhao, W. Luo and J. Zhang, “Community detection in aviation network based on k-means and complex network,” Computer Systems Science and Engineering, vol. 39, no. 2, pp. 251–264, 2021. [Google Scholar]
25. D. Cheng, L. Zhang, X. Y. Zhao, F. Li, X. Y. Wang et al.,“Prediction of new energy vehicle users’ residence based on clustering algorithm,” Automotive Practical Technology, vol. 46, no. 10, pp. 11–13, 2021. [Google Scholar]
26. X. H. Ren and L. Yang, “Vulnerability analysis of air cargo network in China,” Journal of Safety and Environment, vol. 20, no. 3, pp. 840–848, 2020. [Google Scholar]
 | This work is licensed under a Creative Commons Attribution 4.0 International License, which permits unrestricted use, distribution, and reproduction in any medium, provided the original work is properly cited. |