DOI:10.32604/csse.2022.021215
| Computer Systems Science & Engineering DOI:10.32604/csse.2022.021215 | |
| Article |
A Novel Soft Clustering Approach for Gene Expression Data
1A Constituent College of Anna University, University College of Engineering, Villupuram, 605103, India
2A Constituent College of Anna University, University College of Engineering, Pattukkottai, 614701, India
3Department of Electronics and Communication Engineering, Dr. N.G.P Institute of Technology, Coimbatore, 641048, India
4Department of Computer Science Engineering, Faculty of Engineering and Technology, JAIN (Deemed to be University), Bangalore, 562112, India
*Corresponding Author: E. Kavitha. Email: ekavitharesearch1@gmail.com
Received: 27 June 2021; Accepted: 26 August 2021
Abstract: Gene expression data represents a condition matrix where each row represents the gene and the column shows the condition. Micro array used to detect gene expression in lab for thousands of gene at a time. Genes encode proteins which in turn will dictate the cell function. The production of messenger RNA along with processing the same are the two main stages involved in the process of gene expression. The biological networks complexity added with the volume of data containing imprecision and outliers increases the challenges in dealing with them. Clustering methods are hence essential to identify the patterns present in massive gene data. Many techniques involve hierarchical, partitioning, grid based, density based, model based and soft clustering approaches for dealing with the gene expression data. Understanding the gene regulation and other useful information from this data can be possible only through effective clustering algorithms. Though many methods are discussed in the literature, we concentrate on providing a soft clustering approach for analyzing the gene expression data. The population elements are grouped based on the fuzziness principle and a degree of membership is assigned to all the elements. An improved Fuzzy clustering by Local Approximation of Memberships (FLAME) is proposed in this work which overcomes the limitations of the other approaches while dealing with the non-linear relationships and provide better segregation of biological functions.
Keywords: Reinforcement; membership; centroid; threshold; statistics; bioinformatics; gene expression data
Clustering is an unsupervised learning technique aiming at statistical data analysis to identify patterns and make decisions. It is a multi-objective optimization problem with multiple parameters including distance function, threshold values etc. to be chosen appropriately for effective clustering. Data pre-processing along with the model parameters needs to be modified until we achieve the desired results. Clustering methods have been extensively used for gene expression data [1] with the prospect that they will classify the complete set of discrete associates of genes that have synchronized behaviour and that all of genes that exhibit those behaviour will be assigned to the correct cluster. A classic gene expression matrix is presented in Fig. 1.
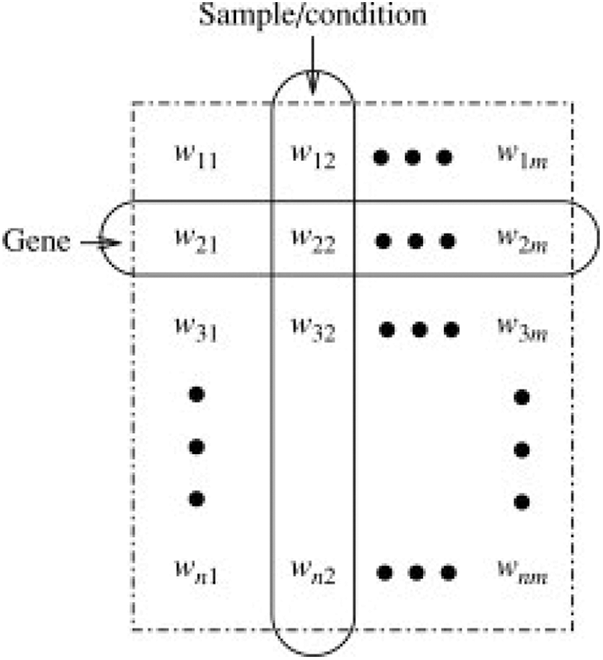
Figure 1: Gene expression matrix
A microarray database contains gene expression data for storing, managing, making it available for analysis and for interpretation purposes. It could either be from a peer reviewed public repository or a specialized repository with different characteristics. When it comes to dealing with the gene expression data, micro array is used to monitor gene expression levels in a given organism. It may contain thousands of spots each containing a few million copies of similar DNA molecules that exclusively relate to a gene.
Various machine learning algorithms can be used for discovering patterns in big data and that can be either in a supervised or an unsupervised learning environment. Linear logistic regression, support vector machines and other multi-class classification methods are supervised where the system is trained with the help of the data set before being tested with the new test vectors. Depending upon the algorithm and the learning parameters, the classification accuracy is determined. On the other hand, clustering algorithms refers to the unsupervised learning methods where the system learns by itself without any training but from the data itself.
Unsupervised algorithms are less complex in nature when compared with the supervised approaches. When dealing with huge volume of gene expression data [2], it is imperative to give importance to the complexity in terms of time and space. They help to identify the features for categorization. Real time analysis is done in case of unsupervised approach and the samples are labelled in the learner’s presence. While the clustering algorithms can be exclusive, agglomerative or overlapping, we prefer to take up the overlapping approach in this work as each sample can belong to more than one class with different membership degrees.
A data point or sample can belong to more than one cluster in case of fuzzy clustering [3]. Similarity measures are used for identifying the clusters as like other learning methods. It could either be distance based, intensity based or connectivity based similarity measure. Fuzzy C-means is one such popular fuzzy clustering algorithm where membership grades are consigned to data points in the population set. This is mathematically represented as:
where x refers to the samples, ck corresponds to the cluster Centroid, the parameter ‘m’ controls the fuzzy cluster and w represents the weight factor to each sample. The membership coefficient could be 0 or 1 in case of a fuzzy clustering. They can also be relaxed and varied between 0 to 1 in case of Fuzzy C – means algorithm and both these are represented with the y-axis [4] as shown in Fig. 2.
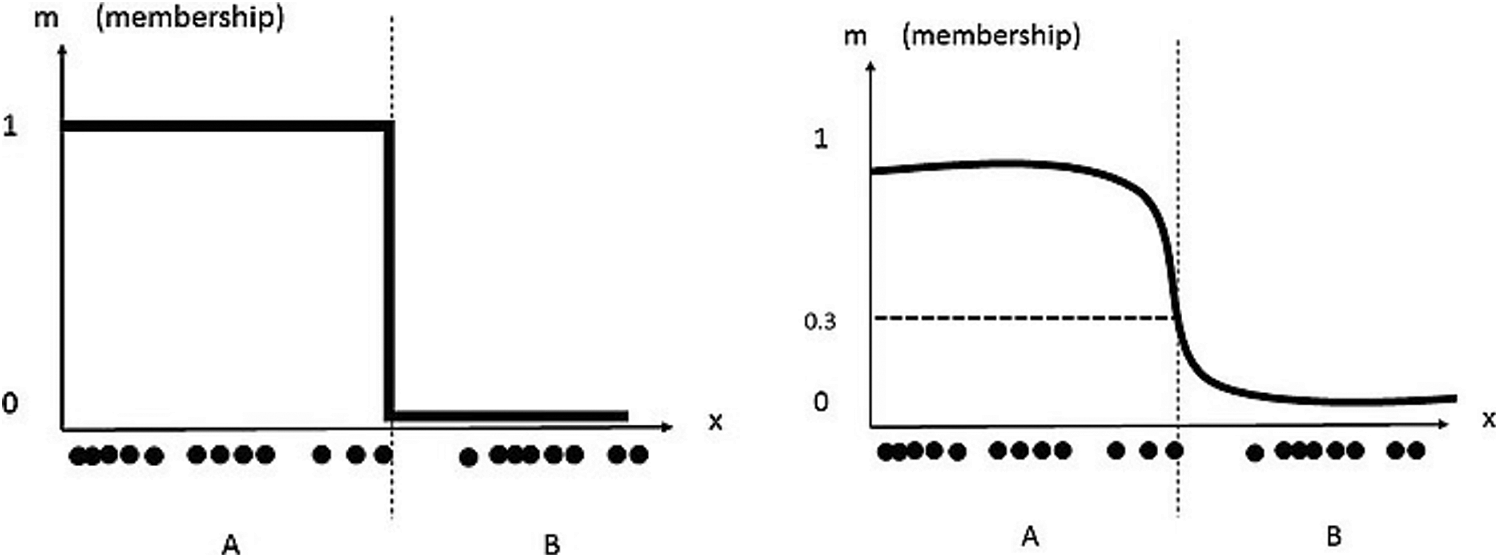
Figure 2: Fuzzy clustering (left) and fuzzy C – means clustering (right)
The neighbourhood objects relationships are considered in FLAMES clustering where the clusters are defined in dataset dense parts and assignments are made accordingly. Three major steps involved in the FLAME algorithm include:
a. Dataset structure information extraction
b. Initiation and updation of fuzzy memberships
c. Construction of clusters
Expectation maximization algorithm is used to estimate the parameters as opposed to the conventional methods and tweaking of the parameters improves the clustering efficiency in our proposed approach.
The rest of the paper is structured as follows: Section 2 presents the literature review relevant to this work, Section 3 details the fuzzy methods for clustering, Section 4 explains the proposed novel approach for clustering gene expression data, Section 5 deals with the proximity measures, experimental results are discussed in chapter 6 while we conclude and provide the further research scope in Section 7.
Gene expression monitoring is carried out with the help of micro arrays. Tens of thousands of genes are analysed in parallel dealing with high amount of data and through the utilization of the technology. The microarray data are presented in the form of images which are converted in to gene expression matrices before being processed and analysed. They discuss how this matrix can be helpful in predicting putative regulatory signals with the help of supervised and unsupervised machine learning algorithms [5].
Rapaport et al. [6] have discussed about the data-analytic tasks that are related to the microarray studies and the methods that are available for gene expression measurement. The protein production is controlled by genes in two principal stages namely the transcription and translation. The book by them also gives guidance to practitioners of this area, on to which method or the statistical approach would be better for data mining along with the projects and packages which helps in interpreting the results.
Physical interactions or genetics are evident with the help of co-expressed gene clusters. Large scale analysis of this gene expression data can be achieved with the help of co-expression clustering. The biological expectations and the traditionally available clustering methods does not match with the results of the expected degree. In order to overcome this issue, AbuJamous et al. [7] proposed a method called as “Clust” which extracts clusters with the help of co-expressed genes and the experimental results also outperform the state-of-the art methods.
Yu et al. [8] have discussed about the implications of gene expression data analytics for the purpose of cancer diagnosis, gene treatments and other related symptoms. Limited samples along with large amounts of data added with the dimensionality issues were the main challenges saaaaaaaaaaaaaaaaaaaaaaaaaaaaaaaaaaaaaaaaaato deal with in clustering. The authors have proposed a projective clustering ensemble which brings in the advantages of both the ensemble clustering as well as the projective clustering. They tested their ideas on the cancer gene expression data set which was publicly available and the results were at least 4.5% better than the other state of the art methods.
Jiang et al. [9] detailed about DNA microarray technology and how it helps to monitor the genes expression levels during the biological processes of associated samples. They have surveyed a wide variety of clustering algorithms in their work and they also discuss about the clustering elements basics in their paper. The work is divided in to three categories and the challenges faced in each of them are detailed along with their representative approaches. They also propose the trending directions towards the end of the paper.
Karmakar et al. [10] article presents one of the tight clustering algorithm. The computational limits are addressed in this paper and the method turns out to be a scalable approach of tight clustering which can be applied to very large data sets including the gene expression data set and validated against simulation study as well as multiple real data analyses set. They bring out the main benefits of the proposed tight clustering method which includes local minimum problem addressing which is normally seen with traditional algorithms like k-means algorithm, pattern extraction based on the tightness factor and a relaxed constraint. With the discussed approach, the concordance probability goes to 1 as the number of repetitions also reaches infinity. If the number of equal random partitions is denoted by L(n) and the number of times, the repetition has to happen to reduce the error is denoted by R(n), then:
Maraziotis et al. [11] have used fuzzy approach to make sure that the samples do multi functioning roles. Prior usage of biological knowledge in the process of pairwise constrains selection helps to improve the clustering efficiency in their proposed work.
Park et al. [12] have also detailed about using fuzzy approach to gene expression data analysis. A Gath-Geva approach is proposed in their work which falls under fuzzy clustering approach and contains genetic information as well. They have improvised the fuzzy c – means clustering algorithm in their work with the help of Gustafson-Kessel algorithms and feel that it could be appropriate for clustering the gene expression data with high dimensions and complexities.
Scaria et al. [13] have brought out the challenges involved in micro array techniques of clustering the data. K-means and hierarchical are hard clustering methods where data is divided in to clusters and then analysed based on the output. It may not be accurate most of the times due to high complexity and issues in identifying the number of clusters beforehand. The authors have hence proposed a fuzzy C – means algorithm and their method will determine the number of clusters efficiently. The importance is given to membership and topicalities values. MATLAB was used by the authors to test their proposed framework and the lung data set was used for verification. The results were better than similar methods in the literature. The implementation was done in parallel to improve the efficiency in computing the results and is shown in Fig. 3.
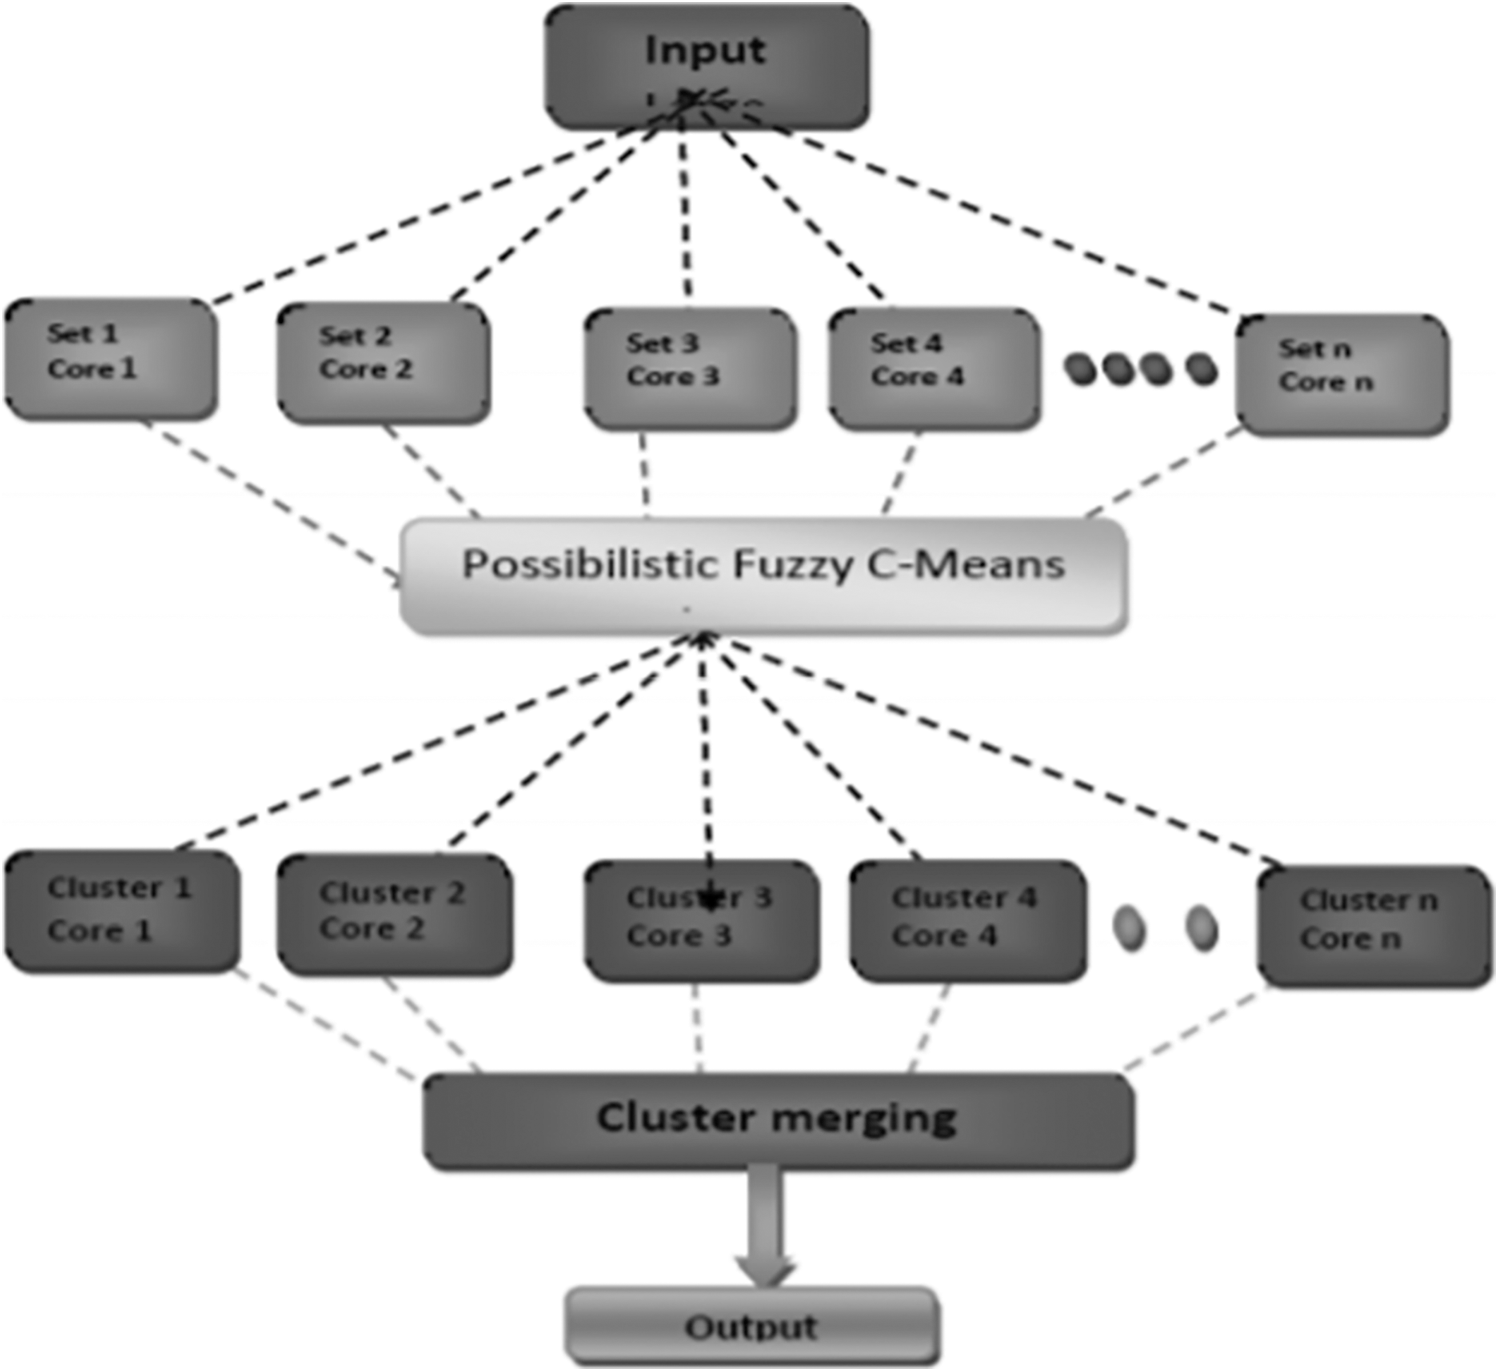
Figure 3: Parallel architecture proposed by thomas scaria
Identifying the number of clusters prior to clustering is a major challenge in most of the unsupervised learning methods. Valarmathie et al. [14] have proposed to use Expectation Maximization algorithm which has the framework for cluster structure modelling of the gene expression data.
Though many unsupervised clustering algorithms are discussed in the literature, many of them have the following challenges:
a. Once the clusters are identified, the biological interpretation and explanation of the identified clusters with the help of clustering algorithms is not so easy
b. Scaling issues associated with the state-of-the-art clustering algorithms when dealing with high dimensional data
c. For most unsupervised clustering algorithms, identifying the number of clusters beforehand is still a big challenge in front of the researchers to solve.
To overcome these issues, we have proposed an enhanced FLAME clustering approach which brings in the following advantages:
a. The proposed FLAME clustering approach has the ability to find non-linear relationships as opposed to other algorithms
b. Clusters are more internally homogeneous and externally diverse
c. They handle the outliers much better than most algorithms could do.
We discuss in detail about the proposed approach of using enhance FLAME clustering algorithm in the coming sections.
3 Fuzzy Methods for Data Clustering
Fuzzy clustering is different from traditional clustering methods from the fact that each sample can be classified in to more than one cluster. The membership is spread among multiple clusters. The value can be between 0 to 1 and this process is called as fuzzification which brings in the advantage that it does not force any sample into a specific cluster [15]. Cluster membership and distances form the objective function and the fuzzy algorithm will aim to minimize this objective function. The coefficients along with the silhouette values are used in the fuzzification process. Dunn’s partition coefficient is used in the measurement of the fuzzy solution to the corresponding hard solution. This coefficient is represented by:
Here the coefficient ranges from 1/K to 1 and the value will become 1/K when all the memberships are equal to 1/K. When one membership value is unity with the rest becoming zero, this value will be equal to 1. This is how the fuzziness is defined. It can also be represented in a normalized version as:
The analysis function will utilize this fuzziness principle for the purpose of grouping the population elements. Considering our case of gene expression data, where each clusters may be highly interconnected with each other or even embedded, the fuzzy analysis has the benefit that it does not force each object into a precise cluster where each object is ranged over various clusters and the degree of fitting of an object to various clusters is enumerated by means of membership coefficients, that ranges from 0 to 1.
Fuzzy C-Means (FCM) clustering is one of the most popular fuzzy clustering methods for microarray dataset [16]. It is a soft clustering method where each data point in the group is categorized by its membership function. This FCM preserves a membership matrix of the input sample set, which is rationalised on each algorithm iteration, assessing the connected weight of each data point to define its degree of membership. The value of each data point across all clusters is found to be unity. The major rewards of this FCM approach are its capability to cluster overlying sample points and that it constantly unites. However, this method also has the cluster rationality issue due to the a priori condition of c value needed for eminence clustering results and outliers or the noise data can be assigned similar relationship in each cluster, which marks it less appropriate for gene expression data.
To overcome these issues and to reduce the complexity in analysis of the algorithm in terms of time and space, we first use a dimensionality reduction technique followed by enhance FLMAE approach for gene expression data clustering.
Shannon EntropyBasedDimensionality Reduction
In case of exploratory data analysis, the main task is to search for a feature space in lower dimension which in turn helps to uncover the underlying pattern with the help of mapping function. Numerical data can fall under two categories:
a. Inter-valued data with real intervals
b. Fuzzy data with ill-define bounds or intervals
Fuzzy value set represents the observation of some accurate unknown quantity or a distribution of values from repetitive measurements. Dimensionality reduction helps to progress with prediction quality, decrease the overall computing time and also helps to construct more robust models. Feature extraction can be obtained either from the object-attribute data or from the dissimilarity data. While Principal Component Analysis (PCA) is the commonly used method for dimensionality reduction, it suffers from the fact that the independent variables are less interpretable as compared to the original values and information loss at times if the components are not chosen properly. To overcome these issues, we prefer to use Shannon entropy [17] based approach for gene expression data dimensionality reduction.
The expected information amount in an event distribution refers to the Shannon entropy. It provides the number of bits required on an average for encoding the symbols from a distribution p. This Shannon entropy brings in the following properties that help us in dimensionality reduction of the original data set.
a. This measure is both concave as well as non-negative in the given distribution set p1, p2, p3, …., pn.
b. The entropy value of a certain outcome probability distribution is 0 while uncertain outcome is normally positive.
c. Zero-probability outcome does not change the measure value
d. A uniform distribution maximum probability entropy is seen in case of a fixed number of outcomes
e. The entropy value depends on the unordered probabilities
f. The features are invariant to both shifting and scaling of the data set
g. The sum of the individual entropies is equal to the entropy of the joint distribution of the same
If Rd represents the raw dataset after normalization and other pre-processing steps, then this is also subject to dimensionality reduction using the information gain filter. This is represented in Fig. 4.
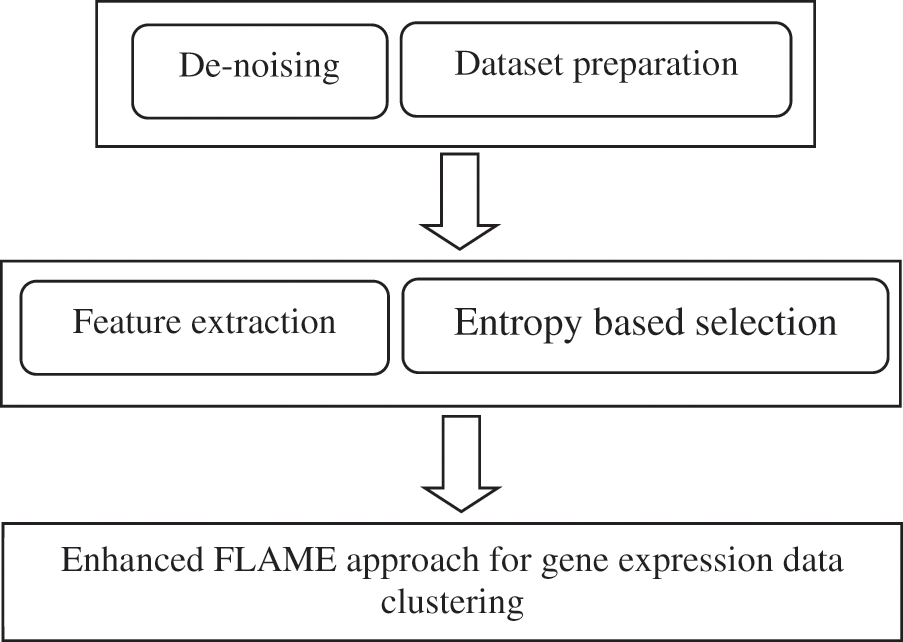
Figure 4: Framework of the proposed approach
Let the variables Ca and Da represent the set of conditional as well as the decision attributes respectively as produced by RD. The following steps are carried out in entropy based feature selection and dimensionality reduction.
Step 1: Assuming B = θ, where B corresponds to the designated attributes from the raw sample set taken for clustering.
Step 2: The implication of the state attribute ‘x’, Gain (x, B, Da) is calculated for each attribute.
Step 3: The feature that maximizes the improvement value Gain (x, B, Da) is represented now as ‘x’.
Step 4: If the computed Gain (x, B, Da) > 0, then goto Step 2 again and calculate, else goto next Step 5 for selection.
Step 5: The new set B is now the selected attributes that have entropy value > 0 [18].
Output: The dimensionality reduced feature subset that is found based on the ranking of the above described features. All the extracted features found with an entropy value of zero are removed or not considered for further processing. This dimensionality reduction of the original gene expression dataset brings in the following advantages:
a. Time and storage space reduction which is one of the main challenge with the high volume of data taken for processing and analysis.
b. Data visualization becomes easier with the reduced dataset as compared to the original dataset thereby making the further clustering algorithm work to be simpler and effective.
c. Interpretation of the machine learning model parameter is improved.
4 Enhanced FLAME Approach for Gene Expression Data Clustering
FLAME clustering refers to the fuzzy approach with the help of local approximation of membership. Since the microarray sets have diverse structure information present in them, the existing clustering methods including the fuzzy C – means algorithms fails to converge for certain datasets. The enhanced FLAME approach brings in the following advantages:
a. Description of the neighbourhood of each gene or object sample and object identification with typical features named Cluster Associate Objects (CAO), around which the clusters are constructed;
b. Transfer fuzzy membership to each object vector approximated from the neigh boring objects memberships, with the support of an iterative converging process
c. In this process, membership spreads from the Cluster Associate Objects through their neighbours.
d. Comparative analysis with traditional algorithms like K-means, fuzzy C-means, hierarchical and fuzzy self-organizing maps (SOM) exposed that data partitions generated by this FLAME approach are not superimposable to those of other literature methods.
e. Though various types of datasets are better separated by different algorithms, the proposed FLAME approach displays the best overall performance when compared to the other similar systems.
A typical FLAME clustering algorithm approach is shown in Fig. 5. Though FLAME approach brings in the best advantages for data clustering, they suffer from insensitivity to parameter tuning and random selection of parameters from the grid produces even worse results. To overcome these issues, we propose an enhanced FLAME soft clustering algorithm for effective clustering of gene expression data.
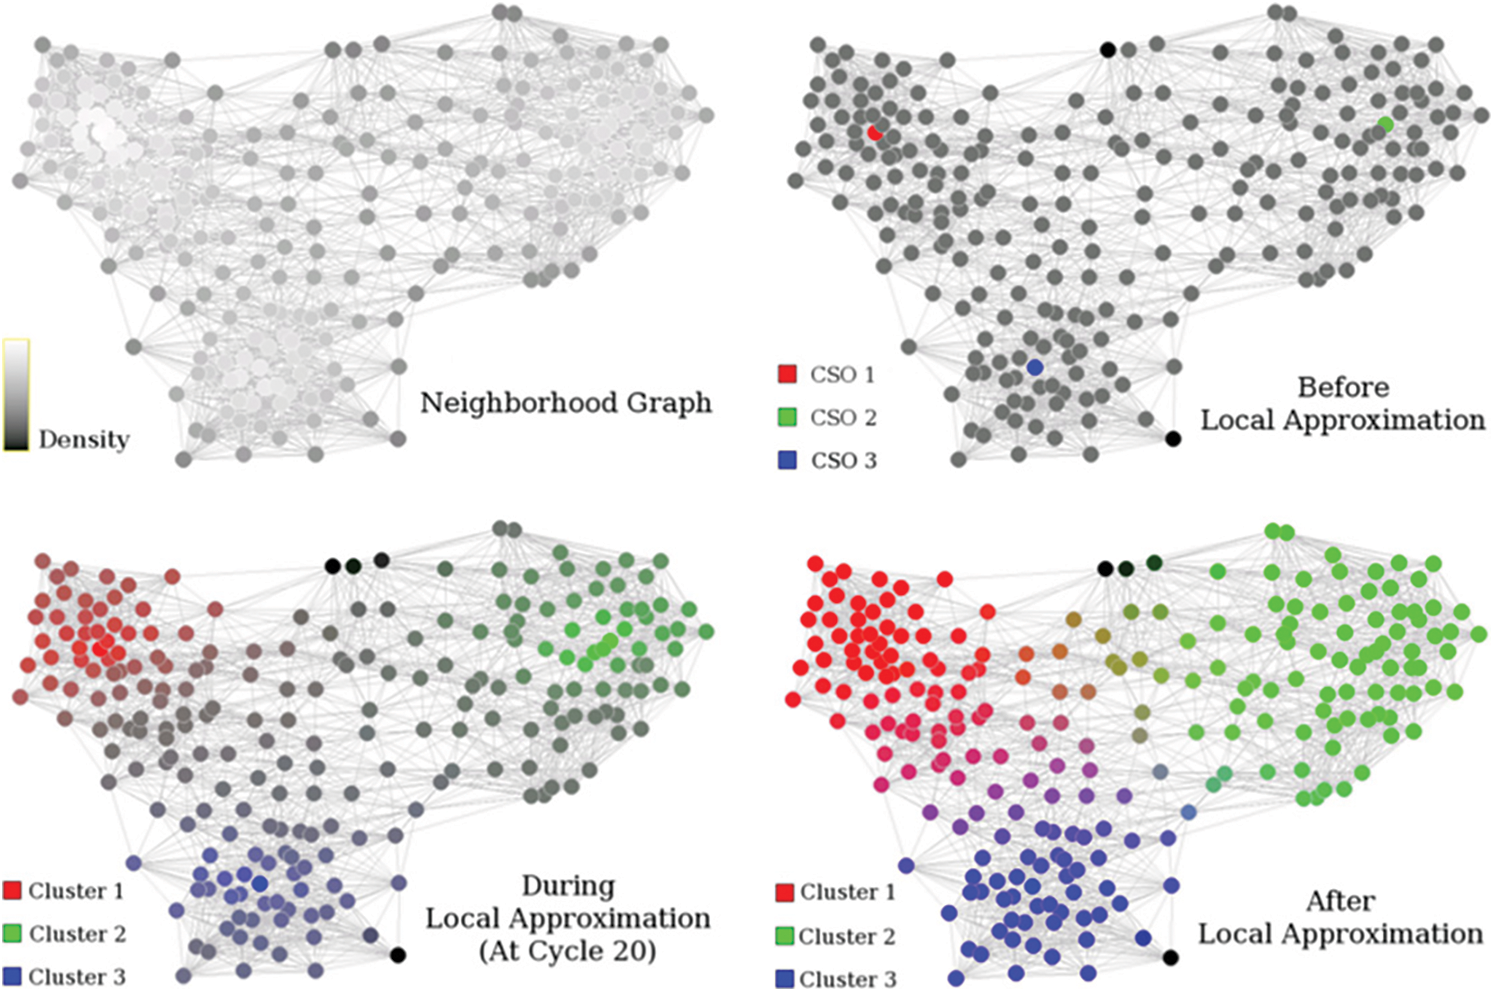
Figure 5: FLAME clustering methodology [19]
Enhanced FLAME Clustering Algorithm
There are three major steps involved in the FLAME algorithm. First, the local structure needs to be extracted and cluster supporting objects needs to be identified. The object density is calculated with the help of distance measurement technique, i.e., distance between different object and their k-nearest neighbours. The highest density objects are now the cluster supporting objects and will remain as the clusters prototype. The noisy data is also eliminated in this step with the help of the same density function itself.
The local approximation step is then followed for the assignment of the fuzzy membership. The cluster supporting objects helps in deciding the number of clusters. The algorithm starts with equal membership to all the existing clusters and then gets updated or adjusted during every iteration. The proximity measures helps in deciding the weight factors. We use Shannon entropy based similarity measure in our proposed approach as opposed to the traditional proximity measures in FLAME algorithm. This brings in the required enhancement and results improvement.
The construction of the clusters from the last step with the help of membership degree value and through thresholds. Both one to one and one to many object cluster relationships are taken care with this approach. Also, a single membership approach can be used for validation purposes.
• Proposed algorithm for enhanced FLAME clustering method:
• Find the K nearest neighbours and proximity calculation is carried out
• Object density is now found
• Object type is defined
○ Cluster supporting object
○ Outlier or noisy data
• Other samples’
• Initial membership assignment
• Local approximation technique
• Updation of density values based on subject knowledge
• Cluster construction through fuzzy memberships
• Assignment of new genes to the existing clusters
• This framework is represented in Fig. 6.
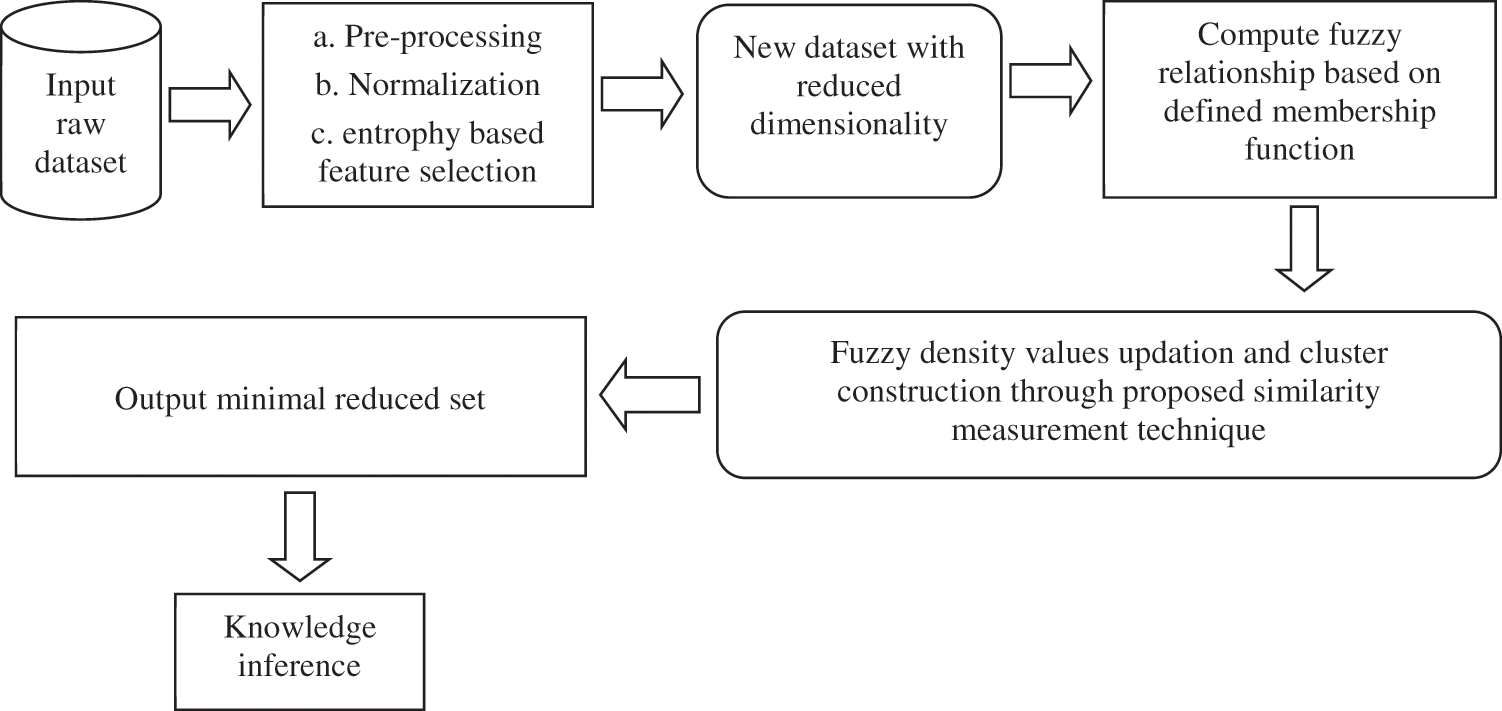
Figure 6: Enhanced FLAME clustering approach for gene expression data
The most reliable clustering validity be contingent on how well it fundamentally carries out the task at hand. The index normalization used in the algorithm allows smoothing the highest values effect on the average index values calculation. This in turn helps to improve the prediction process as well. Various distance metric techniques are also used to find the neighbours and they are discussed in detail in the coming section.
5 Distance Metrics for Cluster Validity
Distance metrics corresponds to a function that helps to find the distance between the data elements and represents it through a non-negative real number [20]. When the distance value is zero, it indicates that both the data elements are same under that specific metric function. While there are many distance metrics available in the literature, we limit ourselves to three popular ones especially suited for the gene expression data clustering.
a. Minkowski distance
b. Cosine distance
c. Mahalanobis distance
A vector space in which the norm is defined is called as the normed vector space. Minkowski distance is one such metric in normed vector space. It satisfies the following conditions:
a. Zero vector will always have the length to be zero
b. Length can be changed with the help of multiplication factor but the vector direction does not change due to this manipulation
c. In a normed vector space, the distance calculated between two points is always a straight line
6 Experimentation Results and Discussions
To measure the performance of the proposed algorithms, we used the following four different datasets that are publicly available for research purposes. We have also used MATLAB programming language along with their libraries for implementing the proposed algorithms in this work.
a. Yeast cell cycle (YCC)
b. Reduced peripheral blood monocytes
c. Mouse tissues
d. Lungs and Ovarian cancer gene expression data
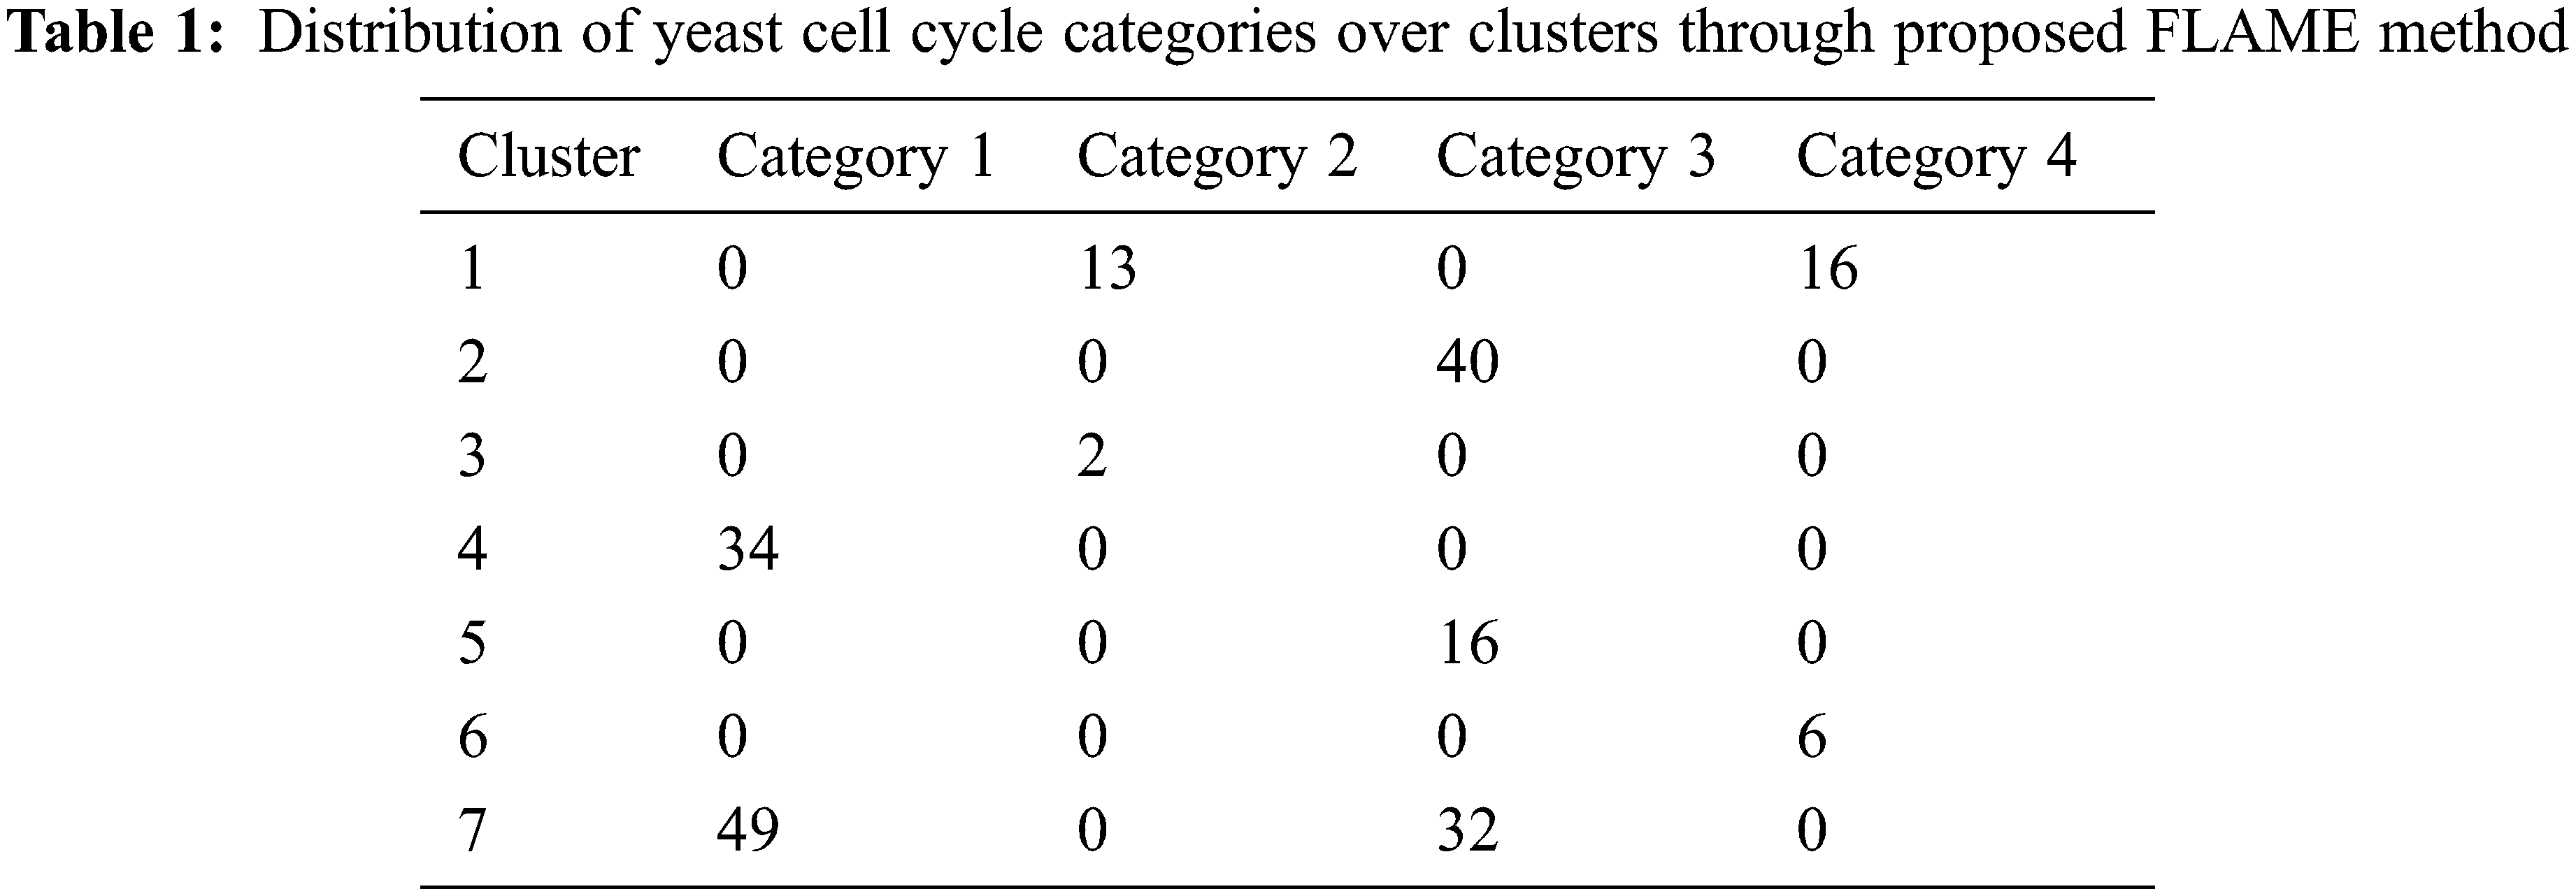
The yeast cell cycle data with the expression levels for three different oscillatory genes are shown in Fig. 7 [21]. This depicts the co-expression pattern of three cell-cycle related genes. By analysing the microarray data obtained from this yeast cultures, we can form independent clusters. In our case, we have sampled the data at 6 min interval for a total of 120 min thereby taking 720 genes for clustering. There are four replicate hybridizations for each microarray to be considered. These four categories are distributed over seven clusters as shown in Tab. 1 below.
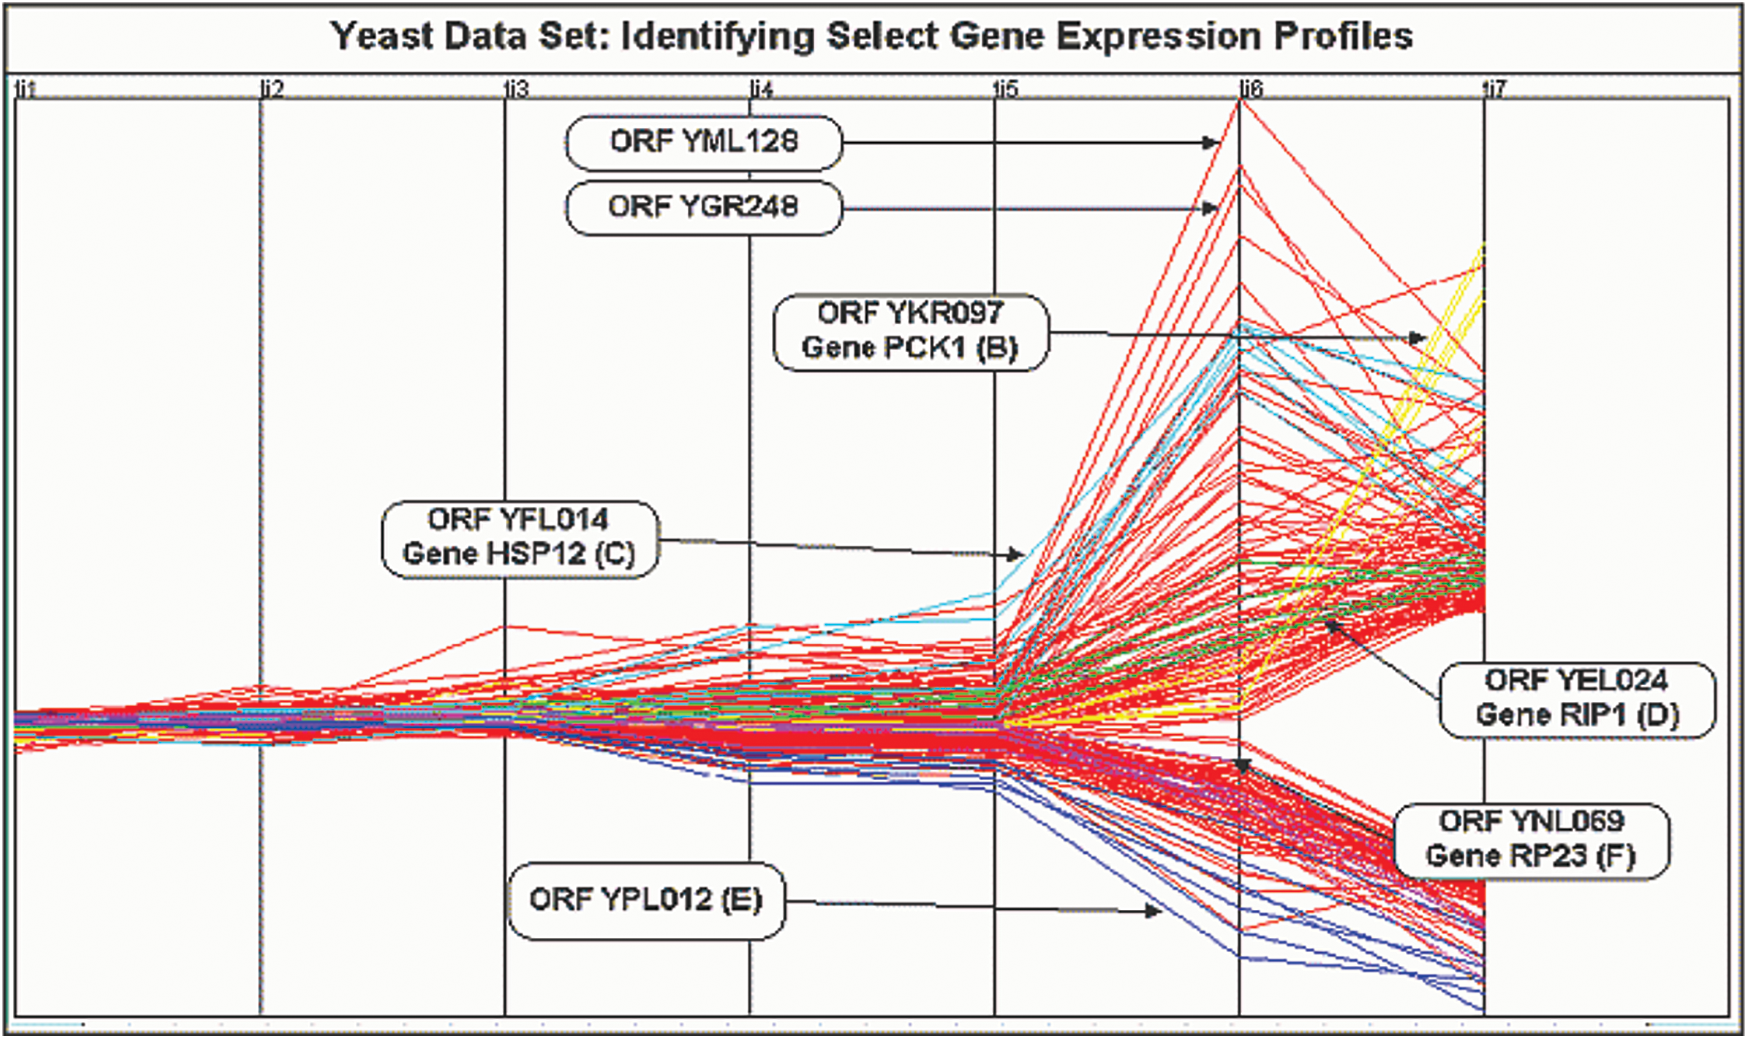
Figure 7: Yeast cell cycle gene expression data visualization
There is a need for the clustering procedure to work on both the correlated as well as the replicated data. The proposed model will allow for the correlations among the given or selected gene profiles by the support of genes within the same cluster to be correlated.
From Tab. 1, it can be inferred that the clusters 1 and 2 mainly contains gene categories of 1 and 2 while those in 4 and 5 corresponds to categories 1 and 3.
One of the biologic condition called as monocytes decreasing which is caused due to bone marrow production decrease needs the clustering support for early detection and analysis. So, we have used the reduced peripheral blood monocytes dataset for testing our FLAME fuzzy algorithm on this condition. Fig. 8 shows the plot where each color represents the actual tissues on the left side while color represents the clusters through the proposed method on the right side:
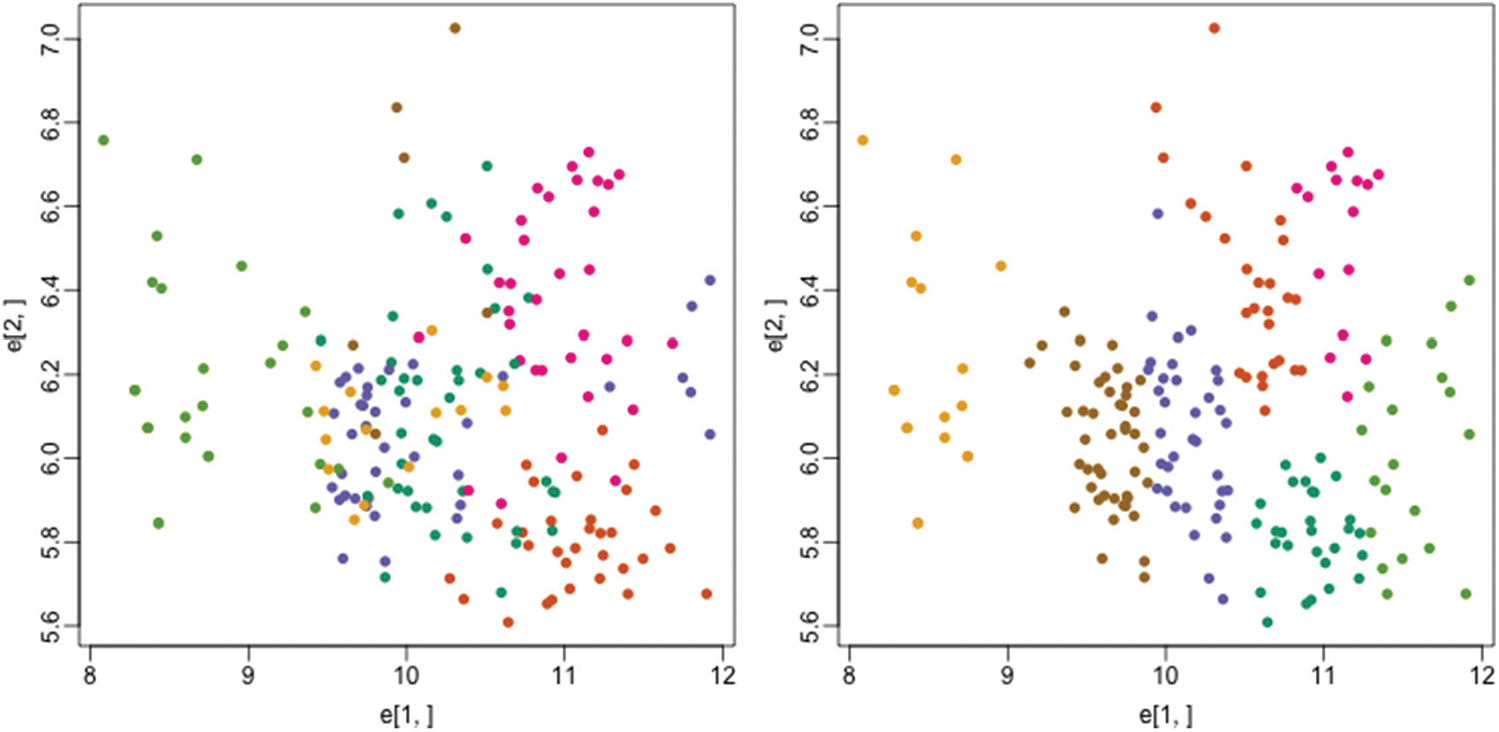
Figure 8: Actual tissues (left) vs. clusters identified by proposed method (right)
To measure the similarity value, we use the below representations and find the precision and sensitivity parameters as well:
Similarity measure = Area expert Ո Area method/max (Area expert, Area method)
Precision = TP/TP + FP
Sensitivity = TP/TP + FN
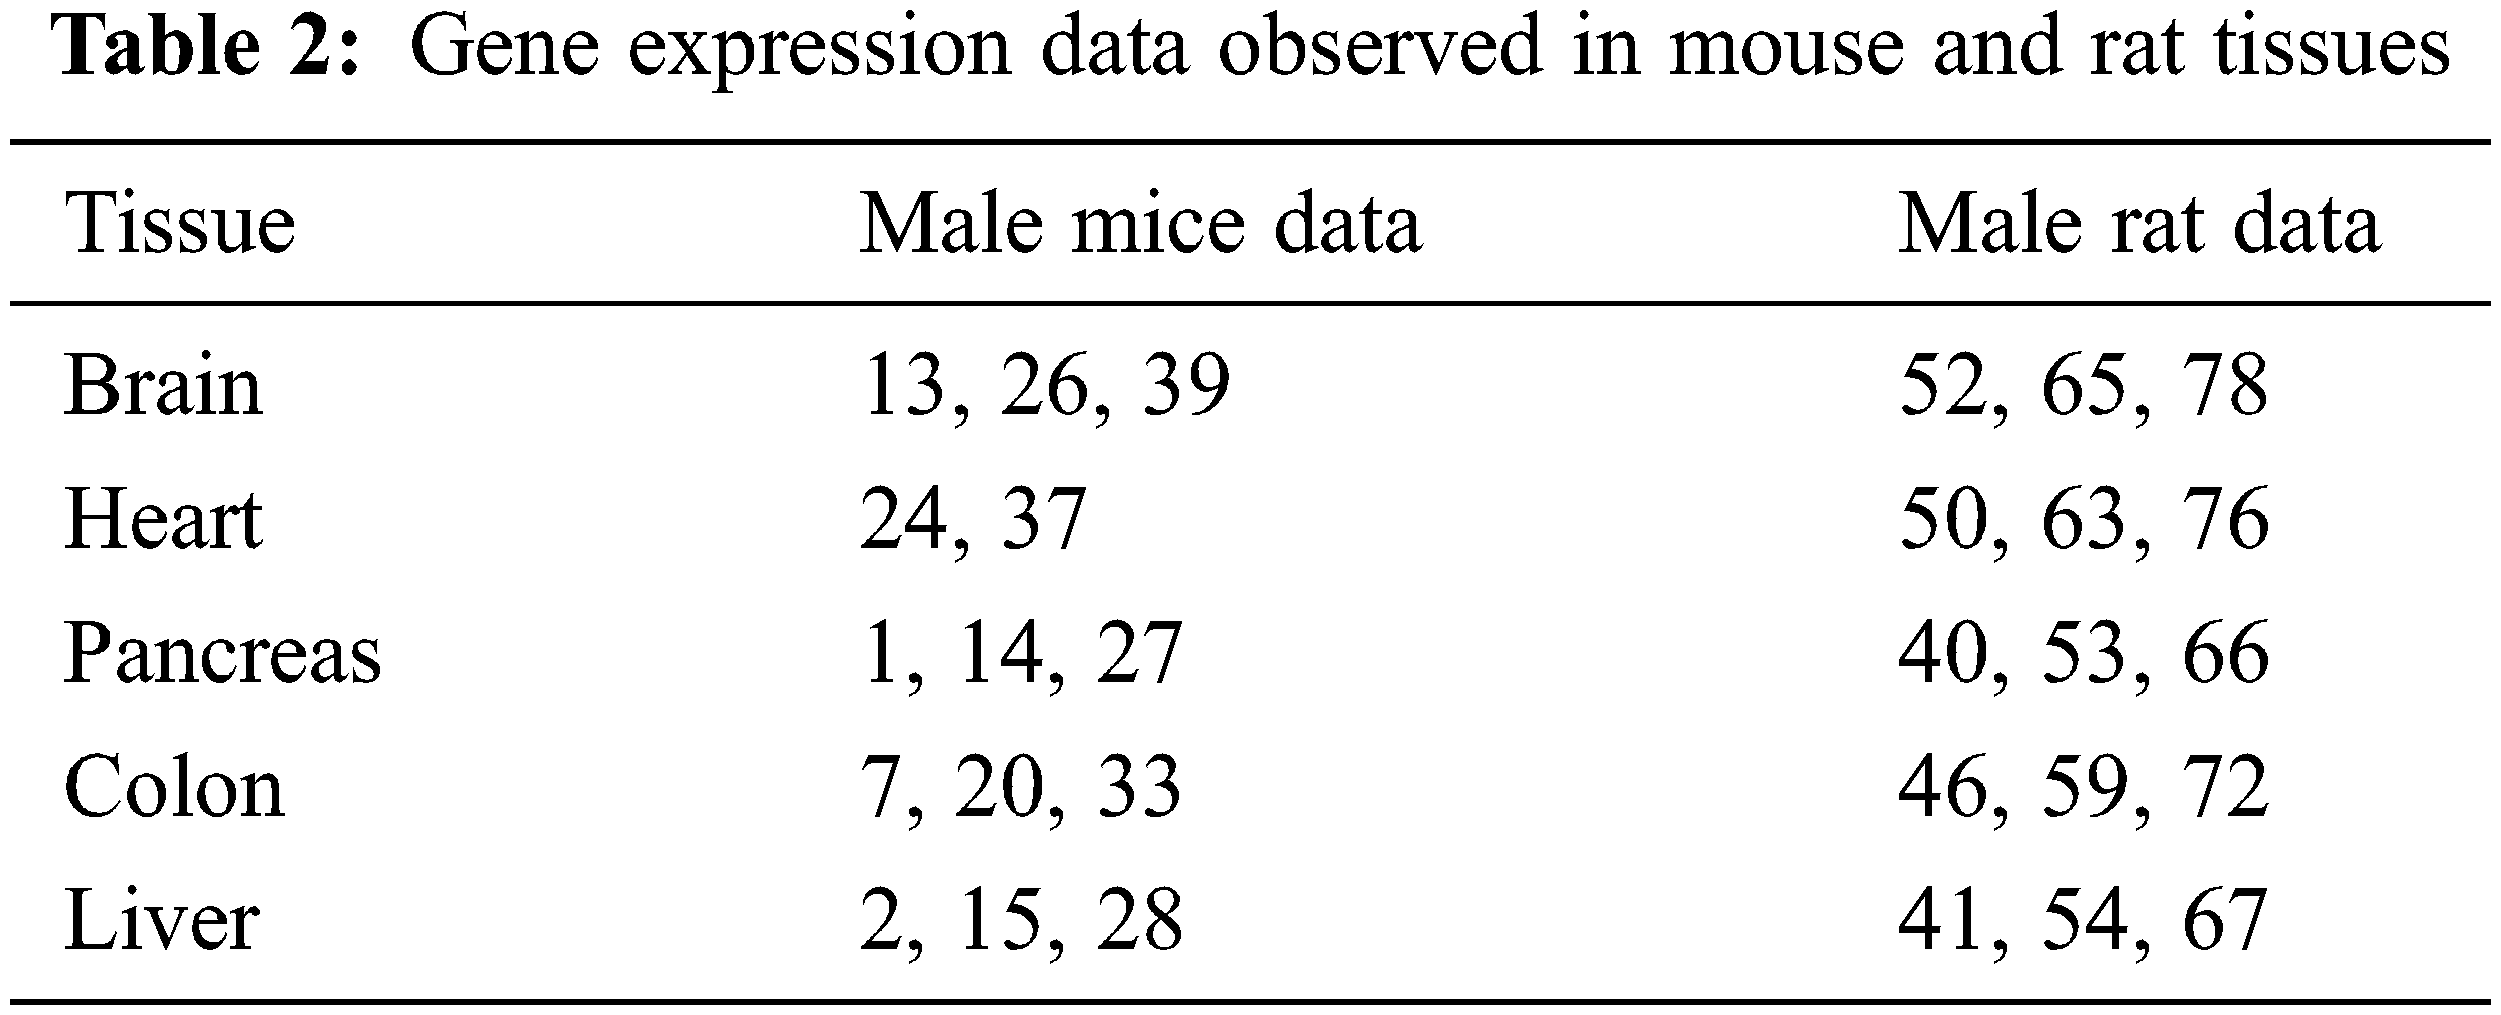
There are no homogeneous RNA-seq sample set that can best represent the tissues of both the mouse and the rat. In our study, we have used only the mouse tissues as our third dataset to validate the clustering algorithm efficiency. An RNA-seq of gene expression tissues is represented in Tab. 2 below:
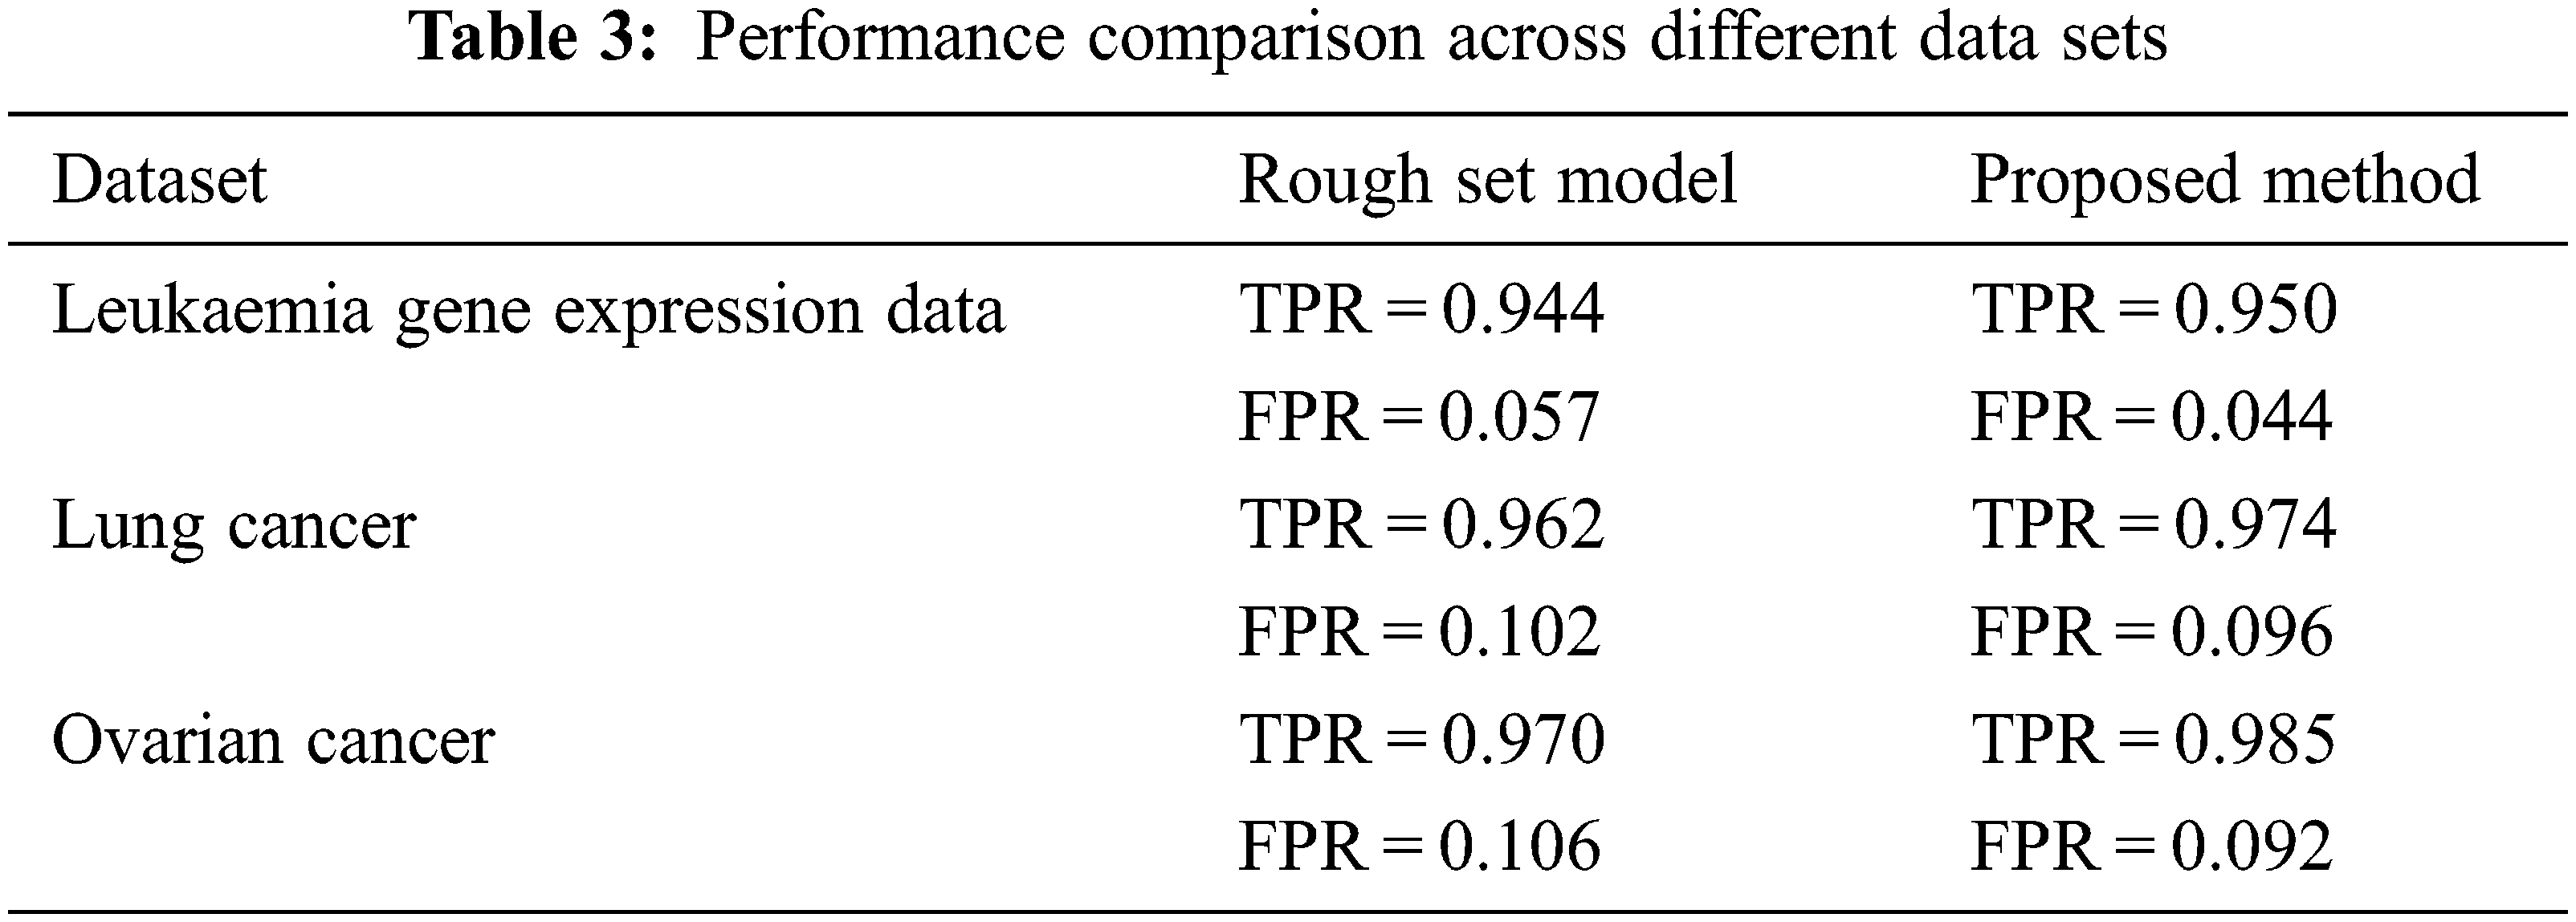
Tab. 3 shows the clustering performance comparison across different datasets. A receiver operating characteristic curve (ROC) as shown in Fig. 9 is created by plotting these values and indicating the true positive rate (TPR) against the false positive rate (FPR). Here TPR represents the sensitivity and recall while FPR corresponds to false alarm probability.
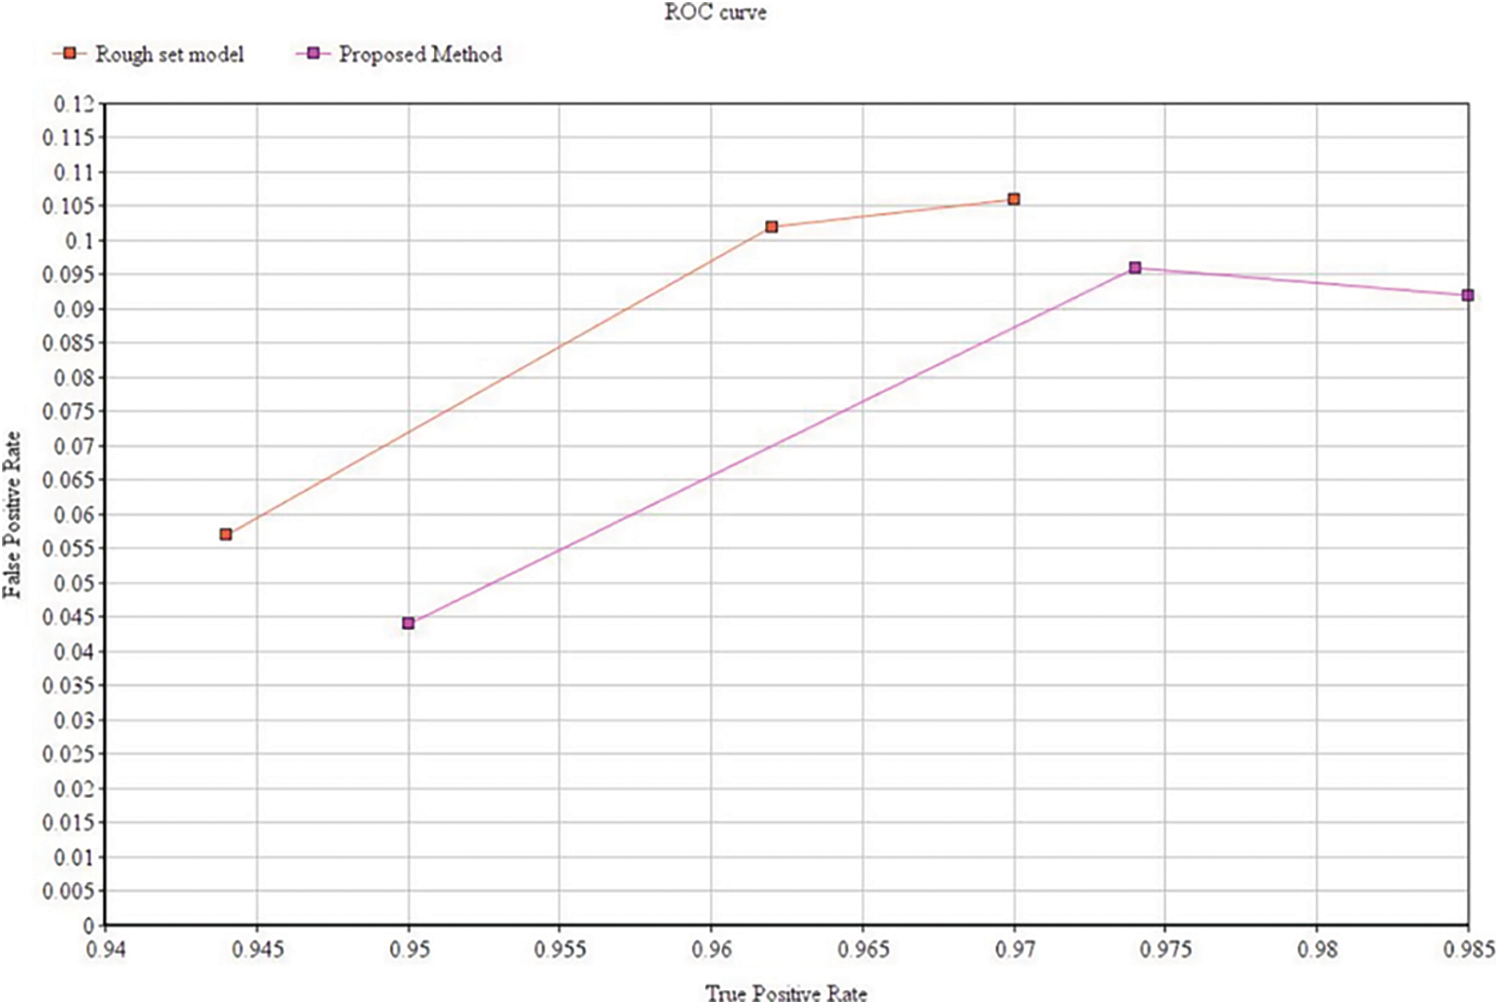
Figure 9: ROC curve for performance comparison
Acute myeloid leukaemia (AML) is the most popular and common acute leukaemia identified in adults. Due to its heterogeneity, this AML is separated into different classes related with different handling outcomes and precise gene expression data profiles. We analysed the sensitivity of this data with respect to the base projective clustering and the softness controlling assignments. The leukaemia data set is available in the website: http://datam.i2r.a-star.edu.sg/datasets/krbd/ for research and analysis. We have picked the 36 bone marrow samples from AML patients at the diagnosis time. RNA organized from bone marrow mononuclear cells was crossbred to high-density oligonucleotide data of microarrays which are then clustered through the enhanced FLAME approach.
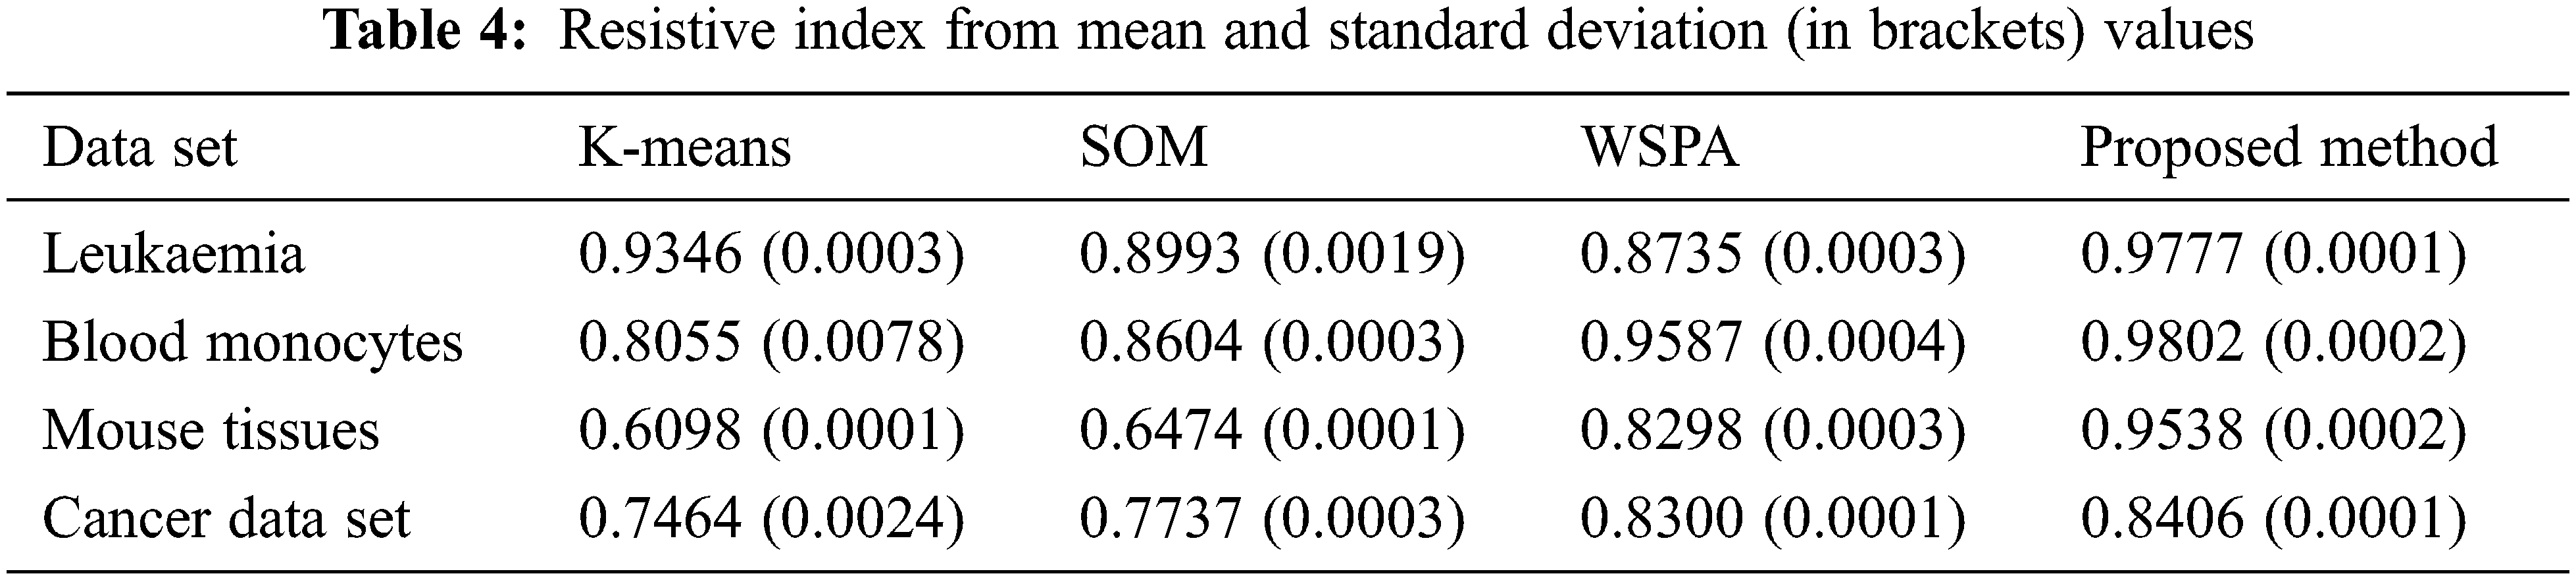
The resistive index (RI) is a dimensionless parameter that helps to understand the resistance of the proposed method with the help of mean and standard deviation values across different sets for each cluster identified.
RI values in Tab. 4 explains that the proposed method is efficient. Both the mean and standard deviation values are found to be better as compared to K-means, self-organizing maps and weighted ensemble clustering methods.
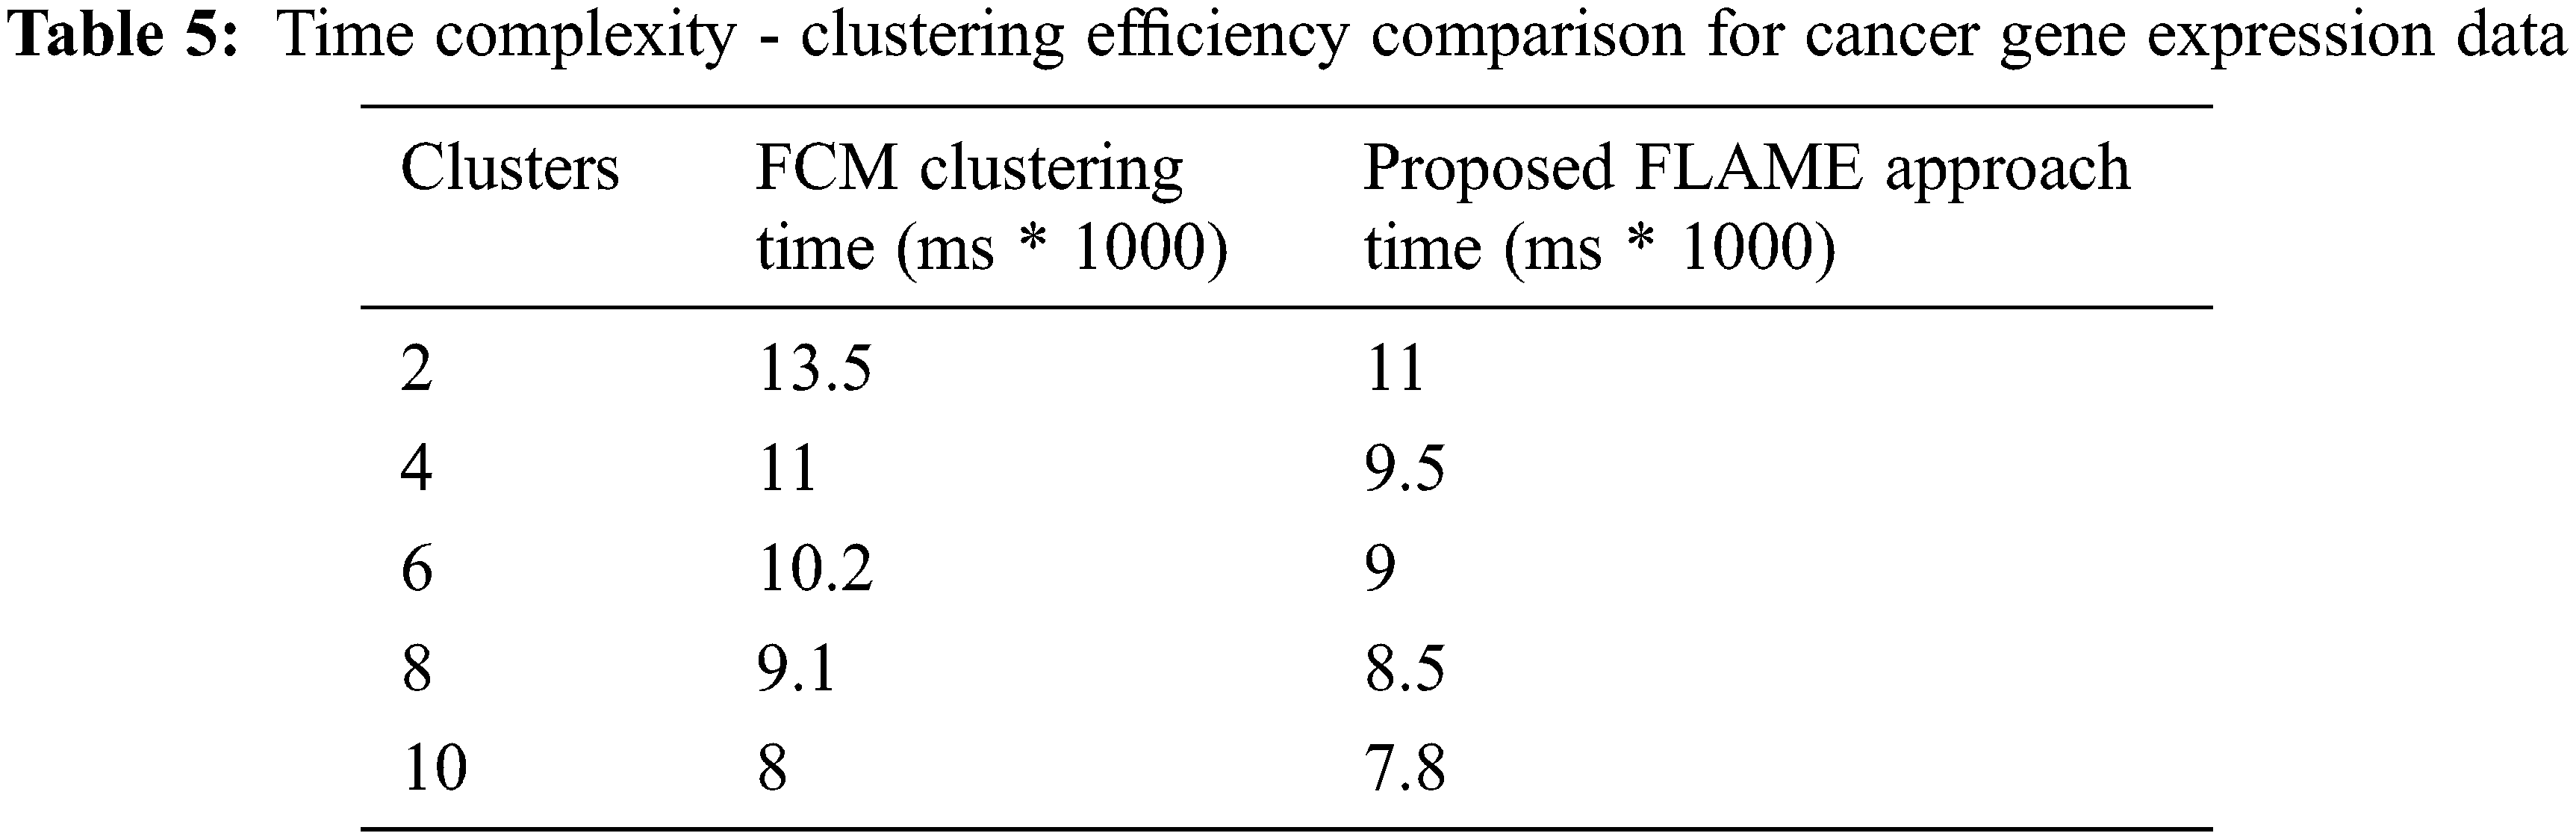
We used MATLAB machine learning toolbox which brings in together many existing clustering algorithms along with the tools under a common framework for building the new enhancements. Fig. 10 above shows the clustering efficiency across different data sets. The accuracy differs based on the tuning parameters and dimensionality of the dataset. Tab. 5 shows the execution time which was also found to be lesser as compared to the FCM algorithm across different datasets. From the results, it can be easily inferred that the proposed enhanced FLAME method performs better in terms of both clustering accuracy as well as with reduced time complexity.
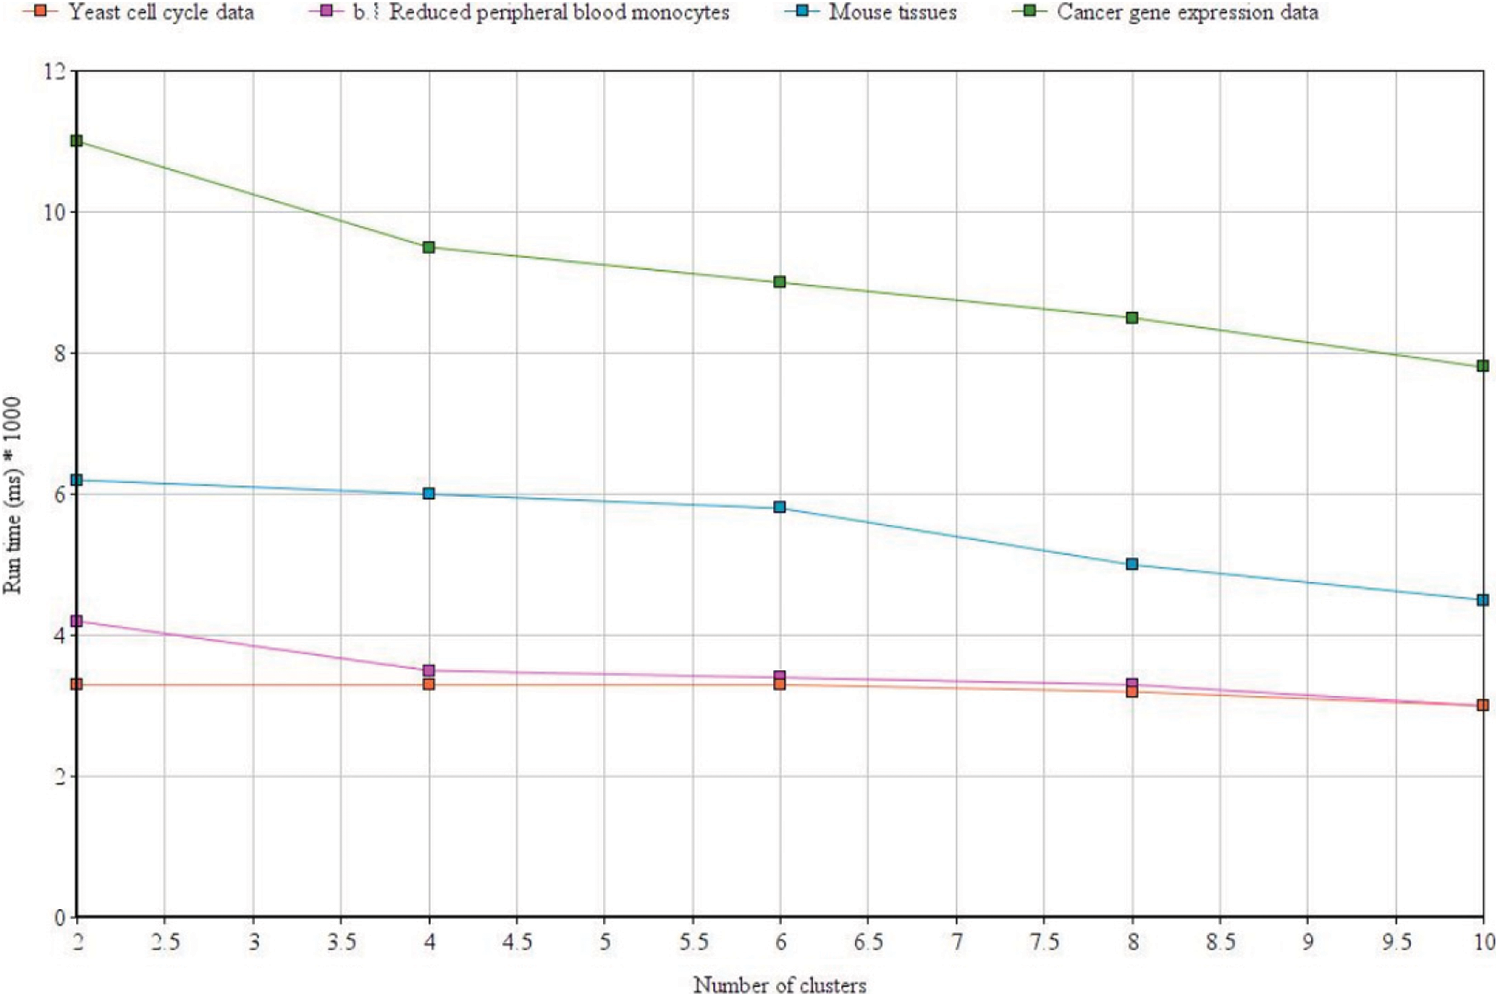
Figure 10: Clustering efficiency with the proposed method across different datasets
This paper presents a novel soft clustering technique for analyzing the gene expression data. This method utilises a fuzzy approach but at the same time overcomes the limitations of the fuzzy C-means algorithm with the help of fuzzy membership assignment based on relationship and through local approximation based membership assignment. The neighboring genes will decide the membership assignments in this case. The FLAME technique itself has intrinsic advantages, such as the capability to seizure non-linear relations and non-globular clusters, the computerized description of the number of clusters, and the finding of cluster outliers or noise, i.e., genes that are not consigned to any formed clusters. This method along with the Shannon entropy based dimensionality reduced data set helps to reduce the overall time and space complexity and as a result, the clusters are more homogeneous within while more diverse externally, and provide better splitting of the biological functions. The clustering algorithm can be easily stretched to other applications as well which are different from gene expression analysis. The methods employed in this work will also contribute to the assessment of clustering results and the likelihood of optimal cluster divisions. The results achieved suggest that such a validity method may signify an operational tool to support biomedical information discovery in gene expression data.
Funding Statement: The authors received no specific funding for this study.
Conflicts of Interest: The authors declare that there is no conflict of interest regarding the publication of the paper.
1. A. BenDor, L. Bruhn, N. Friedman, I. Nachman, M. Schummer et al., “Tissue classification with gene expression profiles,” in Proc. RECOMBE, Tokyo, Japan, pp. 65–75, 2000. [Google Scholar]
2. A. Brazma and J. Vilo, “Gene expression data analysis,” FEBS Letters, vol. 480, no. 1, pp. 17–24, 2000. [Google Scholar]
3. M. De Cáceres, X. Font and F. Oliva, “The management of vegetation classifications with fuzzy clustering,” Journal of Vegetation Science, vol. 21, no. 6, pp. 1138–1151, 2010. [Google Scholar]
4. S. A. Mingoti and J. O. Lima, “Comparing SOM neural network with fuzzy c-means, k-means and traditional hierarchical clustering algorithms,” European Journal of Operational Research, vol. 174, no. 3, pp. 1742–1759, 2006. [Google Scholar]
5. S. Maheswaran, S. Sathesh, M. Gayathri, E. D. Bhaarathei and D. Kavin, “Design and development of chemical free green embedded weeder for row based crops,” Journal of Green Engineering, vol. 10, no. 5, pp. 2103–2120, 2020. [Google Scholar]
6. F. Rapaport, R. Khanin, Y. Liang, M. Pirun, A. Krek et al., “Comprehensive evaluation of differential gene expression analysis methods for RNA-seq data,” Genome Biology, vol. 14, no. 9, pp. 1–13, 2013. [Google Scholar]
7. B. AbuJamous and S. Kelly, “Clust: Automatic extraction of optimal co-expressed gene clusters from gene expression data,” Genome Biology, vol. 19, no. 1, pp. 1–11, 2018. [Google Scholar]
8. X. Yu, G. Yu and J. Wang, “Clustering cancer gene expression data by projective clustering ensemble,” PloS One, vol. 12, no. 2, pp. e0171429, 2017. [Google Scholar]
9. D. Jiang, C. Tang and A. Zhang, “Cluster analysis for gene expression data: A survey,” IEEE Transactions on Knowledge and Data Engineering, vol. 16, no. 11, pp. 1370–1386, 2004. [Google Scholar]
10. B. Karmakar, S. Das, S. Bhattacharya, R. Sarkar and I. Mukhopadhyay, “Tight clustering for large datasets with an application to gene expression data,” Scientific Reports, vol. 9, no. 1, pp. 1–12, 2019. [Google Scholar]
11. I. A. Maraziotis, “A semi-supervised fuzzy clustering algorithm applied to gene expression data,” Pattern Recognition, vol. 45, no. 1, pp. 637–648, 2012. [Google Scholar]
12. H. S. Park, S. H. Yoo and S. B. Cho, “Evolutionary fuzzy clustering algorithm with knowledge-based evaluation and applications for gene expression profiling,” Journal of Computational and Theoretical Nanoscience, vol. 2, no. 4, pp. 524–533, 2005. [Google Scholar]
13. T. Scaria, G. Stephen and J. Mathew, “Gene expression data analysis using fuzzy c-means clustering technique,” International Journal of Computer Applications, vol. 135, no. 8, pp. 33–36, 2016. [Google Scholar]
14. P. Valarmathie, M. Srinath, T. Ravichandran and K. Dinakaran, “Hybrid fuzzy c-means clustering technique for gene expression data,” International Journal of Research and Reviews in Applied Sciences, vol. 1, no. 1, pp. 33–37, 2009. [Google Scholar]
15. S. Sathesh, S. Maheswaran and P. Scholar, “Agricultural harvest with incarcerate image using single board computer,” International Journal of Advanced Research Trends in Engineering and Technology, vol. 2, pp. 11–15, 2015. [Google Scholar]
16. J. Hämäläinen, S. Jauhiainen and T. Kärkkäinen, “Comparison of internal clustering validation indices for prototype-based clustering,” Algorithms, vol. 10, no. 3, pp. 105, 2017. [Google Scholar]
17. A. Shadvar, “Dimension reduction by mutual information feature extraction,” International Journal of Computer Sceince and Information Technology, vol. 4, 2012. [Google Scholar]
18. J. Dai and Q. Xu, “Attribute selection based on information gain ratio in fuzzy rough set theory with application to tumor classification,” Applied Soft Computing, vol. 13, no. 1, pp. 211–221, 2013. [Google Scholar]
19. L. Fu and E. Medico, “FLAME a novel fuzzy clustering method for the analysis of DNA microarray data,” BMC Bioinformatics, vol. 8, no. 1, pp. 1–15, 2007. [Google Scholar]
20. P. A. Jaskowiak, R. J. Campello and I. G. Costa, “On the selection of appropriate distances for gene expression data clustering,” BMC Bioinformatics, vol. 15, no. 2, pp. 1–17, 2014. [Google Scholar]
21. R. Braun, G. Leibon, S. Pauls and D. Rockmore, “Partition decoupling for multi-gene analysis of gene expression profiling data,” BMC Bioinformatics, vol. 12, no. 1, pp. 1–19, 2011. [Google Scholar]
 | This work is licensed under a Creative Commons Attribution 4.0 International License, which permits unrestricted use, distribution, and reproduction in any medium, provided the original work is properly cited. |