DOI:10.32604/csse.2022.024265
| Computer Systems Science & Engineering DOI:10.32604/csse.2022.024265 | |
| Article |
Object Detection in Remote Sensing Images Using Picture Fuzzy Clustering and MapReduce
Faculty of Computer Science and Engineering, Thuyloi University, 175 Tay Son, Dong Da, Hanoi, 010000, Vietnam
*Corresponding Author: Tran Manh Tuan. Email: tmtuan@tlu.edu.vn
Received: 11 October 2021; Accepted: 07 December 2021
Abstract: In image processing, one of the most important steps is image segmentation. The objects in remote sensing images often have to be detected in order to perform next steps in image processing. Remote sensing images usually have large size and various spatial resolutions. Thus, detecting objects in remote sensing images is very complicated. In this paper, we develop a model to detect objects in remote sensing images based on the combination of picture fuzzy clustering and MapReduce method (denoted as MPFC). Firstly, picture fuzzy clustering is applied to segment the input images. Then, MapReduce is used to reduce the runtime with the guarantee of quality. To convert data for MapReduce processing, two new procedures are introduced, including Map_PFC and Reduce_PFC. The formal representation and details of two these procedures are presented in this paper. The experiments on satellite image and remote sensing image datasets are given to evaluate proposed model. Validity indices and time consuming are used to compare proposed model to picture fuzzy clustering model. The values of validity indices show that picture fuzzy clustering integrated to MapReduce gets better quality of segmentation than using picture fuzzy clustering only. Moreover, on two selected image datasets, the run time of MPFC model is much less than that of picture fuzzy clustering.
Keywords: Remote sensing images; picture fuzzy clustering; image segmentation; object detection; MapReduce
Object detection is an important step in image processing. Object detection systems are often integrated to another image processing models as the first step of the progress. Object detection in images has attracted the attentions of many researchers [1–3]. There are different ways to detect objects from images such as using sparse label assignment [4], using convolutional neural network [5,6], multi-level fusion [7], context-based priors [8], implicit 3D orientation learning [9]. Besides, in these researches, the types of images are also different including RGB-D images, aerial images, large images, monocular images, etc.
Object detection in remote sensing images was performed mainly by artificial intelligent methods such as random forest [10], deep hashing neural networks [11], convolutional neural network (CNN) [12]. Currently, CNN network is gradually becoming popular in deep learning and has demonstrated its power in identifying objects from remote sensing images with much higher accuracy than other methods applied from remote sensing [3,13–15]. Apart from CNN, fuzzy clustering algorithms are also used to detect objects in images. Recently, [16] introduced the application of fuzzy clustering in satellite image retrieval. In this research, fuzzy C-means (FCM) was applied as a step of image processing. The use of FCM aimed to map the changes in land use and land cover with productive results. In another research, [17], fuzzy multi-characteristic clustering was proposed in order to enhance precision and recall values in content based image retrieval. Fuzzy clustering techniques are also used in object detection from images [18–20].
In 2014, [21] introduced picture fuzzy sets with four components, including positive, the neutral, the negative and the refusal degree. These components always appear whenever someone has to make a decision in the daily life. Based on the introduction, picture fuzzy set based algorithms are proposed [22,23] and applied in different applications such as segmentation [24,25], weather forecast [26], finance [27], autonomous driving [28], image processing [29], etc. In many applications, there are always the neutralizations which are not involved in fuzzy clustering algorithms. For example, there are quite similar regions in an image and it is hard to decide which segment those regions belong to. Then, neutralizations affect to the segmentation quality. Because remote sensing image datasets are always large, it is difficult to process and analyze these images.
By the development of cloud computing, data mining, Hadoop and MapReduce [30], the analysis results on big data are very important. Traditional techniques are applied only on structured data bases while big data includes raw data in general. Thus, processing big data effectively is one of the challenges in data processing. The new techniques for doing this are necessary as well.
This paper introduces a model used in remote sensing image segmentation by applying picture fuzzy clustering algorithm (PFC) to increase the accuracy of segmentation results. Moreover, MapReduce procedure is applied in Picture fuzzy clustering in order to reduce the time consuming of PFC in remote sensing image segmentation without decreasing segment quality. MapReduce Picture Fuzzy Clustering (MPFC) model is proposed. Lastly, the evaluations of PFC and MPFC models on two different sets of remote sensing images are also presented.
2.1 Picture Fuzzy Clustering (PFC)
Picture fuzzy clustering algorithm [23] was based on intuitionistic fuzzy clustering and applied on picture fuzzy sets. The idea of PFC is to design the objective function with two parts, including the sum of distances from all samples to their centers and entropy. The first element in objective function is an improvement of the objective function of FCM. As same as FCM, a sample belonging to a cluster means that the distance from that sample to cluster center is small. Thus, membership degree of sample to that cluster is high. PFC algorithms replace membership degree μ in FCM by (μ(2-ξ)) with refusal degree ξ. It is clear that a sample is closer to center, the higher membership degree is and the lower refusal degree is as well. In this research, the value (2-ξ) is chosen to guarantee that when (μ(2-ξ)) ≤ 1, then μ ≤ 1 satisfies. This is the condition of PFS. The second element of objective function is Entropy η(logη+ξ). Thus, objective function of PFC is defined by:
By minimizing this function, the values of
The constraints of this problem are
Using Lagarange multiplier method, based on the objective function (1) and the contraints (2)–(4), the formulas of V,
The main steps of PFC are presented in PFC algorithm as in Tab. 1 below.

Introduced by Google, MapReduce is a model used in parallel and distributional processing. This model consists of two procedures, including “Map” procedure and “Reduce” procedure. These two procedures are defined by user as in Fig. 1 [31].

Figure 1: The flowchart of MapReduce
The detail of formal representation of MapReduce (Fig. 1) is given as follows.
MapReduce formal representation:
As in [32], the formal representation of MapReduce model is presented as below:
where:
• P1, C1 are the types of key and input value of map function. p1, c1 is corresponding objects of types P1, C1
• P2, V2 are the type key and input value of map function. They are aslo the type key and input value of map reduce function. p2, c2 is corresponding objects of types P2, C2
• P3, C3 are the type key and input value reduce function. p3, c3 is corresponding objects of types P3, C3
We have:
• If p1, c1, p2, c2 are defined, we get the input, output of map function. Ussually, for text data, p1 is the offset key of data flow and c1 is the content of data flow.
• If p2, c2, p3, c3 are defined, we get the input, output of reduce function.
The formal representation can be rewritten with only p1, c1, p2, c2, p3, c3 as below:
Fig. 2 shows the diagram of job execution MapReduce and convert data type from (P1, C1) to (P2, C2) and from (P2, C2) to (P3, C3)

Figure 2: Job execution in MapReduce
In this part, a combination of MapReduce and picture fuzzy clustering is introduced and applied in image clustering problem.
The integration of picture fuzzy clustering and MapReduce method is performed as follow. Firstly, input image is converted to list type for MapReduce processing. Secondly, centers of clusters are generated randomly. Thirdly, the data is separated into many partitions. Each partition is parallel processed by MapTask. This step aims to calculate the membership degree of each sample in data partition corresponding to the centers of clusters using Eqs. (6)–(8) in order to obtain intermediary data. When Maptask is performed on all partitions, the intermediary data is sorted, merged and grouped in to clusters. Then, clustered data is proceeded by ReduceTask to re-calculate the centers of clusters by Eq. (5). The stop condition in this model is the convergence of clusters’ centers. MapTask and ReduceTask is repeated if the clusters’ centers are not converged. The results of this model is clustered images.
Our novel model is named as MapReduce based picture fuzzy clustering (MPFC). The framework of MPFC is given in Fig. 3 below.
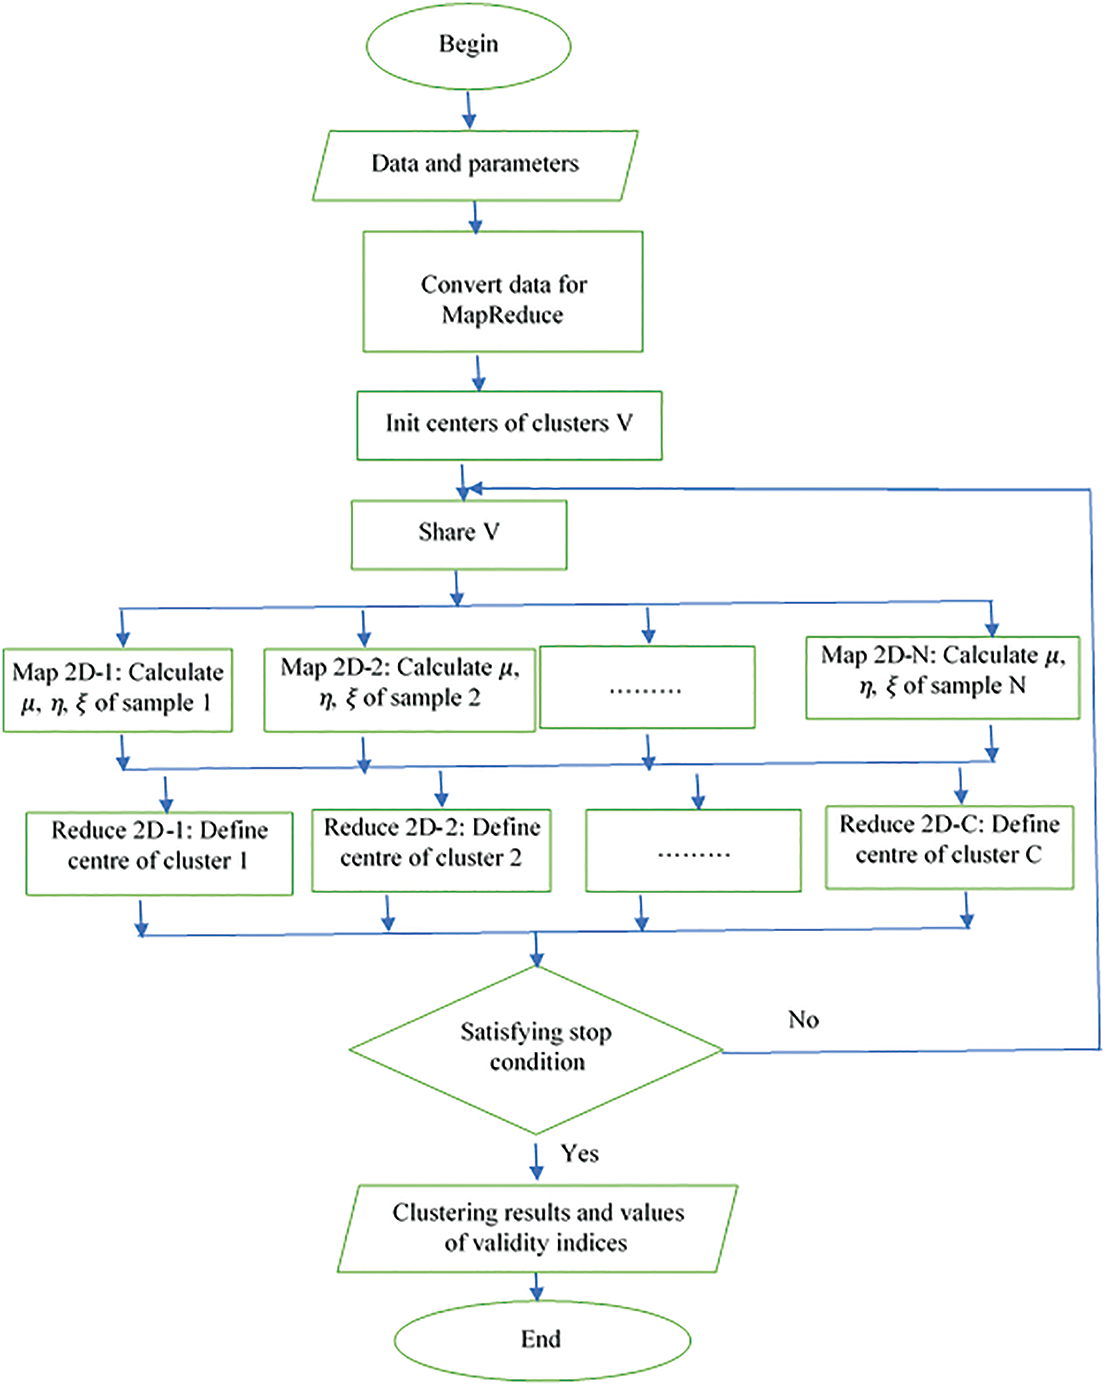
Figure 3: Framework of MapReduce based picture fuzzy clustering model
3.2 Converting Data for MapReduce Processing
In this part, pixel data is converted to various rows formed as a list. These rows include the information of position and following by the values representing for a pixel. The information of position is used to restore clustered images and perform the other tasks such as analysing, evaluating the results. Thus, output of clustering process is the data elements with the information of intensity, median and position.
3.3 Formal Representation for Map_PFC and Reduce_PFC Procedures
Input: Each data element xkj includes the information of position (indices of column and row) and intensity (k, j,
Output: The cluster index c and the elements belongs to c cluster in form of (k, j, xkj).
Then, we define d1, v1 and d3, v3 as below:
d1 is the offset. v1 is the content of data stream (k, j, xkj)
d3 is the information of new clustering cnew, v3 is the list of sets (k, j, xkj) of all elements belonging to cluster in d3
Map function assigns data to the nearest cluster. Thus, d2 and v2 can be determined as:
d2 is the index of the nearest cluster to xkj. v2 is the set (k, j, xkj)
Then, the formal representation of Map and Reduce procedures is:
Tab. 2 describe the algorithm of Map_ PFC. The purpose of Map_ PFC algorithm is to define the list of membership degree for each cluster center (in the set of shared centers) of input data objects.

Tab. 3 presents the algorithm of Reduce_PFC. The purpose of Reduce_PFC is to re-calculate the centers of clusters from the list of objects and the corresponding membership degrees.

3.6 Segmentation Result Generation
Based on the results of Reduce_PFC procedure, clustered images can be recovered using the information of position, intensity of cluster centers. Apart from that, the evaluation, analysis, recognition or classification can be performed based on the clustering results.
In this research, there are two datasets used in experiments, including:
• Satellite images extracted from weather image database of NASA [33] in the same place at different points of time. There are 03 datasets with 10 images in each. These images are collected once by 30 minutes in Hawaii, US Pacific Coast and Gulf of Mexico denoted as Data 1, Data 2 and Data 3, respectively. The size of images in this dataset is 500 x 500. Three last images are used to predict.
• Remote sensing images in Hoa Binh province, Vietnam presented as in Tab. 4.

In this research, Spark tool is used to install MPFC algorithm by MapReduce model.
The run time of two proposed algorithms is evaluated and compared to that of PFC. Clustering quality is also calculated by using validity indices, including Silhouette Width Criterion (SWC) [33], PBM-index (PBM) [34]. Based on the values of these indices, clustering quality of MPFC is compared to that of MapReduce Fuzzy Clustering (MFC) [35] and PFC.
4.2.1 On Weather Image Dataset
The experimental results of PFC, MFC and MPFC models on weather image dataset are shown in Tab. 5 below. In this table, the sign (+) denotes that the value of the index higher is the better.

As shown in Tab. 5, the values of PBM and SWC obtained by PFC and MPFC are equals. It means that the quality of segmentation by using PFC and MPFC is the same. However, the run time of MPFC is much less than that of PFC.
For the detail, time consuming of two models on weather image dataset is given as in Tab. 6.

In fact, the run time will take longer when the number of clusters increases. From the results in Tab. 6, by applying MapReduce procedure, MPFC is much faster than PFC in all four cases. On average, MPFC takes only 14.50% time consuming of PFC.
4.2.2 On Remote Sensing Images in Hoa Binh Province
The results on remote sensing images in Hoa Binh province are also presented. Fistly, validity indices obtained by applying PFC, MFC and MPFC are calculated and given in Tab. 7. Then, time consuming of PFC and MPFC are compared in Tab. 8 below.
As same as on the weather image dataset, in the case of 5 clusters, validity indices of PFC and MPFC are similar. The values in Tab. 7 also show that PFC and MPFC are better than MFC on PBM and SWC indices. Tab. 8 below shows the run time of PFC and MPFC on this dataset.


By applying MapReduce procedure, the runtime of MPFC is much less than the runtime of PFC. It takes about only 12.74% (on average) of the runtime by using PFC.
Thus, the results of proposed model are better in term of segmentation quality comparing with MFC. Apart from that, time consuming of MPFC is less than that of PFC while the quality is the same.
5 Conclusions and Future Works
In this paper, an improvement of picture fuzzy clustering applying in object detection on remote sensing images is proposed. In this model, picture fuzzy clustering is integrated to MapReduce method. Three main contributions are given in this paper. Firstly, PFC is applied into remote sensing image segmentation problem to increase the segmentation quality. Secondly, an algorithm named as MPFC is proposed. This algorithm uses MapReduce to shorten computation time of PFC while the clustering quality is guaranteed. Apart from that, the formal representation and details of Map_PFC and Reduce_PFC procedures are also given in this paper. Thirdly, the experiments on satellite image and remote sensing image datasets are performed. From the obtained results, the comparison among PFC, MFC and MPFC is given and analyzed using SWC and PBM indices. The experimental results show that the clustering quality of MPFC is higher than PFC and MFC. Moreover, the time consuming of MPFC is aslo much less than the time consuming of PFC.
In this approach, the image data is used to implement the models. Other kinds of data are not mentioned. In further researches, the proposed model will be applied on varouis kinds of data to evaluate the performance. Thus, the most suitable data for this model will be specified. Moreover, other problems on specific dataset will be solved using this model as well.
Funding Statement: This research is funded by Thuyloi University Foundation for Science and Technology under Grant Number TLU.STF.19-02.
Conflicts of Interest: The authors declare that they have no conflicts of interest to report regarding the present study.
1. V. Ferrari, F. Jurie and C. Schmid, “From images to shape models for object detection,” International Journal of Computer Vision, vol. 87, no. 3, pp. 284–303, 2010. [Google Scholar]
2. A. Mohan, C. Papageorgiou and T. Poggio, “Example-based object detection in images by components,” IEEE Transactions on Pattern Analysis And Machine Intelligence, vol. 23, no. 4, pp. 349–361, 2001. [Google Scholar]
3. X. Yao, X. Feng, G. Cheng, J. Han and L. Guo, “Rotation-invariant latent semantic representation learning for object detection in VHR optical remote sensing images,” in IGARSS 2019-2019 IEEE Int. Geoscience and Remote Sensing Symp., Yokohama, Japan, pp. 1382–1385, 2019. [Google Scholar]
4. Q. Ming, L. Miao, Z. Zhou, J. Song and X. Yang, “Sparse label assignment for oriented object detection in aerial images,” Remote Sensing, vol. 13, no. 14, pp. 2664, 2021. [Google Scholar]
5. I. Ševo and A. Avramović, “Convolutional neural network based automatic object detection on aerial images,” IEEE Geoscience and Remote Sensing Letters, vol. 13, no. 5, pp. 740–744, 2016. [Google Scholar]
6. K. Fu, Z. Chang, Y. Zhang, G. Xu, K. Zhang et al., “Rotation-aware and multi-scale convolutional neural network for object detection in remote sensing images,” ISPRS Journal of Photogrammetry and Remote Sensing, vol. 161, no. 1, pp. 294–308, 2020. [Google Scholar]
7. B. Xu and Z. Chen, “Multi-level fusion based 3d object detection from monocular images,” in Proc. of the IEEE Conf. on Computer Vision and Pattern Recognition, Salt Lake City, UT, USA, pp. 2345–2353, 2018. [Google Scholar]
8. D. H. F. Dijkman, R. B. Towal and V. S. R. Annapureddy, “Context-based priors for object detection in images,U.S. Patent 10,410,096, Issued September 10,2019. [Google Scholar]
9. M. Sundermeyer, Z. C. Marton, M. Durner, M. Brucker and R. Triebel, “Implicit 3d orientation learning for 6d object detection from rgb images,” in Proc. of the European Conf. on Computer Vision (ECCV), Munich, Germany, pp. 699–715, 2018. [Google Scholar]
10. B. Mariana and L. Drăguţ, “Random forest in remote sensing: A review of applications and future directions,” ISPRS Journal of Photogrammetry and Remote Sensing, vol. 114, pp. 24–31, 2016. [Google Scholar]
11. Y. Li, Y. Zhang, X. Huang, H. Zhu and J. Ma, “Large-scale remote sensing image retrieval by deep hashing neural networks,” IEEE Transactions on Geoscience and Remote Sensing, vol. 56, no. 2, pp. 950–965, 2017. [Google Scholar]
12. Y. Long, Y. Gong, Z. Xiao and Q. Liu, “Accurate object localization in remote sensing images based on convolutional neural networks,” IEEE Transactions on Geoscience and Remote Sensing, vol. 55, no. 5, pp. 2486–2498, 2017. [Google Scholar]
13. K. Li, G. Wan, G. Cheng, L. Meng and J. Han, “Object detection in optical remote sensing images: A survey and a new benchmark,” ISPRS Journal of Photogrammetry and Remote Sensing, vol. 159, pp. 296–307, 2020. [Google Scholar]
14. Y. Ren, C. Zhu and S. Xiao, “Small object detection in optical remote sensing images via modified faster R-CNN,” Applied Sciences, vol. 8, no. 5, pp. 813–824, 2018. [Google Scholar]
15. C. Wang, X. Bai, S. Wang, J. Zhou and P. Ren, “Multiscale visual attention networks for object detection in VHR remote sensing images,” IEEE Geoscience and Remote Sensing Letters, vol. 16, no. 2, pp. 310–314, 2018. [Google Scholar]
16. P. Kavitha and P. V. Saraswathi, “Segmentation for content based satellite image retrieval using fuzzy clustering,” International Journal of Advanced Science and Technology, vol. 29, no. 9s, pp. 3042–3049, 2020. [Google Scholar]
17. P. K. Kavitha and P. V. Saraswathi, “Content based satellite image retrieval system using fuzzy clustering,” Journal of Ambient Intelligence and Humanized Computing, vol. 12, no. 5, pp. 5541–5552, 2021. [Google Scholar]
18. P. A. Flores-Vidal, P. Olaso, D. Gómez and C. Guada, “A new edge detection method based on global evaluation using fuzzy clustering,” Soft Computing, vol. 23, no. 6, pp. 1809–1821, 2019. [Google Scholar]
19. V. О. Gorokhovatskyi, I. S. Tvoroshenko and N. V. Vlasenko, “Using fuzzy clustering in structural methods of image classification,” Telecommunications and Radio Engineering, vol. 79, no. 9, pp. 781–791, 2020. [Google Scholar]
20. C. Militello, L. Rundo, L. Minafra, F. P. Cammarata, M. Calvaruso et al., “MF2C3: Multi-feature fuzzy clustering to enhance cell colony detection in automated clonogenic assay evaluation,” Symmetry, vol. 12, no. 5, pp. 773–796, 2020. [Google Scholar]
21. B. C. Cuong and V. Kreinovich, “Picture fuzzy sets,” Journal of Computer Science and Cybernetics, vol. 30, no. 4, pp. 409–420, 2014. [Google Scholar]
22. L. H. Son, “Generalized picture distance measure and applications to picture fuzzy clustering,” Applied Soft Computing, vol. 46, no. 4, pp. 284–295, 2016. [Google Scholar]
23. P. H. Thong, “A novel automatic picture fuzzy clustering method based on particle swarm optimization and picture composite cardinality,” Knowledge-Based Systems, vol. 109, no. 3, pp. 48–60, 2016. [Google Scholar]
24. S. A. Kumar, B. S. Harish and V. M. Aradhya, “A picture fuzzy clustering approach for brain tumor segmentation,” in 2016 Second Int. Conf. on Cognitive Computing and Information Processing (CCIP), IEEE, Mysuru, India, pp. 1–6, 2016. [Google Scholar]
25. C. Wu and Y. Chen, “Adaptive entropy weighted picture fuzzy clustering algorithm with spatial information for image segmentation,” Applied Soft Computing, vol. 86, no. 4, pp. 105888, 2020. [Google Scholar]
26. L. H. Son and P. H. Thong, “Some novel hybrid forecast methods based on picture fuzzy clustering for weather nowcasting from satellite image sequences,” Applied Intelligence, vol. 46, no. 1, pp. 1–15, 2017. [Google Scholar]
27. B. Eren, U. Yolcu and E. Egrioglu, “Picture fuzzy regression functions approach for financial time series based on ridge regression and genetic algorithm,” Journal of Computational and Applied Mathematics, vol. 370, no. 3, pp. 112656, 2020. [Google Scholar]
28. X. Dai, X. Yuan and X. Wei, “TIRNet: Object detection in thermal infrared images for autonomous driving,” Applied Intelligence, vol. 51, no. 3, pp. 1244–1261, 2021. [Google Scholar]
29. Z. Z. Wu, X. F. Wang, L. Zou, L. X. Xu, X. L. Li et al., “Hierarchical object detection for very high-resolution satellite images,” Applied Soft Computing, vol. 113, no. 7, pp. 107885, 2021. [Google Scholar]
30. P. Nandhini, “A research on big data analytics security and privacy in cloud, data mining, hadoop and mapreduce,” Shreyas Satardekar Int. Journal of Engineering Research and Application, vol. 8, no. Issue4 (Part -III), pp. 65–78, 2018. [Google Scholar]
31. D. Jeffrey and S. Ghemawat, “MapReduce: Simplified data processing on large clusters,” Communications of the ACM, vol. 51, no. 1, pp. 107–113, 2008. [Google Scholar]
32. B. P. Shukla, C. M. Kishtawal and P. K. Pal, “Prediction of satellite image sequence for weather nowcasting using cluster-based spatiotemporal regression,” IEEE Transactions on Geoscience and Remote Sensing, vol. 52, no. 7, pp. 4155–4160, 2013. [Google Scholar]
33. L. Vendramin, R. J. Campello and E. R. Hruschka, “Relative clustering validity criteria: A comparative overview,” Statistical Analysis and Data Mining: The ASA Data Science Journal, vol. 3, no. 4, pp. 209–235, 2010. [Google Scholar]
34. M. K. Pakhira, S. Bandyopadhyay and U. Maulik, “Validity index for crisp and fuzzy clusters,” Pattern Recognition, vol. 37, no. 3, pp. 487–501, 2004. [Google Scholar]
35. S. A. Ludwig, “MapReduce-based fuzzy c-means clustering algorithm: Implementation and scalability,” International Journal of Machine Learning and Cybernetics, vol. 6, no. 6, pp. 923–934, 2015. [Google Scholar]
 | This work is licensed under a Creative Commons Attribution 4.0 International License, which permits unrestricted use, distribution, and reproduction in any medium, provided the original work is properly cited. |