DOI:10.32604/csse.2022.024788
| Computer Systems Science & Engineering DOI:10.32604/csse.2022.024788 | |
| Article |
Automatic Liver Tumor Segmentation in CT Modalities Using MAT-ACM
1Department of Computer Science and Engineering, P.S.R. Engineering College, Sivakasi, Tamil Nadu, 626123, India
2COMBA R&D Laboratory, Faculty of Engineering, Universidad Santiago de Cali, Cali, 76001, Colombia
3Department of Electronics and Communications Engineering, Kuwait College of Science and Technology, Kuwait
4Department of Computer Science and Engineering, Koneru Lakshmaiah Education Foundation, Vaddeswaram, Andhra Pradesh, 522502, India
5Department of Computer Science and Engineering, PSN College of Engineering and Technology, Tirunelveli, Tamil Nadu, 627152, India
*Corresponding Author: S. Priyadarsini. Email: priyadarshini@psr.edu.in
Received: 31 October 2021; Accepted: 01 December 2021
Abstract: In the recent days, the segmentation of Liver Tumor (LT) has been demanding and challenging. The process of segmenting the liver and accurately spotting the tumor is demanding due to the diversity of shape, texture, and intensity of the liver image. The intensity similarities of the neighboring organs of the liver create difficulties during liver segmentation. The manual segmentation does not provide an accurate segmentation because the results provided by different medical experts can vary. Also, this manual technique requires a large number of image slices and time for segmentation. To solve these issues, the Fully Automatic Segmentation (FAS) technique is proposed. In this proposed Multi-Angle Texture Active Contour Model (MAT-ACM) method, the input Computed Tomography (CT) image is preprocessed by Contrast Enhancement (CE) with Non-Linear Mapping Technique (NLMT), in which the liver is differentiated from its neighbouring soft tissues with related strength. Then, the filtered images are given as the input to Adaptive Edge Modeling (AEM) with Canny Edge Detection (CED) technique, which segments the Liver Region (LR) from the given CT images. An AEM with a CED model is implemented, which increases the convergence speed of the iterative process for decreasing the Volumetric Overlap Error (VOE) is 6.92% rates when compared with the traditional Segmentation Techniques (ST). Finally, the Liver Tumor Segmentation (LTS) is developed by applying the MAT-ACM, which accurately segments the LR from the segmented LRs. The evaluation of the proposed method is compared with the existing LTS methods using various performance measures to prove the superiority of the proposed MAT-ACM method.
Keywords: Computed tomography; contrast enhancement; adaptive edge modeling; multi-angle texture active contour; liver tumor segmentation
The liver is one of the significant internal organs located in the abdomen of the human body, which comprises four distinct lobes such as left lobe, right lobe, caudate lobe, and quadrate lobe. In recent days, the LT has been the leading cause of adult deaths worldwide. The absolute number of cancer deaths increased due to population growth and increased life expectancy. The World Health Organization (WHO) [1] stated that 7.6 million deaths (approximately 13%) were accounted for due to LT across the world in the year 2010. Global cancer statistics [2] has reported that LT is the second leading cause of cancer death and the fifth most commonly diagnosed disease among men. The National vital statistics [3] has recorded that 40,099 LT patients died in 2014, of which 19,208 were men and 20,891 were women. Also, the survey stated that cancer deaths could increase in future, with an estimation of 11 million people in the year 2030. To escape this malady, the medical experts who give appropriate treatment and diagnosis use different imaging modalities.
Medical imaging has been widely used in recent days for an earlier diagnosis and appropriate treatment of LTs. The imaging modalities are mainly used to spot the liver infection, depict the liver lesions, extract response to treatment, assessment of surgical treatment, stage neoplasm and chemotherapy pump placement. There are different types of imaging modalities for LT detection, which include: Ultrasonography, Magnetic Resonance Imaging (MRI), Positron Emission Tomography (PET), and Computerized Tomography (CT).
Among these modalities, CT [4] is considered highly accurate imaging, so diagnosticians prefer it for the diagnosis of liver disease. It provides more accurate anatomical information about the visualized structures with increased spatial resolution. Compared to the MRI, it is cheaper, and it detects the more minor changes between the healthy and liver lesion tissues.
Different STs have been developed, which segment the image with the help of modalities. There are different types of ST, including manual segmentation, semi-automatic segmentation, and FAS.
In manual segmentation, the medical experts segment the image slice by slice, and the liver frontiers are recognized contrarily by a dissimilar radiologist or the same radiologist at a different time. The significant drawbacks of manual segmentation are multiple image slices, intensive time, lack of results, and creating a distinct dataset, which is a highly complex process. Due to these issues, semi-automatic segmentation is developed that interactively identifies the seed points for extracting the liver boundary from the selected regions. However, it has some disadvantages, such as time-consuming, inefficient segmentation results, and user interaction to segment the liver and precisely locate the tumor. The significant limitations of the conventional technique, such as the k-means technique and Chan–Vese algorithms are, it is used only for the low contrast images and the lack of confining edges of the liver from the abdominal CT images. To reduce the workload of the medical professional and erroneous measurements, FAS is proposed to automatically segment the liver and tumor from the medical images without user interaction, and it helps the radiologists assist diagnosis. It works based on prior knowledge of the image that includes the shape and localization of the liver.
The proposed work is organized as follows: Section 2 discusses the literature survey on various LTS techniques, the proposed method is presented in Section 3, in Section 4, the results and discussions are presented, and finally, the conclusion and future work are discussed in Section 5.
Liver CT is the best modality for detecting the LR and the tumor part in the abdomen. The manual segmentation and classification process can provide misclassification results, and it requires increased time consumption. Thus, a new system is required to efficiently characterize and detect the abnormalities from the medical images [5]. It mainly focuses on the computerized analysis of medical images used by the radiologists during lesion detection, the assessment of disease extent, and diagnostic decisions. During liver CT image segmentation, the representation of an image is simplified to analyze the meaningful information about the liver. In general, the location of both objects and boundaries is determined in the segmentation stage. The liver organ overlaps with the neighbourhood organs; its intensity value is the same, so segmenting the liver from the CT image is challenging. Detecting the tumour's location, size, and shape from the liver part is also a critical task. This section reviews the existing techniques and algorithms that are developed for LTS. In addition, the advantages and disadvantages of the existing works are also investigated.
Gloger et al. [6] introduced an adaptive Fast Marching Method (FMM) to segment the liver from CT images automatically. An automatic seed point selection was performed based on the characteristics and intensity structure of the liver. In the preprocessing stage, smooth Filtering was used to eliminate the noise, and the nonlinear gray converter was utilized to enhance the image's contrast. After that, the ribs, spines and kidneys were removed by implementing the thresholding operation. Here, the authors’ dataset containing 30 abdominal CT images was used for performance evaluation. The results are analyzed in terms of True Positive Rate (TPR), False Positive Rate (FPR), False Negative Rate (FNR), and Dice coefficient. The user does not require to set the parameters for each CT image that reduces the required amount of time. But this work does not utilize a large number of images during evaluation.
Song et al. [7] developed a local constraint level set model to segment the tumor portion from the liver images. Here, the likelihood energy was estimated by segmenting the target object with complex regions. The density distribution of different regions was calculated by using the Gaussian Smoothing Filtering Technique (GSFT). In experiments, the real-time dataset containing 64 CT images obtained from Shan Dong Cancer Hospital (SDCH) was utilized to evaluate the performance of the suggested system. The performance measures such as JD error, Relative Volume Difference (RVD), Average Symmetric Surface Distance (ASD), RMS distance and MSD were used to test the results. The suggested technique enhanced the quality of segmented tumor images and reduced the computational complexity.
Li et al. [8] presented an improved region growing and Quasi-Monte Carlo methods for segmenting the liver from CT images. This work mainly proposes to enhance the liver's segmentation accuracy and reduce the effect of seed point selection. Here, by denoising and increasing the contrast, the NLMT was implemented to preprocess the image. The repository of the Medical Image Computing and Computer-Assisted Intervention (MICCAI) provided images for evaluating the performance. The measures used were Root Mean Squared Symmetric Surface Distance (RMD), RVD, VOE, and ASD. This system automatically selects the seed points with increased liver segmentation accuracy. However, this work utilized only three images to test the segmentation system.
Lu et al. [9] recommended a Deep Convolutional Neural Network (DCNN) for an accurate LTS. Here, the FGFT was utilized to preprocess the image by reducing the noise. Then, the CNN was trained using the image patches at each pixel, and the same number of positive and negative samples were randomly sampled. After that, the tumor portion was segmented from the given image with different patch sizes. The real-time dataset containing 26 CT images obtained from Zhujiang Hospital affiliated with Southern Medical University was used to evaluate the performance in experiments. Measures such as Dice Similarity Coefficient (DSC), precision, and recall were utilized to test the superiority of the ST. This method segmented the tumor with heterogeneous intensity and fuzzy borders, which was the limitation of this work.
To segment the liver from CT images, Li et al. [10] illustrated a new model, namely Multilevel Local Region-based Sparse Shape Composition (MLR-SSC). At first, each region's local repository was modeled, and the input shape was refined in the region by region manner. Then, a hierarchical deformable model was implemented to derive the initial shape of the liver. The datasets used in this work were SLIVER07 and 3DIRCADB, which were publicly available. The measures used were VOE, RVD, RMD, and ASD. This technique was highly robust and efficient, but it segmented the liver with small training sets.
The survey observed that the traditional techniques mainly have drawbacks on time consumption and increased volumetric overlap error. In order to address these issues, the proposed work aims to develop an automatic segmentation.
The CT images of the abdomen were obtained from the publicly accessible database 3DIRCADB and the non-public dataset in this proposed work. The French research institute against Digestive Cancer, known as IRCAD, in which the Hepato Cellular Carcinoma (HCC), metastases and hemangiomas pathologies exist, provided the first public 3DIRCADB dataset that contains 20 CT scan images of the liver and, later on, the corresponding ground truth images. Also, the non-public dataset contained various patient's 10 CT scans in which 10 slices for each patient are believed to have expert segmentations manually given by the clinical partner. Meenakshi Mission Hospital and Research Centre, Tamil Nadu, India, are the leading suppliers of these images.
The algorithm for LR segmentation to be developed should provide accurate results for the perfect detection of tumour affected areas. In this work, in order to get an efficient result, preprocessing technique is used before liver segmentation. In general, the abdomen CT images in the dataset are highly affected by the noise and other artifacts, and it does not provide accurate results for diagnosis. So, the images must be preprocessed before the segmentation process for denoising and enhancing the quality for accurate segmentation. A NLMT is implemented for enhancing the contrast of the image in which the liver is differentiated from its neighbouring soft tissues with related strengths. This algorithm computes an equalisation histogram by dividing the given image into separate blocks of suitable sizes [11,12]. Also, it utilizes the function of the sigmoid filtering technique, and its transformation is illustrated as shown in Eq. (1).
where the input CT image's pixel value is represented by x, the output LR is represented by y, the output region's minimum and maximum values of the optimized image are represented by MIN and MAX, the distance between the liver region's MIN and MAX values is represented by α, and the mean pixel value is β. Here, the MIN and MAX values are considered for producing the resultant CE liver image [13–16].
After preprocessing the image, the liver is segmented from the filtered image by employing ST. The task of segmenting the liver from the CT abdomen images is highly critical because of the following issues: The demarcation between the liver and the rest of the organs is unclear due to the varying shape of the liver. The spleen and the liver are more adjacents, which results in an indistinguishable border between them, and they require some sufficient seed points for estimating the intensity distributions between the foreground and the background. For this purpose, this work introduces an integrated technique that includes AEM with CED for accurate LR segmentation because it is an input for the LTS process during the diagnosis of liver diseases [17–20].
The AEM is integrated with the CED technique, which removes and normalizes the background region. The main intention of this technique is to increase the convergence speed of the iterative process and improve the accuracy of segmentation. Also, it detects the external boundaries of the liver during the initialization of segmentation [21–23]. In the AEM-CED technique, the Canny filter mask is represented as a 3 × 3 matrix in both x and y directions, given in Fig. 1.
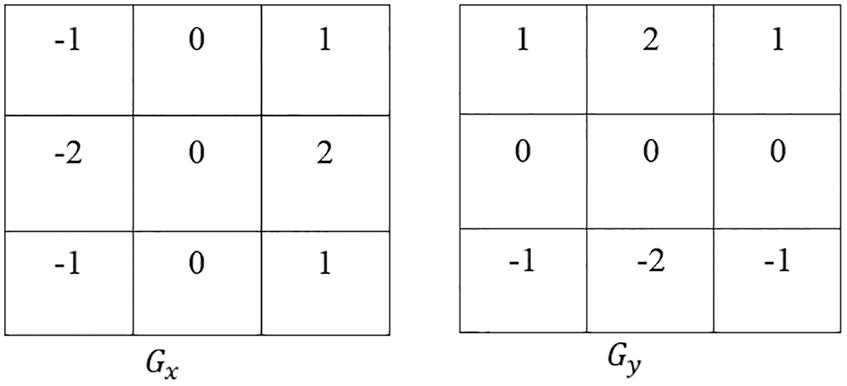
Figure 1: Mask in CED technique
The magnitude at each gradient is estimated as |G| = |Gx| + |Gy| Eq. (2) can be elaborated as
where Y is the Filtered image, i, j are the row and the column limits of an image pixel, Gx, Gy are the gradients at ‘x’ and ‘y’ directions, respectively, Eq. (3)
The algorithm for AEM with CED method is given below,
Input: Filtered Image ‘Y’ and Edge from Canny ‘E’ are given as the input.
Output: Normalized image. ‘Ig’ is obtained as an output.
Step 1. The edge of the image is extracted for estimating the intensity value before segmentation. Where Y represents the general area of the image and E represents the binarized edge. It is calculated as in Eq. (4).
Step 2. Based on the intensity value, the thresholding is applied to the image for separating the image components. The boundary is selected based on the following condition:
Step 3.
Step 4.
Step 5. Connected Component (CC) is estimated as
Step 6. The Label is initialized as
Step 7. Label to the unique components is allocated by using,
Step 8. The Number of Elements (NOE) in the labeled components is estimated as Eq. (5).
Step 9. Step 5 and Step 6 are processed until the condition is met; End ‘i’ loop
Step 10. The maximum area of the components is identified among the overall image as in Eq. (6).
Step 11. After that, the difference between the maximum labelled matrix and the ‘B’ matrix is estimated as in Eq. (7).
Step 12. The filtered image from ‘B’ matrix that contains only the liver image is updated as in Eq. (8)
Step 13. Finally, the liver image is segmented, and the image is normalized as in Eq. (9)
The abnormal tissue in and around the liver is known as a lesion/tumour identified by differentiating the pixel intensity of other regions in the liver. LTS is extracting the tumor region from the background tissue in the segmented CT liver image. The texture information is required to discriminate various organ tissues. The texture features are mainly computed from the region of pixels in an image in order to characterize the region. In the interpretation of medical images, these features are used extensively. The texture demonstrates the randomness, size, color, directivity, brightness, smoothness, roughness, and granulation.
In the proposed MAT-ACM, there is an initialization of the mapping value of the image cluster, and an estimation is made on the maximum and standard deviation of the image pixel intensity. The difference between the cluster weights is extracted, and the density of the edge map length is calculated. Finally, the cluster magnitude is estimated, and the image gets projected over by an indexed cluster to recognize the image pixel's optimum matching. The procedure of MAT-ACM is illustrated as follows:
Input: Segmented Liver Image, ‘Ig’
Output: Segmented tumor image, ‘P1’
Step 1: The mapping value of an image cluster is initialized by estimating the maximum and standard deviation of image pixel intensity as in Eq. (10)
Step 2: The random map window is initialized for clustering, which is shown in Eqs. (11) and (12)
Step 3:
where ‘i’ and ‘j’ are row and column sizes of the Map window.
Step 4: The radius is set as R = rand for updating the weight of the cluster weight by representing the moving window's limit.
Step 5: The weight of the cluster is extracted using Eq. (13)
Step 6: The mapping window is updated as in Eq. (14)
Step 7: The radius is updated based on the cluster weight, which is given in Eq. (15)
where the number of iterations is denoted by t, and for each n number of iteration, the value of the radius is updated.
Step 8: The weight of the cluster is derived as in Eq. (16)
Step 9: The density of the edge length map is calculated as in Eq. (17)
Step 10: The magnitude of the cluster is estimated as in Eq. (18)
where ‘i’ and ‘j’ are row and column size of the image
Step 11: The image gets projected over by the indexed cluster, and the clustering matrix helps to identify the best matching of the image pixel as in Eq. (19)
where ‘a’ represents the iterative index of the image sequence.
Step 12: Segmented indexed image, P1 = Ig(Indx)
The dataset 3DIRCADB (20 images), which is the repository of images and the non-public dataset (10 images) were used to evaluate the proposed algorithms. The preprocessing and Liver Segmentation Methods (LSM) are implemented, and their performance was analyzed using qualitative and quantitative measures. During the qualitative analysis, the resultant images after implementing the preprocessing and segmentation processes are depicted. In quantitative analysis, various performance measures are utilized for evaluating the proposed LSM's performance results. Also, a comparison is made about the performance of the proposed and current approaches.
4.1 Performance Evaluation Metrics
The performances of the preprocessed results are quantitatively evaluated based on the measure of Peak Signal to Noise Ratio (PSNR). Then, according to the five-volume and surface-based metrics given in the following, the LSM results are compared with the expert generated ground truth: Maximum Symmetric Surface Distance (MSD) measures, Volumetric Overlap Error (VOE), Root Mean Square Symmetric Surface Distance (RMSD), Signed Relative Volume Difference (SRVD), and ASD. The units of measurement for volume and surface-based metrics are percent and millimeters, correspondingly. The smaller the value is, the better the segmentation result is for all these evaluation metrics. The performance of the preprocessing and LSMs is analyzed and compared to prove the superiority of the segmentation method.
The filtering techniques are applied to preprocess the input images. There are three different techniques: FGFT, CE with NLMT, and Cellular Model of Median Filtering. Then, the best filtering technique is identified based on its PSNR values.
For this purpose, CE using NLMT is applied in this work. Figs. 2 and 3 show the proposed techniques’ segmentation results for the sample of 20 images in the public 3DIRCADB dataset (Figs. 4 and 5) (Tabs. 1 and 2).
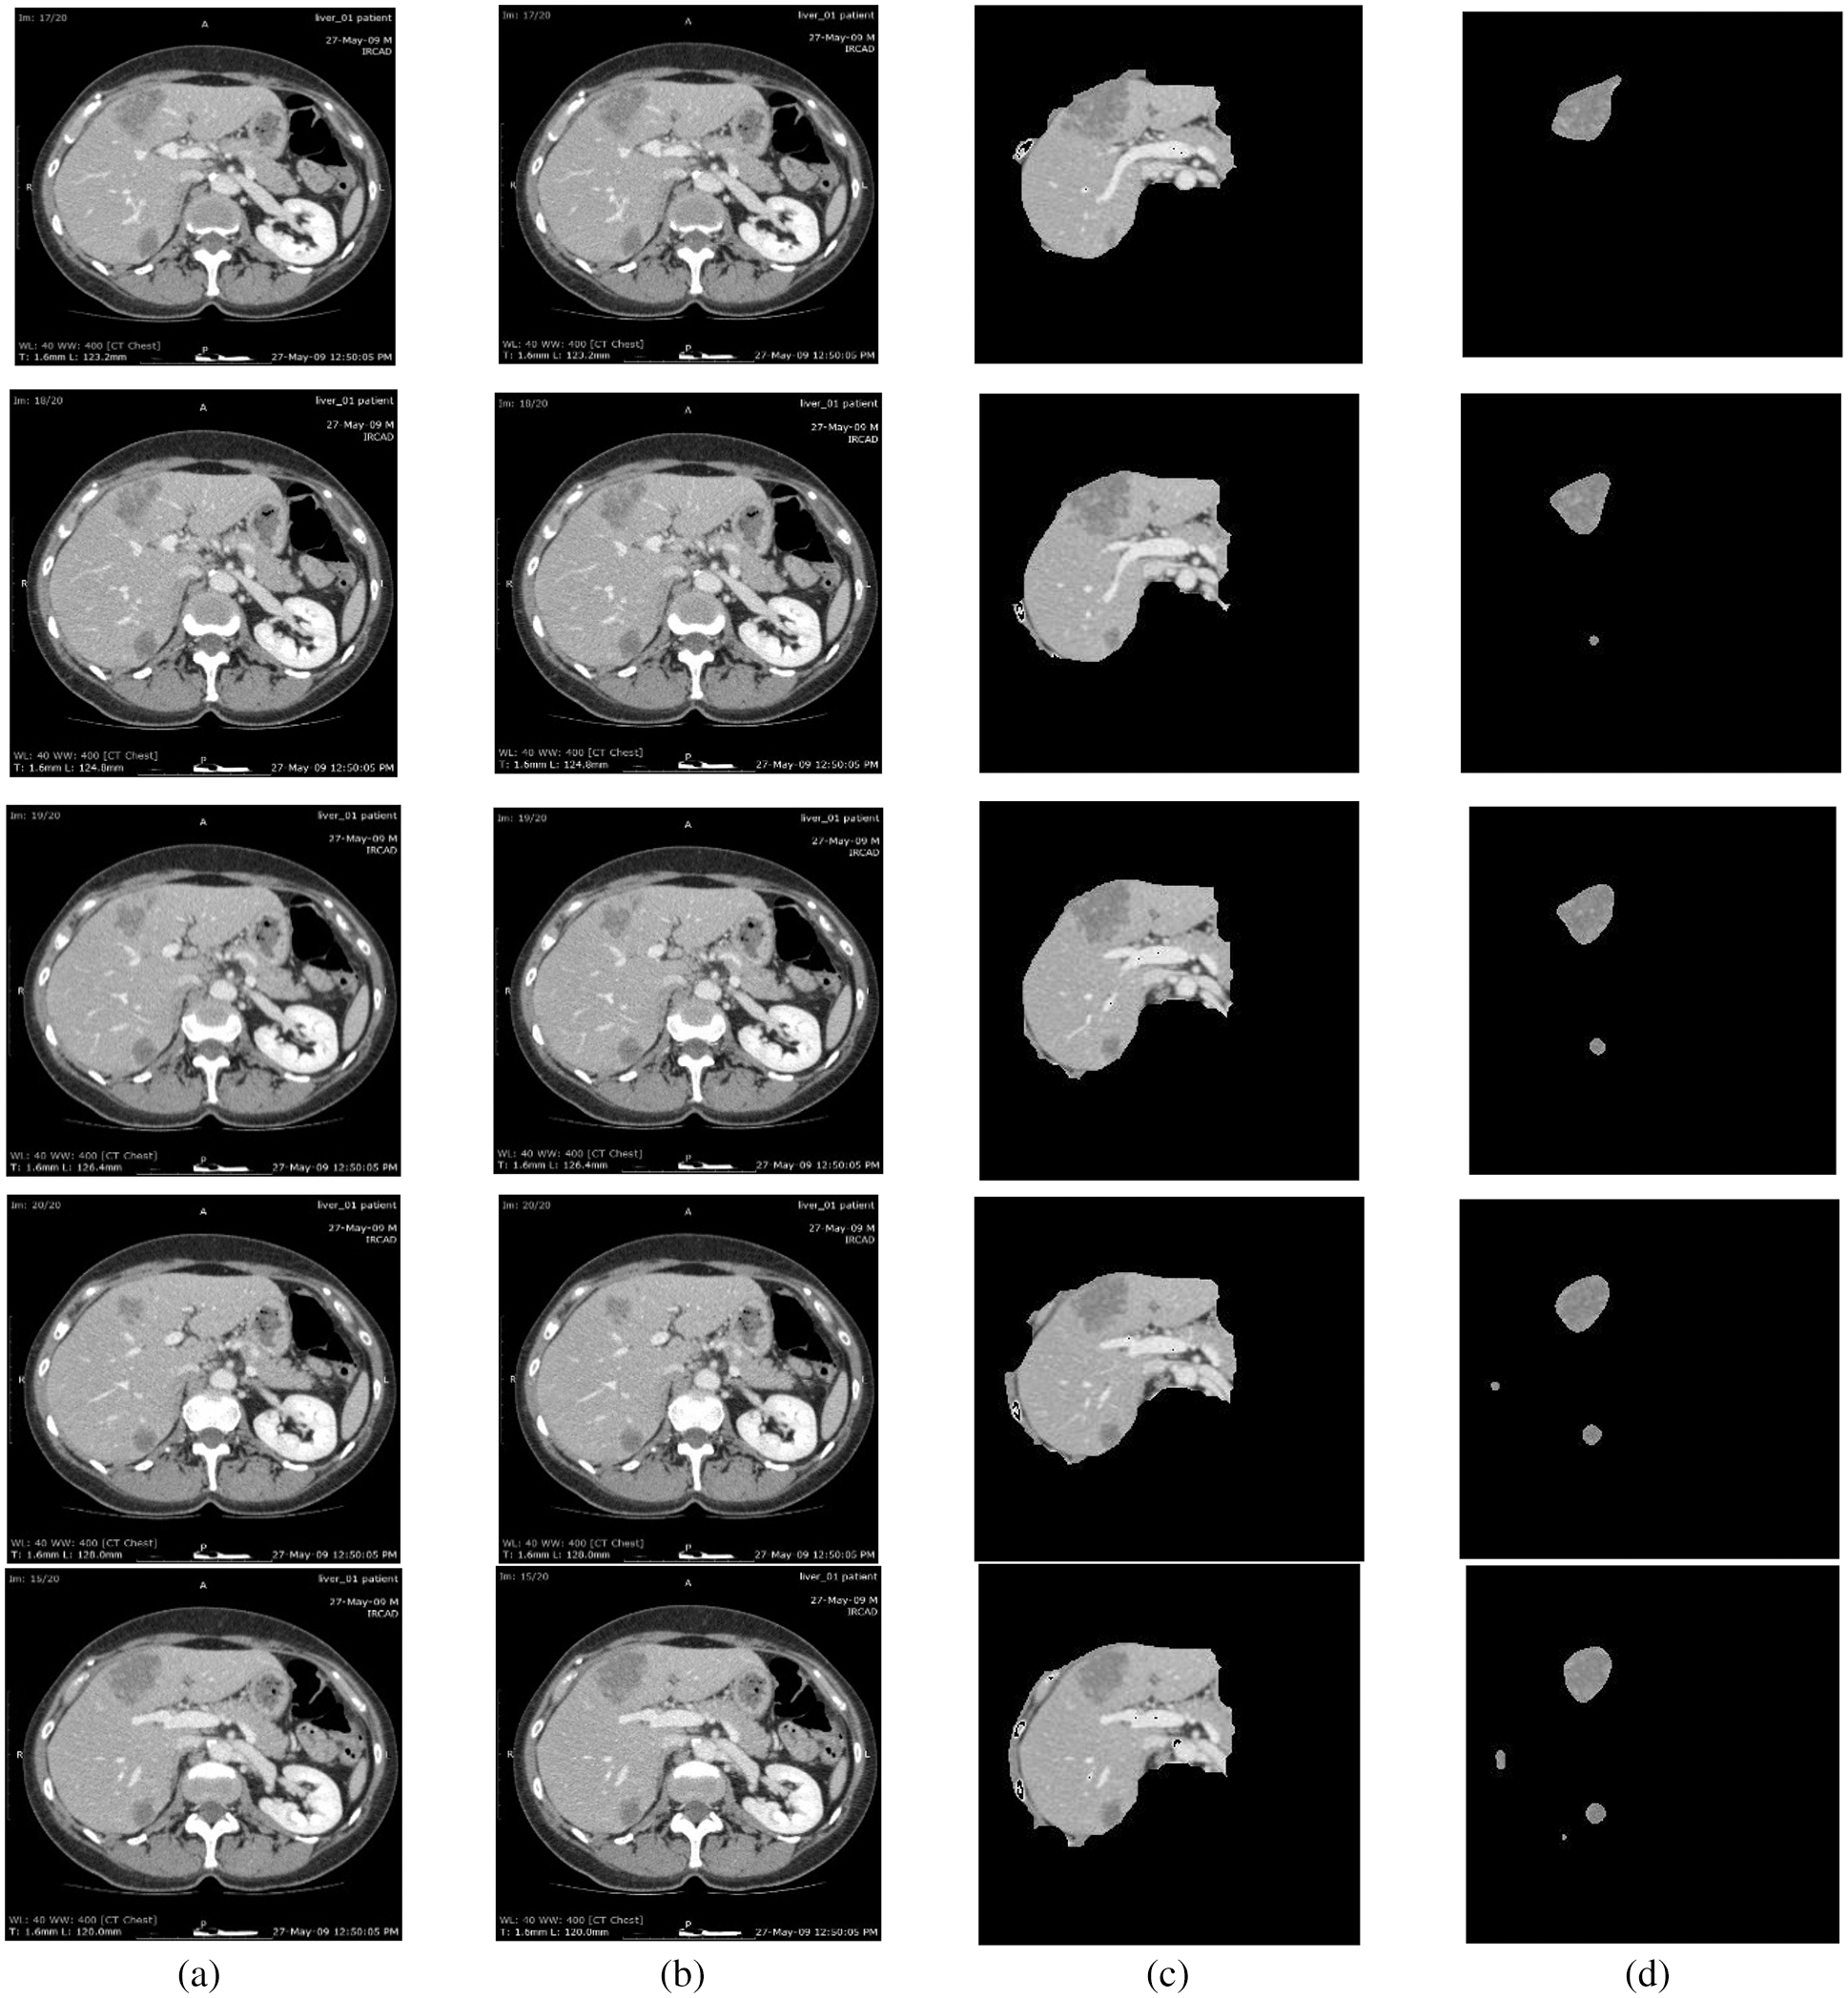
Figure 2: Segmentation results of 3DIRCADB public dataset: (a) Input image (b) processed output using CE using non-linear filtering (c) the output of AEM with CED algorithms (d) output of MAT-ACM
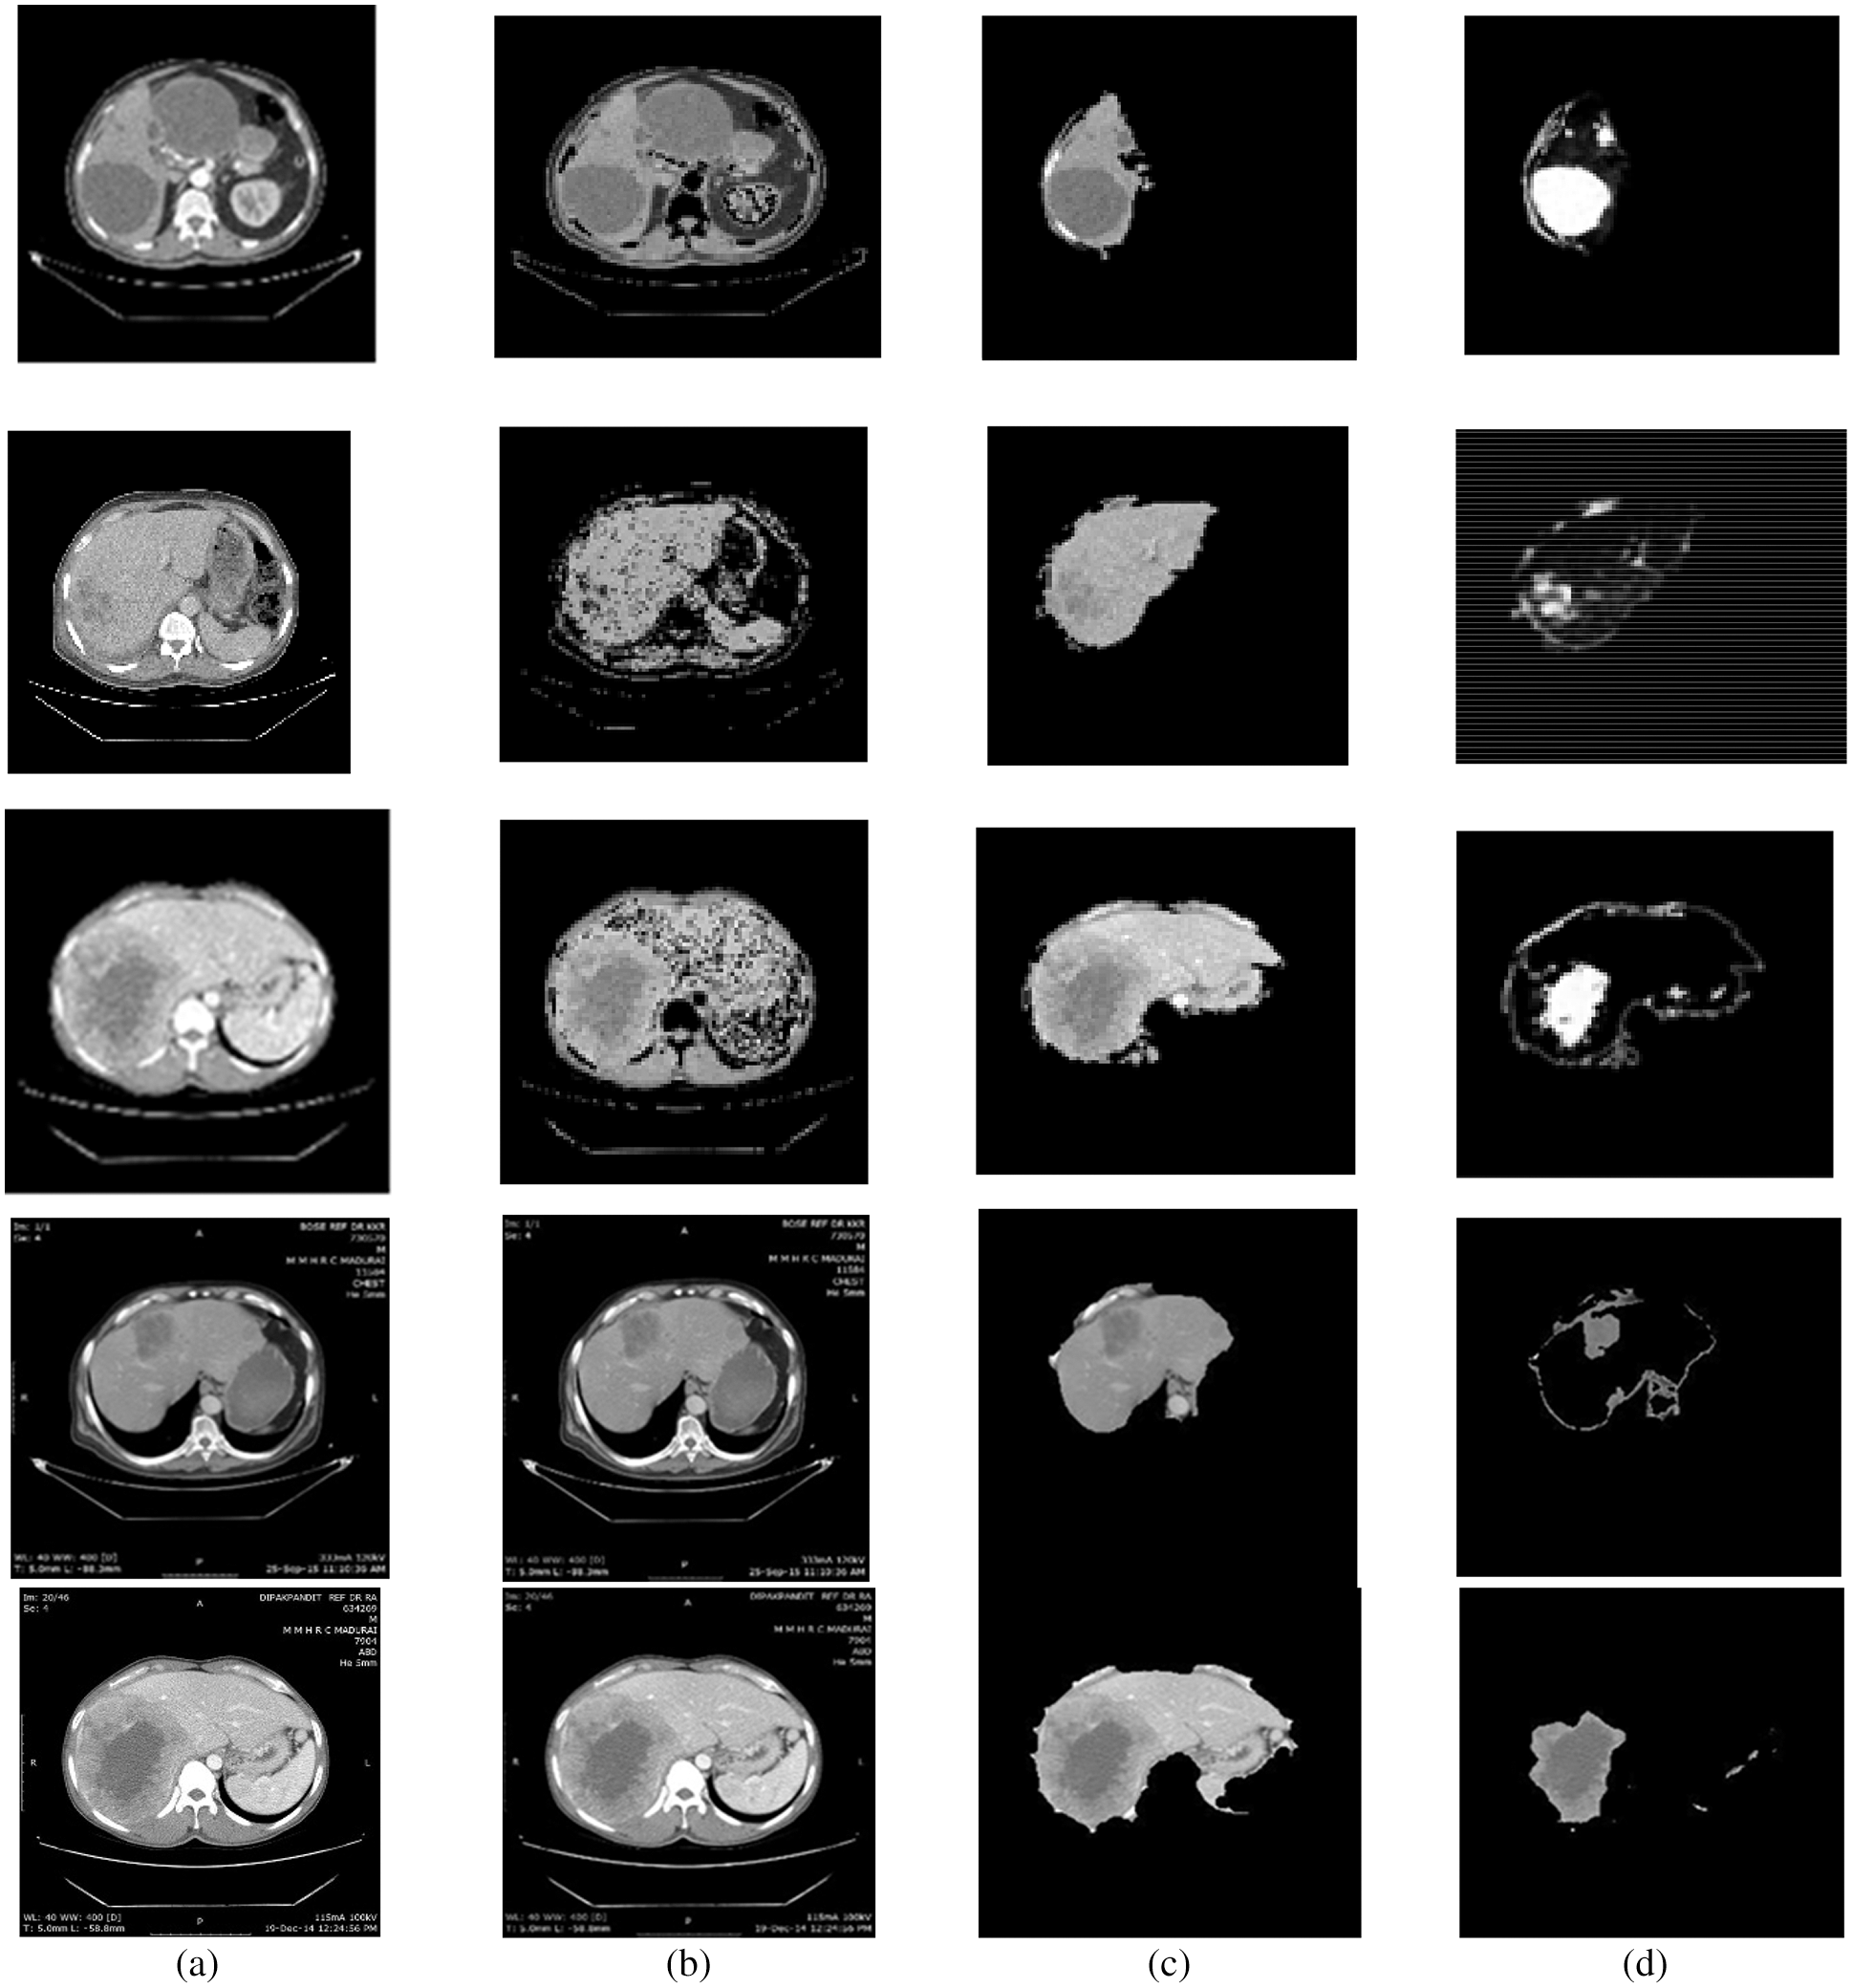
Figure 3: Segmentation results of non-public dataset: (a) Input image, (b) processed output using CE using non-linear filtering, (c) output of AEM with CED algorithms, (d) output of MAT-ACM
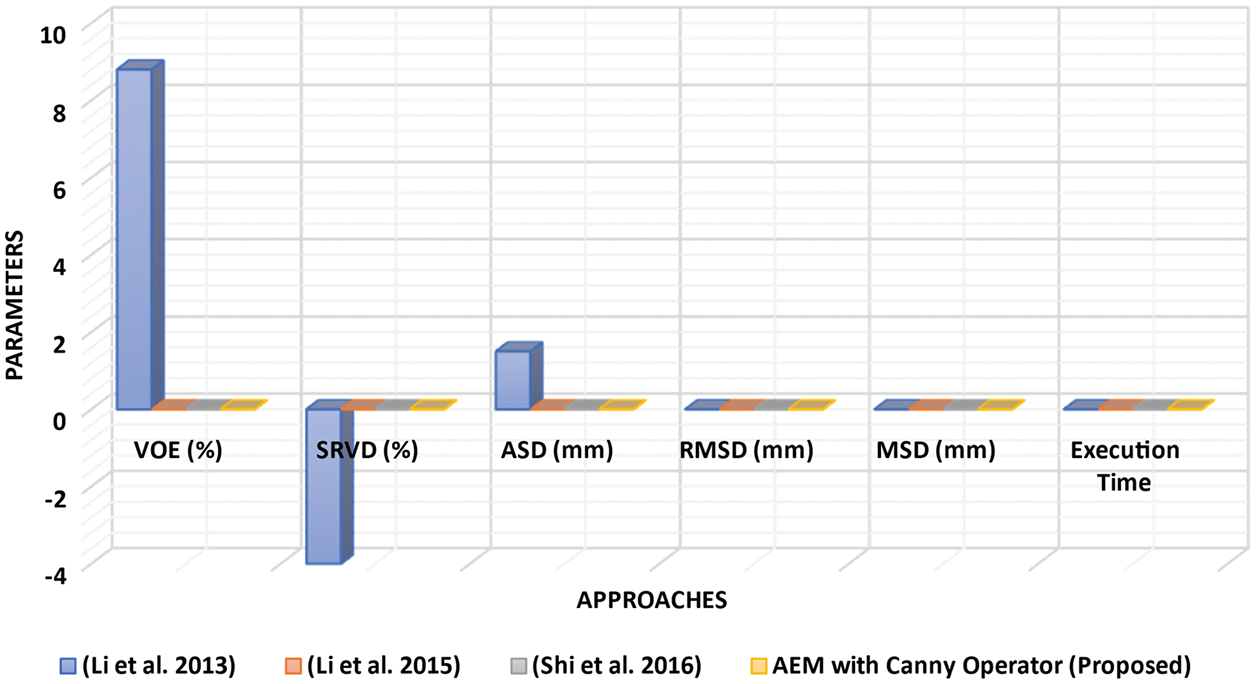
Figure 4: Performance analysis of LSM with different approaches
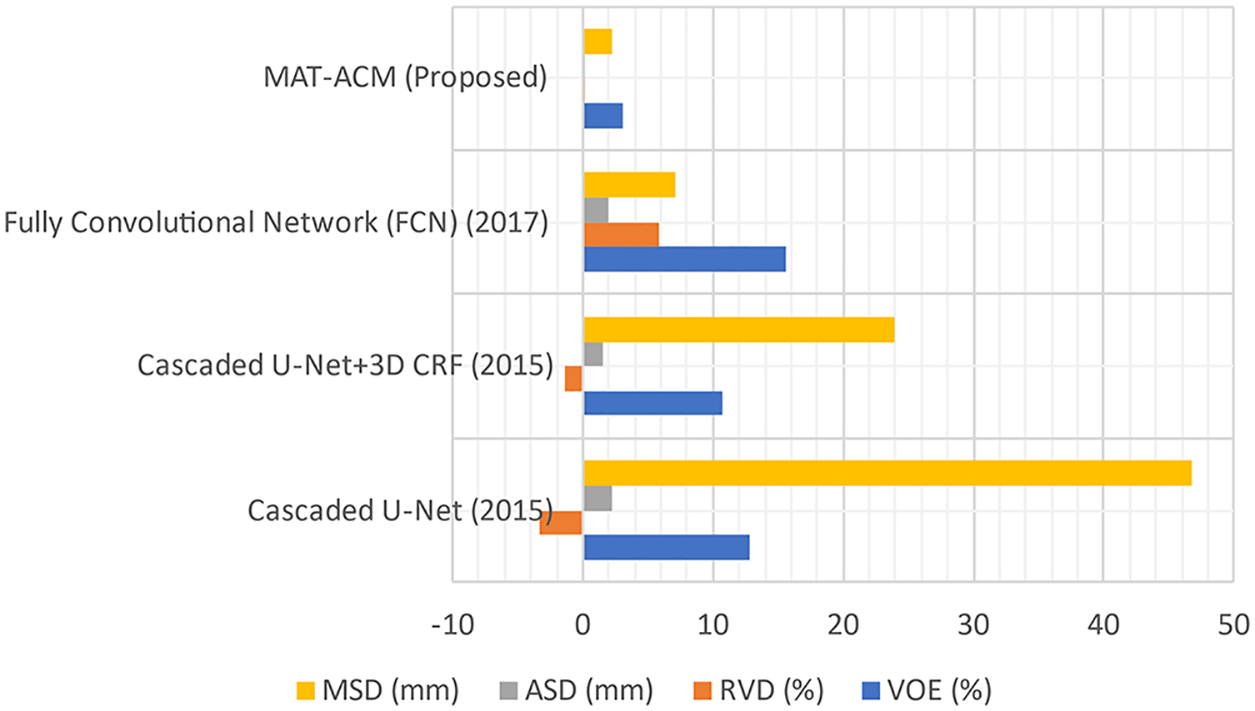
Figure 5: Performance analysis of LSM with difference parameters


Tab. 1, Figs. 2 and 3 show that the AEM with the Canny technique provides better performance results than the other existing traditional techniques. The mean VOE (6.92) and execution time (30 s) of AEM with Canny method is comparable with the existing methods (Li et al. 2013; Li et al. 2015 and Shi et al. 2016). Based on the qualitative, quantitative and comparative performance results, the most appropriate segmentation technique is identified, and its resultant image is considered for the following tumor segmentation process. The performance evaluation shows that the AEM with the Canny operator provides increased segmentation results for both empirical datasets.
The LTS is developed by implementing different FAS techniques. In experiments, the proposed and existing ST results are evaluated based on qualitative and quantitative analyses. Public 3DIRCADB and non-public datasets are used, and the resultant images from applying each ST are evaluated in the qualitative analysis. In the quantitative analysis, the performance of the techniques are analyzed using various performance measures. An AEM with a CED model is implemented, which increases the convergence speed of the iterative process for decreasing the Volumetric Overlap Error VOE (6.92%) values compared with the traditional techniques. The significant advantages of this technique are that it can detect the edges even in noisy environments and provide accurate positioning. So, the resultant image of AEM-CED is considered as the input for the LTS system. So, the MAT-ACM technique is implemented for accurate LTS. This technique follows the texture-based model, providing decreased VOE (3.08%) values than the existing methods and shows flexibility during segmentation.
In future, this work may be enhanced by implementing the LTS classification technique for different imaging modalities with increased accuracy. Also, its goal is to enhance the whole segmentation and the proposed system's classification performance. Future research attempts may focus on reducing the VOE rate further.
Funding Statement: This research has been funded by Dirección General de Investigaciones of Universidad Santiago de Cali under call No. 01-2021.
Conflicts of Interest: The authors declare that they have no conflicts of interest to report regarding the present study.
1. Y. Huang and J. Chen, “Diagnosis of hepatic tumors with texture analysis in nonenhanced computed tomography images,” Journal on Academic Radiology, vol. 13, no. 6, pp. 713–720, 2006. [Google Scholar]
2. M. Yamakawa, T. Shiina, N. Nishida and M. Kudo, “Computer-aided diagnosis system developed for ultrasound diagnosis of liver lesions using deep learning,” in IEEE Int. Ultrasonics Symp. (IUS), Glasgow, UK, pp. 2330–2333, 2019. [Google Scholar]
3. K. Saito, H. Lu, H. Kim, S. Kido and M. Tanabe, “ROI-Based fully automated liver registration in multi-phase CT images,” in 18th Int. Conf. on Control, Automation and Systems (ICCAS), Pyeong Chang, Korea (Southpp. 645–649, 2018. [Google Scholar]
4. S. Ukawa, E. Okada, K. Nakamura, M. Hirata, A. Nagai et al., “Characteristics of patients with liver cancer in the BioBank Japan project,” Journal of Epidemiology, vol. 27, no. 3, pp. S43–S48, 2017. [Google Scholar]
5. X. Ruan, T. Shi, H. Chen and H. Yao, “Feature extraction and research-based on MRI image of cerebral hemorrhage,” in Int. Conf. on Computer Network, Electronic and Automation (ICCNEA), Xi'an, China, pp. 369–372, 2020. [Google Scholar]
6. O. Gloger, K. D. Tonnies, V. Liebscher, B. Kugelmann, R. Laqua et al., “Prior shape level set segmentation on multistep generated probability maps of MR datasets for fully automatic kidney parenchyma volumetry,” IEEE Transactions on Medical Imaging, vol. 31, no. 2, pp. 312–325, 2012. [Google Scholar]
7. X. Song, M. Cheng, B. Wang, S. Huang, X. Huang et al., “Adaptive fast marching method for automatic liver segmentation from CT images,” Medical Physics, vol. 40, no. 9, pp. 1–5, 2013. [Google Scholar]
8. C. Li, X. Wang, S. Eberl, M. Fulham, Y. Yin et al., “A likelihood and local constraint level set model for liver tumor segmentation from CT volumes,” IEEE Transactions on Biomedical Engineering, vol. 60, no. 10, pp. 2967–2977, 2013. [Google Scholar]
9. X. Lu, J. Wu, X. Ren, B. Zhang and Y. Li, “The study and application of the improved region growing algorithm for liver segmentation,” Optik-International Journal for Light and Electron Optics, vol. 125, no. 9, pp. 2142–2147, 2014. [Google Scholar]
10. W. Li, F. Jia and Q. Hu, “Automatic segmentation of liver tumor in CT images with deep convolutional neural networks,” Journal of Computer and Communications, vol. 3, no. 11, pp. 146–151, 2015. [Google Scholar]
11. C. Shi, Y. Cheng, F. Liu, Y. Wang, J. Bai et al., “A hierarchical local region-based sparse shape composition for liver segmentation in CT scans,” Pattern Recognition, vol. 50, pp. 88–106, 2016. [Google Scholar]
12. K. Sophia and P. Suresh, “Liver segmentation using non-linear diffusion process and region growing algorithm,” International Journal of Engineering Science, vol. 7, no. 3, pp. 5067–5070, 2017. [Google Scholar]
13. E. L. Chen, P. C. Chung, C. L. Chen, H. M. Tsai and C. I. Chang, “An automatic diagnostic system for CT liver image classification,” IEEE Transactions on Biomedical Engineering, vol. 45, no. 6, pp. 783–794, 1998. [Google Scholar]
14. A. M. Mharib, A. R. Ramli and S. Mashohor, “Survey on liver CT image segmentation methods,” Artificial Intelligence Review, vol. 37, no. 2, pp. 83–95, 2012. [Google Scholar]
15. P. Campadelli, E. Casiraghi and A. Esposito, “Liver segmentation from computed tomography scans: A survey and a new algorithm,” Artificial Intelligence in Medicine, vol. 45, no. 2–3, pp. 185–196, 2009. [Google Scholar]
16. H. Tobias and G. V. Bram, “Comparison and evaluation of methods for liver segmentation from CT datasets,” IEEE Transactions on Medical Imaging, vol. 28, no. 8, pp. 1251–1265, 2009. [Google Scholar]
17. T. Heimann, B. V. Ginneken, M. A. Styner, Y. Arzhaeva, V. Aurich et al., “Comparison and evaluation of methods for liver segmentation from CT datasets,” IEEE Transactions on Medical Imaging, vol. 28, no. 8, pp. 1251–1265, 2009. [Google Scholar]
18. W. Kuo, “Computer-aided diagnosis for feature selection and classification of liver tumors in computed tomography images,” in IEEE Int. Conf. on Applied System Invention (ICASI), Chiba, Japan, pp. 1207–1210, 2018. [Google Scholar]
19. K. Mala and V. Sadasivam, “Classification of fatty and cirrhosis liver using wavelet-based statistical texture features and neural network classifier,” International Journal of Software Informatics, vol. 4, no. 2, pp. 151–163, 2010. [Google Scholar]
20. B. Vijayalakshmi and B. Subbiah, “Classification of CT liver images using local binary pattern with Legendre moments,” Current Science, vol. 110, no. 4, pp. 25, 2016. [Google Scholar]
21. C. H. Cheng and L. Y. Wei, “Rough classifier based on region growth algorithm for identifying liver CT image,” Journal of Applied Science and Engineering, vol. 19, no. 1, pp. 65–74, 2016. [Google Scholar]
22. R. Hameed and S. Kumar, “Assessment of neural network-based classifiers to diagnose focal liver lesions using CT images,” Procedia Engineering, vol. 38, pp. 4048–4056, 2012. [Google Scholar]
23. G. M. Xian, “An identification method of malignant and benign liver tumors from ultrasonography based on GLCM features and fuzzy SVM,” Experts System with Applications, vol. 37, pp. 6737–6741, 2010. [Google Scholar]
 | This work is licensed under a Creative Commons Attribution 4.0 International License, which permits unrestricted use, distribution, and reproduction in any medium, provided the original work is properly cited. |