DOI:10.32604/csse.2022.027005
| Computer Systems Science & Engineering DOI:10.32604/csse.2022.027005 | |
| Article |
Improved Density Peaking Algorithm for Community Detection Based on Graph Representation Learning
1Guangxi Key Laboratory of Embedded Technology and Intelligent System, Guilin, 541006, Guangxi, China
2School of Information Science and Engineering, Guilin University of Technology, Guilin, 541006, Guangxi, China
3Department of Computer Science, Middlesex University, London
*Corresponding Author: Xiaolan Xie. Email: 237290696@qq.com
Received: 08 January 2022; Accepted: 23 March 2022
Abstract: There is a large amount of information in the network data that we can exploit. It is difficult for classical community detection algorithms to handle network data with sparse topology. Representation learning of network data is usually paired with clustering algorithms to solve the community detection problem. Meanwhile, there is always an unpredictable distribution of class clusters output by graph representation learning. Therefore, we propose an improved density peak clustering algorithm (ILDPC) for the community detection problem, which improves the local density mechanism in the original algorithm and can better accommodate class clusters of different shapes. And we study the community detection in network data. The algorithm is paired with the benchmark model Graph sample and aggregate (GraphSAGE) to show the adaptability of ILDPC for community detection. The plotted decision diagram shows that the ILDPC algorithm is more discriminative in selecting density peak points compared to the original algorithm. Finally, the performance of K-means and other clustering algorithms on this benchmark model is compared, and the algorithm is proved to be more suitable for community detection in sparse networks with the benchmark model on the evaluation criterion F1-score. The sensitivity of the parameters of the ILDPC algorithm to the low-dimensional vector set output by the benchmark model GraphSAGE is also analyzed.
Keywords: Representation learning; data mining; low-dimensional embedding; community detection; density peaking algorithm
Network data has become one of the common data structures in our daily life, and community detection is an important part of data mining in networks. In the networks data formed by data nodes, the nodes inside the community are more closely connected than the nodes outside the community. The community structure is defined as the interconnection of a collection of graph-like node data in the real sense. The main purpose of community detection is to uncover the community information hidden in the complex network data structure. With the development of big data and the Internet, the variety and quantity of network data are growing rapidly, so it also poses a challenge to community detection in network data structures. Community detection based on graph structure is of great relevance, and existing network data is used in recommender systems [1,2], protein interaction networks [3], paper citation networks [4], aviation fields [5], and Social Network [6]. For example, the potential effects of drugs are analyzed by targeted drug graphs, and recommendation systems are constructed by user-commodity purchase information.
Networks are usually represented as adjacency matrices, which can effectively carry a large amount of edge connectivity information in graph data structures. However, with the explosion of existing data growth, The size of graph data is increasing and the number of nodes on the graph is also increasing. The classical community detection algorithm is out of its capacity. Moreover, the adjacency matrix formed by the existing network data suffers from the problem of sparse edges and a large number of nodes. Many existing classical community detection methods have also been applied on a large scale [7], including label propagation-based algorithms [8,9], clustering-based algorithms [10,11], based on group intelligence [12], etc. Raghavan proposed label propagation algorithm (LPA) as a label propagation-based algorithm that combines the label of each node with the label information of neighboring nodes to update. Lan et al. [13] combined the density peaking algorithm with Community detection and used the shortest path between two points of the graph to achieve label assignment and propagation. However, for these large-scale sparse networks, there are problems such as high complexity and poor results with the traditional classical Community detection methods. This poses a challenge for data mining with graph types. The graph embedding representation provides a solution to the above problems. Graph embedding is a method to map the associated data of a graph to a dense data processing method such as vector space that can be efficiently processed by machine learning so that the structural information of the graph can be preserved as much as possible to meet the data input requirements of downstream tasks.
The DeepWalk model proposed by Perozzi et al. [14] integrates the idea of natural language processing into the network data structure by a series of sequences formed by the random wandering of nodes to encode the structure of the network data and then uses neural networks to train the graph representation learning. Line [15], Nallusamy proposes an enhanced algorithm to solve the community detection problem in social networks [16]. a graph embedding framework based on first-order similarity and second-order similarity was proposed in 2015 to provide a solution for the embedding representation idea of large-scale network data. Graph convolution Network(GCN) [17] was proposed to provide a new idea for graph representation learning, which takes the Laplacian matrix of the graph containing graph topological structure information as the input of the graph information, and the first-order approximation of the graph is obtained by spectral graph convolution. The vector representation of the network node data is obtained through a series of activation functions. However, this approach relies on the global information of the graph. Hamilton proposed an inductive large graph representation method GraphSAGE [18], which obtains the final vector representation of the nodes by randomly sampling the nodes as well as aggregating the information of the neighboring nodes by the function. The aggregation based on the neighbor node information can effectively map the low-dimensional vector representation of the graph structure, and the topological information of the network structure is preserved as much as possible, providing a prior for community detection of large dense graphs. In dealing with the learning of network representations of graphs, the field of deep learning demonstrates powerful node representation capabilities. It can adapt to different shapes of network structured data.
Therefore, this paper uses GraphSAGE unsupervised representation learning for the specific task of community detection, combined with an improved density peaking algorithm for community detection. The model is able to make full use of the adjacency information of graph nodes and fuse the first-order and second-order similarities of nodes to obtain a vector representation of graph nodes on a low-dimensional space. The adjacency matrix of the graph is first mapped to the low-dimensional vectors by GraphSAGE, and then the community detection is implemented using the improved density peaking algorithm to obtain the appropriate class clusters. The algorithm proposed in this paper can solve the community detection problem with attributed graph data, and in order to verify the adaptation performance of the improved density peaking algorithm proposed in this paper on the community detection task. Experiments show that the algorithm verifies the effectiveness of the proposed model on the evaluation metric F1-score.
2 Community Detection Based on GraphSAGE Graph Representation Learning with Improved Density Peaks
Graph representation learning provides new ideas in solving the feature representation of graphs, and the GraphSAGE graph representation learning demonstrates unimpressive performance. For a graph defined as G = {v,ε}, where v consists of data sets xi ∈ {x1, x2, x3 … xn} consisting of n with the value of |v| and ε the set of edges of the graph G. Using the adjacency matrix of the graph as input, the appropriate loss function is built to train the parameters of the convolutional layer to map the input onto a dense low-dimensional vector space.
2.1 General Framework Architecture
Given a dataset G = {v,ε}, the topology of the network dataset can be represented by an adjacency matrix. The adjacency matrix is provided as input to the model, the nodes are gradually represented as low-dimensional vectors through multi-layer convolution and nonlinear activation functions. In the GraphSAGE model, it uses positive and negative sampling to achieve unsupervised learning of the graph using its own structural information, makes full use of the information of neighboring nodes, and fuses first-order similarity and second-order similarity to achieve low-dimensional vector mapping of the graph structure. The overall framework is shown in Fig. 1.
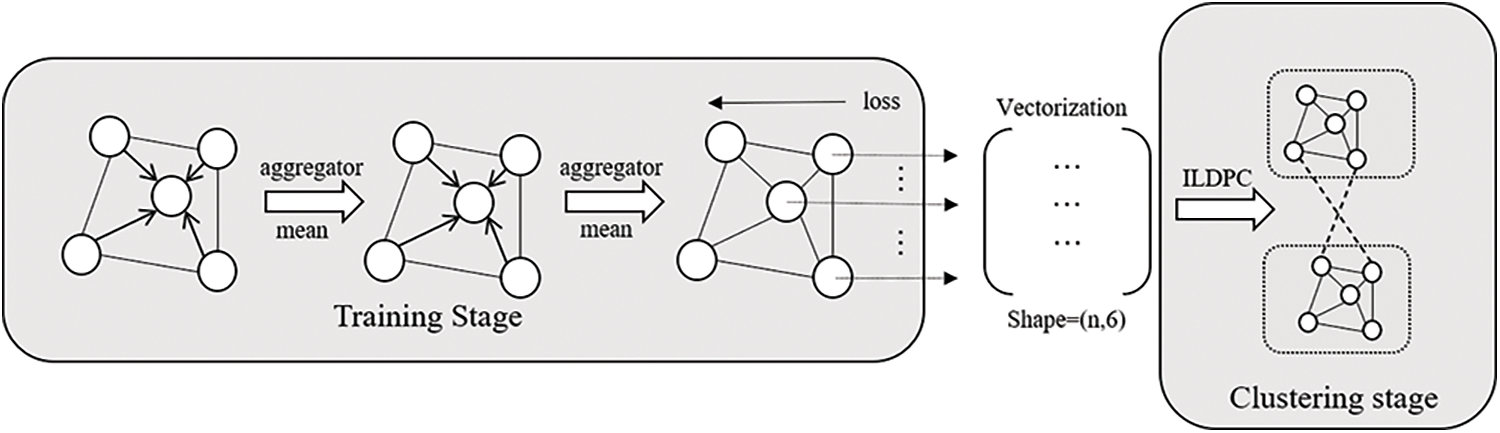
Figure 1: Framework process architecture diagram
The framework proposed in this paper consists of two main phases: the first phase is the training phase, where each node is mapped to a highly nonlinear space by aggregating the information of its neighboring nodes and then input to the next layer of convolution. A series of positive and negative nodes are taken using node-positive and negative sampling, finally, the parameters of the model are updated by backpropagation through the training of the loss function, and the model is able to map the graph data to a low-dimensional vector space. And the representation of low-dimensional vectors has features such as aggregation and community. The second stage is clustering, where the graph embedded vector data output from the first stage model is further clustered to complete the community detection task of the network data. In this paper, an improved local density peak clustering algorithm is proposed to solve the downlink assignment problem generated in the first stage, which can effectively fuse the global information of the graph and complete the community detection.
2.2 Representation Learning of Graphs
The low-dimensional vector embedding of graphs can be represented as an unsupervised learning problem for graphs, where the nodes in the complex data of the graph are first sampled, and then the model represents the nodes as vectors in the form of outputs.
In the preparation phase of the data, the attributes of the graph nodes are first normalized. In order to better find the optimal solution of the model, solve the problem of long training time of the model and speed up the convergence of the model. The forward propagation of the graph data structure is propagated to the next layer by the aggregation of the neighboring nodes of nodes. In order to consider the computational efficiency of the model, GraphSAGE uses random sampling of the neighboring nodes of the current node and achieves propagation by aggregating the information of the neighboring nodes. The propagation method used in this paper is expressed by Eq. (1).
where v represents the current node and N(v) represents the set of neighboring nodes of the current node. k is the current number of convolution layers and {hvk − 1} represents a set which is the current value of the node v at the layer k − 1. {huk − 1} also represents a set which is the value of the neighboring nodes of node v. The MEAN function represents the averaging operation for the values in the set. The function aggregates the values of the neighbor nodes u ∈ N(v) of the aggregated node v by each layer and outputs hvk by the activation function.
In this paper, the output values are mapped to the nonlinear space using a modified linear unitary relu activation function, expressed by Eq. (2).
The low-dimensional vector embedding of the graph first samples the nodes in the graph complex data in the input network data for positive and negative nodes to train the loss function, respectively. The cross-entropy loss function is.
where yi denotes i as the label value and pi is the forward propagation output value of data i.
Inspired by the cross-entropy function, the graph complex network is analyzed. The loss function for backpropagation in the network is designed to be able to retain similar vector features for nodes that are adjacent or close to each other and to differentiate as much as possible for nodes that are far apart. The sampled node itself and its neighboring nodes are used as positive samples, while the negative samples are collected by random sampling of random wanderings on the graph. The positive and negative nodes and the sampled nodes are then propagated forward to achieve a low-dimensional feature representation of the graph.
The loss function for representation learning using the GraphSAGE framework in this paper is expressed by Eq. (4).
where zv denotes the vector representation output by the sampled node after forwarding propagation, zpos denotes the vector representation output by the positive sample after forwarding propagation, and zneg is the vector representation output by the negative sample after forwarding propagation.
In this paper, the W-weight parameters in the model are updated using the adaptive moment estimation (Adam) optimizer. A low-dimensional representation of each node is constructed, and the backpropagation of the model is achieved using the loss function proposed in Eq. (4).
The density peaks algorithm clustering by fast search and find of density peaks(DPC) [19] is able to automatically discover nodes with high local density and cluster clusters of arbitrary shape due to the mechanism of local density. In comparison with algorithms such as K-means, DPC overcomes the problem of poor performance metrics on non-convex data sets. It is more applicable to vectors that go through the low-dimensional embedding of the model. The algorithm is based on two assumptions: (1) the density of class cluster centroids is maximum compared to the density of its surrounding data points; (2) for different class cluster centers are always far apart. By analyzing the distance values between each low-dimensional vector xi ∈ {x1, x2, x3 ….. .xn} with the distance values between other low-dimensional vectors, and then calculating the local density ρ of each low-dimensional vector xi, and finally completing the decision map. The local density parameter of each data point is defined as
Where dij is the Euclidean distance between data point xi and data point xj, and d is the truncation distance. χ (x) is the logical judgment function, x < 0, χ (x) = 1, otherwise χ (x) = 0. Usually, 1%–2% of the sample size of the whole data set is chosen as the truncation distance d. The overall flow chart of the density peak algorithm is shown in Fig. 2.
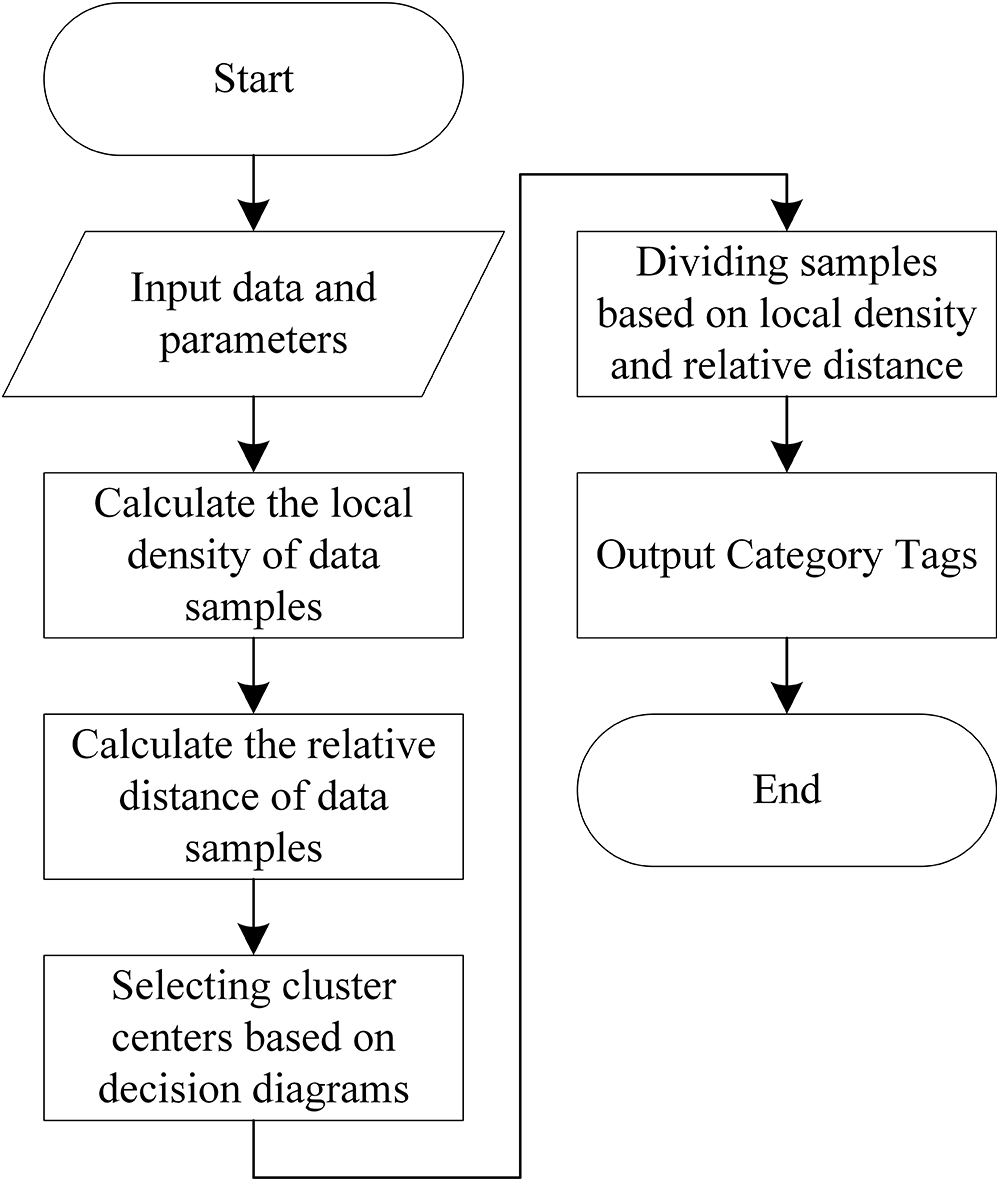
Figure 2: DPC algorithm flow chart
The centroids of the class clusters are selected by calculating the local density ρi of each data point and the minimum distance value δ of the points that are denser than their densities. then the centroids of the class clusters are selected by drawing a decision map. The algorithm can also manually select the cluster centroids by calculating the decision values to select the data points with large local densities ρi and large minimum distance values δ for the data points as centroids. After finding the cluster centroids, the nodes closest to the cluster centroids are assigned the same labels to complete the clustering task.
The ILDPC proposed in this paper is an improvement of the local density in the DPC algorithm so that it can be adapted to large-scale low-dimensional dense data sets. As shown in Fig. 3, the local density in the DPC algorithm only counts the number of data within the truncation distance d and ignores the effect of the distance between data points within the truncation distance d on the local density, which leads to the wrong class of cluster centroids being selected.
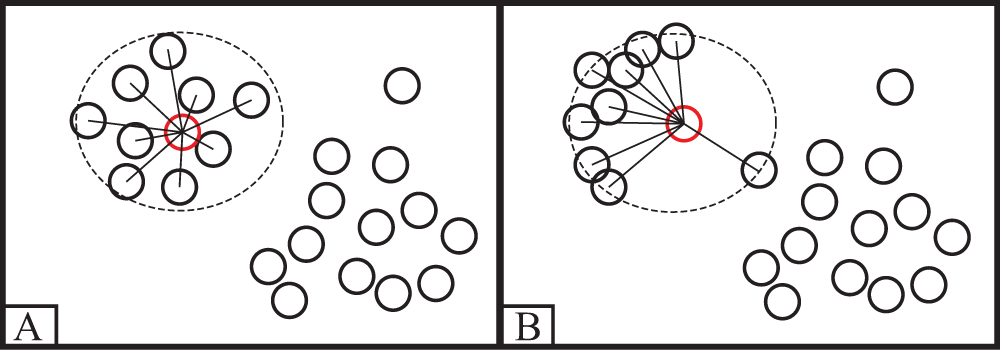
Figure 3: Example of error selection class cluster centroid
To solve the above problem, the boundaries of class clusters in the dataset can be better separated by the algorithm. For each low-dimensional vector xi ∈ {x1, x2, x3 ….. .xn} in data point xi, the sum of distances ri from data points within the truncation distance of data point xi to data point xi in this algorithm is shown in Eq. (6).
Thus the improved local density Pi corresponding to each data point is defined as shown in Eq. (7).
The improved local density in ILDPC first calculates the number of data points within the data point truncation distance, Then calculate the sum of the distances from the data points to xi within the truncation distance of data point xi, because the data points in the class cluster are more closely connected to each other, the points around the center of the class cluster are closer together and their sum of distance ri is smaller, while the incorrectly selected centroids have a larger sum of distance ri. The improved local density relies more on the localization among the data, and the correct centroids are more locally dense compared to the incorrect centroids and can therefore be selected. The improved local density improves the differentiation between sample class clusters, which in turn has better adaptability to handle large-scale dense data.
For the whole community detection After obtaining the low-dimensional vector embedding of the nodes using the GraphSAGE framework, it is then necessary to classify the nodes with a suitable clustering algorithm for the low-dimensional vectors embedded in the network data. The result of the clustering algorithm at this point can reflect the performance of the whole model and can also represent the goodness of the whole community detection task. In this paper, we use the F1-score, which is the sum of the average of precision and recall, as a common metric for evaluating clustering to measure the community detection results with labeled network data. Precision is defined as.
The recall is defined as.
The specific F1-score formula is defined as.
Precision is defined as the proportion of positive samples among those with positive predictions. The recall is defined as the proportion of positive samples among all samples with positive predictions. TP is the number of samples judged to be positive and labeled as positive, FP is the number of samples judged to be positive and labeled as negative, and FN is the number of samples judged to be negative and labeled as positive
4 Experimental Design and Analysis
4.1 Introduction to the Dataset
This paper explores community detection methods for unsupervised clustering on complex graph data structures. Also to verify the effectiveness of the proposed method in this paper, experiments are conducted on the datasets Cora, Computer [20], and PubMed [21]. The Cora dataset is real-world article citation network data, with 2708 papers selected for citation analysis, reflecting the network information embedded in the real world. The PubMed dataset is derived from the analysis of 19717 published articles on diabetes in the PubMed database, which has also been used several times for experimental testing of various benchmark network datasets. the Computer dataset is derived from Amazon computer product information purchase information, where the nodes represent computer goods information and the edges represent goods often sold together. These datasets have been widely used in testing various baseline models and community detection algorithms. The basic information of the datasets used in this paper is shown in Tab. 1.

In order to verify the effectiveness of community detection, the experimental design of GraphSAGE is combined with the downstream tasks K-means, DPC, and this algorithm ILDPC The DPC and the present algorithm ILDPC algorithm belong to the density clustering algorithm. In order to ensure the fairness of the experimental results, the best experimental results are generated by comparing the comparative analysis of each algorithm on large sparse graph datasets, and the parameters are selected several times in this paper. In the graph representation learning phase, the attribute values of the dataset are first normalized, and then the training of the model begins. The model parameters are set as follows: lr = 0.008, batch_size = 256, layer_size = 2. Each aggregation operation performs positive and negative sampling on the graph for a total of 64 edges. The model sets layer_size to 2 and the dimensions of the output vector to 10. Each layer of the model incorporates information about the neighboring nodes of the training nodes to achieve a low-dimensional vector embedding representation of the nodes.
4.2 Analysis of the Clustering Experiment Process
In this paper, we use micro-averaged F1-scores (Micro-F1) to measure the experimental results; the larger this metric is, the more desirable the results are. This also indicates that good preservation of network topology information was maintained in the upstream task of the experiment. The experiments were carried out on datasets with Cora, Computer and PubMed attributes. A low-dimensional embedding representation of the node vectors is accomplished by training the model parameters so that the network data can distinguish as much as possible between nodes that are far away from each other and nodes that are close to each other. Then the node classification of the embedded node vectors is performed to complete the community detection task. Different clustering algorithms have different performances on the community detection problem, and to illustrate the adaptability of the ILDPC algorithm on the community detection task.
The algorithm is compared with different clustering algorithms applied on the community detection task to verify the adaptability of the algorithm on community detection. The training process of the above dataset on using different clustering algorithms is shown in Fig. 4. The clustering effect of the ILDPC algorithm is demonstrated as the model is trained and the loss values are reduced. The highest unsupervised community detection effect reaches 56% on the Cora dataset and 68% on the PubMed dataset. The experimental results show that the network embedding-based and ILDPC algorithms can better perform the community detection task.
It can be seen that the ILDPC algorithm paired with the community detection task achieved good results. As can be seen from Fig. 4, both the present algorithm and the DPC algorithm are able to adapt to the community detection task at the stage where the network is being trained. However, the metrics of this algorithm are more effective compared to the metrics developed by the DPC algorithm. As the loss decreases, the clustering metrics basically show an increasing trend. At the same time, the K-means algorithm could not show good adaptability on the community detection task during the training process. At the same time, most of these datasets cannot be handled by traditional community detection algorithms as well as the presence of edge sparsity. This shows that the algorithm has good performance in handling graph datasets. It can also illustrate the adaptability of the density peaking algorithm to the community detection task.

Figure 4: Performance comparison of different algorithms on network embedding
In this section, decision diagrams are required in the DPC algorithm to select the density peak points. the proposed ILDPC algorithm is better able to find the data points with density peaks. In this paper, the last epoch is selected to complete the decision diagram. As shown in Fig. 5, the DPC algorithm is weaker in finding the density peak points compared to the ILDPC algorithm. This proves that the distance within the truncation distance cannot be ignored when calculating the local density. The role of the distance within the truncation distance can be effectively adapted to the network embedding algorithm. Moreover, the ILDPC algorithm is more suitable for data with unclear shapes and more suitable for subsequent cluster detection by network embedding. And the performance will be more stable when choosing the density peak point

Figure 5: Comparison of decision diagrams
The proposed method in this paper can effectively handle large-scale network structure data and community detection tasks after upstream tasks.
4.3 Experimental Parameters Analysis
To further determine the impact of experimental parameters in the ILDPC algorithm on the community detection task and the validity of the experimental results. This section explores the effect of the choice of different truncation distances on the clustering results on three datasets Cora, Computer, and PubMed.
The DPC algorithm and the ILDPC algorithm require only one truncation distance in the choice of parameters. However, in the clustering task dealing with large-scale data sets, the choice of truncation distance is associated with the cluster centroids and the clustering results are sensitive to the choice of truncation distance. From the experimental results, it is shown that the truncation distance is usually chosen between 1% and 2% of the total number of vectors to achieve the best results. The network embedding vectors output by the network embedding model can effectively distinguish the community structure and map the node vectors from high-dimensional to low-dimensional dense spaces. Good results are achieved in the downstream task of improving density peak clustering. As shown in Fig. 6, the clustering metrics show a decreasing trend as the truncation distance increases. the performance of the Cora dataset decreases significantly with increasing truncation distance, and the boundaries in the community are not clearly found. In the PubMed dataset, the best results were obtained by taking 4% and 5% of the total number of vectors in the dataset for the truncation distance. However, the overall trend is still slowly decreasing. When the truncation distance is too large, this will lead to an excessive density of each node as proposed in Eq. (7) and will not distinguish the density peak nodes, which in turn affects the clustering performance. This indicates that the truncation distance selected using the density peaking algorithm for processing large community detection tasks only needs to select about 1% of the total number of nodes to achieve the desired results.

Figure 6: Effect of truncation distance on clustering results
In this paper, the community detection task is carried out for each of the three datasets by different algorithms. To ensure a fair comparison of the experiments, repeated experiments are conducted by selecting the best parameters, and the best results are taken for the experimental test results. The performance of the proposed ILDPC algorithm combined with network representation learning on the community detection task is verified by comparing different algorithms. The F1-score values of the different algorithms on the dataset are shown in Fig. 4. The experimental results show that the ILDPC algorithm absorbs the advantages of the DPC algorithm and can be better adapted to the community detection task compared to the K-means and DPC algorithms. Meanwhile, the K-means algorithm performs poorly in non-convex cluster identification, as seen in the data in Fig. 4, and better results can be obtained on the PubMed dataset. But the performance is not as good on the other two datasets. The improved algorithm in this paper can better explore the low-dimensional dense vector data features that have been output by the model. In addition, the ILDPC algorithm considers the information of neighboring nodes in label assignment and relies more on the information of local distance between the data, and achieves the best results on the F1-score supervised metric in the community detection task compared with the other two algorithms. This indicates to some extent that the improved algorithm can effectively adapt to the node vectors of reconstructed dimensions output in the upstream task.
In most cases, especially when the adjacency matrix is sparse, classical community detection algorithms are difficult to perform this task effectively on network data. The framework proposed in this paper can effectively adapt to network data and can essentially accomplish the community detection task. In the first stage of the model, the output node vectors are fused with the surrounding information to obtain the node clustering information and node neighbor information. Therefore, the output node low-dimensional vector representation maintains the community structure information to facilitate clustering information mining.
In this paper, we propose a GraphSAGE graph representation learning-based community detection algorithm with an improved density peaking algorithm. The algorithm maps embeddable low-dimensional large-scale graph datasets into dense low-dimensional vectors by GraphSAGE, and preserves the original topological information of the graph for representation learning. Based on this, the ILDPC algorithm is proposed in this paper, which can adapt the large-scale dense vectors to the dense vectors embedded in the model output and complete the community detection. Comparing the decision diagrams drawn by the ILDPC algorithm and the DPC algorithm, it is found that the density peak points in the data can be more accurately selected by the ILDPC algorithm and are more adaptive to the vectors completed by the embedding. Finally, by comparing three sets of real attribute data with K-means and DPC algorithms, The F1-score metric shows that the algorithm can effectively combine the attributes of embedded nodes and the local density of nodes to detect community centroids and complete community detection of network data.
Funding Statement: The National Natural Science Foundation of China (No.61762031), The Science and Technology Major Project of Guangxi Province (NO.AA19046004), The Natural Science Foundation of Guangxi (No.2021JJA170130).
Conflicts of Interest: The authors declare that they have no conflicts of interest to report regarding the present study.
1. P. Kazienko, K. Musial and T. Kajdanowicz, “Multidimensional social network in the social recommender system,” IEEE Transactions on Systems, Man, and Cybernetics-Part A: Systems and Humans, vol. 41, no. 4, pp. 746–759, 2011. [Google Scholar]
2. C. R. Yang, R. J. Bu, Y. Kang, Y. C. Zhang, H. Li et al., “An importance assessment model of open-source community java projects based on domain knowledge graph,” Journal on Big Data, vol. 2, no. 4, pp. 135–144, 2020. [Google Scholar]
3. G. Wu, X. Feng and L. Stein, “A human functional protein interaction network and its application to cancer data analysis,” Genome Biology, vol. 11, no. 5, pp. 1–23, 2010. [Google Scholar]
4. J. D. West, I. Wesley-Smith and C. T. Bergstrom, “A recommendation system based on hierarchical clustering of an article-level citation network,” IEEE Transactions on Big Data, vol. 2, no. 2, pp. 113–123, 2016. [Google Scholar]
5. H. He, Z. Zhao, W. Luo and J. Zhang, “Community detection in aviation network based on k-means and complex network,” Computer Systems Science and Engineering, vol. 39, no. 2, pp. 251–264, 2021. [Google Scholar]
6. F. Amin, J. Choi and G. S. Choi, “Advanced community identification model for social networks,” Computers Materials & Continua, vol. 69, no. 2, pp. 1687–1707, 2021. [Google Scholar]
7. U. N. Raghavan, R. Albert and S. Kumara, “Near linear time algorithm to detect community structures in large-scale networks,” Physical Review E, vol. 76, no. 3, pp. 036106, 2007. [Google Scholar]
8. Q. Gui, R. Deng, P. Xue and X. Cheng, “A community detection algorithm based on boundary nodes and label propagation,” Pattern Recognition Letters, vol. 109, no. 12, pp. 103–109, 2018. [Google Scholar]
9. W. Liu, X. Jiang, M. Pellegrini and X. Wang, “Discovering communities in complex networks by edge label propagation,” Scientific Reports, vol. 6, no. 1, pp. 1–10, 2016. [Google Scholar]
10. C. Shi, Y. Cai, D. Fu, Y. Dong and B. Wu, “A link clustering based overlapping community detection algorithm,” Data & Knowledge Engineering, vol. 87, no. 1, pp. 394–404, 2013. [Google Scholar]
11. X. Ma, H. Lu, Z. Gan and J. Zeng, “An explicit trust and distrust clustering based collaborative filtering recommendation approach,” Electronic Commerce Research and Applications, vol. 25, no. 6, pp. 29–39, 2017. [Google Scholar]
12. P. Mei, G. Ding, Q. Jin, F. Zhang and Y. Chen, “Reconstruction and optimization of complex network community structure under deep learning and quantum ant colony optimization algorithm,” Intelligent Automation & Soft Computing, vol. 27, no. 1, pp. 159–171, 2021. [Google Scholar]
13. L. Huang, G. Wang, Y. Wang, W. Pang and Q. Ma, “A link density clustering algorithm based on automatically selecting density peaks for overlapping community detection,” International Journal of Modern Physics B, vol. 30, no. 24, pp. 1650167, 2016. [Google Scholar]
14. B. Perozzi, R. Al-Rfou and S. Skiena, “Deepwalk: Online learning of social representations,” in Proc. of the 20th ACM SIGKDD Int. Conf. on Knowledge Discovery and Data Mining, USA, pp. 701–710, 2014. [Google Scholar]
15. J. Tang, M. Qu, M. Wang, M. Zhang, J. Yan et al., “Line: Large-scale information network embedding,” in Proc. of the 24th Int. Conf. on World Wide Web, Florence, Italy, pp. 1067–1077, 2015. [Google Scholar]
16. K. Nallusamy and K. S. Easwarakumar, “Cgram: Enhanced algorithm for community detection in social networks,” Intelligent Automation & Soft Computing, vol. 31, no. 2, pp. 749–765, 2022. [Google Scholar]
17. T. N. Kipf and M. Welling, “Semi-supervised classification with graph convolutional networks,” 2016. [Online]. Available: https://arxiv.org/abs/1609.02907. [Google Scholar]
18. W. L. Hamilton, R. Ying and J. Leskovec, “Inductive representation learning on large graphs,” in Proc. of the 31st Int. Conf. on Neural Information Processing Systems, USA, pp. 1025–1035, 2017. [Google Scholar]
19. A. Rodriguez and A. Laio, “Clustering by fast search and find of density peaks,” Science, vol. 344, no. 6191, pp. 1492–1496, 2014. [Google Scholar]
20. Z. Yang, W. Cohen and R. Salakhudinov, “Revisiting semi-supervised learning with graph embeddings,” in Int. Conf. on Machine Learning, New York City, NY, USA, pp. 40–48, 2016. [Google Scholar]
21. P. Sen, G. Namata, M. B. Ilgic, L. Getoor, B. Galligher et al., “Collective classification in network data,” AI Magazine, vol. 29, no. 3, pp. 93, 2008. [Google Scholar]
 | This work is licensed under a Creative Commons Attribution 4.0 International License, which permits unrestricted use, distribution, and reproduction in any medium, provided the original work is properly cited. |