DOI:10.32604/csse.2023.022385
| Computer Systems Science & Engineering DOI:10.32604/csse.2023.022385 | |
| Article |
Skin Lesion Classification System Using Shearlets
Department of Computer Science and Engineering, Meenakshi Academy of Higher Education and Research, Chennai, 600078, Tamil Nadu, India
*Corresponding Author: S. Mohan Kumar. Email: s.mohankumar.phd@gmail.com
Received: 05 August 2021; Accepted: 09 October 2021
Abstract: The main cause of skin cancer is the ultraviolet radiation of the sun. It spreads quickly to other body parts. Thus, early diagnosis is required to decrease the mortality rate due to skin cancer. In this study, an automatic system for Skin Lesion Classification (SLC) using Non-Subsampled Shearlet Transform (NSST) based energy features and Support Vector Machine (SVM) classifier is proposed. At first, the NSST is used for the decomposition of input skin lesion images with different directions like 2, 4, 8 and 16. From the NSST’s sub-bands, energy features are extracted and stored in the feature database for training. SVM classifier is used for the classification of skin lesion images. The dermoscopic skin images are obtained from PH2 database which comprises of 200 dermoscopic color images with melanocytic lesions. The performances of the SLC system are evaluated using the confusion matrix and Receiver Operating Characteristic (ROC) curves. The SLC system achieves 96% classification accuracy using NSST’s energy features obtained from 3rd level with 8-directions.
Keywords: Skin lesion classification; non-subsampled shearlet transform; sub-band coefficients; energy feature; support vector machine
The unusual skin growth identifies the growth of skin cancer. The skin cancer looks like rash, irregular patch, nodule at the surface of the skin. The affected part may bleed easily. It spreads to other parts of the body easily and sometimes it leads to death. Multiclass SVM and Gray Level Co-occurrence Matrix (GLCM) based skin cancer classification is discussed in [1]. GLCM features like energy, contrast, homogeneity and entropy are extracted at first. Then multiclass SVM is used for the prediction of skin cancer. Non-Subsampled Contourlet Transform (NSCT) and bayes classification based melanoma image classification is described in [2]. The melanoma image is given to NSCT for decomposition and Bayes classifier is used for output prediction.
The detection and classification of skin lesions using dermoscopy images is discussed in [3]. At first, the dermoscopic images are given to median filter to remove hair, and then k-means clustering algorithm is used for segmentation. From the segmented image, color, texture and sub-region features are extracted. Wilkis Lambda method is used for feature selection. The prediction is made by SVM. SVM based skin cancer classification and detection is described in [4]. The input skin cancer images are converted to gray scale in the preprocessing stage and region of interest is extracted. Then, the border, asymmetry, diameter and circularity features are extracted. The redundant features are reduced by using principal component analysis. Finally, SVM is used to predict the output.
An early melanoma classification system is discussed in [5] using different color space. GLCM features like contrast, sum variance, average, autocorrelation, sum variance and average are extracted. The final prediction is made by SVM. Classification and segmentation of melanoma skin cancer images is discussed in [6] using k-means clustering approach. From the input melanoma skin images, features such as diameter, border, circularity and asymmetric features are extracted. The feature selection and dimension reduction are made by Relief algorithm. The classifiers like SVM, Decision Tree (DT) and K-Nearest Neighbor (KNN) are used.
Melanoma skin cancer classification and detection based on unsupervised and supervised learning is described in [7]. The input image is converted into grayscale and then median filter is applied in the pre processing stage. The thresholding method and k-means methods are used for segmentation. Then, the segmented images are decomposed by wavelet transform [8]. Finally, SVM is used for prediction. Skin cancer classification approach in [9] uses k-means technique for skin lesion segmentation. Features are extracted by local binary pattern and color coherence vector. The classification is made by using multiclass SVM.
Analysis of skin lesion fro skin cancer diagnosis is discussed in [10]. After resizing the input image, it is converted into grayscale. The edges are detected by using thresholding and morphological operations. Features such as perimeter, area circularity and irregularity index are extracted. KNN is used to predict the skin cancer. The system in [11] uses segmentation and classification approaches for skin cancer diagnosis. Initially, the images are enhanced and then Gaussian filter is used to smooth the image. Morphological operation is used to segment the lesion. Features like texture, color and histogram features are used and the prediction is made by SVM and KNN.
Deep learning and Gabor wavelet based skin cancer classification is discussed in [12]. The skin images are classified by using Gabor filter based CNN wavelet coefficient. The AlexNet and ResNet based Gabor filter is used for prediction. An efficient system for skin cancer diagnosis is described in [13]. At first, the contrast of the skin images are enhanced. The automatic thresholding technique is applied to red, green and blue color channels independently to create the binary mask. The large blob is identified and the edges are detected inside the blob. The extracted geometric features are used for the classification.
Melanocytic lesion classification using dermoscopic images is discussed in [14]. At first, the dermoscopic images are segmented using thresholding technique. The statistical features are extracted and DT classifier is used for classification. Multiwavelet based melanoma classification system is discussed in [15]. The input dermoscopic images are given to wiener filter to remove noise. Then multiwavelet transform is used for decomposition that produces sub band coefficients. The statistical features like mean, standard deviation, skewness and kurtosis are extracted and final prediction is made by SVM classifier.
In this study, an efficient SLC system using NSST based energy feature is proposed. The paper is organized as follows: Methods and materials used for SLC system is discussed in Section 2. Section 3 discusses the obtained results of the SLC system on PH2 database images. The final section concludes the SLC system.
Shearlet transform is a multi-scale and multi-directional framework that can be applied to a variety of problems. Anisotropic properties are found in it. As a result, they have the capacity to identify directionality, which is an advantage over the conventional wavelet transform. Shearlet is a useful tool for efficiently handling such a wide variety of data and a large volume. In contrast to standard multi-scale transform, NSST has the benefit of being shift invariant. NSST’s computational complexity is lower than that of NSCT.
In the proposed system, energy features are extracted from the NSST’s sub-bands. The overall workflow of SLC system based on NSST and SVM is shown in Fig. 1. In SLC system input melanoma images are given to NSST for decomposition with different directions (2, 4, 8 and 16) and it produces sub-bands. From these NSST’s sub-bands, energy features are extracted and stored in feature database. Finally, classification is made by using SVM classifier.

Figure 1: Block diagram of SLC system
The set of well-localized waveforms at different locations, orientations and scales are formed by Shearlets. The thin support of Shearlet is increased by higher scaling. The large of oriented trapezoids are present in Shearlet when compared to contour let and curvelet. It is constructed by using some generating functions like translation, shearing and parabolic scaling. It is supported by skinny and directional ridges with the parabolic scaling law in the fine scales. The orthonormal basis of H2(K2), they form a frame arbitrary function of f ∈ H2(K2).
The important property of Shearlets is that they produce sparse approximations. It has anisotropic features which are compactly support in the [0, 1]2 while being close wise singularity curve Cu2 with bounded curvature. The M2 error is a decay error. In the shearlet approximation by taking the largest shearlet coefficients in the shearlet expansion in the optimal up to a log-factor the decay error occurs.
where the Cu is the constant depends on singularity curve and magnitudes of

Figure 2: Decomposition process of NSST
In this study, the decomposition process of NSST is made level by level and different directions from 2 to 64 and also it produces different low and high frequency sub-bands. NSST is also used in other fields like multifocal image fusion and computed tomography and magnetic resonance imaging brain image fusion [17].
Three level decomposition stages using NSST are shown in Fig. 3. The high frequency components are decomposed into three levels and multiple sub-band images. Fig. 4 shows the 1st level NSST decomposition of a dermoscopic image with 4 directions. The low frequency image resembles the input image in Fig. 4 as it is the approximate version of the input image.

Figure 3: Three level decomposition using NSST

Figure 4: 1st level NSST decomposition with 4-directions
2.2 NSST Based Energy Feature Extraction
From the NSST’s sub-bands, energy features are extracted and stored in the feature database. The indication of energy is good in spatial and frequency level. Different energy distributions are available in different types of patterns in the frequency domain that can be effectively utilized for skin cancer diagnosis. The energy feature is defined by,
where SUBBAND represents the NSST’s sub-band of the dermoscopic image of size Q x R. The location of sub band coefficients is represented by (k, l). In this study, the computed energy features by Eq. (2) is used for the classification. The energy features are used in many other fields such as heart sound classification [18]. Fig. 5 shows the feature extraction stage of SLC system.

Figure 5: Feature extraction stage of SLC using NSST
It is a machine learning algorithm and commonly used for classification [19]. It can be used in multiclass and binary classification. It computes hyperplane from the feature space to separate the classes. The SVM model is a representation of the instances as points in space that are mapped such that the examples of the various categories are split by a clear separation that is as wide as feasible. New instances are then mapped into the same space and projected to fall into a category based on which side of the gap they land on. SVM hyper parameter and model parameters must be tuned in order to achieve better classification accuracy. With the kernel technique, SVMs may efficiently classify in a non-linear manner by implicitly mapping their inputs to high-dimensional feature spaces. The concept of SVM is illustrated in Fig. 6.

Figure 6: Demonstration of support vector machine
The SVM classifier is described as, let {v1, v2, v3, ….vn} is the training set of image in class V, where V ⊂ Hn. When the mapping function is ψ:V → H is the feature space. Then the equation is given by,
where k.ζ ≥ P − ζ, let l = 1, 2,…n and ζl ≥ 0. Then ζ be the slack variable, and l is the number of samples. SVM has a high dimensional in space and it is more effective. In this study, SVM classifier is used for making output decision as normal or abnormal [20]. The performance of SVM classifier is measured using classification accuracy [21]. The SVM classifier is also used in brain image classification, electrocardiogram signal classification and gender classification using iris images. The classification stage of SLC is shown in Fig. 7.

Figure 7: Classification stage of SLC using NSST
The SLC system performance is evaluated using the confusion matrix and ROC curve generated by MATLAB tool. The raw dermoscopic skin lesion images are obtained from PH2 database [22]. It consists of 200 melanocytic images with lesions. The dermoscopic image resolution is 768 × 560 pixels. The 80 normal and 120 abnormal images are used for prediction using SVM. Fig. 8 shows some of the normal and abnormal images in the PH2 database.
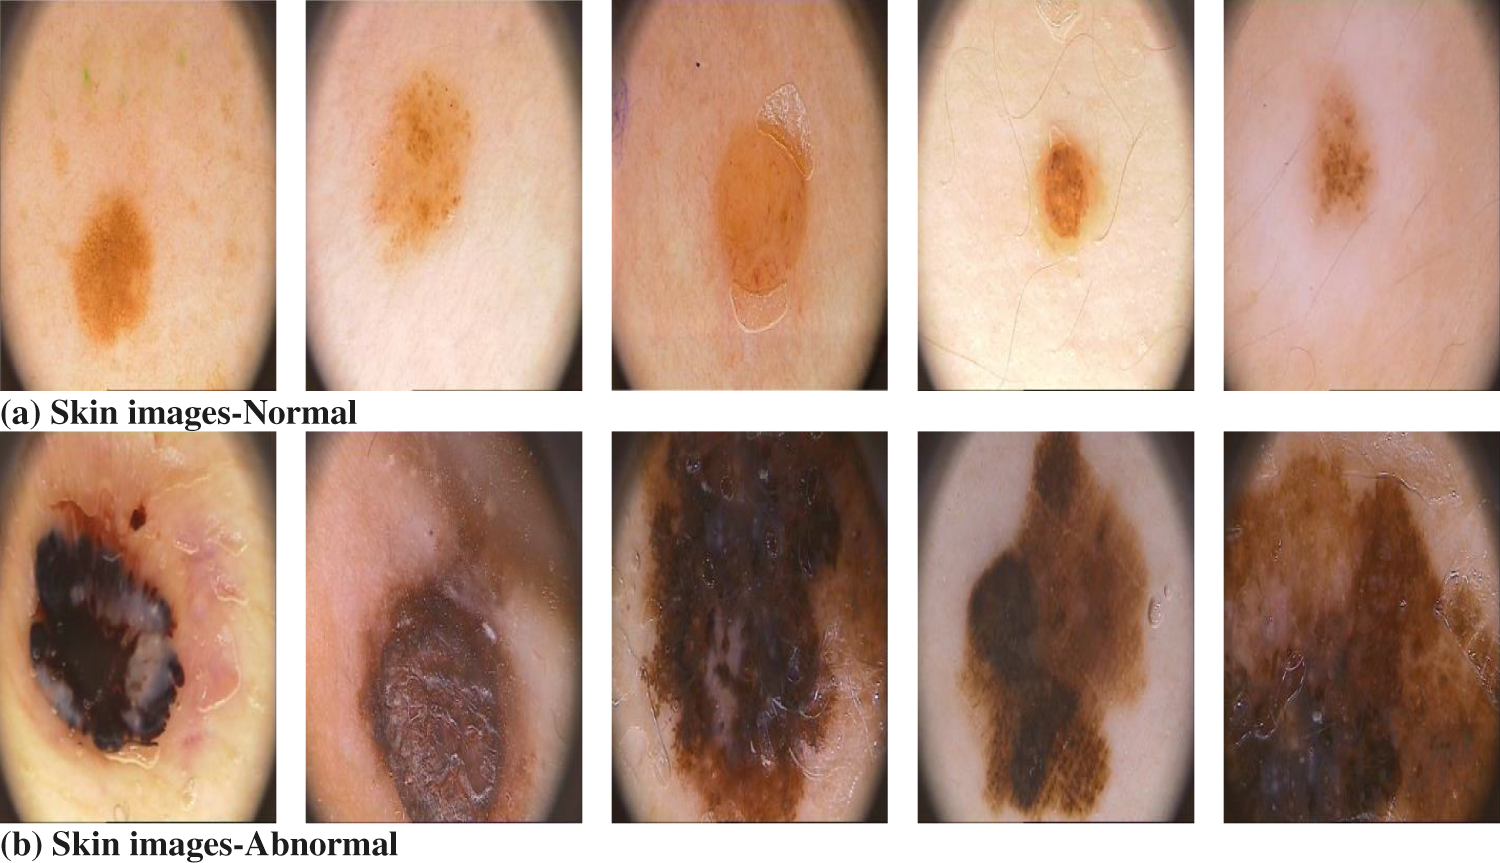
Figure 8: Sample skin images in PH2 database used in SLC system
The dermoscopic images are decomposed by NSST at different directions (2, 4, 8, 16 and 32) from 1 to 4 levels. From the NSST’s sub-bands, energy features are extracted. Finally SVM classifier is used for the prediction of dermoscopic images as normal or abnormal. The SVM classification efficiency is evaluated by using 10 fold cross validation. The sensitivity, specificity and accuracy [23–26] are calculated by using the correct identification of skin image samples. The sensitivity, specificity and accuracy is given by,
where, TP → True Positive (correct classification of abnormal cases), FN → False Negative (misclassification of abnormal cases), TN → True Negative (correct classification of normal cases) and FP → False Positive (misclassification of normal cases). The performances of SLC system based on NSST and SVM classifier are shown in Tab. 1.

From Tab. 1, it is observed that, comparing to other levels, the 3rd level produces the higher classification accuracy of 96% using 8-directions NSST features. The sensitivity and specificity reaches up to 93.33% and 100% respectively in 3rd level with 8-directions. The accuracy is reduced in 4th level for all directions due to some redundant features. Only 8 directions in NSST produce higher classification accuracy in all 4 NSST levels comparing to other directions (2, 4 and 16). It produces 90%, 93% and 94% accuracy for NSST level 1, 2 and 4. Figs. 9 and 10 show the confusion matrices and ROCs for 1st level and 2nd level of NSST based energy features from 8-directions.

Figure 9: Confusion matrix for 8-directions and ROC for 1st level NSST feature

Figure 10: Confusion matrix for 8-directions and ROC for 2nd level NSST feature
In Fig. 10, confusion matrix shows that the 110 abnormal images are correctly classified and 4 abnormal images are wrongly classified. Also, 76 normal images are correctly classified. The sensitivity and specificity are 91.7% and 95% for 2nd level NSST features from 8-directions. From the ROC curve, it is observed that the maximum Area Under the Curve (AUC) is 0.93 at 8-directions and the minimum AUC is 0.71 at 2-directions using NSST based energy features with SVM classifier. Fig. 11 shows the confusion matrix and ROC for the 3rd level of NSST based energy features from 8-directions.

Figure 11: Confusion matrix for 8-directions and ROC for 3rd level NSST feature
In Fig. 11, confusion matrix shows that the 112 abnormal images are correctly classified and 8 abnormal images are wrongly classified. Also, 80 normal images are correctly classified. The sensitivity and specificity are 93.33% and 100%. From the ROC curve, it is observed that the maximum AUC is 0.96 at 8-directions and the minimum AUC is 0.71 at 2-directions using NSST based energy feature and SVM classifier. Fig. 12 shows the confusion matrix and ROC for the 4th level of NSST based energy features from 8-directions.

Figure 12: Confusion matrix for 8-directions and ROC for 4th level NSST feature
From Fig. 12, confusion matrix shows that the 111 abnormal images are correctly classified and 9 abnormal images are wrongly classified. Also, 78 normal images are correctly classified and 2 normal images are wrongly. The sensitivity and specificity are 92.5% and 97.5%. From the ROC curve, it is observed that the maximum AUC is 0.94 at the direction 8 and the minimum AUC is 0.69 at 2-directions using NSST based energy feature and SVM classifier. From all the confusion matrices and ROCs for 8-directions, the 3rd level produces higher classification accuracy of 96%. Fig. 13 shows the graphical representation of NSST direction 8 for all 4 levels.

Figure 13: Graphical representation of NSST direction 8 for all 4 levels
From Fig. 13, it is clearly observed that the 3rd level NSST features from 8-dierctions produces higher classification accuracy of 96% comparing to other levels of NSST features by using the SVM classifier.
An efficient method for SLC system using NSST and SVM classifier is presented in this study. Initially, the NSST is used to decompose the input skin image that produces NSST’s sub-bands in different directions. The thin support of Shearlet is increased by higher scaling. The energy features extracted from the NSST’s sub-band are used as texture descriptors to predict the abnormality in the skin images. Finally, SVM classifier is used for the prediction using 10-fold cross validation method. The 3rd level NSST with 8-directions produces better classification accuracy of 96% comparing to other levels. In future, NSST based temporal and spectral features can be utilized for skin cancer diagnosis. Also, multi-class SVM classifier can be directly used to classify the skin cancers.
Funding Statement: The authors received no specific funding for this study.
Conflicts of Interest: The authors declare that they have no conflicts of interest to report regarding the present study.
1. R. Maury, S. K. Singh, A. K. Maurya and A. Kumar, “GLCM and multi class support vector machine based automated skin cancer classification,” in IEEE Int. Conf. on Computing for Sustainable Global Development, New Delhi, India, pp. 444–447, 2014. [Google Scholar]
2. R. Sonia, “Melanoma image classification system by NSCT features and Bayes classification,” International Journal of Advances in Signal and Image Sciences, vol. 2, no. 2, pp. 27–33, 2016. [Google Scholar]
3. R. Suganya, “An automated computer aided diagnosis of skin lesions detection and classification for dermoscopy images,” in IEEE Int. Conf. on Recent Trends in Information Technology, Chennai, India, pp. 1–5, 2016. [Google Scholar]
4. H. Alquran, I. A. Qasmieh, A. M. Alqudah, S. Alhammouri, E. Alawneh et al., “The melanoma skin cancer detection and classification using support vector machine,” in IEEE Jordan Conf. on Applied Electrical Engineering and Computing Technologies, Aqaba, Jordon, pp. 1–5, 2017. [Google Scholar]
5. R. S. Sundar and M. Vadivel, “Performance analysis of melanoma early detection using skin lesion classification system,” in IEEE Int. Conf. on Circuit, Power and Computing Technologies, Nagercoil, India, pp. 1–5, 2016. [Google Scholar]
6. N. C. Lynn and Z. M. Kyu, “Segmentation and classification of skin cancer melanoma from skin lesion images,” in 18th Int. Conf. on Parallel and Distributed Computing, Applications and Technologies, Taipei, Taiwan, pp. 117–122, 2017. [Google Scholar]
7. H. R. Mhaske and D. A. Phalke, “Melanoma skin cancer detection and classification based on supervised and unsupervised learning,” in IEEE Int. Conf. on Circuits, Controls and Communications, Bangaluru, India, pp. 1–5, 2013. [Google Scholar]
8. S. Kumarapandian, “Melanoma classification using multiwavelet transform and support vector machine,” International Journal of MC Square Scientific Research, vol. 10, no. 3, pp. 1–7, 2018. [Google Scholar]
9. S. K. Singh and A. S. Jalal, “A robust approach for automatic skin cancer disease classification,” in IEEE 1st India Int. Conf. on Information Processing, Delhi, India, pp. 1–4, 2016. [Google Scholar]
10. N. B. Linsangan, J. J. Adtoon and J. L. Torres, “Geometric analysis of skin lesion for skin cancer using image processing,” in IEEE 10th International Conf. on Humanoid, Nanotechnology, Information Technology, Communication and Control, Environment and Management, Baguio City, Philippines, pp. 1–5, 2018. [Google Scholar]
11. R. Sumithra, M. Suhil and D. S. Guru, “Segmentation and classification of skin lesions for disease diagnosis,” Procedia Computer Science, vol. 45, pp. 76–85, 2015. [Google Scholar]
12. S. Serte and H. Demirel, “Gabor wavelet-based deep learning for skin lesion classification,” Computers in Biology and Medicine, vol. 113, pp. 1–7, 2019. [Google Scholar]
13. S. Jain and N. Pise, “Computer aided melanoma skin cancer detection using image processing,” Procedia Computer Science, vol. 48, pp. 735–740, 2015. [Google Scholar]
14. L. K. Ferris, J. A. Harkes, B. Gilbert, D. G. Winger, K. Golubets et al., “Computer-aided classification of melanocytic lesions using dermoscopic images,” Journal of the American Academy of Dermatology, vol. 73, no. 5, pp. 769–776, 2015. [Google Scholar]
15. K. Shamganth and K. Melanoma, “Classification using multi wavelet transform and support vector machine,” International Journal of MC Square Scientific Research, vol. 11, no. 3, pp. 1–7, 2018. [Google Scholar]
16. G. Guorong, X. Luping and F. Dongzhu, “Multi-focus image fusion based on non-subsampled shearlet transform,” IET Image Processing, vol. 7, no. 6, pp. 633–639, 2013. [Google Scholar]
17. H. Ouerghi, O. Mourali and E. Zagrouba, “Non-subsampled shearlet transform based MRI and PET brain image fusion using simplified pulse coupled neural network and weight local features in YIQ colour space,” IET Image Processing, vol. 12, no. 10, pp. 1873–1880, 2018. [Google Scholar]
18. O. Deperlioğlu, “Classification of heart sounds with re-sampled energy method,” in IEEE 26th Signal Processing and Communications Applications Conf., Izmir, Turkey, pp. 1–4, 2018. [Google Scholar]
19. S. Mohankumar, “Analysis of different wavelets for brain image classification using support vector machine,” International Journal of Advances in Signal and Image Sciences, vol. 2, no. 1, pp. 1–4, 2016. [Google Scholar]
20. R. Vijaya Arjunan, “ECG signal classification based on statistical features with SVM classification,” International Journal of Advances in Signal and Image Sciences, vol. 2, no. 1, pp. 5–10, 2016. [Google Scholar]
21. PH2 Database Link: https://www.fc.up.pt/addi/ph2%20database.html. [Google Scholar]
22. S. Murugan, A. Bhardwaj, and T. R. Ganeshbabu, “Object recognition based on empirical wavelet transform,” International Journal of MC Square Scientific Research, vol. 7, no. 1, pp. 74–80, 2015. [Google Scholar]
23. J. Jose, N. Gautam, M. Tiwari, T. Tiwari, A. Suresh et al., “An image quality enhancement scheme employing adolescent identity search algorithm in the NSST domain for multimodal medical image fusion,” Biomedical Signal Processing and Control, vol. 66, pp. 1–10, 2021. [Google Scholar]
24. A. Khare, M. Khare and R. Srivastava, “Shearlet transform based technique for image fusion using median fusion rule,” Multimedia Tools and Applications, vol. 80, no. 8, pp. 11491–11522, 2021. [Google Scholar]
25. Z. Ding, D. Zhou, R. Nie, R. Hou and Y. Liu, “Brain medical image fusion based on dual-branch CNNs in NSST domain,” BioMedical Research International, vol. 2020, pp. 1–15, 2020. [Google Scholar]
26. S. Jacob and J. D. Rosita, “Fractal model for skin cancer diagnosis using probabilistic classifiers,” International Journal of Advances in Signal and Image Sciences, vol. 7, no. 1, pp. 21–29, 2021. [Google Scholar]
 | This work is licensed under a Creative Commons Attribution 4.0 International License, which permits unrestricted use, distribution, and reproduction in any medium, provided the original work is properly cited. |