DOI:10.32604/csse.2023.022687
| Computer Systems Science & Engineering DOI:10.32604/csse.2023.022687 | |
| Article |
Performance Analysis of Breast Cancer Detection Method Using ANFIS Classification Approach
1Department of Computer Science and Engineering, Sethu Institute of Technology, Virudhunagar, 626115, Tamil Nadu, India
2Department of Computer Science and Engineering, PSG College of Technology, Coimbatore, 641004, Tamil Nadu, India
*Corresponding Author: K. Nagalakshmi. Email: laxmirengaraj1980@gmail.com
Received: 15 August 2021; Accepted: 28 December 2021
Abstract: Breast cancer is one of the deadly diseases prevailing in women. Earlier detection and diagnosis might prevent the death rate. Effective diagnosis of breast cancer remains a significant challenge, and early diagnosis is essential to avoid the most severe manifestations of the disease. The existing systems have computational complexity and classification accuracy problems over various breast cancer databases. In order to overcome the above-mentioned issues, this work introduces an efficient classification and segmentation process. Hence, there is a requirement for developing a fully automatic methodology for screening the cancer regions. This paper develops a fully automated method for breast cancer detection and segmentation utilizing Adaptive Neuro Fuzzy Inference System (ANFIS) classification technique. This proposed technique comprises preprocessing, feature extraction, classifications, and segmentation stages. Here, the wavelet-based enhancement method has been employed as the preprocessing method. The texture and statistical features have been extracted from the enhanced image. Then, the ANFIS classification algorithm is used to classify the mammogram image into normal, benign, and malignant cases. Then, morphological processing is performed on malignant mammogram images to segment cancer regions. Performance analysis and comparisons are made with conventional methods. The experimental result proves that the proposed ANFIS algorithm provides better classification performance in terms of higher accuracy than the existing algorithms.
Keywords: Breast cancer; detection; segmentation; classification; malignant
The abnormal growth of cells abruptly leads to cell burst, known as cancer. It is a life-threatening disease throughout the world [1–3]. Various kinds of cancers, such as brain cancer, lung cancer, cervical cancer, and breast cancer, occur in people due to their genetic, age, food habit, and working environment. Cervical and breast cancers have occurred only in women among these known cancers. These two types of cancers in women are silent cell killers, which can only create severe symptoms, leading to death [4]. The early detection and diagnosis of cancer could minimize the death rates. Medical image processing is the evolving methodology for detecting and classifying various cancer-affected images. In this paper, breast cancer can be detected and classified using image processing algorithms. It uses ultrasound, Magnetic Resonance Imaging (MRI), and Mammography techniques to screen the human body’s cancer regions or abnormal regions. Among these scanning techniques, mammography uses a low density of x-rays to screen the breast’s internal regions [5,6]. Hence, it is known as a popular breast cancer screening tool today.
This paper identifies the cancer regions in breast images using mammography. The cancer regions in mammograms are categorized as benign and malignant depending on the abnormal masses’ size, location, and density. The benign is the non-cancerous cells that cannot be spread into nearby regions, and proper medications can cure them. The malignant is the cancerous cells that spread to nearby cells and lead to death. Hence, there is a requirement for developing the methodology for screening the malignant regions in mammogram images.
Figs. 1a–1c shows the normal, benign case and malignant case mammogram images, respectively.

Figure 1: Mammogram images (a) Normal image (b) Benign case (c) Malignant case
At present, the radiologist or medical experts scan the mammogram images manually and identify the regions affected by cancer cells. It is a time-consuming process that is not suitable and reliable for a large population screening environment. To overcome such limitations, there is a need for developing an automatic methodology for detecting and segmenting cancer areas in mammogram images. Hence, this paper uses medical image processing methods such as machine-leaning algorithms to detect and screen cancer areas in mammogram images.
Ubeyli [7] presented an integrated view of implementing ANFIS for breast cancer detection. The Wisconsin breast cancer database contained records of patients with known diagnoses. The ANFIS classifiers learned how to differentiate a new case in the domain by giving training set of such records. The ANFIS classifier had been used to detect breast cancer when nine features defining breast cancer indications were used as inputs. The ANFIS model combined the neural network adaptive capabilities and the fuzzy logic qualitative approach. The impacts of the features for the detection of breast cancer were obtained through the analysis of the ANFIS technique. The performance of the ANFIS model is evaluated in terms of training performances and classification accuracies. The results confirmed that the ANFIS model has significant potential in detecting breast cancer.
The main problem of this research work is breast cancer detection and segmentation using ANFIS classification approach. Numerous research and methodologies are introduced, but the breast cancer identification accuracy is not ensured significantly. The existing approaches have drawbacks with time consumption and inaccurate classification results. To overcome the above-mentioned issues, morphological segmentation and ANFIS classifier have improved the overall detection performance. The main contribution of this research is preprocessing, feature extraction, classification, and segmentation. The proposed method provides more accurate results using effective algorithms for the given database.
In rural areas, earlier detection of breast cancer saves much person life. In the present method, the breast cancer detection process is tedious and expensive due to the implementation of complex algorithms. Hence, there is a need for developing a simple approach for detecting the cancer regions in mammogram images. This motivated this research to propose an efficient approach for breast cancer detection. The article is organized with the following sections. Section 2 details the traditional techniques for breast cancer detection and segmentation, Section 3 suggests a novel methodology for screening cancer areas in mammogram images, Section 4 discusses simulation outcomes and its performance analysis with conventional techniques, Section 5 discusses the findings of the research in the conclusion section.
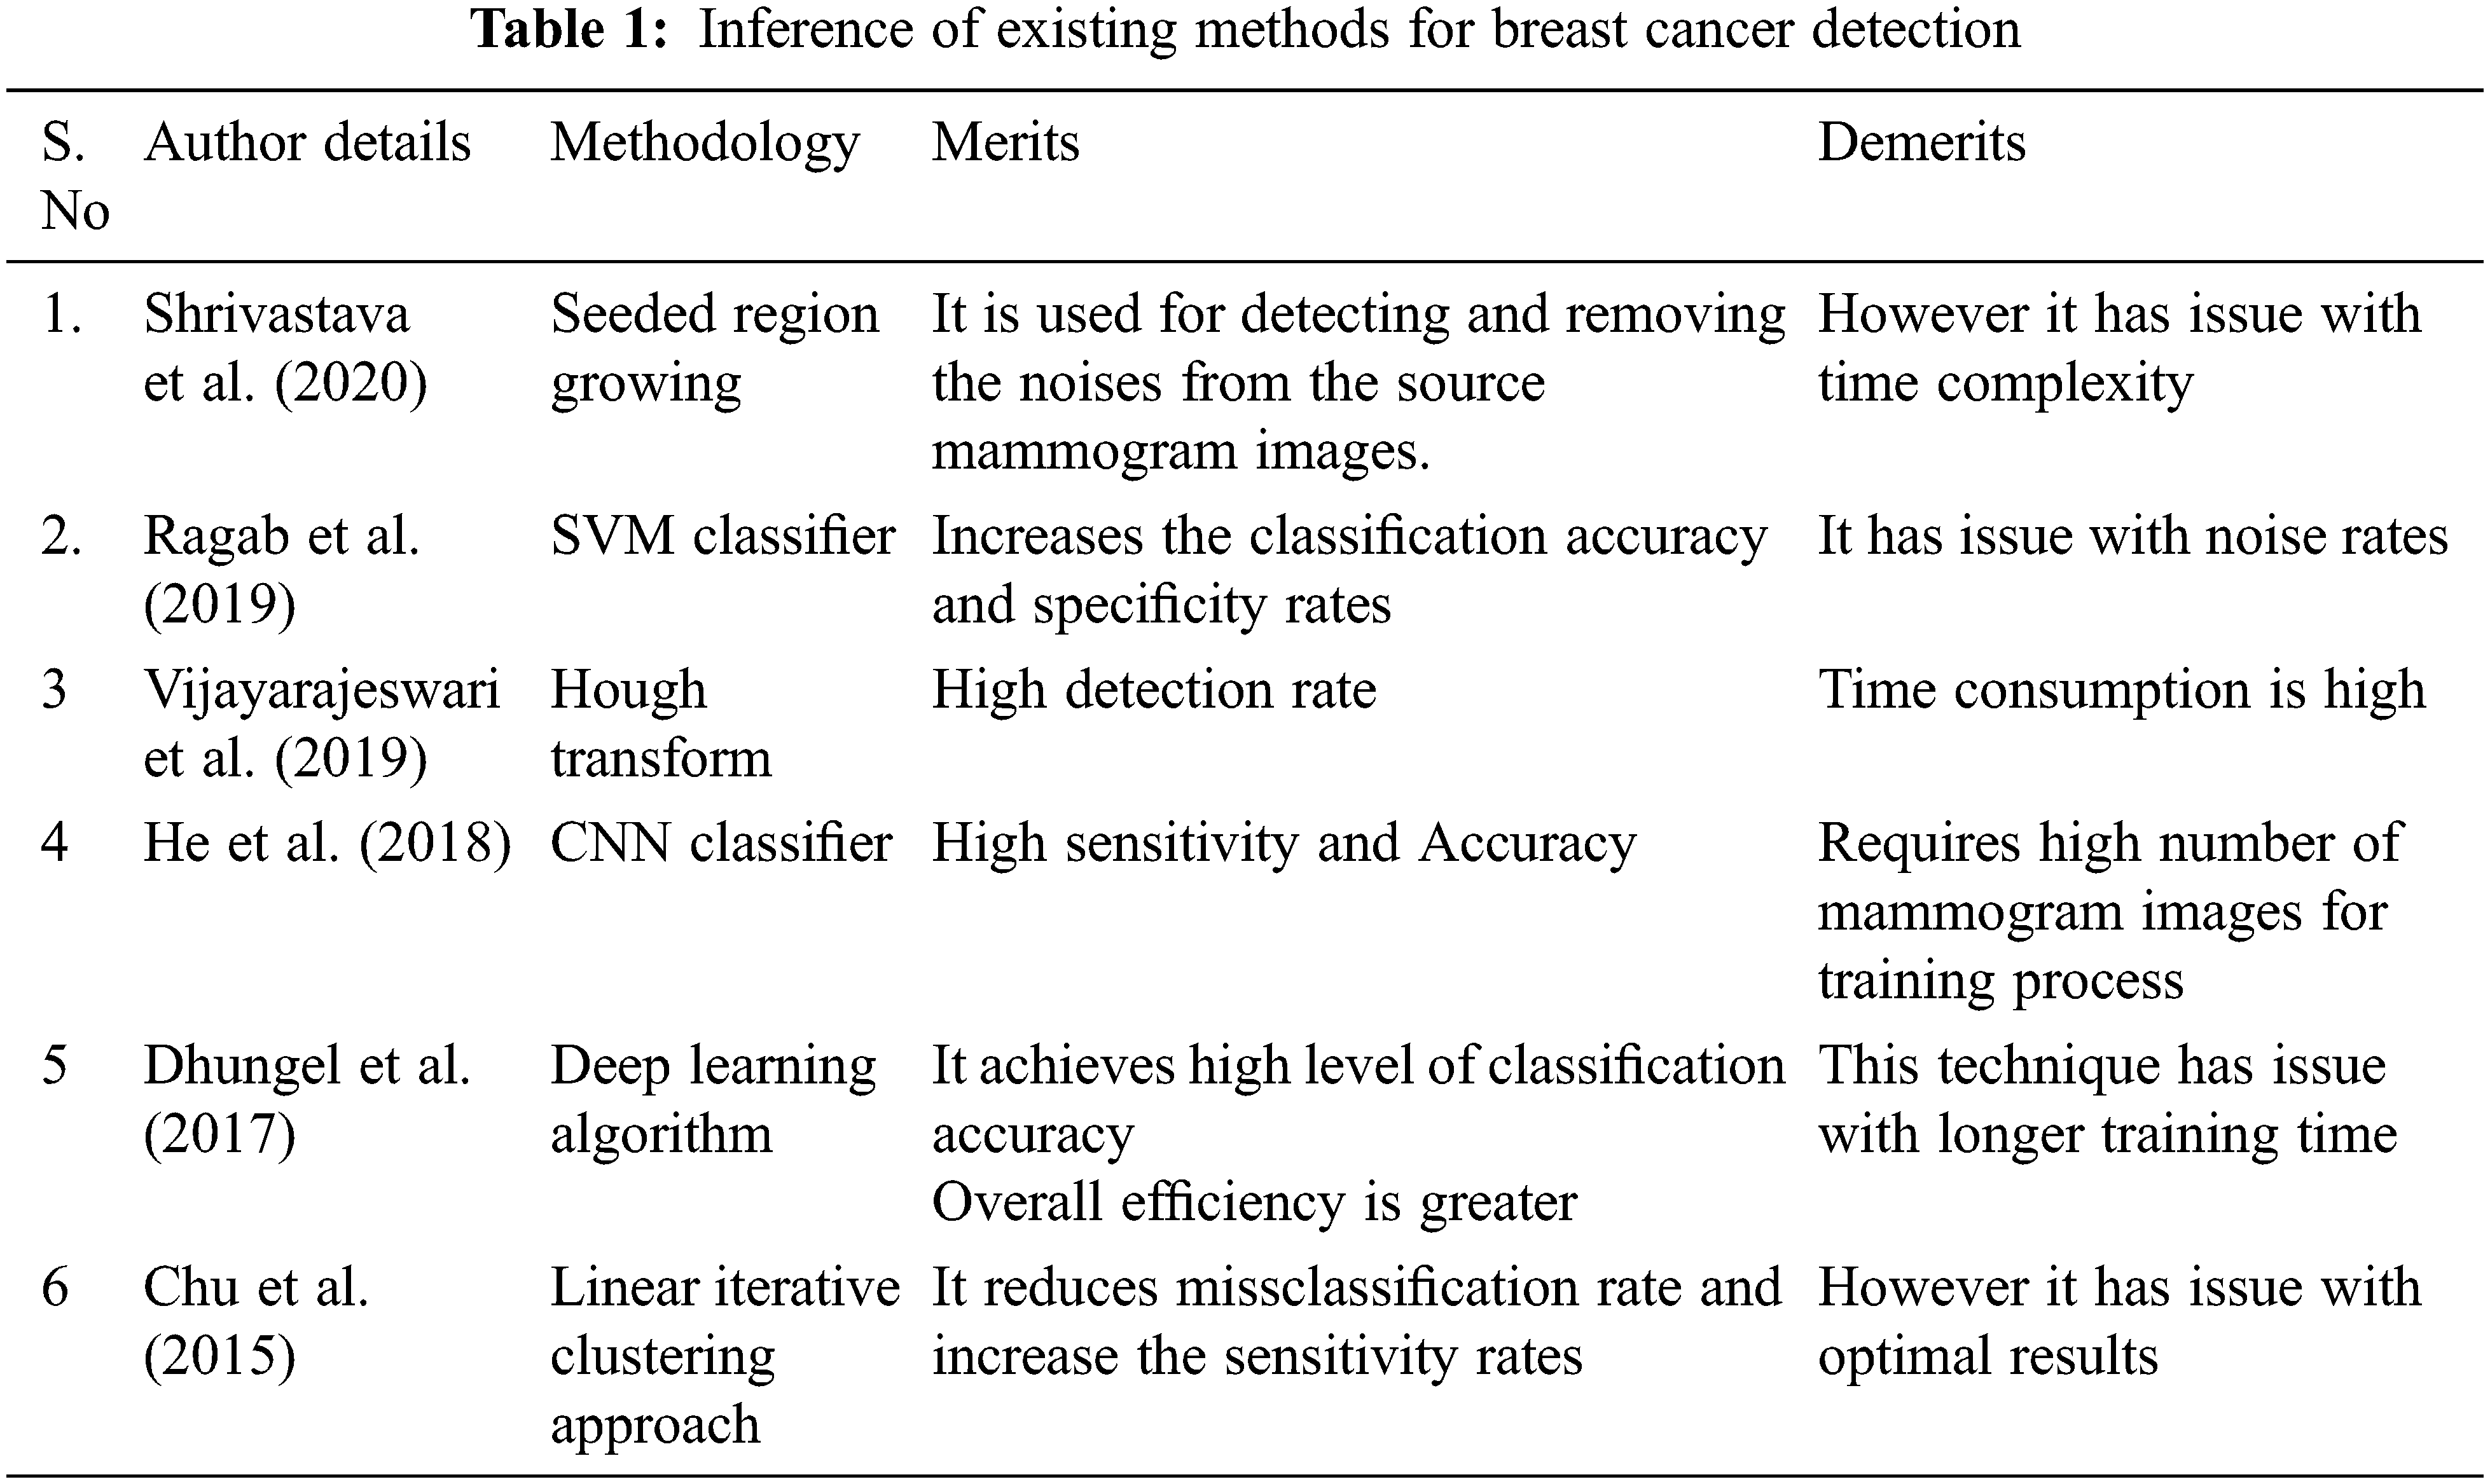
Shrivastava et al. [8] used a median filtering algorithm for detecting and removing the noises from the source mammogram image. The Seeded Region Growing algorithm was employed to segment the cancer regions on the mammogram image. This work was tested using the mammogram images available in MIAS dataset. The researchers acquired 96.1% accuracy and 94% of detection rate.
Suresh et al. [9] used the deep learning model to classify and segment abnormal cancer regions in mammogram images. The Laplacian filter was used on mammogram images to detect and remove noise contents. Then, Histogram of Oriented Gradients features and energy features were computed from the denoised mammogram image. These combined features are then classified using deep neural networks, which categorize source mammogram images as normal or abnormal. Finally, a modified-Adaptively Regularized Kernel-based Fuzzy-C-Means segmentation algorithm was used to segment the cancer areas on abnormal mammogram images. This method used mammogram images from MIAS dataset. This work acheived 98.85% F-measure and 96.7% of average accuracy.
Ragab et al. [10] proposed a methodology for detecting and segmenting the cancer areas in mammogram images utilizing the integration of machine learning and deep learning algorithms. This paper used a threshold approach to select the region of interest in abnormal mammogram images. Then, deep Convolutional neural networks AlexNet was used on the selected region of interest to extract the internal features. Then, these internal features were trained and classified by Support Vector Machine (SVM) classification algorithm, which classified the mammogram images into normal and abnormal cases. The researchers used their suggested method on mammogram images present in the MIAS database, and they obtained 96.8% of sensitivity, 97.3% of specificity, 97.6% of accuracy, 95% of detection rate.
He et al. [11] presented a classification of mammograms using features extracted using Hough transform. Hough transform is a two-dimensional transform. It is used to isolate features of a particular shape in an image. Miniaturized scale characterization and masses are the two most vital threat markers, and their mechanized identification is exceptionally important for early breast cancer diagnosis. Since masses are regularly undefined from the encompassing parenchymal, computerized mass location and arrangement is significantly additionally difficult. This paper presented the strategies for classification and feature extraction. Here, Hough transform has been used to detect features of mammograms image, and it is classified using SVM. The classification accuracy is more by the use of SVM classifier. This method is tested on 95 mammograms images collected and classified using SVM. The result shows that the proposed method effectively classifies the abnormal classes of mammograms.
Vijayarajeswari et al. [12] combined computer image processing technology and deep learning technology to perform automatic breast cancer detection on Whole Slide Images (WSI). The main works of this paper were (1) extracting patches from WSIs to obtain training set and testing set. (2) Train classification models based on CNN to classify cancer areas. (3) Train feature extraction network model via Convolutional Neural Network (CNN) and transfer learning. Then, CNN features are combined with texture features to train the SVM classifier. The classification model has been used for cancer detection. And this classification method has higher accuracy. (4) Choose the best solution for classification to achieve automatic detection of cancer regions on large-scale pathological images via sliding window and voting scoring. And the final detection results almost approached the diagnosis of professional pathologists.
Dhungel et al. [13] used deep learning algorithm for detecting the abnormal mass regions in mammogram images. The authors applied the data augmentation process to improve the number of mammogram images to achieve a high classification accuracy level. Then, probabilistic linear features were computed from each image from the data augmentation process, and they were trained and classified using a deep learning algorithm. Chu et al. [14] proposed fully automatic breast cancer detection and segmentation methodology using a simple linear iterative clustering approach. The clutters detected and removed from the abnormal mammogram images to improve average segmentation accuracy. This technique was applied on the mammogram images in MIAS dataset and researchers acquired 96.3% sensitivity, 96.9% specificity, 97.1% accuracy, and 91% detection rate.
This paper enhances the mammogram image using a novel approach based on the wavelet transform. Using this novel enhancement approach, the abnormal mammogram image’s classification rate or detection rate is high. Also, a novel set of moment invariant and LOOP features is derived to classify normal mammogram images from abnormal mammograms. The performance efficiency of the breast cancer detection system is improved using these novel methods stated in this paper.
In this work, Mammographic Image Analysis Society (MIAS) [15] dataset is utilized to evaluate the performance of the proposed methodology for breast cancer detection and segmentation. This dataset is generated through UK National Breast Screening Programme by UK research groups. It consists of 322 mammography samples digitized to 50 micron pixel edge. The mammogram images in this dataset are categorized into three types as normal (208 images), benign (63 images), and malignant (51 images). The size of each mammogram image in this dataset is about 1024 × 1024 pixels as width and height. The resolution of each mammogram image is about 50 μm × 50 μm and each pixel is quantized into 8 bits. This dataset consists of both left and right region mammogram images for each patient in DICOM format. This dataset is available and maintained by University of Essex. The images in this dataset are categorized into Architectural distorted, benign, and malignant images. This dataset mammogram images are split into training and testing. The training set (155 mammogram images) consists of 100 normal images, 30 benign images, and 25 malignant images. The testing set (167 mammogram images) consists of 108 normal images, 33 benign images, and 26 malignant images.
This paper develops a fully automatic methodology for breast cancer detection and segmentation through ANFIS classification method. This suggested technique contains preprocessing, feature extraction, classifications, and segmentation stages. Here, the wavelet based enhancement method is used as preprocessing method. Further, texture and statistical features have been extracted from the enhanced image. After that, ANFIS classification was used to classify mammogram images to normal, benign, and malignant cases. The overall suggested methodology for breast cancer detection and segmentation is shown in Fig. 2.

Figure 2: The proposed model for breast cancer detection and segmentation
3.2.1 Wavelet Based Enhancement
In this paper, bicubic interpolation based DWT is used for mammogram image enhancement process. Many decomposition methods such as DWT, Singular Value Decomposition (SVD), and Curvelet transform are available to obtain the sub band images for the enhancement process. This paper chooses the DWT for the decomposition process due to its high selectivity and scalable property than other decomposition methods. The visual quality of each pixel is enhanced using harr wavelet function based DWT. The two-dimensional DWT is applied to the source mammogram image which decomposes the image into four sub bands as ‘Approximate (LL), Horizontal (LH), Vertical (HL) and Diagonal (HH). During decomposition procedure, artifacts are generated in each decomposed sub bands. These artifacts degrade the quality of image. To enhance visual quality of the mammogram image, bicubic interpolation by the scaling factor of 2, is applied on each decomposed sub bands.
The following algorithm used for enhancing the source mammogram image.
Wavelet based mammogram image enhancement
Input: Source mammogram image (I);
Output: Enhanced mammogram image;
Start;
Step 1:
Decompose the source mammogram image into four sub bands as LL, LH, HL and HH, correspondingly.
Step 2:
Apply ‘bicubic interpolation’ on each decomposed sub bands in order to eliminate the artifacts;
Step 3:
The LL band is now subtracted from the source mammogram image as depicted in the following equation.
Step 4:
Optimize the coefficients in each sub band using the following equations.
Step 5:
Apply inverse DWT using the optimized sub bans with ‘harr’ wavelet function using the following equation.
End;
Fig. 3a demonstrate source mammogram image and Fig. 3b demonstrate enhanced mammogram image by DWT, where the pixels are enhanced.

Figure 3: (a) Source mammogram image (b) Enhanced mammogram image by DWT
The size of the source mammogram image (before enhancement process) and enhanced mammogram image (after enhancement process) is same as 1024 × 1024 pixels as width and height.
Gabor Time-Frequency Transformation
Most of the conventional breast cancer detection is performed on spatial domain, which degrades the breast cancer detection rate. To improve the detection rate of the breast cancer segmentation, time-frequency conversion is required. Hence, this paper uses Gabor transform for converting the spatial domain pixels into time-domain pixels. The Gabor transform is otherwise called as Gabor filter which has the Gabor kernel for performing the conversion function of time to frequency. The enhanced mammogram image is convolved with the following Gabor kernel.
Whereas, θ is the orientation of Gabor filter and it is varied from 0 degree to 180 degree (incrementing by 1 degree), which produces 180 Gabor kernels. The Gabor kernel parameters x1 and y1 are computed using the following equations (pixel coordinates are depicted by x and y, respectively).
These 180 Gabor kernels are convolved with the enhanced mammogram image to produce the Gabor transformed image, which has both real and imaginary terms. To eliminate the imaginary terms in Gabor transformed image, the magnitude of each pixel is computed for each image. The maximum pixel value for each pixel coordinate is computed, producing the Gabor magnitude mammogram image. Fig. 4 shows the Gabor time-frequency converted mammogram image.

Figure 4: Gabor time-frequency converted mammogram image
Features are the texture patterns that are used to describe the internal probability functions of each pixel in the image. This paper uses the following features to differentiate the normal mammogram image from the abnormal mammogram image.
• Moment Index features.
• LOOP features.
• Law’s texture features.
These texture features are computed from Gabor transformed time-frequency mammogram image and are described in the subsequent part.
Moment Index Features
The moment level variations of each pixel in Gabor transformed mammogram image are analyzed using moment index features. The moment index features are computed from the time-frequency transformed mammogram image and they are given in the following equations.
where, φ1 and φ2 are the orientation factors.
The orientation of each pixel is represented by two directions φ1 and φ2, respectively and they are computed using the following equations.
where, k is the invariant index factor and it is computed using the probability variations of each pixel with its nearby pixel in its corresponding orientation direction.
The invariant index factor is computed using the following equation,
The mean index factor is depicted by μ, and it is computed using the following equation.
The parameters x| and y| are computed using the moments of the factors using the following equations,
The moment Index Features produces two feature values for single mammogram image. Hence, the total number of moment index features derived from 155 mammogram images in the training phase is 310.
Local Optimal Oriented Pattern (LOOP) Features
LOOP features describe the rotation invariance of each pixel in mammogram image. Many visual pattern recognition tasks used these features to describe the image regions’ various patterns for repeated local patterns. It is basically derived from Local Binary Pattern (LBP). It uses eight Kirsch’s kernels as shown in Fig. 5 at different directions East, North-East, North, North-West, West, South-west, South and South-East.

Figure 5: Eight kirsch’s kernels for LOOP feature computation
The Gabor transformed image is split into 3*3 overlapping regions, and LBP are computed for each 3*3 overlapping region. The computed LBP pattern consists of eight binary values, and this LBP pattern is convolved with Kirsch’s kernel individually. The LBP values are derived for each computed convolved sequence and the maximum value is chosen as LOOP feature. The same procedure is repeated for other non-overlapping regions till the end of the pixel in Gabor transformed image. Fig. 6 shows the LOOP feature extracted mammogram image.

Figure 6: LOOP feature extracted mammogram image
The LOOP Features produces the feature image that has the same Gabor transformed image size. The size of the Gabor transformed mammogram image is about 1024 × 1024 pixels as width and height Hence, the total numbers of LOOP features derived from 155 mammogram images in case of training phase is 162*106.
Law’s Texture Features
In this paper, the two energy features are computed for every pixel in mammogram image using Laws texture features described in [16]. The Laws texture features produce two feature values for single mammogram image. Hence, the total number of moment index features derived from 155 mammogram images in the training phase is 310. Hence, total number of features derived from the Gabor transformed mammogram image is about 310 + 162*106 + 310. These features are stored in matrix format and fed into the classification architecture.
The extracted features are trained and classified utilizing the classification technique, which classifies the source patterns concerning the reference patterns. The reference patterns are called trained patterns. The classifier receives the extracted feature set from the source mammogram image, and the features can be categorized into three distinct classes: benign, malignant, and normal case. Most of the conventional breast cancer detection and classification system used NNs, SVM, and Bayesian classifiers to classify the extracted features. Though these traditional classifiers had simple architecture, the classification or detection rate was not optimum for further cancer region segmentation. To overcome such limitations in conventional classifiers for breast cancer detection and classification, the proposed method here utilizes ANFIS classification algorithm, which has features of both NN and Fuzzy systems. In this paper, unsupervised classification architecture is used to obtain the optimum detection rate compared with supervised classifier [17,18]. This ANFIS classifier functions into two sets of modes: training and testing. The training phase of ANFIS classifier receives the features from the normal, benign, and malignant mammogram images from the open-access database, which produces the trained patterns. The testing phase of the ANFIS classifier receives the features from the source mammogram image, which is to be tested or classified with the trained patterns, producing the multi-class response as class 1, class 2 and class 3. Class 1 represents the normal mammogram image, class 2 represents the benign mammogram image, and class 3 represents the malignant mammogram image. Fig. 7a shows the flow chart for the proposed breast cancer detection and classification methodology and Fig. 7b shows the ANFIS architecture for the proposed methodology.

Figure 7: (a) Flow chart for proposed breast cancer detection and classification methodology (b) ANFIS architecture
In Fig. 7b, the extracted features from normal and abnormal mammogram images are given into the variables ‘x’ and ‘y’, respectively. Layer 1 performs the fuzzification process using the extracted features from the mammogram image. The response from this layer is given to Layer 2, where the weights of each extracted feature are computed. These computed weights of the features are normalized in Layer 3. The defuzzification process is performed in Layer 4, which produces the accumulated normalized weights to layer 5. Layer 5 produces three classes. Fig. 8a shows the non-cancer affected mammogram images which do not contain any cancer pixels in it and Fig. 8b shows the cancer affected mammogram images which consist of cancer patches in it.

Figure 8: Mammogram images (a) Non-cancer case (b) Cancer affected case
The ANFIS classifier classifies the source mammogram image normal, benign, and malignant images. Benign and malignant images belong to abnormal cases, in which the cancer region is visible in malignant images only. Hence, there is a need to segment the cancer pixels in classified malignant mammogram images. For this segmentation purpose, watershed segmentation algorithm and region growing algorithm were used in the conventional segmentation process. The cancer segmentation accuracy was not optimum using these segmentation techniques. To enhance cancer segmentation accuracy, this article utilizes a morphological processing algorithm to segment cancer regions in classified malignant images. This algorithm consists of two segmentation process as morphological dilation and erosion. The dilation process increases the pixel density of the classified malignant image (f) by 2 mm radius as structuring element (s). Further, the erosion process decreases the pixel density of the classified malignant image by 2 mm radius as structuring element (s).
The morphological dilation procedure is showed as given,
The morphological erosion procedure is showed as given,
The eroded image is currently pixel subtracted from the morphologically processed dilated image, which clearly detects then segments the cancer pixels in classified malignant mammogram image. Fig. 9a shows the source mammogram images from the MIAS dataset, Fig. 9b shows the cancer region segmented mammogram images by the proposed method and Fig. 9c shows the ground truth images available in the MIAS dataset.

Figure 9: (a) Source mammogram images from MIAS dataset (b) Cancer region segmented mammogram images by proposed method (c) Ground truth images available in MIAS dataset
In this paper, the proposed methodology for breast cancer detection and segmentation system is applied on a large set of open access mammogram images available in (MIAS) dataset. This paper uses MATLAB R2016 for simulating the proposed methodology with the hardware specifications of Intel Core Duo Processor 2.4 GHz and 4 GB RAM internal memory. The performance of the proposed breast cancer detection and segmentation methodology is analyzed in terms of following parameters.
• Detection Rate (DR).
• Sensitivity (Se).
• Specificity (Sp).
• Accuracy (Acc).
• Positive Predictive Value (PPV).
• Negative Predictive Value (NPV).
• Disc Similarity Coefficient (DSC).
DR is the proportion of mammogram images exactly detected and total mammogram images considered. It is calculated in percentage and varies between 0 and 100. It is depicted in the following equation.
Extracted statistical and texture features contribute a significant part in obtaining a high detection rate, as depicted in Tab. 2. From Tab. 1, the proposed system with moment index feature alone achieves 78.1% of DR, with LOOP feature alone achieved 81.5% of DR, and with Laws texture feature alone achieved 79.65% of DR.

To improve the DR for the suggested method, extracted features are joined together. The combinations of the extracted features Moment index and LOOP features achieved 85.2% of DR. The combinations of Moment index and Laws texture features achieved 87.9% of DR. The combinations of LOOP and Laws texture features achieves 88.6% of DR. The combinations of all features achieved 98.65% of DR, as illustrated in Tab. 2.
This paper correctly detects 207 normal mammogram images as normal case over 208 normal images, 62 benign mammogram images as benign over 63 benign images and 50 malignant mammogram images as malignant over 51 malignant images. Hence, the proposed system stated in this paper achieves 99.51% of DR for normal mammogram case, 98.41% of DR for benign case, and 98.03% of DR for malignant case. Hence, the average DR for the proposed breast cancer detection and segmentation system is nearly 98.65%. Sensitivity is the ability to identify cancer-affected mammogram images correctly and the Specificity is the ability to identify non-cancer affected mammogram images correctly. Accuracy is defined as the ability to detect cancer affected and normal mammogram images correctly. Positive predicted value is the likelihood that the mammogram images with a positive result have cancer-affected regions. Negative predicted value is the likelihood that mammogram images with a negative rate have normal regions only. DSC is the ratio of the number of cancer affected pixels in the mammogram images. All these parameters are calculated in % and vary [0–100]. They are described as.
TP and TN are the number of correctly segmented cancer and non-cancer pixels, respectively. FP and FN are the number of falsely segmented cancer pixels and non-cancer pixels, respectively. These TP, TN, FP and FN are computed between the final cancer region segmented mammogram image and the ground truth image available in open access dataset.
From the above Fig. 10, it can be observed that the comparison metric is evaluated using the existing and proposed methods in terms of accuracy. For x-axis the methods are taken, and in y-axis the accuracy value is plotted. The existing methods, such as FCM and SVM algorithms, provide lower accuracy whereas the proposed ANFIS algorithm provides higher accuracy for the given breast cancer dataset. Thus the result concludes that the proposed ANFIS algorithm increases the breast cancer classification accuracy through the best features. In this paper, the proposed breast cancer segmentation methodology is tested on the group of mammogram images to validate the proposed work’s efficiency. Tab. 3 shows the analysis of the proposed breast cancer detection and segmentation system. This proposed technique provided 97.9% Se, 98.5% of Sp, 97.4% of PPV, 97.7% of NPV, and 98.8% of Acc on the group of mammogram images from this open access dataset MIAS. The same performance is also achieved for all the mammogram images available in this dataset.

Figure 10: Accuracy comparison

Here, the significance of the proposed breast cancer segmentation method is analyzed regarding various segmentation algorithms and simulation outcomes are compared with other segmentation methods. The proposed method with region growing algorithm achieves 91.6% of Se, 92.9% of Sp, 93.1% of PPV, 93.3% of NPV, 94.1% of accuracy, and 93.7% of DSC. The proposed method with watershed segmentation algorithm achieves 90.5% of Se, 91.7% of Sp, 92.4% of PPV, 92.1% of NPV, 93.2% of accuracy, and 93.2% of DSC. Tab. 4 illustrates the impact of the segmentation algorithm on the proposed breast cancer segmentation methodology. From Tab. 3, it is evident that the proposed breast cancer segmentation methodology using a morphological segmentation algorithm achieves high-performance efficiency when compared with other segmentation algorithms.

Tab. 5 illustrates contrasts of suggested breast cancer detection and segmentation methodology with modern techniques. The efficiency of the proposed breast cancer detection and segmentation method is compared with existing approaches. Shrivastava et al. obtained 97.1% of Se, 97.3% of Sp, 96.1% of Acc, 94% of DR. Similarly, Suresh et al. obtained 96.5% of Se, 97.1% of Sp, 96.7% of Acc, 93% of DR. On the other hand, Ragab et al. obtained 96.8% of Se, 97.3% of Sp, 97.6% of Acc, 95% of DR. And, Chu et al. (obtained 96.3% of Se, 96.9% of Sp, 97.1% of Acc, 91% of DR. Tab. 3 shows that the proposed breast cancer detection and segmentation methodology stated in this paper achieved higher performance when compared with other existing approaches.

This paper proposes a fully computer-aided screening methodology for identifying the cancer areas in mammogram images utilizing the ANFIS classifier. This method initially enhances the low-intensity regions using wavelet enhancement method. To obtain the multi-resolution image, Gabor time-frequency transformation is applied to this improved image. Further, features are extracted from this image and classified through the ANFIS classification method. Here, the proposed breast cancer segmentation method is experimented on group of mammogram images to validate the proposed work’s efficiency. This paper correctly detects 207 normal mammogram images as normal case over 208 normal images, 62 benign mammogram images as benign over 63 benign images and 50 malignant mammogram images as malignant over 51 malignant images. Hence, the proposed system stated in this paper achieves 99.51% of DR for normal mammogram case, 98.41% of DR for benign case, and 98.03% of DR for malignant case. Hence, the average DR for the proposed breast cancer detection and segmentation method is nearly 98.65%. This proposed method yields 97.9% Se, 98.5% Sp, 97.4% of PPV, 97.7% of NPV and 98.8% of Acc on the group of mammogram images from this open access dataset MIAS. The same performance is also achieved for all the mammogram images available in this dataset. Here, the performance of the proposed breast cancer segmentation method is compared with various segmentation algorithms.
Acknowledgement: We show gratitude to anonymous referees for their useful ideas.
Funding Statement: The authors received no specific funding for this study.
Conflicts of Interest: The authors declare that they have no conflicts of interest to report regarding the present study.
1. H. Wang, J. Feng, Q. Bu, F. Liu, M. Zhang et al., “Breast mass detection in digital mammogram based on gestalt psychology,” Journal of Healthcare Engineering, vol. 2018, no. 5, pp. 1–13, 2018. [Google Scholar]
2. J. Suckling, J. Parker, D. Dance, S. Astley, I. Hutt et al., “Mammographic image analysis society (MIAS) databasev1.21 [Dataset],” 2015. https://www.repository.cam.ac.uk/handle/1810/250394. [Google Scholar]
3. K. Wadkar, P. Pathak and N. Wagh, “Breast cancer detection using ANN network and performance analysis with SVM,” International Journal of Computer Engineering and Technology, vol. 10, no. 3, pp. 75–86, 2019. [Google Scholar]
4. C. N. Brzymialkiewicz, M. P. Tornai, R. L. McKinley, S. J. Cutler and J. E. Bowsher, “Performance of dedicated emission mammotomography for various breast shapes and sizes,” Physics in Medicine and Biology, vol. 51, no. 19, pp. 5051–5064, 2006. [Google Scholar]
5. P. Lind, I. Igerc, T. Beyer, P. Reinprecht and K. Hausegger, “Advantages and limitations of FDG PET in the follow-up of breast cancer,” European Journal of Nuclear Medicine and Molecular Imaging, vol. 31, no. 1, pp. S125–S134, 2004. [Google Scholar]
6. T. Ratanachaikanont, “Clinical breast examination and its relevance to diagnosis of palpable breast lesion,” Journal of the Medical Association of Thailand, vol. 88, no. 4, pp. 505–507, 2005. [Google Scholar]
7. E. D. Übeyli, “Adaptive neuro-fuzzy inference systems for automatic detection of breast cancer,” Journal of Medical Systems, vol. 33, no. 5, pp. 353–358, 2009. [Google Scholar]
8. N. Shrivastava and J. Bharti, “Breast tumor detection and classification based on density,” Multimedia Tools and Applications, vol. 79, no. 35, pp. 26467–26487, 2020. [Google Scholar]
9. R. Suresh, A. N. Rao and B. E. Reddy, “Detection and classification of normal and abnormal patterns in mammograms using deep neural network,” Concurrency and Computation: Practice and Experience, vol. 31, no. 14, pp. 1–12, 2019. [Google Scholar]
10. D. A. Ragab, M. S. S. Marshall and J. Ren, “Breast cancer detection using deep convolutional neural networks and support vector machines,” Peer J, vol. 7, no. 1, pp. 1–23, 2019. [Google Scholar]
11. S. He, J. Ruan, Y. Long, J. Wang and C. Wu, “Combining deep learning with traditional features for classification and segmentation of pathological images of breast cancer,” in Int. Symp. on Computational Intelligence and Design (ISCID), Hangzhou, China, pp. 3–6, 2018. [Google Scholar]
12. R. Vijayarajeswari, P. Parthasarathy, S. Vivekanandan and A. A. Basha, “Classification of mammogram for early detection of breast cancer using SVM classifier and hough transform,” Measurement, vol. 146, no. 11, pp. 800–805, 2019. [Google Scholar]
13. N. Dhungel, G. Carneiro and A. P. Bradley, “A deep learning approach for the analysis of masses in mammograms with minimal user intervention,” Medical Image Analysis, vol. 37, no. 1, pp. 114–128, 2017. [Google Scholar]
14. J. Chu, H. Min, L. Liu and W. Lu, “A novel computer aided breast mass detection scheme based on morphological enhancement and SLIC superpixel segmentation,” Medical Physics, vol. 42, no. 7, pp. 3859–3869, 2015. [Google Scholar]
15. W. B. Yoon, J. E. Oh, E. Y. Chae, H. H. Kim, S. Y. Lee et al., “Automatic detection of pectoral muscle region for computer-aided diagnosis using MIAS mammograms,” BioMed Research International, vol. 2016, no. 5967580, pp. 1–7, 2016. [Google Scholar]
16. A. S. Setiawan, J. Wesley and Y. Purnama, “Mammogram classification using law’s texture energy measure and neural networks,” Procedia Computer Science, vol. 59, no. 1, pp. 92–97, 2015. [Google Scholar]
17. G. B. Huang, H. Zhou, X. Ding and R. Zhang, “Extreme learning machine for regression and multiclass classification,” IEEE Transactions on Systems, Man, and Cybernetics, Part B (Cybernetics), vol. 42, no. 2, pp. 513–529, 2011. [Google Scholar]
18. C. Gallego-Ortiz and A. L. Martel, “Improving the accuracy of computer-aided diagnosis for breast MR imaging by differentiating between mass and nonmass lesions,” Radiology, vol. 278, no. 3, pp. 679–688, 2016. [Google Scholar]
 | This work is licensed under a Creative Commons Attribution 4.0 International License, which permits unrestricted use, distribution, and reproduction in any medium, provided the original work is properly cited. |