DOI:10.32604/csse.2023.023374
| Computer Systems Science & Engineering DOI:10.32604/csse.2023.023374 | |
| Article |
Efficient Centralized Cooperative Spectrum Sensing Techniques for Cognitive Networks
1Department of Electronics and Communication Engineering, Jerusalem College of Engineering, Pallikaranai, Chennai, 600100, Tamil Nadu, India
2Department of Electronics and Communication Engineering, Vels Institute of Science, Technology & Advanced Studies, Pallavaram, Chennai, 600117, Tamil Nadu, India
*Corresponding Author: G. T. Bharathy. Email: bharathy@jerusalemengg.ac.in
Received: 06 September 2021; Accepted: 25 October 2021
Abstract: Wireless Communication is a system for communicating information from one point to other, without utilizing any connections like wire, cable, or other physical medium. Cognitive Radio (CR) based systems and networks are a revolutionary new perception in wireless communications. Spectrum sensing is a vital task of CR to avert destructive intrusion with licensed primary or main users and discover the accessible spectrum for the efficient utilization of the spectrum. Centralized Cooperative Spectrum Sensing (CSS) is a kind of spectrum sensing. Most of the test metrics designed till now for sensing the spectrum is produced by using the Sample Covariance Matrix (SCM) of the received signal. Some of the methods that use the SCM for the process of detection are Pietra-Ricci Index Detector (PRIDe), Hadamard Ratio (HR) detector, Gini Index Detector (GID), etc. This paper presents the simulation and comparative performance analysis of PRIDe with various other detectors like GID, HR, Arithmetic to Geometric Mean (AGM), Volume-based Detector number 1 (VD1), Maximum-to-Minimum Eigenvalue Detection (MMED), and Generalized Likelihood Ratio Test (GLRT) using the MATLAB software. The PRIDe provides better performance in the presence of variations in the power of the signal and the noise power with less computational complexity.
Keywords: Cohnitive radio network; collaborative spectrum sensing; sample covariance matrix; pietra-ricci index detector; cooperative spectrum sensing; generalized likelihood ratio test; maximum-to-minimum eigenvalue detection; volume-based detector number
Drastic expansion in the number of wireless communication users and applications has to lead an increase in the number of wireless standards and is anticipated to persist more rapidly in the future. Accordingly, the regulatory agencies, scientists, engineers, and wireless device manufacturers all have to face the challenge of implementing proficient wireless communication systems. Some of the difficulties faced are spectrum limitation, efficient spectrum utility, interferences, spectral crowding, etc. An approach of licensed spectrum leads to the wastage of spectrum resources. A set of new technologies takes advantage of the unlicensed spectrum such as Wi-Fi, Ultra-Wideband, Software-Defined Radio, and CR. Spectrum is immensely underutilized if the spectrum band is allotted to a particular company by the regulatory bodies. The CR idea has developed as a possible solution to the Radio Frequency spectrum shortage, discovering the variable nature of the spectrum work in space and time. It can adjust a dynamic policy of spectrum access in that uninhabited frequency bands can be speculatively utilized through Secondary Users (SUs).
To identify the existence of the Primary User (PU) signals, the SUs relate a procedure known as spectrum sensing, feasibly helped through a database of RF spectrum occupancy. Spectrum sensing can be prepared self-sufficiently through every SU. The former is exposed to issues that minimize the power of PU signal detection, shadowing, multipath fading, and hidden terminals [1]. The perception of CR comes from analyzing the future spectrum implications. Spectrum sensing is an important technique in CR network. Cooperation enhances the spectrum occupation decisions accuracy. In centralized CSS with data fusion that is measured the received signal samples; otherwise, derived quantities are communicated to a Fusion Center (FC) here, a test indicator is built and made the decision of global. Such a decision is noticed to the SUs that will participate for the band if it is empty, through means of several multiple access approaches [2].
This paper introduces the PRIDe for centralized data fusion CSS. This PRIDe test measurement is simply calculated from the components of the received signal SCM that creates it lesser complex. This approach contains the detectors GID, HR, AGM, VD1, MMED, and GLRT. The rest of the paper is structured as follows. Section 2 explains the related works. The CR Network explanation is presented in Section 3. Section 4 explains the sensing of spectrum in cognitive networks. Section 5 presents the types of centralized CSS. Several detectors are described in Section 6. Section 7 presents the simulation parameter. Numerical results are given in section 8. Finally, the conclusions are present in Section 9.
A collaborative spectrum sensing for CR network is explained in [3]. Detailed analysis and comparison of various spectrum sensing techniques and have presented a scheme for coverage area restoration when the failure of nodes is presented in [4,5]. A novel GIID for cooperative cognitive networks is designed in [6]. A concept of multidimensional correlations in cooperative cognitive networks is explored in [7]. The GLRT is derivative by several primary data, and secondary data comprise noise. The GLRT is exposed to be the invention of Kelly’s GLRT. These detectors offer a respectable adjustment between the denial of mismatched signals and the recognition of matched signals. It also comprised in the null hypothesis is explained in [8].
A novel hybrid scheme by applying [9] in Theorem and [10] test metric-based spectrum sensing is described in [11]. PRIDe utilized for cooperative sensing of the spectrum is discussed in [12]. The PRIDe is frequently utilized in social sciences and economics for evaluating inequality. The index is altered to the scenario of CSS. The PRIDe employs the index to differentiate the received signal sample covariance matrices shapes in the conditions of existence and nonexistence of the primary sensed signal is illustrated in [13]. The HR test is a vigorous signal detection analysis of multivariate. It is dedicated to the precise recognition function of the HR for healthy spectrum sensing is described in [14]. The recent different modern wireless communications are explained in [15].
A survey on CSS in CR networks is reviewed and presented in [16]. The optimization algorithms for the cooperative sensing of the spectrum in CR networks are explained in [17]. An artificial neural network-based Gini index test metric detector is described in [18]. A scheme for imbalanced data using a weighted Gini index is presented in [19]. A CR system for efficient spectrum utilization is modeled in [20,21]. Collaborative sensing of spectrum in a real CR network is presented in [22]. The various digital communication techniques are explained in [23].
A detailed description of various wireless communications principles practices is presented in [24]. The CR network and a spectrum sensing scheme based on matched filter detection are reviewed in [25,26], respectively. The collaborative wireless sensor network and also its applications are explained in [27]. Deficiency and Signal existence cases are distinguished through VD1. The Gaussian noise postulation detectors’ decision thresholds are accurately computed through the random matrix theory. VD1 analyzed the spectrum sensing capable of offering the desirable properties of noise and constant false-alarm rate [28].
Primary/Main user and SU/Cognitive user are vital parts of a CR networks. PU: A user with privileged priority or rights on the utilization of a precise fraction of the spectrum. SU: A user who has a lower priority. The chief tasks of CRs are: controlling power, spectrum sensing, wideband, and spectrum management. Identifying unemployed spectrum and sharing the same by avoiding dangerous intrusion to other user and this mechanism is named as spectrum sensing and sharing. Fig. 1 illustrates the CR networks. CR network is a combination of three type of networks: such as primary networks, CR network with infrastructure and without infrastructure. Unlicensed Band contains CR user and Licensed Band 1 consist of PU, CR user, primary base station, CR base station and spectrum border. Licensed Band II contains CR user, primary base station, and PU.
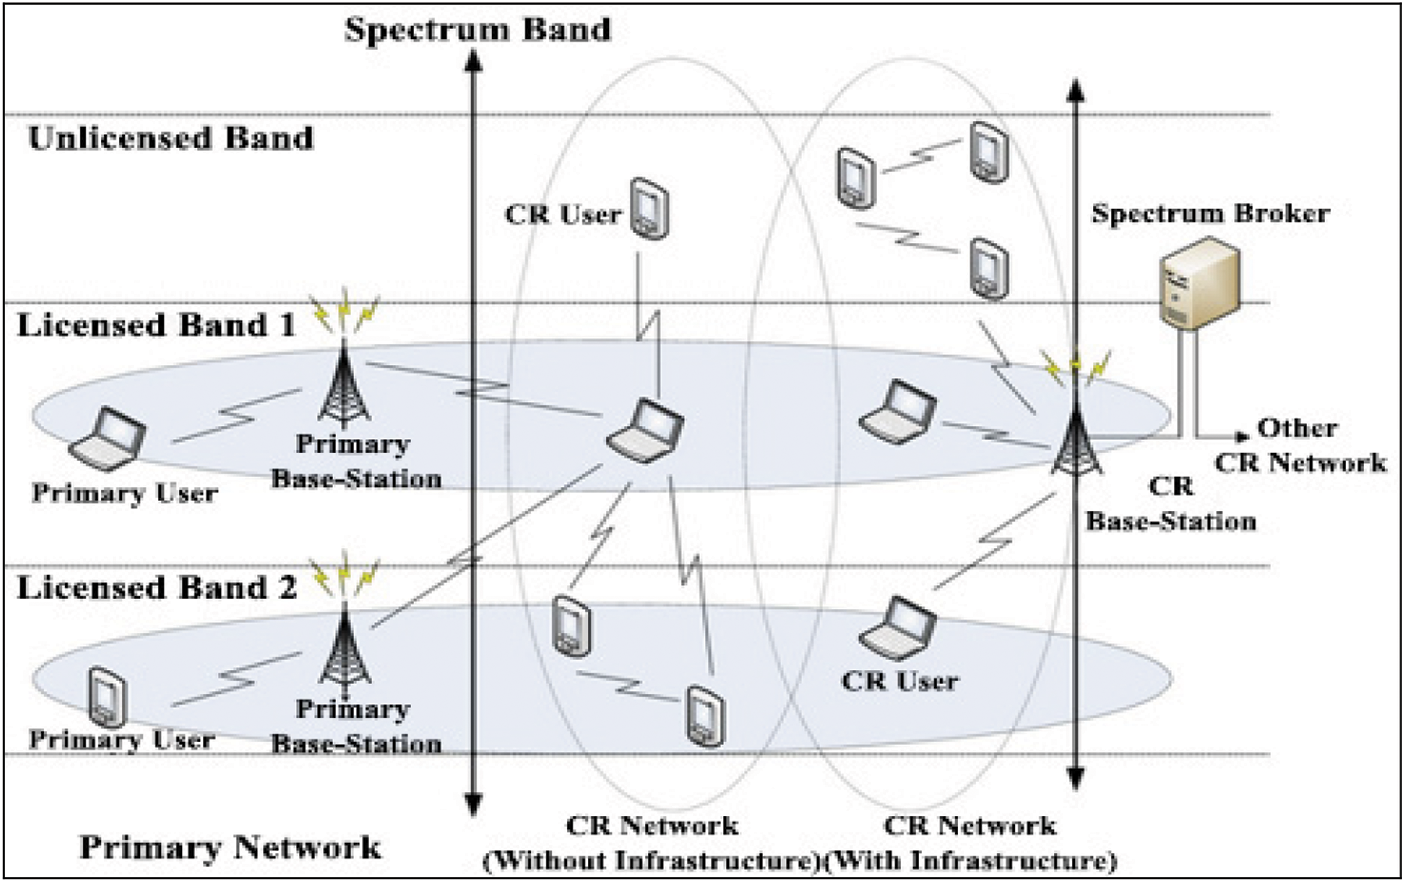
Figure 1: Illustration of cognitive network
4 Sensing of Spectrum in Cognitive Networks
Fig. 2 illustrates the spectrum sensing. It consists of a PU, number of SUs, and a FC. The SUs access the PU channel then SU reports the PU signal information from the FC.
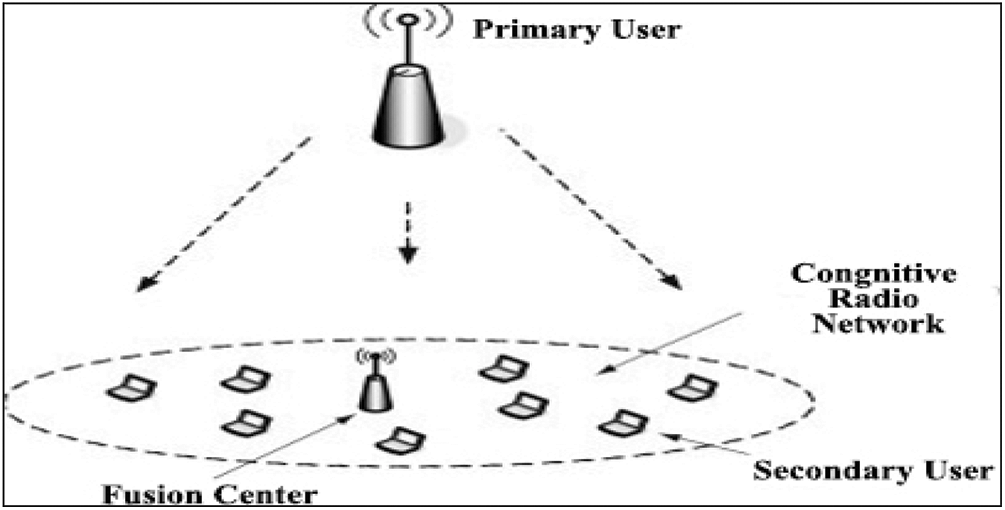
Figure 2: Illustration of spectrum sensing
The main base station transmits the spectrum to the fusion center, where the spectrum is sensed and shared to the cognitive users, i.e., the secondary base stations. Spectrum sensing is broadly categorized as single spectrum user sensing, cooperative sensing of the spectrum and interference-based sensing of the spectrum.
4.1 Single User Spectrum Sensing
It facilitates the cognitive user to identify the existence/non-existence of PU and consequently decides the communication approach.
Cooperative sensing of the spectrum is utilized to prevail over the channel effects and makes the most of the site diversity to identify even a feeble primary signal. The existence of a malicious user depreciates the detection performance of cooperative sensing of the spectrum. Fig. 3 illustrates the CSS. From this Fig. 3 the SU sense and detect the PU by the local spectrum. Next, the SU access the PU signal and report this information to the FC. Finally, the FC makes a global decision to check the information received SU is reliable or an attacker.
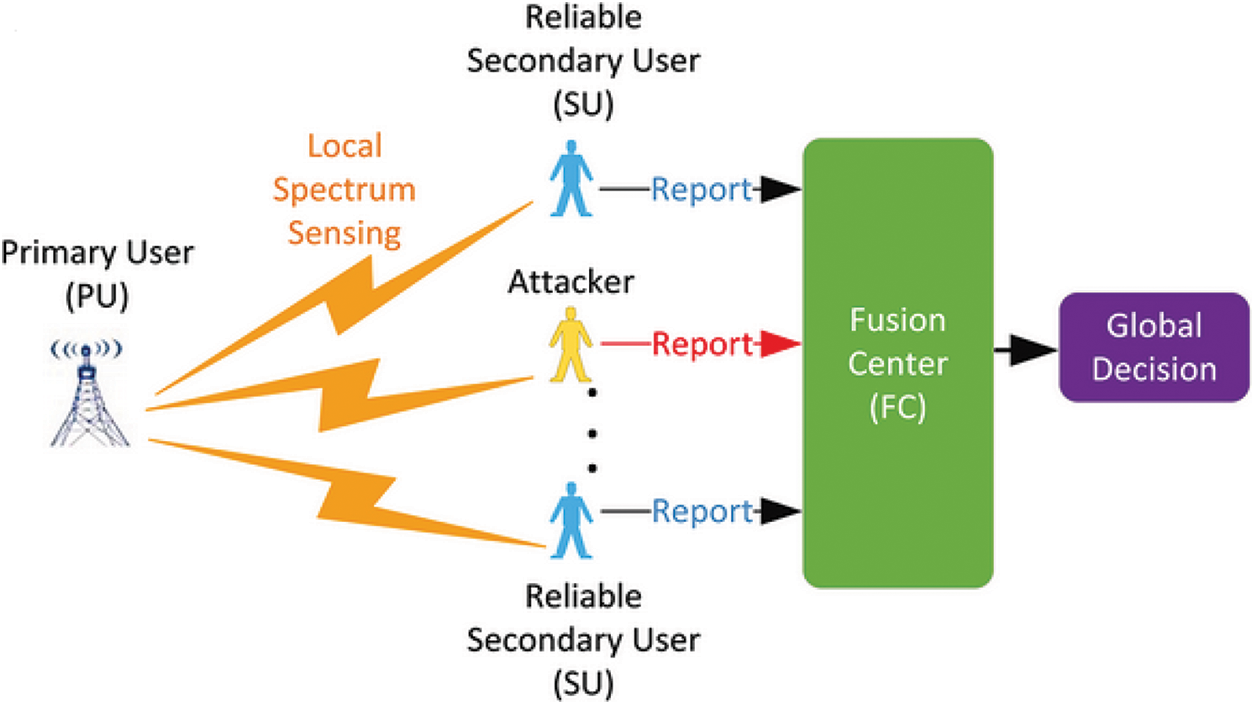
Figure 3: Illustration of CSS
4.3 Design Challenges for Spectrum Sensing
The design of the spectrum sensing techniques in CR experiences certain definite challenges, which include low sensing Signal to Noise Ratio (SNR) (the necessary sensitivity is as low as –20 dB), the uncertainty of the channel (characteristics of the channel is varying with time and is unknown), noise uncertainty (noise characteristics is unknown and vary with time), non-synchronization (difficulty in synchronizing the main signal and the received signal), interferences (interference may be from intended or unintended transmitters), etc.
In centralized cooperative sensing of the spectrum, a fusion center gathers sensing data from cognitive users. The FC identifies the accessible spectrum and transmits this data to various other cognitive users. Based on the method of data sharing between the cognitive users, they are classified into two broad categories, namely partially cooperative network (every cognitive user identifies the channel separately and straightforwardly sends its sensing data to the FC and totally cooperative network (cognitive users cooperatively sends each other’s sensing data, and then transmits data to the FC. Figs. 4 and 5 illustrate a partially cooperative network and a totally cooperative network. Fig. 4 contains PU and CR users. In a partially cooperative network, CR users do not send the sensing data among other CR users. Fig. 5 comprises PU and CR users. In a totally cooperative network, CR users send the sensing data among other CR users.
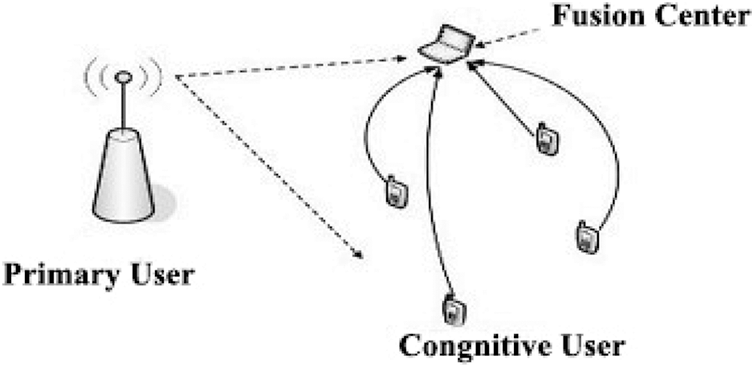
Figure 4: Illustration of partially cooperative network
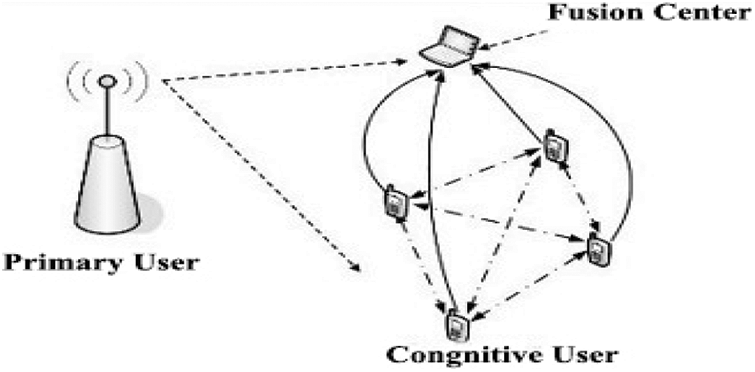
Figure 5: Illustration of totally cooperative network
The cognitive users collaborate by sharing their local examinations to the FC, to make an absolute decision on if H1 or H0 is correct. Two sets of fusion algorithms are hard information combining algorithm and soft information combining algorithm.
Existing statistical metric, explicitly an index which is assessed of inequalities, named as the Pietra-Ricci index. This type of index is adjusted to the scenario of CSS. It applies the index to differentiate the shapes of the received signal sample covariance matrices in the conditions of existence as well as the nonexistence of the primary sensed signal. The PRIDe is simple, vigorous beside time-varying noise as well as received signal powers, reveals the constant rate of false alarm rate, and outperforms state-of-the-art detectors in several conditions. The Pietra-Ricci index is given by
Here
Here
The GID with less complexity is presented for CSS in CR networks. GID has a lesser computational complexity, they are vigorous against variations in the received signal as well as noise powers, they do not essential awareness about the features of the sensed signal as well as the noise power, significance that which are wholly blind detectors, also they have the property of continuous false alarm rate. The GID important feature is to provide high performance while the sensed signal has a leading propagation. The Gini index is a statistical dispersion metric extensively utilized in economic and social sciences to assess inequalities. GID test metric is represented as,
The HR Detector utilizes a double-tuned transformer for converting the instantaneous frequency changes of the input signal to instantaneous amplitude changes. The precise distribution of the HR Detector metrics under the null hypothesis is written by using the Mellin transform. This expression is difficult to be evaluated numerically; moment-based approximation under the null hypothesis is used. Specifically, that creates an intricate, however closed-form expression for the false-alarm possibility. A humbler and tight closed-form approximation for both the false-alarm and detection possibilities uses a moment-based HR Detector statistical dissemination approximation under both hypotheses. HRD test metric is represented as,
Here,
The VD1 is used to identify the main users in a smart approach; a new viewpoint is planned for spectrum sensing. In the signal, existence and non-existence are obtained from the determinant of SCM or volume difference between the cases of presence signal and absence signal. With the usage of RMT, precisely yield the theoretical choice threshold for one of the detectors below the Gaussian noise assumption. VD1 test metric is represented as,
here
The random arrivals of primary user signals and the timing mismatch issue have to be taken into account for sensing the spectrum in CR networks. GLRT detector is utilized to prevail over that issue. The GLRT is derived by multiple primary data as well as a set of secondary data comprises noise. The GLRT is the accepted method; meanwhile, it has several tempting properties. For example, it is the uniformly most powerful test under definite conditions. GLRT test metric is represented as
Here,
It can be utilized to identify the existence of the signal. Using the random matrix theory, the ratio can be quantized to find the threshold. Eigen values are a unique set of scalars associated with a linear system of equations. MMED test measurement to identify the presence of PUs signal; thus, it enhances the spectrum efficiency. MMID test metric is represented as,
The arithmetic mean is greater than geometric mean, the causing the detector calculates the AGM of the sample covariance matrix Eigen values and equates with a threshold. AGM is represented as,
7 Simulation Parameter Settings
The CSS is simulated for Ricean channel using R2014 MATLAB software by setting the following parameters given in Tab. 1.
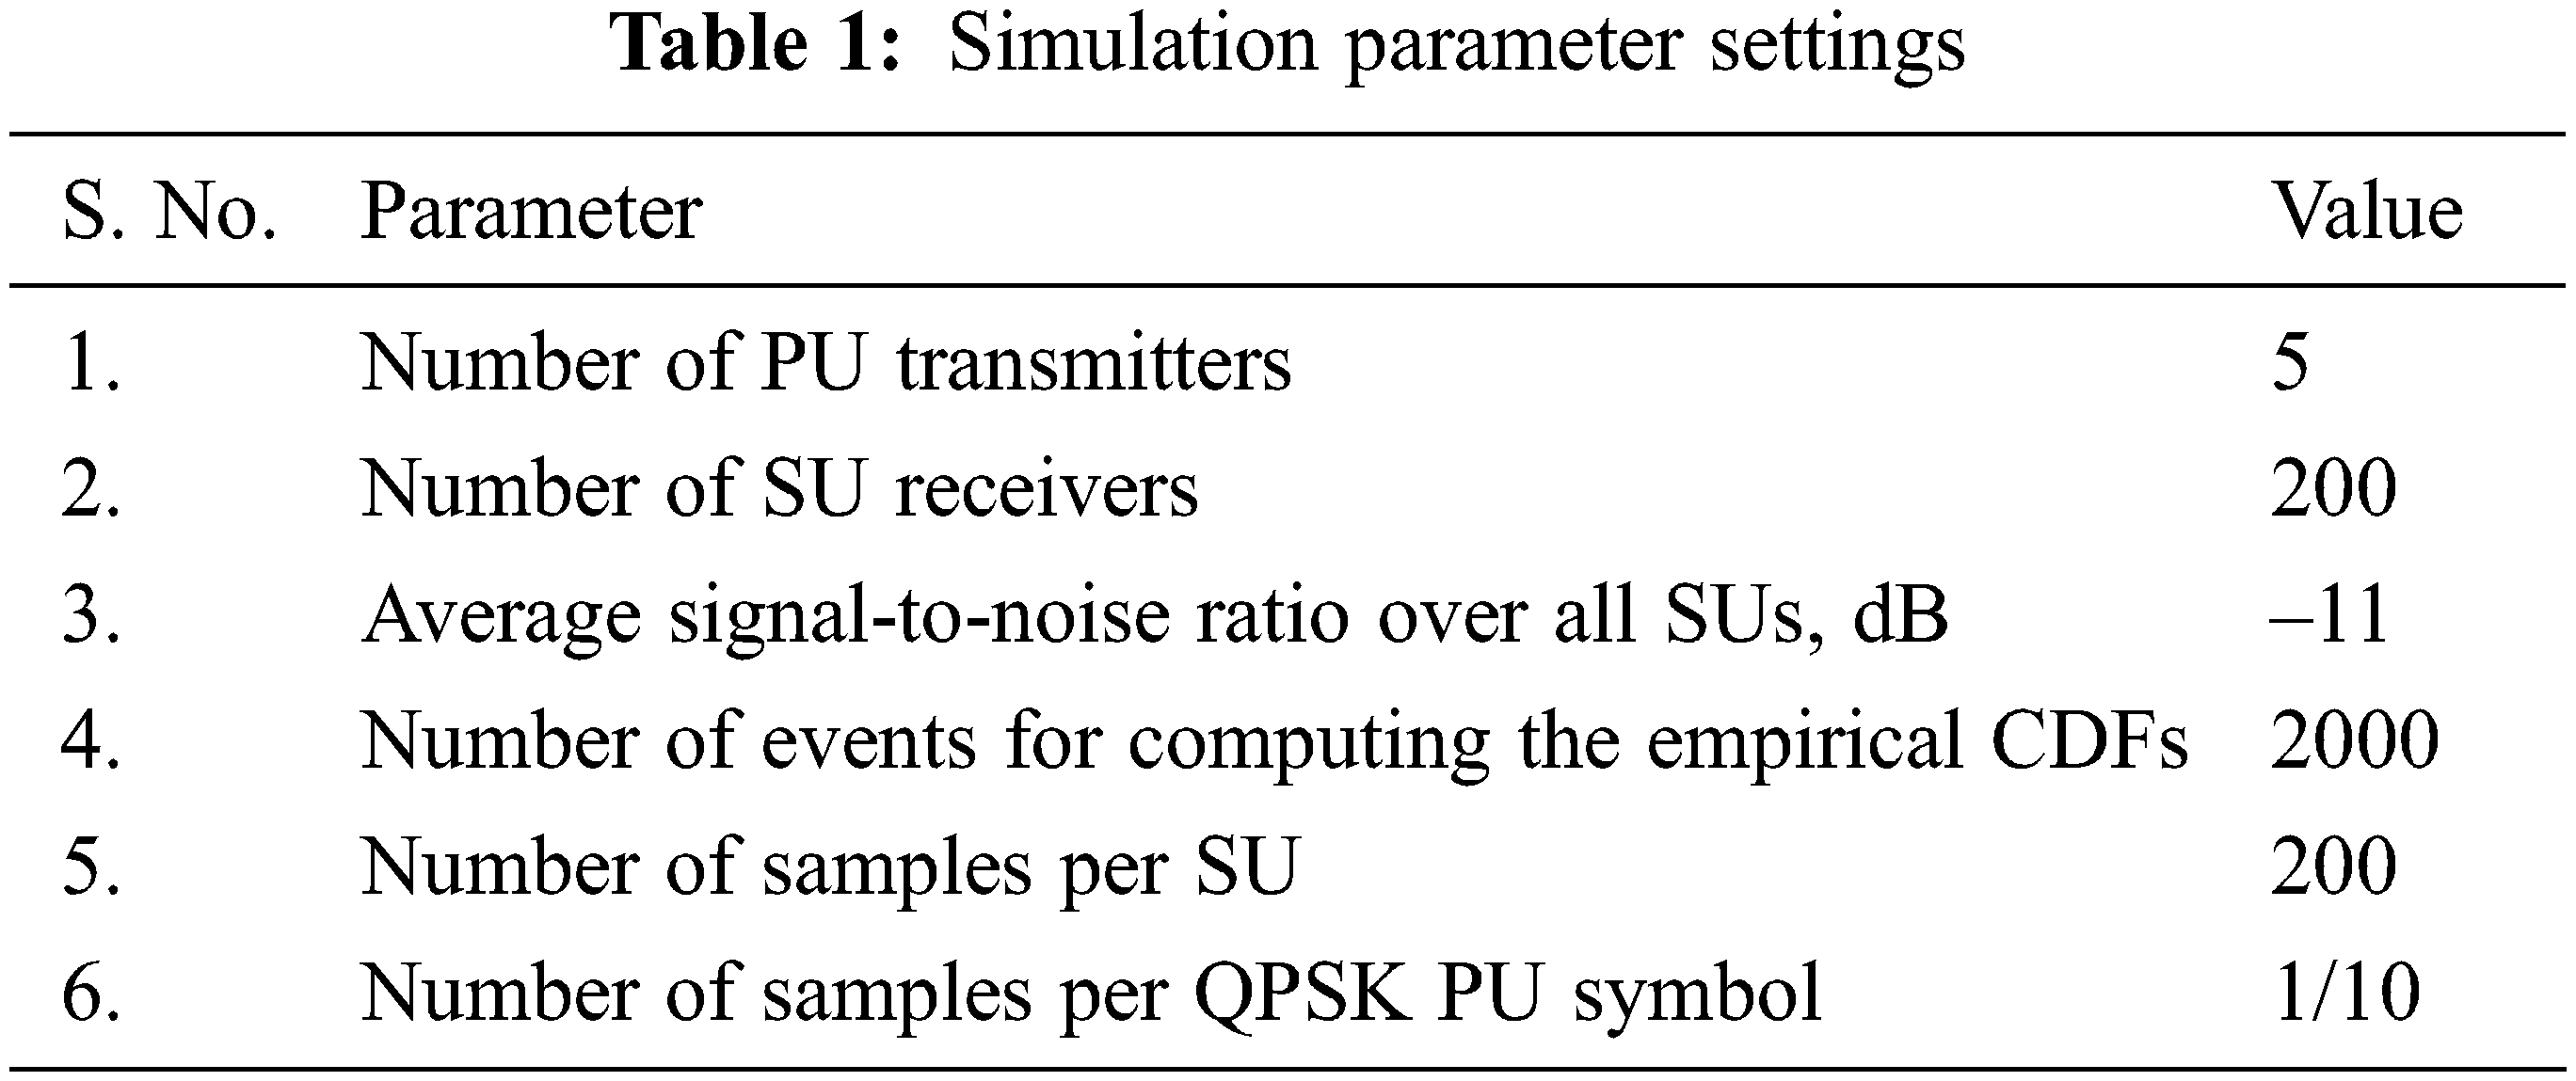
Fig. 6 illustrates the flowchart of the coding. Here, the Rice factor is defined as the ratio of the specular power to dispersed power [29]. The algorithm steps are given below.
Step 1: Start the program.
Step 2: Initialize the parameters (Rice factor, Number of PU transmitters, Number of SU receivers, Number of samples per SU, Average signal-to-noise ratio over all SUs, and Fraction of noise power variations about the mean).
Step 3: Enable only the set of parameter values to be varied.
Step 4: Measure the test statistics for PRIDe, GID, HR, VD1, GLRT, MMED, and AGM detectors.
Step 5: By varying the parameter Rice factor the plot of Rice factor vs. detection probability is obtained.
Step 6: By varying the parameter Number of PU transmitters, plot the Number of PU transmitters vs. the probability of detection is obtained.
Step 7: Similarly, by varying other parameters plot of the corresponding varying parameter vs. probability of detection can be obtained.
Step 8: End the program.
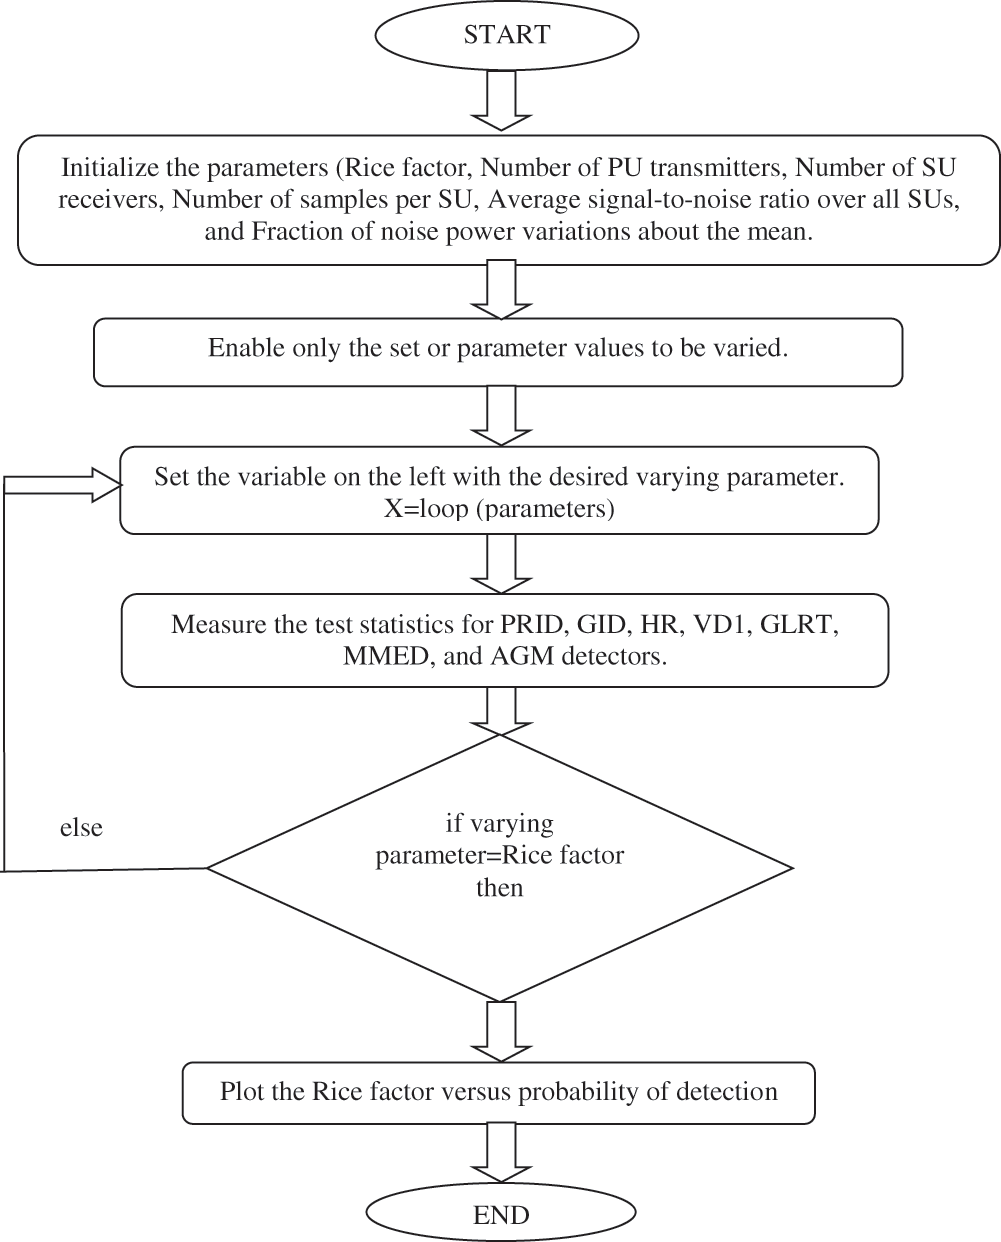
Figure 6: Flow chart for simulation
8.1 Detection Probability (
Fig. 7 illustrates the
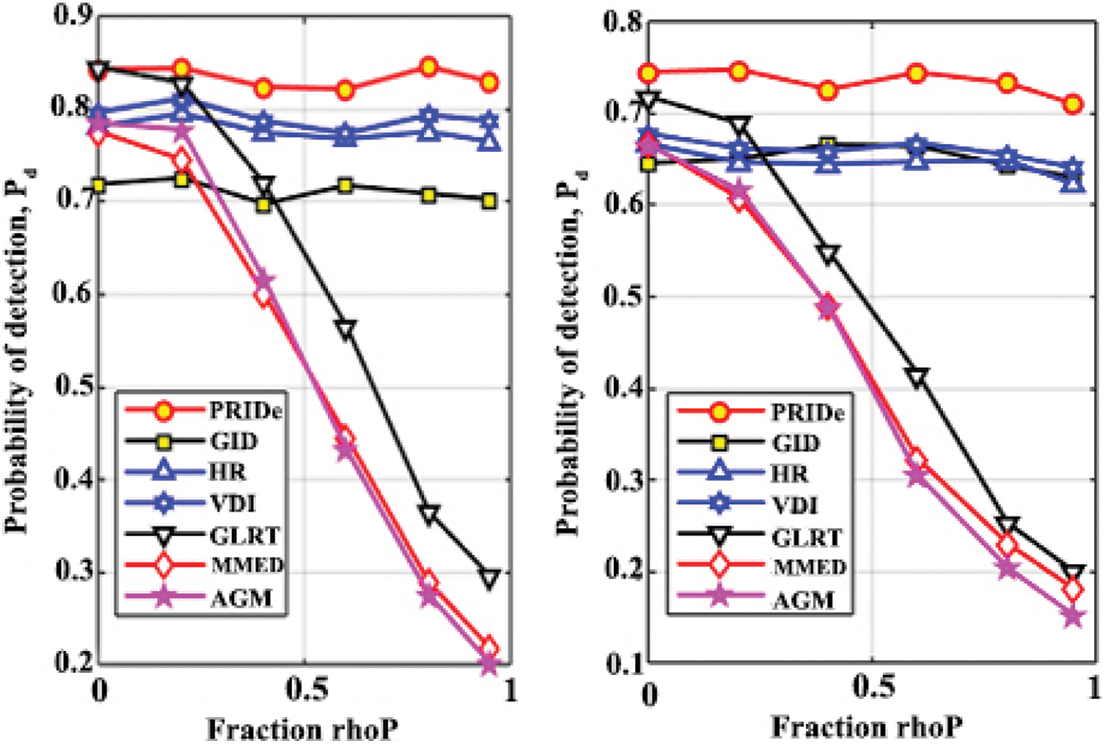
Figure 7: Plot of Pd against rhoP urban area (left); rural area (right)
8.2 Detection Probability vs. Average SNR
Fig. 8 shows the
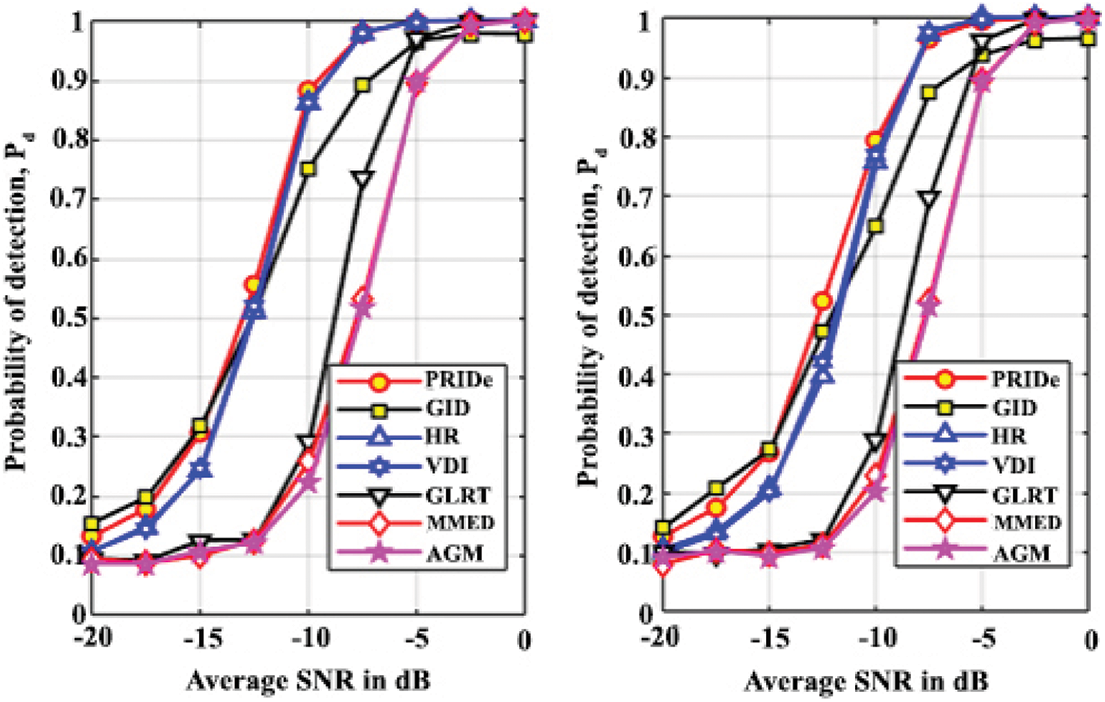
Figure 8: Plot of Pd against SNR urban area (left); rural area (right)
This paper presents the simulation and comparative performance analysis of PRIDe with various detectors like GID, HR, AGM, VD1, MMED, and GLRT. Spectrum sensing is a vital task of CR to avert destructive intrusion with licensed PUs and discover the accessible spectrum for the efficient utilization of the spectrum. Centralized CSS is a kind of spectrum sensing. On the whole, it is concluded that PRIDe CSS technique provides an efficient performance compared to GLRT, MMED, AGM, HR, and VD1 detectors. In addition, it observed that the GID and the PRID are close to one another if the surroundings change from urban to rural. This is because of the fact that rural regions have a large value of Rice factor compared to urban areas. Furthermore, the PRIDe is vigorous against received signal and noise powers and performs detectors in several conditions.
Funding Statement: The authors received no specific funding for this study.
Conflicts of Interest: The authors declare that they have no conflicts of interest to report regarding the present study.
1. I. Develi, “Spectrum sensing in cognitive radio networks: Threshold optimization and analysis,” EURASIP Journal on Wireless Communications and Networking, vol. 2020, no. 1, pp. 1–19, 2020. [Google Scholar]
2. M. Ranjeeth, S. Anuradha and S. Nallagonda, “Optimized cooperative spectrum sensing network analysis in nonfading and fading environments,” International Journal of Communication Systems, vol. 33, no. 5, pp. e4262, 2020. [Google Scholar]
3. K. Arshad and K. Moessner, “Collaborative spectrum sensing for cognitive radio,” in IEEE Int. Conf. on Communications Workshops, Dresden, Germany, pp. 1–5, 2009. [Google Scholar]
4. G. T. Bharathy, V. Rajendran, T. Tamilselvi and M. Meena, “A study and simulation of spectrum sensing schemes for cognitive radio networks,” in 7th Int. Conf. on Smart Structures and Systems, Chennai, India, pp. 1–11, 2020. [Google Scholar]
5. G. T. Bharathy, S. Bhavanisankari, T. Tamilselvi and G. Bhargavi, “An energy - efficient approach for restoring the coverage area during sensor node failure,” in Int. Conf. on Inventive Computation Technologies, Lecture Notes in Networks and Systems, S. Smys, R. Bestak, Á Rocha (Eds.Coimbatore, India, pp. 594–605, 2020. [Google Scholar]
6. D. A. Guimarães, “Gini Index Detector (GID) for collaborative spectrum sensing,” 2018. [Online]. Available: https://doi.org/10.24433/CO.882F10BA-FF34-449D-BBFF-D49A7B103580. [Google Scholar]
7. D. Xue, E. Ekici and M. C. Vuran, “Cooperative spectrum sensing in cognitive radio networks using multidimensional correlations,” IEEE Transactions on Wireless Communications, vol. 13, no. 4, pp. 1832–1843, 2014. [Google Scholar]
8. O. Besson, A. Coluccia, E. Chaumette, G. Ricci and F. Vincent, “Generalized likelihood ratio test for detection of Gaussian rank-one signals in Gaussian noise with unknown statistics,” IEEE Transactions on Signal Processing, vol. 65, no. 4, pp. 1082–1092, 2016. [Google Scholar]
9. G. T. Bharathy, V. Rajendran, M. Meena and T. Tamilselvi, “Research and development in the networks of cognitive radio: A survey,” in Sustainable Communication Networks and Application. Lecture Notes on Data Engineering and Communications Technologies, vol. 55, Singapore: Springer, pp. 1–15, 2021. [Google Scholar]
10. G. T. Bharathy, V. Rajendran, S. Bhavanisankari and V. Balaji, “Gini index test metric based collaborative sensing of spectrum for cognitive networks,” Journal of Physics: Conference Series, vol. 1964, pp. 1–10, 2021. [Google Scholar]
11. D. A. Guimarães, “Hybrid Spectrum sensing test statistic based on the gershgorin theorem and on the gini index,” Centro, vol. 31, pp. 1–6, 2019. [Google Scholar]
12. D. A. Guimarães, “Pietra-Ricci index detector for centralized data fusion cooperative spectrum sensing,” IEEE Transactions on Vehicular Technology, vol. 69, no. 10, pp. 12354–12358, 2020. [Google Scholar]
13. D. A. Guimarães, “Gini index inspired robust detector for spectrum sensing over Ricean channels,” Electronics Letters, vol. 55, no. 12, pp. 713–714, 2019. [Google Scholar]
14. L. Huang, Y. Xiao, H. C. So and J. Fang, “Accurate performance analysis of Hadamard ratio test for robust spectrum sensing,” IEEE Transactions on Wireless Communications, vol. 14, no. 2, pp. 750–758, 2014. [Google Scholar]
15. S. Haykin and M. Moher, “Mobile Networks,” in Modern wireless communications, 1st ed., NJ, USA: Prentice-Hall, pp. 284–302, 2004. [Google Scholar]
16. I. F. Akyildiz, B. F. Lo and R. Balakrishnan, “Cooperative spectrum sensing in networks: A survey,” Physical Communication, vol. 4, no. 1, pp. 40–62, 2011. [Google Scholar]
17. K. Arshad, M. A. Imran and K. Moessner, “Collaborative spectrum sensing optimisation algorithms for networks,” International Journal of Digital Multimedia Broadcasting, Hindawi Publishing Corporation, Article ID 424036, vol. 2010, pp. 1–20, 2010. [Google Scholar]
18. A. L. Lemes, D. A. Guimarães and Y. M. Masselli, “System-to-distribution parameter mapping for the Gini index detector test statistic via artificial neural networks,” Computers & Electrical Engineering, Article ID 106692, vol. 85, pp. 1–12, 2020. [Google Scholar]
19. H. Liu, M. Zhou, X. S. Lu and C. Yao, “Weighted Gini index feature selection method for imbalanced data,” in IEEE 15th Int. Conf. on Networking, Sensing and Control, Zhuhai, China, pp. 1–6, 2018. [Google Scholar]
20. M. Meena, M. Monisha, C. Sharanya and V. Rajendran, “Modeling of cognitive radio system for the improvement of spectrum utilization,” International Journal of Engineering & Technology, vol. 7, no. 2.33, pp. 231–234, 2018. [Google Scholar]
21. M. Meena and V. Rajendran, “Spectrum sensing and resource allocation for proficient transmission in cognitive radio with 5G,” IETE Journal of Research, vol. 13, no. 1, pp. 1–17, 2019. [Google Scholar]
22. T. Manna and I. S. Misra, “Collaborative spectrum sensing in real cognitive radio network,” in Int. Conf. on Advances in Computing Communications and Informatics, Mysore, India, pp. 137–142, 2013. [Google Scholar]
23. J. G. Proakis, “Digital communication through fading multipath channels,” in Digital Communications, 4th ed., NJ, USA: Mc Graw Hill, pp. 777–778, 2001. [Google Scholar]
24. T. S. Rappaport, “An overview of key wireless technologies,” in Wireless communications principles practice, 2nd ed., NJ, USA: Prentice Hall, pp. 1–8, 2000. [Google Scholar]
25. B. Thangalakshmi and G. T. Bharathy, “Review of cognitive radio network,” International Journal of MC Square Scientific Research, vol. 7, no. 1, pp. 10–17, 2015. [Google Scholar]
26. B. Thangalakshmi and G. T. Bharathy, “Matched filter detection based spectrum sensing in cognitive radio network,” International Journal of Emerging Technology in Computer Science and Electronics, vol. 22, no. 2, pp. 151– 154, 2016. [Google Scholar]
27. R. Zhu, M. Ma, Y. Zhang and J. Hu, “Collaborative wireless sensor networks and applications,” International Journal of Distributed Sensor Networks, vol. 2015, no. 8, pp. 1–2, 2015. [Google Scholar]
28. C. S. Preetham, C. Mahesh, C. S. Haripriya, R. Anirudh and M. S. Sireesha, “Spectrum sensing in cognitive radio by use of volume-based method,” International Journal of Engineering and Technology, vol. 7, no. 2, pp. 34–39, 2018. [Google Scholar]
29. J. Li and S. Li, “Interference of cognitive wireless networks on rayleigh and rice fading channels,” International Journal of Distributed Sensor Networks, vol. 10, no. 3, pp. 236891, 2014. [Google Scholar]
 | This work is licensed under a Creative Commons Attribution 4.0 International License, which permits unrestricted use, distribution, and reproduction in any medium, provided the original work is properly cited. |