DOI:10.32604/csse.2023.024297
| Computer Systems Science & Engineering DOI:10.32604/csse.2023.024297 | |
| Article |
Arrhythmia Prediction on Optimal Features Obtained from the ECG as Images
Department of Computer Science, King Khalid University, Abha, Kingdom of Saudi Arabia
*Corresponding Author: Fuad A. M. Al-Yarimi. Email: fuadalyarimi@gmail.com
Received: 12 October 2021; Accepted: 31 December 2021
Abstract: A critical component of dealing with heart disease is real-time identification, which triggers rapid action. The main challenge of real-time identification is illustrated here by the rare occurrence of cardiac arrhythmias. Recent contributions to cardiac arrhythmia prediction using supervised learning approaches generally involve the use of demographic features (electronic health records), signal features (electrocardiogram features as signals), and temporal features. Since the signal of the electrical activity of the heartbeat is very sensitive to differences between high and low heartbeats, it is possible to detect some of the irregularities in the early stages of arrhythmia. This paper describes the training of supervised learning using features obtained from electrocardiogram (ECG) image to correct the limitations of arrhythmia prediction by using demographic and electrocardiographic signal features. An experimental study demonstrates the usefulness of the proposed Arrhythmia Prediction by Supervised Learning (APSL) method, whose features are obtained from the image formats of the electrocardiograms used as input.
Keywords: ECG records; electrocardiogram; morphological features (MF); empirical mode decomposition algorithm; HOS
ECGs are representations of the electrical activity of the heart muscle that varies over time, which is generally archived on paper for easier analysis. The cardiac muscle responds to electrical depolarization of its cells, as do other muscles. In an ECG, electrical activity aggregation is recorded & amplified for a few seconds, which reflects the variation in the electrical potential graph produced by the heart & measured at the body’s surface. Currently, clinical information of patients has changed among health care providers. From ECG, the parameters are measured very extensively from ECG records. It would be very effective if the paper type of ECG records could be converted into digital files. Furthermore, the novel pre-requisites justify the need for tools in converting current ECG records to digital format, mainly for retrospective contributions. In the work [1,2] a computer program is presented for the conversion of ECG paper charts into ECG files digitally. Usually, ECG paper charts can be divided into three kinds: background with grid collared, background with the grid as black, and background without any grid, uniform background. In hospitals, the ECG signals are generally recorded on benchmark grid papers in hospitals in during the regular clinical investigation for potential cardiac failure diagnosis. The goal is to convert current ECG paper records into electronic forms for retrieval purposes aimed at clinical use. Observe that published reports of ECG contain some annotations as well as characters when examining an ECG strips image. These characters need to be removed here. Noise eradication and image enhancement algorithms will also be necessary to improve the digitization process’ accuracy [3]. Furthermore, this research proposes an efficient method for extracting digital signals from the strips of ECG paper.
The paper is organized as follows: Section 1 presents the introduction, which discusses the use of demographic and electrocardiogram signaling features to predict arrhythmias. In Section 2, was present different research models, and studies conducted on arrhythmia prediction based on electrocardiogram signaling features. In Section 3 was present novel supervised learning based on features obtained from the ECG (Electrocardiogram). The experimental study and its results are described in Section 4, while the conclusion is discussed with references in Section 5.
The work [4] extracted features based on ECG morphology, RR interval (The time elapsed between two successive R-waves of the QRS signal on the electrocardiogram) & heart-beat interval from 2 divergent leads. There were 2 linear distinguished classifier methods utilized for the classification. The heart-beat classification towards the arrhythmia class is attained by integrating the outputs of the classifier. Here, the system performance validated the requirement to detect the features, which differentiate beats of Class N clearly from beats of class F & S.
The work [5,6] projected a method where ICA (Independent component analysis) & wavelet-transform could be utilized for extracting information of RR, & morphological features (MF) are added besides with MF. The PCA is utilized for lessening dimensionality. The SVM (Support Vector Machin) is utilized for classification into one of 5 arrhythmia categories. The outcomes envisioned poor performance on S class is because of some samples of data. The work [7] projected a hybrid method by utilizing stable interval features of wave shape and segmentation. The classifier called linear discriminant is utilized. The projected method can generate maximum accuracy & also balance the execution to discriminate class V & S.
The classification framework is cost-sensitive and utilizes morphological descriptor features based on FFT and RR interval and is attained by a classifier called SVM [1] by attaining an average accuracy of 97.2%. Nevertheless, the above architecture is evaluated by randomly selecting ten records from the arrhythmia database of MIT_BIH. The framework of PSO_SVM in incorporation by a polyphase depiction of a filter bank is projected in [8] for classifying 6 arrhythmia classes, which are examined with 20 patients’ recordings.
When we consider the literature on the classification of heart-beat, it could be perceived that the MIT-BIH database of arrhythmia [9] is a popular choice. Here, the required heart-beat classification literature utilizing this database could be classified into 2 kinds based on evaluation procedure such as subject-oriented & class-oriented. The works [8,10–19] present that most of them work based on class-oriented.
In the class-oriented method, from 16 kinds of beats incorporating general ones in the database of MIT, the overall or part beats collection is recommended for classification. The work [19] presents those 17 kinds of heart-beats incorporating pacemaker & normal were categorized by utilizing features based on several power density spectrum models. Further, the new GA is utilized for detecting optimal features for augmenting the classification procedure. At last, these chosen features were fed to several standard ML algorithms.
The work [20] presents that an algorithm of heart-beat classification is designed by utilizing morphological & dynamic features of ECG. For the extraction procedure of morphological features, the integration of the wavelet transforms & the dimensionality lessening scheme, called ICA (independent component analysis), is applied to heart-beats. The intervals R-R are utilized to be dynamic-features. Here, these features were fed into SVM to classify 16 kinds of heart-beats. The work [21] presents a new genetic ensemble ML classifiers model is projected. The novel genetic coupled training with genetic simplification is utilized for categorizing 17 heart-beat kinds. The work [22] presents that nonlinear & statistical features were derived from the EMD algorithm (Empirical mode decomposition). Further, these features were offered one against another, where SVM is utilized for categorizing 5 heart-beat types.
The work [3] presents that ventricular extra ectopic or systole beats were classified with the morphology matching assistance, clustering algorithms & R-R intervals. The work [12] presents those 17 kinds of ECG beats that were categorized by utilizing local hexadecimal patterns computed from sub-bands wavelet. The work [23] presents those 5 primary kinds of heart-beats were categorized by utilizing EEMD (empirical ensemble mode decomposition) based features exposed to SMO-SVM (sequential minimum optimization)-SVM. Also, NN acts as a prominent role in the biological analysis of signals [24]. Contemporarily, class-oriented strategies based on deep-learning came into existence. The schemes of deep learning are a part of ML schemes applied based on more hidden NN.
The work [25] presents those 17 kinds of heart-beats that were categorized by utilizing ID-CNN & new three-layer ensemble deep genetic classifiers. In the subject-oriented method, the overall database of MIT-BIH is segmented into 5 clusters of heart-beats as per ANSI/AAMI. The list of these clusters is ventricular ectopic, supraventricular ectopic, unknown, non-ectopic & fusion. Again 2 schemes were perceived to categorize these divergent clusters: inter-patient & intra-patient strategies. The basic disagreement among these 2 schemes is the departure of testing & training datasets. The work [9] presents those models based on intra-patient strategy that are explored extensively in this review. Nevertheless, these models have a minimum effect in real-world cases. Due to real-time implementations, the unrecognized subject, who generally undergoes testing, would be foreign towards the constructed method. Hence, the method is sufficient for capturing inter-individual changes among ECG. When the intra-patient method is being designed, there is a scope of possessing common information subjects in both testing & training. For mitigating such a problem, the work [8] classified heart-beat based on inter-patient. The entire database of MIT-BIH is segmented into 2 clusters. One cluster is allocated for training, and the other is to test by ensuring no identical data is collected in both clusters.
However, the contemporary contributions have focused on demographic and signalling features of the electrocardiograms, which are considerably vulnerable to false alarms regarding electrocardiogram at premature level arrhythmia. This manuscript portrayed a novel machine learning approach that considers electrocardiograms as images. The objective of the contribution is a feature extraction, optimization, and binary classification of arrhythmia scope from the images of electrocardiograms.
Scanning of ECG charts into images is done by utilizing commercial scanner A4 with grey-scale 600dpi settings. Earlier in operation, the region is determined, which will reduce the processing time, and mostly, it might enable a particular selection of specific waveform parts. Here, the algorithm begins with image reading and transforms it from the grey-scale towards a binary image for preparing it for morphological binary operation. The threshold could be implemented with an image to convert into binary, and then divides, which were lower than a particular pixel count, could be eradicated. Here, the processing of a binary image with specific neighbourhood binary morphological operation, which might predict the image background that would be reduced from the chosen image. Here, the resulting image comprises residual impacts from background subtraction. To lessen these impacts, segmentation based on the region could be implemented. Later, the segments, which depict background & ECG waves, are isolated. The segmentation based on region is implemented for more separated pixels, which depict published characters or decrement in noise [5]. The final image would comprise a waveform with a minimum impact on the boundary. A further stage is smoothening the ECG wave boundary with thick binary morphological features. The block diagram representation of Arrhythmia Prediction by Supervised Learning (APSL) is shown in Fig. 1, Tab. 1.
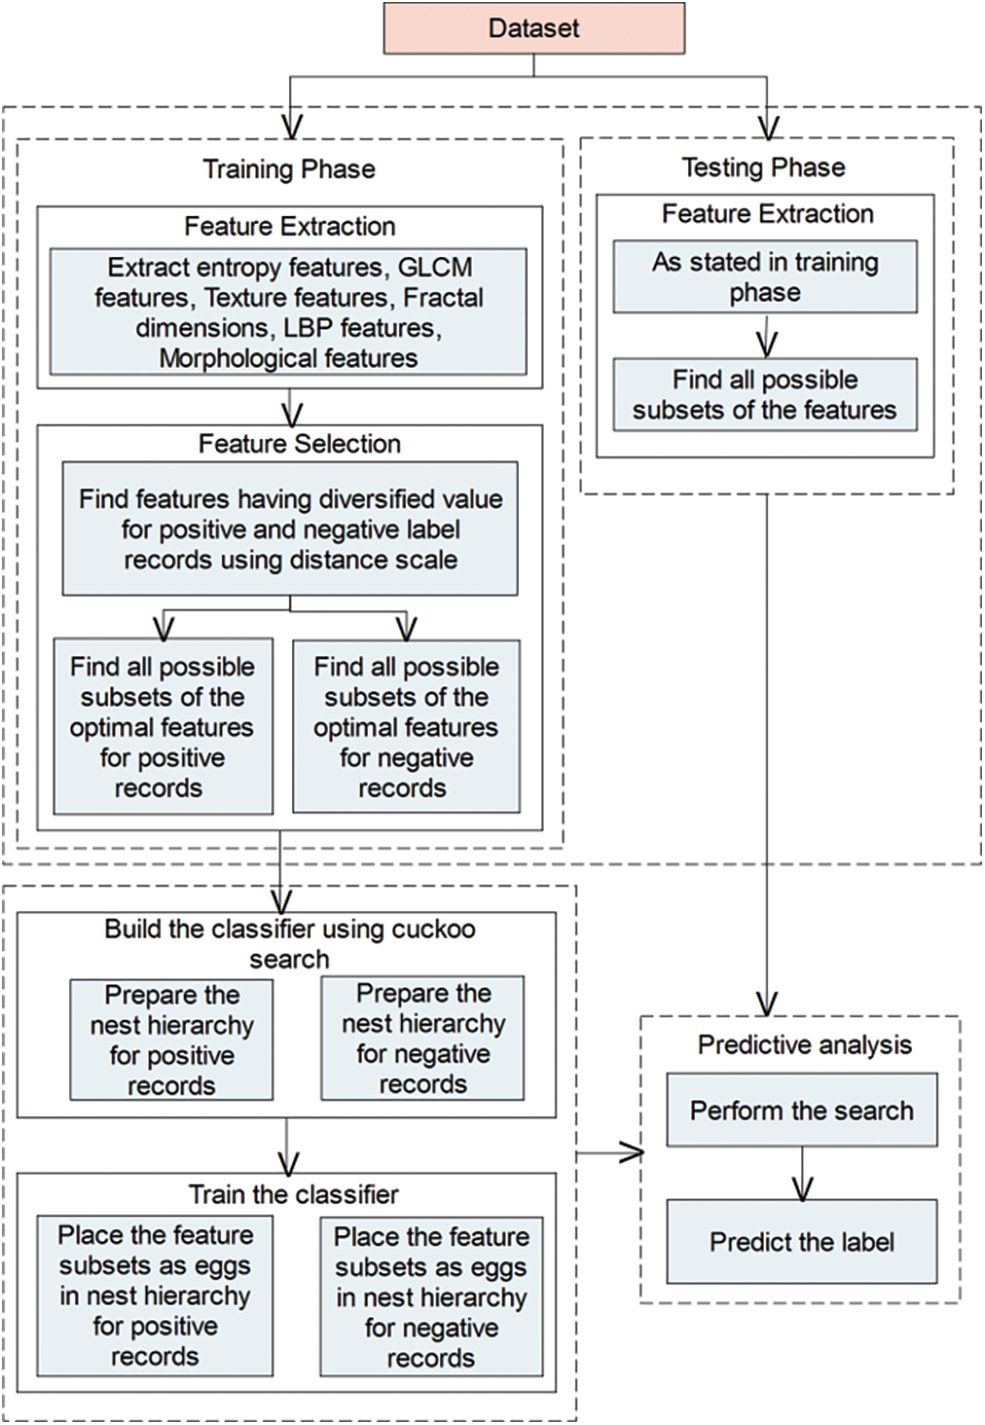
Figure 1: The block diagram representation of APSL
The image formats of the electrocardiograms have been considered to train the classifiers. Concerning this, the given images shall be processed to extract diversified features listed as entropies, GLSM, texture, fractal dimensions, LBP, and morphological features. These features have been further optimized to train the target classifier used in supervised learning. The morphological and textual features are reliable to train the classifier.
The pre-processing converts the given scanned electrocardiograms to grayscale images and filters the noise, if any. Further phase performs feature extraction from the resultant grey-scale images. The arrhythmia scope causes significant diversity in micro-structure of the given electrocardiogram image. In particular, texture, intensity and morphological features are more convincing. In this case, 51 features are used. There are 5 entropy, 01 fractal dimensions, 19 GLCM, 11 texture, 06 LBP, and 09 morphological features.
The term entropy is the evaluation of randomness, which is utilized for texture characterization of image input. Their value is high when entire co-occurrence matrix elements are identical. Here, entropy is one of the significant aspects of feature extraction. In this section, the infected and normal electrocardiogram images are differentiated. The term entropy denotes uncertainty level, it is significant to distinguish the negative & positive electrocardiogram images, and it depends on entropies that are available and explored in this literature [11]. There are 5 entropies, which are deliberated for assessing the entropies.
Entropy denotes the measure of randomness, which is used to characterize the tissue of an image entry. Its value is high when the elements of the complete coexistence matrix are identical. Here, entropy is an important aspect of feature extraction. In this section, a distinction is made between the scanned images arrhythmia prone and normal images and the EKG. The term entropy refers to the level of uncertainty, and it is important to distinguish between negative and positive EKG images, and it is based on the available entropy that has been explored in this literature [11]. There are 5 entropies, which are swapped to assess entropy.
In this section, feature extraction using GLCM features was discussed. The use of the GLCM matrix indicates distinct grey-shades in the image. The computations of texture features utilize the GLCM contents for measuring the change in pixel intensity. Usually, the matrix co-occurrence is calculated based on 2 factors that are relative-distance d among pairs of pixels is evaluated in the number of pixels and their corresponding arrangement. Generally, it is quantized in 4 directions, though several other mixtures are possible. There are a total 19 GLCM features such as contrast, correlation, entropy, energy, etc., and they are associated with the information variance, measure, entropy, and other energy-relevant factors [19], which are important for discussing the information of texture [26].
3.1.3 Grey Level Run Length Matrix (GLRLM)
In this section, the textural features analyse the grey-scale image granular structure. The GLRLM is the number of runs through the pixels of run-length j and grey-level I for a specified direction. The GLRLM was produced for every image fragment sample. The consecutive pixels set with identical grey levels are known as “grey-level run”. Total pixels in the run are called the run’s length. The feature examines the grey-scale image granular structure. The two-dimensional vector
In the section, the surface coarseness of the grey-scale image is detected. This identification of coarseness is made by the fractal dimension method.
Utilizing the fractal dimension method, the surface’s coarseness in the image is shown [27]. To make sure that infected electrocardiogram images are associated with the surface’s coarseness, the grey-scale image is processed in the form of a 2D image. And the corresponding difference from the procedure was the texture or coarse deviation in the positive electrocardiogram images (prone to arrhythmia). Moreover, the method adapted for detecting divergences has adapted a sequential algorithm [22] to perform differential box-counting.
In this section, one of the important aspects of feature extraction is LBP. For computing, the LBP, circular neighbourhood & bilinear interpolation are the 2 important factors used. The operator of “Local Binary Pattern (LBP)” is presented as a complementary evaluation for contrasting the local image. The operator of LBP relates structural & statistical texture examinations. Here, the LBP explains texture with minor primitives known as textons. Some associated features were “LPQ (Local Phase Quantization) operator”, Volume-LBP.
The LBP reflects the equivalent local neighbour areas, and another entire number of the LBP attributes are 6 [28]. Here, bilinear interpolation & circular neighbourhood are some of the important parameters that are utilized for LBP computation.
Let
3.1.6 The Morphologic Features
The morphometric features and invariant moments [22] are considered and stated as morphological feature. These morphological features are significant to predict the similarities or diversities between trained images and images to be notified or labelled.
In this step, features are selected with the help of a distance scale [29]. Let the set
3.2.1 Diversity Assessment by Distance Scale
Diversity assessment using a distance scale is as follows. It is nothing but the variance observed between the values projected for a feature, which is the column of both matrices
Let the
Here in (Eq. (1)),
Many modern meta-heuristic algorithms stimulated by nature were emerging & becoming popular in solving many engineering problems. In this contribution, the cuckoo search (CS) technique is used. These cuckoos lay the eggs in nests, even though they might eradicate others’ eggs to enhance the hatching possibility of their eggs. A relative number of species has engaged in brood parasitism through laying eggs in other host-birds’ nests. There were 3 fundamental brood parasitism types: cooperative breeding, nest takeover & brood parasitism of intra-specific. When discovering the eggs as not their own by the host bird, they might either throw away alien eggs or abandon their nest simply and construct a novel nest.
3.2.3 Contemporary Classifiers
Adaboost: Classifying specific data sets into appropriate categories and focusing on correctly mapping emerging observations is a critical process in machine learning modelling. Success in proper identification depends on a training dataset that includes relevant observations of class membership in a trained dataset. Machine learning and the supervised learning chain are referred to as classification, while clustering is the specific term for the supervised learning process. For the aggregation process, the data is aggregated by a set of a few identified measures of similarity.
AdaBoost [20] is the storefront solution to improve the deliverable results of decision trees compared to other binary classification problems. It is also clearly used to improve the results of various algorithms related to machine learning, the weak type of learner algorithms. Decision trees at a certain level and which ones are best suited for implementation with AdaBoost. Trees are generally considered decision trunks because they are short and usually only having one classification decision.
Naive Bayes: This classifier performs the classification moderated learning algorithm. It is based on the theory of conditional probability to define the class of a new feature vector. NB uses a training dataset to determine the conditional probability value of the vectors for a given class. After calculating the conditional probability value for each vector, the new vector class is calculated based on the conditional probability. A note used to classify text-related problems (Naive-Bayes, n.d.), [30].
The feature selection task intends to identify the features’ significance towards both labels positive (arrhythmia prone) and negative (no evidence of arrhythmia). A feature is optimal if the corresponding feature’s values in the records of the labels positive (arrhythmia prone) and negative (normal) are considerably distinct. The values projected for each feature (pattern of optimal features of size one and above) in records labelled as positive (arrhythmia prone) and the values projected for the corresponding feature in records labelled as negative (normal) has taken as two different vectors. Further estimates the distance between these two vectors. If the distance found between these two vectors is greater than the distance threshold, then the corresponding feature is said to be optimal, hence selects the respective feature as input to the training phase of the proposal.
This task of the training phase defines a binary classifier that classifies the given data using the cuckoo search strategy. Regarding this, the nest hierarchy to be formed in multiple levels for both labels “positive (arrhythmia prone) and negative (normal)”. Each of these nests is represented by one feature in the descending order of their size. Each level of this hierarchy contains one or more nests, such that the nests formed in one level represented by the features of the same size.
Let the set
Similarly, discover the empirical probability
Further, it builds a hierarchy of perches
Training the classifier is the final task of the training phase. This task initially extracts the unique value patterns of optimal features from the records of label positive (arrhythmia prone) for each of the patterns of optimal features. Further, place all these value patterns as eggs in the hierarchy of nests related to the positive (arrhythmia prone) label, such that the eggs will be placed in a nest represented by the corresponding feature. Similarly, the unique value patterns of optimal features traced from the records of the negative (normal) label also being placed in the nest hierarchy of the corresponding label.
In this regard, consider the n-grams of the values listed in
The task of predictive analysis in the testing phase performs a search on both hierarchies to verify the compatibility of the patterns of optimal features (depicted from records given as input to predict the arrhythmia scope) with the eggs placed in each of the nests in hierarchies of both labels. According to the similarity observed with nest hierarchies of both labels, the appropriate label will be assigned to the unlabelled record of the positional patterns given as input to the predictive analysis. The procedure adopted to search the hierarchies of both labels has been influenced by the cuckoo search explored in the following mathematical model.
For a given test record
Let the sets
Let the notations
Let the notations
End
End
End
End
End
End
Estimating the label scope
Min and max range of the weights related to both positive and negative labels are
The label prediction shall perform as follows
Since the lower bound of the positive weights boosts the negative label’s scope, vice versa, the lower bound of the negative weight indicates the positive label’s scope. Similarly upper bound of the positive weight reflects the positive label’s scope, and the upper bound of the negative label evinces the negative label’s scope. Hence, the following method of estimating both labels’ scope is competent to predict the scope of arrhythmia about the given input of an electrocardiogram.
The condition
Else, the condition
Else, the weak prediction performs using aforesaid conditions, where prediction threshold
4 Comparative Study for Classification Assessment
The benchmark dataset MIT-BIH (Moo01) has adopted for an experimental study widely used by many of the contemporary models, which have aimed to depict arrhythmia prediction methods. The statistics of the electrocardiogram corpus has discussed in Tab. 2. Performance has been assessed under diversified metrics like overall prediction accuracy, sensitivity that denotes True-positive-rate (TPR), specificity that denotes True-negative-rate (TNR), and precision scaled under diversified optimal features selected under different distance thresholds. The proposed supervised learning approach method APSL has been critically assessed by comparing it with the performance of the AdaBoost [2] and Naive Bayes (NB) (Naive-Bayes, n.d.) in a similar context of the data and the features. The python (Python, n.d.) language has been considered to implement the proposed contribution.

From Fig. 2, it is proved that accuracy is stable for the features selected under distance scale of 0.5 and below, which obtained optimal features are 17, whereas, for distance scale > 0.5, accuracy is not stable.
The term accuracy is defined as the ratio of error to the feasible output values. The graph is drawn between the Accuracy and diversity threshold for the proposed APSL and contemporary methods AdaBoost & NB. From the statistics, as shown in Fig. 2, it is noticed that the APSL performs better when compared with AdaBoost & NB.
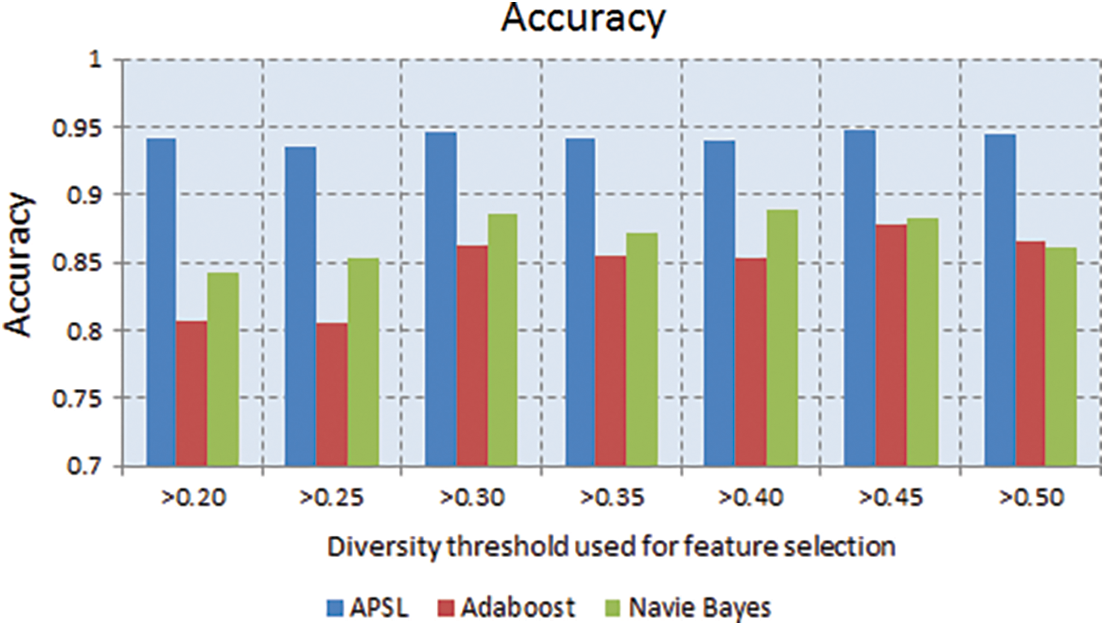
Figure 2: The Accuracy noticed for a diverse number of features beneath varying diversity thresholds
Metric precision is defined as the volume of information that is conveyed through value. The graph is plotted between precision and at various thresholds of diversity. From the statistics, as shown in Fig. 3, it is observed that the proposed method APSL is having superior performance when compared with AdaBoost & NB.
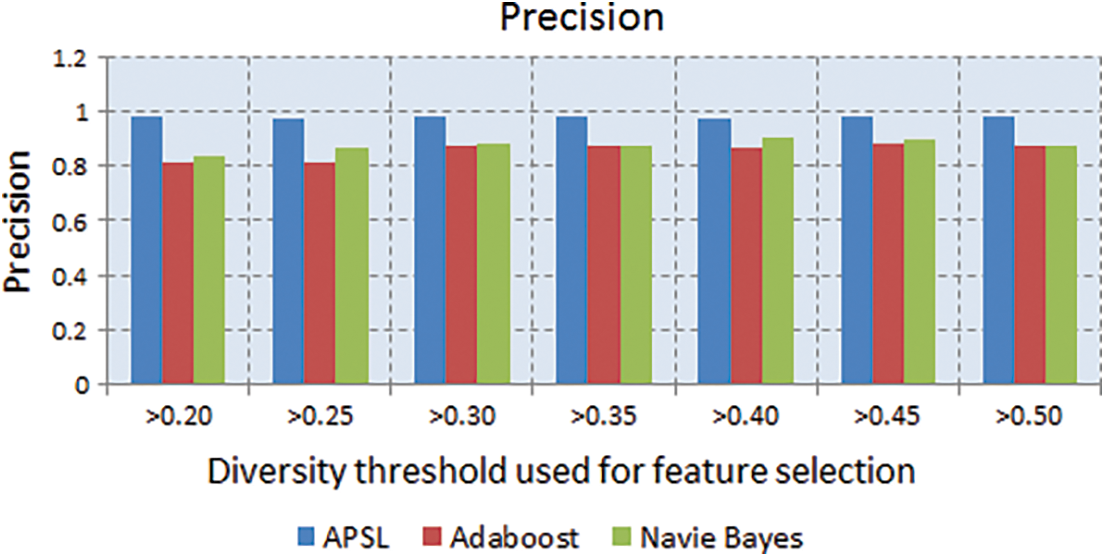
Figure 3: Precision noticed for a diverse number of features beneath varying diversity thresholds
The metric TPR is also called a true positive rate. It is defined in the form of the TP count ratio to the cumulative number of TPs & FNs. It is noticed from the graph that the TPR for the APSL method is considerably high when compared to AdaBoost and NB, as shown in Fig. 4.
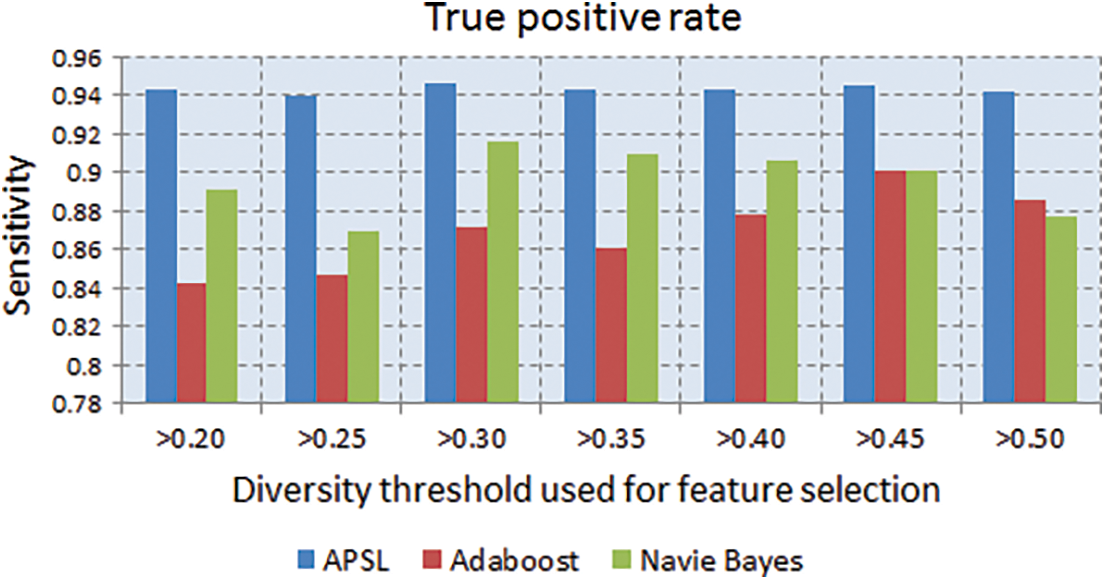
Figure 4: True positive rate (TPR) noticed for a distinct amount of features under variable thresholds of diversity
The metric TNR is also called a true negative rate. It is defined as the ratio of TNs to the cumulative of TNs & FPs. The graph is drawn between TNR and diversity thresholds for the proposed APSL method and contemporary AdaBoost & NB. It is noticed that APSL is more significant than other methods, as shown in Fig. 5.
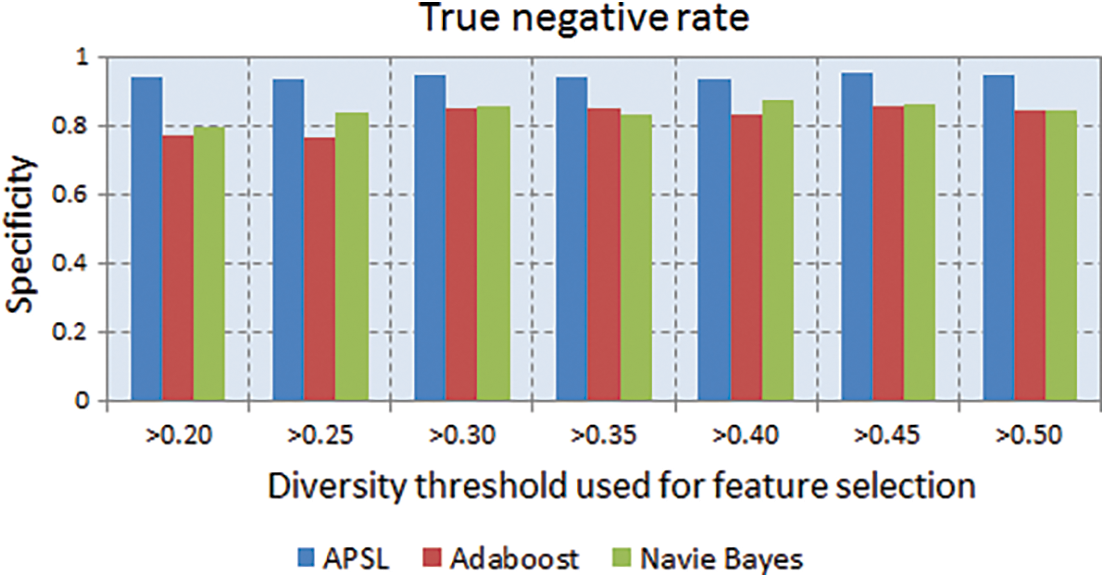
Figure 5: True negative rate (TNR) observed for a diverse number of features beneath varying diversity thresholds
The metric TNR is also called the true negative rate. It is defined as theratio of TNs to the cumulative of TNs & FPs. The graph is drawn between TNR and diversity thresholds for the proposed APSL method and contemporary AdaBoost & NB. It is noticed that APSL is more significant when compared with other methods, as shown in Fig. 5.
In this manuscript, the optimized features obtained from the image formats of the electrocardiograms have been recommended for performing the supervised learning intended to perform arrhythmia scope prediction from the scanned images of the electrocardiogram. Unlike the many contemporary methods, which rely on demographic features or signalling features of the electrocardiograms. The proposed model formats the given electrocardiogram as an image and derives all possible image-level features such as Entropies, GLSM Features, GLRLM Features, Fractal dimensions, Local Binary Patterns, and Morphological Features. A novel binary classification strategy based oncuckoo search was used for supervised learning, which reached the stability and scalability in high detection accuracy and minimal false alarms compared to the other contemporary classifiers AdaBoost and Naïve-bays.
The Future research should consider all formats of the features to boost the prediction accuracy of the classification that is intended to make the arrhythmia scope prediction.
Acknowledgement: The authors extend their appreciation to the Deanship of Scientific Research at King Khalid University for funding this work through the General Research Project under Grant Number (R.G.P1/155/40).
Funding Statement: The authors extend their appreciation to the Deanship of Scientific Research at King Khalid University for funding this work under Grant Number (R.G.P1/155/40/2019), Received by Fuad A. Al-Yarimi. https://www.kku.edu.sa.
Conflicts of Interest: The authors declare that they have no conflicts of interest to report regarding the present study.
1. S. Aarthy and L. Mazher, “Time series real time naive bayes electrocardiogram signal classification for efficient disease prediction using fuzzy rules,” Journal of Ambient Intelligence and Humanized Computing, vol. 12, no. 5, pp. 5257–5267, 2020. [Google Scholar]
2. T. An and M. Kim, “A new diverse adaboost classifier,” in 2010 Int. Conf. on Artificial Intelligence and Computational Intelligence, Sanya, China, vol. 35, pp. 359–363, 2010. [Google Scholar]
3. D. Cuesta-Frau, M. O. Biagetti, R. A. Quinteiro, P. Mico-Tormos and M. Aboy, “Unsupervised classification of ventricular extrasystoles using bounded clustering algorithms and morphology matching,” Medical & Biological Engineering & Computing, vol. 45, no. 3, pp. 229–239, 2007. [Google Scholar]
4. A. Daamouche, L. Hamami, N. Alajlan and F. Melgani, “A wavelet optimization approach for ECG signal classification,” Biomedical Signal Processing and Control, vol. 7, no. 4, pp. 342–349, 2012. [Google Scholar]
5. K. Das and B, “Is IBD an autoimmune disorder?,” Inflammatory Bowel Diseases, vol. 2, pp. 97–101, 2008. [Google Scholar]
6. D. Das, M. Ghosh, C. Chakraborty, M. Pal and A. K. Maity, “Invariant moment based feature analysis for abnormal erythrocyte recognition,” in Int. Conf. on Systems in Medicine and Biology, Kharagpur, India, vol. 10, pp. 242–247, 2010. [Google Scholar]
7. P. De Chazal, “A switching feature extraction system for ECG heart-beat classification,” Computing in Cardiology, vol. 12, pp. 955–958, 2013. [Google Scholar]
8. P. de Chazal, M. O’Dwyer and R. Reilly, “Automatic classification of heartbeats using ECG morphology and heartbeat interval features,” IEEE Transactions on Biomedical Engineering, vol. 51, no. 7, pp. 1196–1206, 2004. [Google Scholar]
9. F. Elhaj, N. Salim, R. Arief and T. Swee, “Arrhythmia recognition and classification using combined linear and nonlinear features of ECG signals,” Computer Methods and Programs in Biomedicine, vol. 127, no. 9, pp. 52–63, 2016. [Google Scholar]
10. M. Galloway, “Texture classification using gray level run length,” Computer Graphics and Image Processing, vol. 4, no. 2, pp. 172–179, 1975. [Google Scholar]
11. M. Ghosh, D. Das and C. Chakraborty, “Entropy based divergence for leukocyte image segmentation,” in Int. Conf. on Systems in Medicine and Biology, Kharagpur, India, vol. 10, pp. 409–413, 2010. [Google Scholar]
12. M. Krishnan, P. Shah, A. Choudhary, C. Chakraborty, R. Paul et al., “Textural characterization of histopathological images for oral sub-mucous fibrosis detection,” Tissue and Cell, vol. 43, no. 5, pp. 318–330, 2011. [Google Scholar]
13. M. Rama, P. Shah, C. Chakraborty and A. Ray, “Statistical analysis of textural features for improved classification of oral histopathological images,” Journal of Medical Systems, vol. 36, no. 2, pp. 865–881, 2012. [Google Scholar]
14. C. Lin, “Classification enhancible grey relational analysis for cardiac arrhythmias discrimination,” Medical and Biological Engineering and Computing, vol. 44, no. 4, pp. 311–320, 2006. [Google Scholar]
15. M. Rudra Kumar and V. Kumar Gunjan, “Review of machine learning models for credit scoring analysis,” Ingenieria Solidaria, vol. 16, no. 1, 2020. [Google Scholar]
16. A. Mishra and S. Raghav, “Local fractal dimension-based ECG arrhythmia classification,” Biomedical Signal Processing and Control, vol. 5, no. 2, pp. 114–123, 2010. [Google Scholar]
17. G. Moody and R. Mark, “The impact of the MIT-BIH arrhythmia database,” IEEE Engineering in Medicine and Biology Magazine, vol. 20, no. 3, pp. 45–50, 2001. [Google Scholar]
18. S. Osowski, L. Hoai and T. Markiewicz, “Support vector machine-based expert system for reliable heartbeat recognition,” IEEE Transactions on Biomedical Engineering, vol. 51, no. 4, pp. 582–589, 2004. [Google Scholar]
19. P. Pławiak and U. Rajendra, “Novel genetic ensembles of classifiers applied to myocardium dysfunction recognition based on ECG signals,” Swarm and Evolutionary Computation, vol. 39, no. 11, pp. 192–208, 2018. [Google Scholar]
20. P. Pławiak, “Novel methodology of cardiac health recognition based on ECG signals and evolutionary-neural system,” Expert Systems with Applications, vol. 92, no. 3, pp. 334–349, 2018. [Google Scholar]
21. P. Pławiak and U. Rajendra, “Novel deep genetic ensemble of classifiers for arrhythmia detection using ECG signals,” Neural Computing and Applications, vol. 32, no. 15, pp. 11137–11161, 2020. [Google Scholar]
22. F. Wang and J. Sun, “Survey on distance metric learning and dimensionality reduction in data mining,” Data Mining and Knowledge Discovery, vol. 29, no. 2, pp. 534–564, 2014. [Google Scholar]
23. P. Sharma and K. Chandra, “Efficient methodology for electrocardiogram beat classification,” IET Signal Processing, vol. 10, no. 7, pp. 825–832, 2016. [Google Scholar]
24. N. Sarkar and B. Chaudhuri, “An efficient differential box-counting approach to compute fractal dimension of image,” IEEE Transactions on Systems, Man, and Cybernetics, vol. 24, no. 1, pp. 115–120, 1994. [Google Scholar]
25. K. Rajesh and R. Dhuli, “Classification of ECG heart-beats using nonlinear decomposition methods and support vector machine,” Computers in Biology and Medicine, vol. 87, no. 2, pp. 271–284, 2017. [Google Scholar]
26. R. Tadeusiewicz, “Neural networks as a tool for modeling of biological systems,” Bio-Algorithms and Med-Systems, vol. 11, no. 3, pp. 135–144, 2015. [Google Scholar]
27. F. Boray Tek, G. Andrew and İ. Kale, “Parasite detection and identification for automated thin blood film malaria diagnosis,” Computer Vision and Image Understanding, vol. 114, no. 1, pp. 21–32, 2010. [Google Scholar]
28. T. Tuncer, S. Dogan, P. Pławiak and U. Rajendra, “Automated arrhythmia detection using novel hexadecimal local pattern and multilevel wavelet transform with ECG signals,” Knowledge-Based Systems, vol. 186, pp. 104923, 2019. [Google Scholar]
29. C. Ye and M. Coimbra, “Heart-beat classification using morphological and dynamic features of ECG signals,” IEEE Transactions on Biomedical Engineering, vol. 59, no. 10, pp. 2930–2941, 2012. [Google Scholar]
30. A. Zan, W. van, E. Inserra, L. Hall, E. Kane et al., “Presenteeism in inflammatory bowel diseases: A hidden problem with significant economic impact,” Inflammatory Bowel Diseases, vol. 21, no. 7, pp. 1623–1630, 2015. [Google Scholar]
 | This work is licensed under a Creative Commons Attribution 4.0 International License, which permits unrestricted use, distribution, and reproduction in any medium, provided the original work is properly cited. |