DOI:10.32604/csse.2023.024643
| Computer Systems Science & Engineering DOI:10.32604/csse.2023.024643 | |
| Article |
A Lightweight Driver Drowsiness Detection System Using 3DCNN With LSTM
Department of Computer Science, King Abdulaziz University, Jeddah, 21589, Kingdom of Saudi Arabia
*Corresponding Author: Sara A. Alameen. Email: salameen0002@stu.kau.edu.sa
Received: 25 October 2021; Accepted: 24 December 2021
Abstract: Today, fatalities, physical injuries, and significant economic losses occur due to car accidents. Among the leading causes of car accidents is drowsiness behind the wheel, which can affect any driver. Drowsiness and sleepiness often have associated indicators that researchers can use to identify and promptly warn drowsy drivers to avoid potential accidents. This paper proposes a spatiotemporal model for monitoring drowsiness visual indicators from videos. This model depends on integrating a 3D convolutional neural network (3D-CNN) and long short-term memory (LSTM). The 3DCNN-LSTM can analyze long sequences by applying the 3D-CNN to extract spatiotemporal features within adjacent frames. The learned features are then used as the input of the LSTM component for modeling high-level temporal features. In addition, we investigate how the training of the proposed model can be affected by changing the position of the batch normalization (BN) layers in the 3D-CNN units. The BN layer is examined in two different placement settings: before the non-linear activation function and after the non-linear activation function. The study was conducted on two publicly available drowsy drivers datasets named 3MDAD and YawDD. 3MDAD is mainly composed of two synchronized datasets recorded from the frontal and side views of the drivers. We show that the position of the BN layers increases the convergence speed and reduces overfitting on one dataset but not the other. As a result, the model achieves a test detection accuracy of 96%, 93%, and 90% on YawDD, Side-3MDAD, and Front-3MDAD, respectively.
Keywords: 3D-CNN; deep learning; driver drowsiness detection; LSTM; spatiotemporal features
According to the World Health Organization (WHO) statistics [1], every 24 s, someone dies on the road. By 2030, WHO [2] predicts that road traffic injuries will become the seventh leading cause of death across all age groups. Several studies and statistics emphasize that drowsy driving is among the most critical scenarios for road accident causes. In 2019, the American Automobile Association (AAA) [3] reported that around 24% of drivers admitted to driving at least once in the last month while being so exhausted that they had a hard time keeping their eyes open. The ''Fatigue'' report from the European Commission [4] asserts that driver drowsiness is the main factor in 20% of road accidents. This report also indicates that when drivers' vigilance level decreases, they face a significant drop in their ability to respond to unexpected occurrences, and increasing the risk of accidents.
Drowsiness is used interchangeably with the terms fatigue and sleepiness in the corresponding literature and this work. Drowsiness or sleepiness [5] is a state of the neurological desire for sleep, the usual state preceding falling asleep. Fatigue is a feeling of tiredness that decreases the physical performance of the muscles, and it can cause drowsiness. Although their causes are different, the effects of drowsiness and fatigue are very similar in their ability to decrease physical and mental performance. Both are dangerous when experienced while performing tasks that require concentration, such as driving, performing surgery and examinations, and so on. Lack of sleep, long work hours, boring driving conditions, and environmental factors can all contribute to experiencing drowsiness and fatigue while driving [6].
There is an increasing interest in building intelligent in-vehicle systems, called Driver Assistance System (DAS) [7], that analyze drivers' behaviors on the road to avoid accidents and increase road safety. One of the leading research subjects in DAS, called Driver Drowsiness Detection (DDD) systems, involves detecting the symptoms of drowsiness in drivers as early as possible and alerting the driver to take proper action before they fall asleep. Typically, sleepiness does not come on instantly but is generally preceded by noticeable signs, including [6,8]:
• Physiological-based signs.
• Vehicular-based signs.
• Behavioral-based signs.
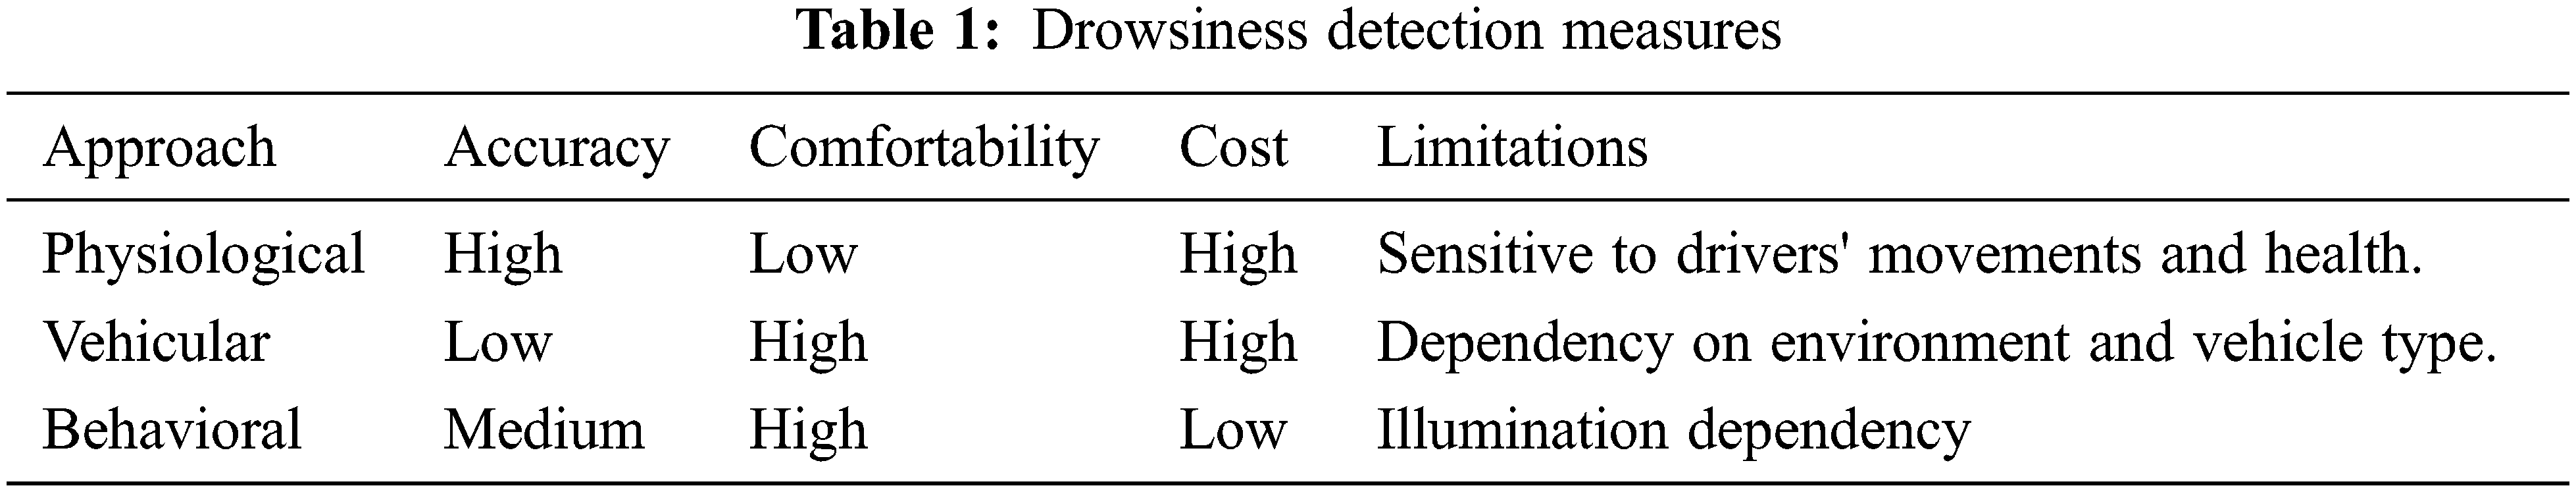
DDD systems are designed to identify sleepiness indicators based on one or more of these signs. Physical signs such as pulse rate, heart rate, breathing rate, and body temperature are obtained through intrusive sensors connected to the drivers' bodies that may be distracting and uncomfortable. For the vehicular-based signs, sensors connected to vehicle parts analyze various measurements, including lane departure, steering wheel movements, braking patterns, etc. Finally, for behavioral signs, the behavioral measures are non-invasive measures that depend on cameras and computer vision techniques to extract behavioral features such as eye closure ratio, eye blinking, head position, facial expressions, and yawning [8]. Tab. 1 shows the advantages and limitations of all the three measures approaches.
Over the past century, attention to vision-based DDD systems has dramatically increased due to their higher reliability, availability, and affordability. However, due to the difficulties in identifying and the large variety of drowsy behaviors, most of the reviewed systems are not applicable to real-life scenarios. A major challenge in this domain is that a reliable DDD system must work effectively across various conditions that can affect the video quality, such as occlusion, illumination, severe weather, and bumpy roads [9].
The research accomplished in this paper is within the field of monitoring the drivers' visual behaviors from a video to detect drowsiness, using computer vision and deep learning-based approaches. The four main contributions of this paper are:
• Propose a driver drowsiness detection model that combines a lightweight 3D convolutional neural network (3D-CNN) with a single layer long short-term memory (LSTM).
• Use the 3MDD dataset [10,11], a new challenging yet representative dataset, to train and test the proposed system for the first time.
• Train the proposed models with a small frames size (60 × 60) and achieve high accuracy.
• Study the effect of changing the position of the batch normalization (BN) layers in the 3D-CNN units on the convergence speed.
The rest of this paper is structured as follows: Section 2 shows an overview of the related works. In Section 3, the proposed model is explained. Section 4 contains a description of the utilized datasets. The performance evaluation metrics, experimental results, comparisons with other state-of-the-art studies, and the limitations of the proposed model are presented in Section 5. Finally, section concludes the study with future research directions.
There have been numerous recent efforts in behavioral-based DDD systems utilizing a variety of computer vision, and deep learning techniques have been made. These methods typically rely on different vision sensors to extract various indicators used separately or integrated to recognize driver fatigue. For example, drivers' frequent yawning, sudden changes in head positioning (nodding), prolonged eye closure, or quick blinking are common drowsiness indicators. In the following, we review two categories of deep learning algorithms for driver fatigue detection, image-based systems, and spatiotemporal-based systems (see Fig. 1).
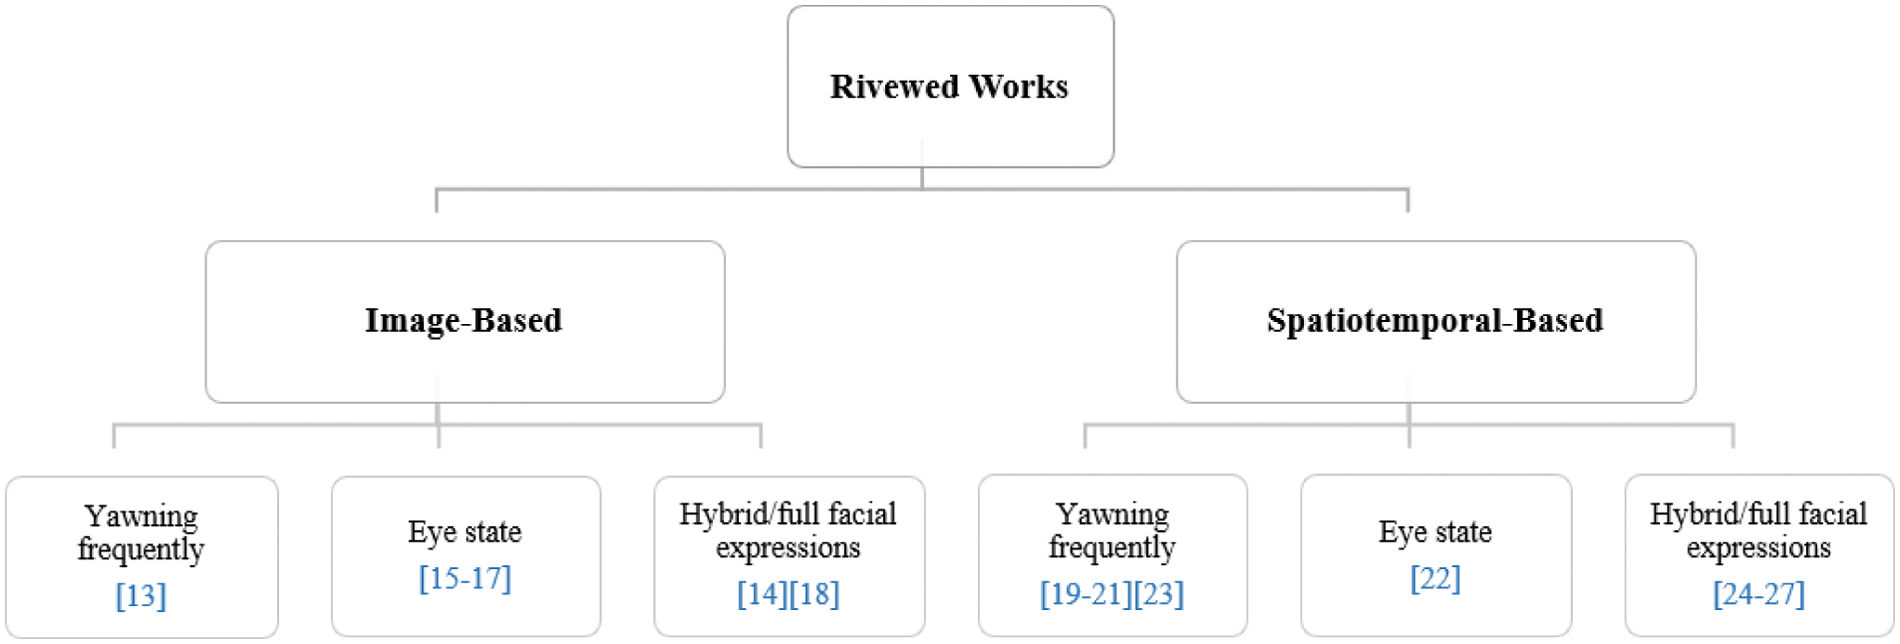
Figure 1: Related works categories
Convolutional Neural Network (CNN) has consistently proven its tremendous success in image classification, detection, and retrieval tasks. Therefore, many researchers have stimulated the utilization of CNN to classify the actions in videos. The general idea is to treat a video clip as a collection of frames and then recognize the driving behaviors for each frame by modeling frames independently. Finally, frame-level categories are averaged into the video-level category [12]. However, because they ignore the temporal features of the drowsiness behaviors, these systems are hard to be considered reliable driver fatigue detection systems for real-life scenarios.
Among the efforts on image-based driver drowsiness detection, the work of Kassem et al. [13] proposed a yawning-based fatigue detection system that aggregated frame-level CNN outputs into three drowsiness levels based on the number of yawns per minute: alert, early fatigue, and fatigue. By classifying each frame as yawning or not. If the drivers are not yawning, the model considers them awake, whereas early fatigue is detected when they yawn once in a minute. The model finds drivers fatigued if they yawn more than once in a minute. Also, Ciganek et al. [14] proposed a CNN to recognize each frame state separately, whether the driver is awake or drowsy. Next, after approximately one second, the average of the 20 last frames is evaluated as drowsy or awake. To train the model, the authors built a dataset of a total of 20 participants. Each participant has eight different behavioral patterns recorded for about five seconds in two categories awake and sleepy.
Other recent attempts used image-based analysis to identify drivers' sleepiness levels employed the condition of the eyes as a visual signal. Kongcharoenet et al. [15] built a straightforward framework with CNN to classify the images of drivers depending on the status of the eyes, open or closed, with 94% accuracy. When the drivers closed their eyes for more than two seconds, it generated an alert to wake them up. Similarly, Pawar et al. [16] built a real-time DDD system to alert the driver if the eyes are closed for more than five seconds using three datasets called CEW, MRL, and Kaggle for open and closed eyes images. The authors successfully simulated the system for real-time testing using a laptop webcam and achieved a detection accuracy of 98.64%. Also, Pinto et al. [17] proposed their DDD system using the CEW dataset with 93.3% accuracy. A CNN is used to analyze the state of the eye after detecting the driver's face by the Histogram of Oriented Gradients(HOG) algorithm. The system stores the classification result for the past 20 frames in a buffer and then checks how many adjacent frames the CNN classified as closed eyes. If at least ten continuous values are in the buffer, it alarms the driver. However, because these simple conditions cannot detect most real-life scenarios of drowsiness, these systems cannot be considered reliable DDD systems.
Several researchers have devised hybrid approaches for DDD systems that integrate two or more facial features. Savas et al. [18] present a DDD system where the drowsiness is judged using a multi-feature fusion judgment algorithm depending on threshold values of the percentage of eyelid closure over the pupil over time(PERCLOS) parameters and the frequency of open mouth (FOM). The PERCLOS formula measures the ratio between closed eye frames (n) and the total number of frames in a unit of time (N) as
2.2 Spatiotemporal-Based Systems
Recently, significant improvements in spatiotemporal feature representations have been introduced for action recognition. As a result, several studies have attempted to build a driver drowsiness system based on deep spatiotemporal models that can learn to analyze the temporal features in an end-to-end manner. To enhance the performance of DDD systems, such as differentiating yawning from talking. A high-level overview of the main three stages for spatiotemporal-based systems using DL is shown in Fig. 2, with the most common type of strategies used in each step.
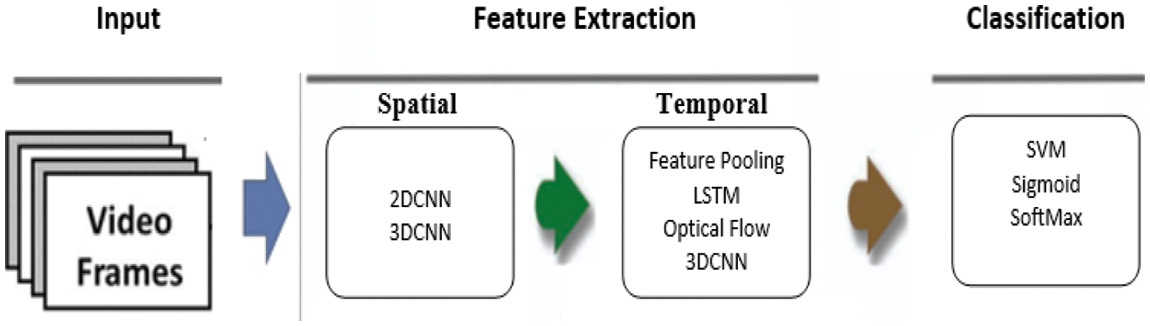
Figure 2: An overview of DDD system process using spatiotemporal DL models
Some studies have devised a driver drowsiness detection system by combining CNN with LSTM. The CNN extracts spatial features from individual frames, and the LSTM network analyzes the temporal features of driver actions between the adjacent frames. For example, some authors attempted to employ this CNN-LSTM network to build a DDD system depending only on the analysis of yawning features [19–21]. Most of them used a public dataset named YawDD. One of the main differences between these studies is the type of inputs to the models. Xie et al. [19] use the whole frames as inputs, Zhang et al. [20] use frame edges, and Fei et al. [21] focus on the extracted mouth regions from the drivers' faces. Other researchers utilized the CNN-LSTM network to learn the spatiotemporal feature of drivers' eyes. Such as Xiao et al. [22] used a Multi-Task Cascade Convolutional Neural Network (MTCNN) to crop the eye region from infrared frames before passing them to the model to analyze the features from each driver's eyes.
Other efforts attempted to build driver fatigue detection systems depending on the well-known architecture called the two-stream CNNs model. The architecture combines spatial features of the current frame, and to analyze the temporal characteristics, the temporal stream accepts a stacked optical flow displacement field between several consecutive frames. For example, Ma et al. [23] this architecture for a night driver yawning detection system using their dataset of depth videos with 91.57% accuracy. One of the advantages of this work is that they consider yawning with hand assistance, not just yawning with an open mouth when recording the dataset.
Another direction was introducing a hierarchical framework comprising deep networks to split temporal and spatial phases. Such as Jamshidi et al. [24] proposed framework contains four primary stages: face detection, mouth and eyes state detection, situation detection, and drowsiness detection. Only a single frame is used in the first three phases for spatial features. The fourth phase is the temporal part of the proposed framework, which utilizes consecutive frames as input in the LSTM network to analyze the temporal information between them. The proposed model had an average accuracy of 87.19% in detecting drowsiness.
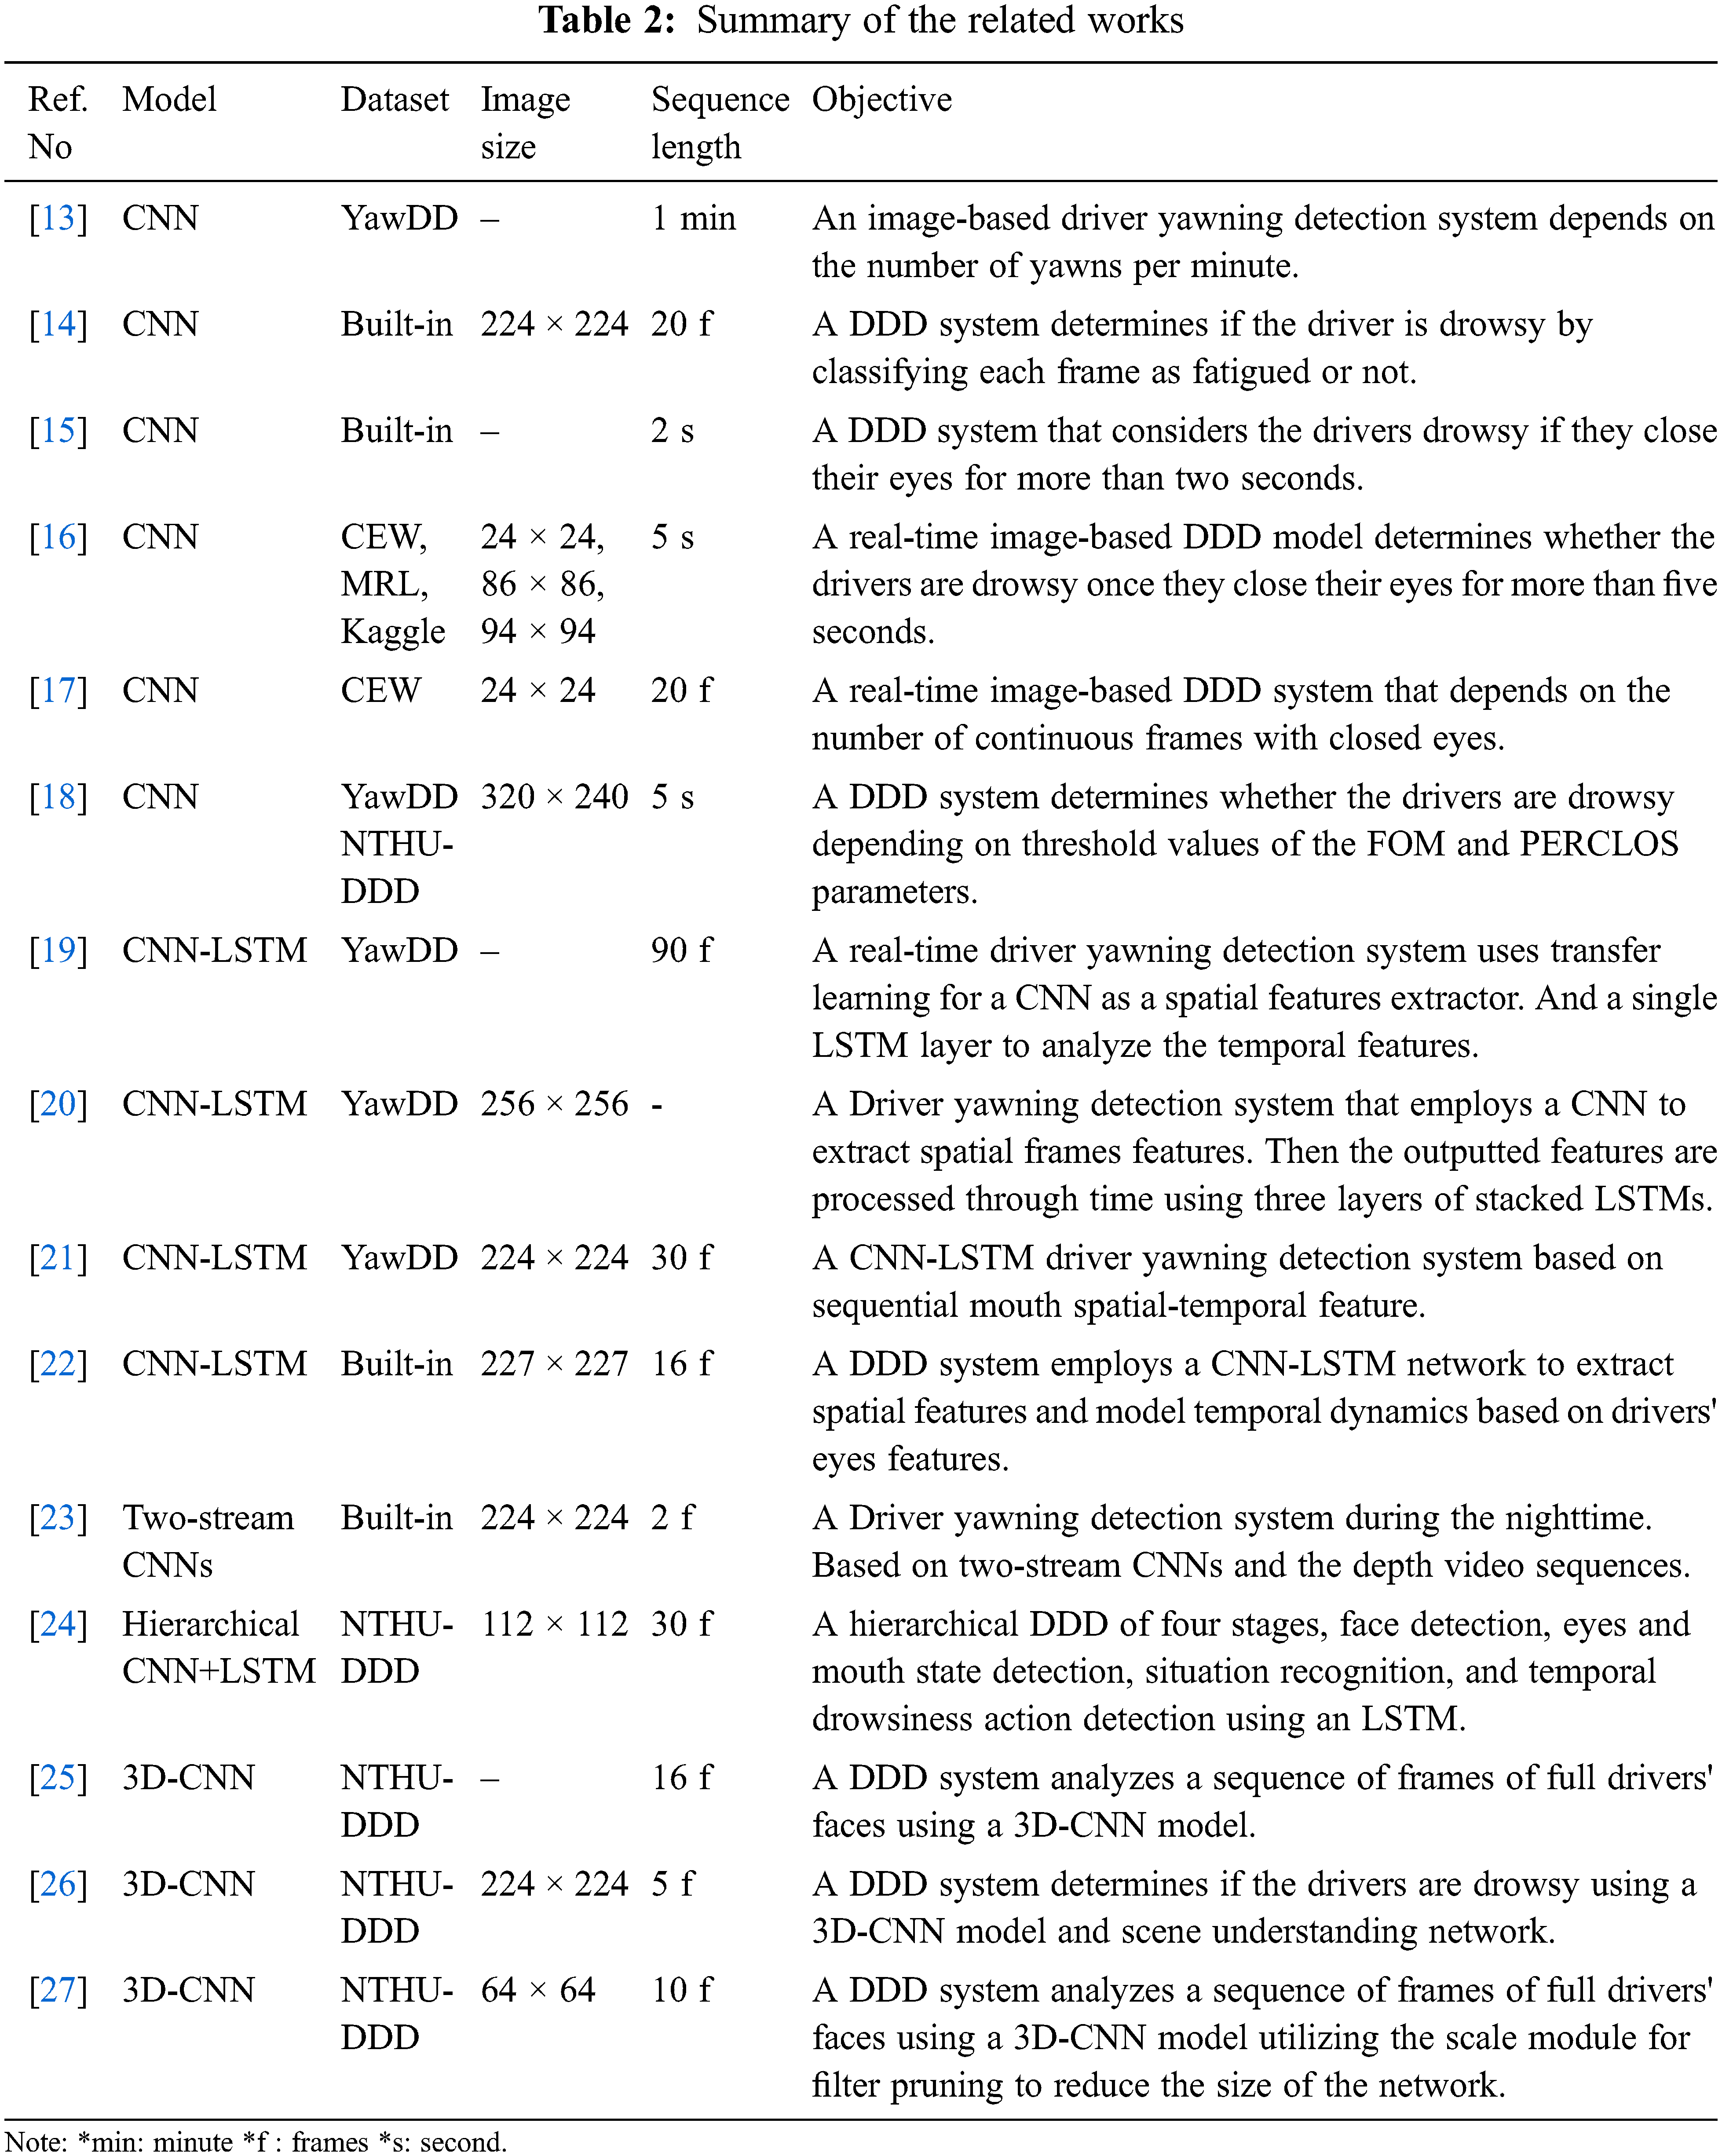
Several researchers have devised DDD systems using a recent action recognition trend that uses 3D-CNN to capture Spatiotemporal correlation by utilizing the whole video as input to the model on the NTHU-DDD dataset [25–27]. Doughmi et al. [25] proposed a 3DCNN network to learn spatiotemporal features of 16 consecutive frames using six convolutional layers and four max-pooling layers and achieved 92.19% detection accuracy. Successfully Doughmi et al. used the model to create a mobile application, and according to real-time test findings, they discovered that changing the driver's posture affects the model's accuracy. However, the authors mentioned that the dataset does not cover most real-life drowsiness scenarios, such as rubbing the eyes and yawning with hands. Yu et al. [26] adopted a novel DDD by using a feature fusion between 3D-CNN and scene understanding network. 3D-CNN extracts spatiotemporal features from five consecutive frames with six convolutional layers and two pooling layers. The experiment result showed that the proposed framework achieved 71.20% detection accuracy. Yao et al. [27] introduced a 3D-CNN that extracts spatiotemporal correlation of ten consecutive frames and estimates vigilance level. With four convolutional layers and pooling layers. The contribution of this work is that they were able to reduce the size of the network and inference time by introducing a scale module for filter pruning. Tab. 2 summarizes the reviewed studies.
Since the main goals of real-life DDD systems are high accuracy and fast detection of drowsiness signs to alert the drivers in real-time processing. As a result, many existing efforts are ineffective in real-world scenarios. The following are some of the major flaws discovered in some of the reviewed works:
A. Utilize a stand-alone indicator of drowsiness:
In real life, there is no stand-alone feature that can be used for all drivers. The different style of drowsiness actions for each driver is the reason behind the complexity of DDD systems. For that, building a system that depends on only yawning detection [13,19–21,23] or eye state recognition [15–17,22] cannot be used as an effective real-life DDD system.
B. Crop a small region of Interest (ROI) from a driver's face.
Several studies crop the mouth region from the face driver to analyze the yawning frequency [21], where yawning symptoms are more complex than a wide-open mouth. It affects many areas in the face as raised eyebrows, closed eyes, and stretched face.
C. Without any sequence learning for the drowsiness actions
Some studies [13–18] did not apply sequence learning by depending only on the information of each image frame separately and ignoring the temporal features encoded between adjacent frames. For that, it will be hard to distinguish between yawning and a wide-open mouth for talking and singing.
To contribute to this research area, we aim to build a lightweight model that can effectively recognize spatial and temporal features for drowsy activity without cropping an ROI from the driver's face, utilizing the new 3MDAD dataset [10,11]. Towards this, we investigated the recent trend in deep learning models for spatiotemporal features analysis. As a result, we discovered that learning in-depth spatiotemporal features employing 3D-CNN to analyze local spatial information and short-term temporal features is more powerful and reasonable than using 2D-CNN for action recognition, but 3D-CNN is not suitable to capture long-term dependencies [28–30]. On the other hand, researchers used RNN/LSTM networks to capture long-term temporal information in sequential data of varying lengths [30]. However, the spatial correlation properties can be lost as the input is transported from one state to another in an RNN/LSTM network [28,30]. These shortcomings inspire researchers to combine the benefits of 3D-CNN with LSTM to understand deep, long-term spatiotemporal correlation. Such as for gesture recognition [30,31], analysis of muscular activity [29], radar echo nowcasting task [32], lip reading [33], action detection [34]. However, 3DCNN has more parameters than 2D-CNN, thereby greatly increasing the running time of the system. Therefore, we will attempt to establish a lightweight 3D-CNN network combined with one layer LSTM and resize the frames to a small size to reduce the computational complexity of our 3DCNN-LSTM.
The proposed 3DCNN-LSTM model for detecting driver drowsiness from 50 RGB sequence frames is depicted in Fig. 3. It is made up of 3D-CNN layers used to extract spatiotemporal features. These output features are then passed to a global average pooling layer (GAP) before being sent to a 32-node LSTM layer. Following that, a fully connected layer (FC) with 32 nodes and Rectified linear activation function (ReLU) is added. To reduce overfitting, a dropout layer is added with a rate of 0.15. An FC layer with one node and a sigmoid activation function is used for the final classification.
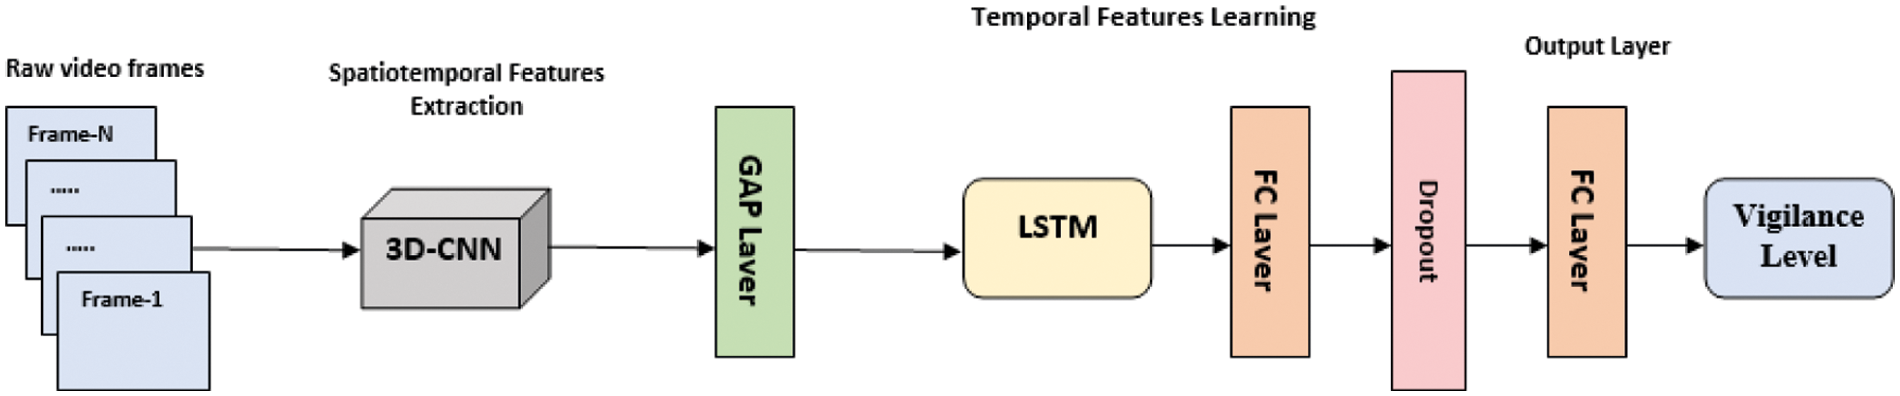
Figure 3: The architectuer of the proposed 3DCNN-LSTM DDD system
To make our 3D-CNN feature extractor more general and to speed up the training process, BN layers are used. In the last couple of years, the effectiveness of BN has been proven by many studies in the machine learning community. However, there are some disagreements on the best position for the BN layer in a network to achieve the highest acceleration in training and to avoid overfitting. We have examined two different positions of the BN layers in the 3D-CNN. In model (A), as suggested in the original BN paper, we place the BN before the non-linear activation function [35]. For the second model (B), the BN layer is added after the non-linear activation function.
Fig. 4 shows the details of the 3D-CNN architectures of the two models. The architecture consists of four 3D convolutional layers with 4,4,8,8 filters, respectively. The (3 × 3 × 3) kernels and the same padding have been employed for all of them. 3D max-pooling layers follow the second and last layers with window size set as (3 × 3 × 3). A dropout layer follows each 3D max-pooling layer with a rate of 0.15.
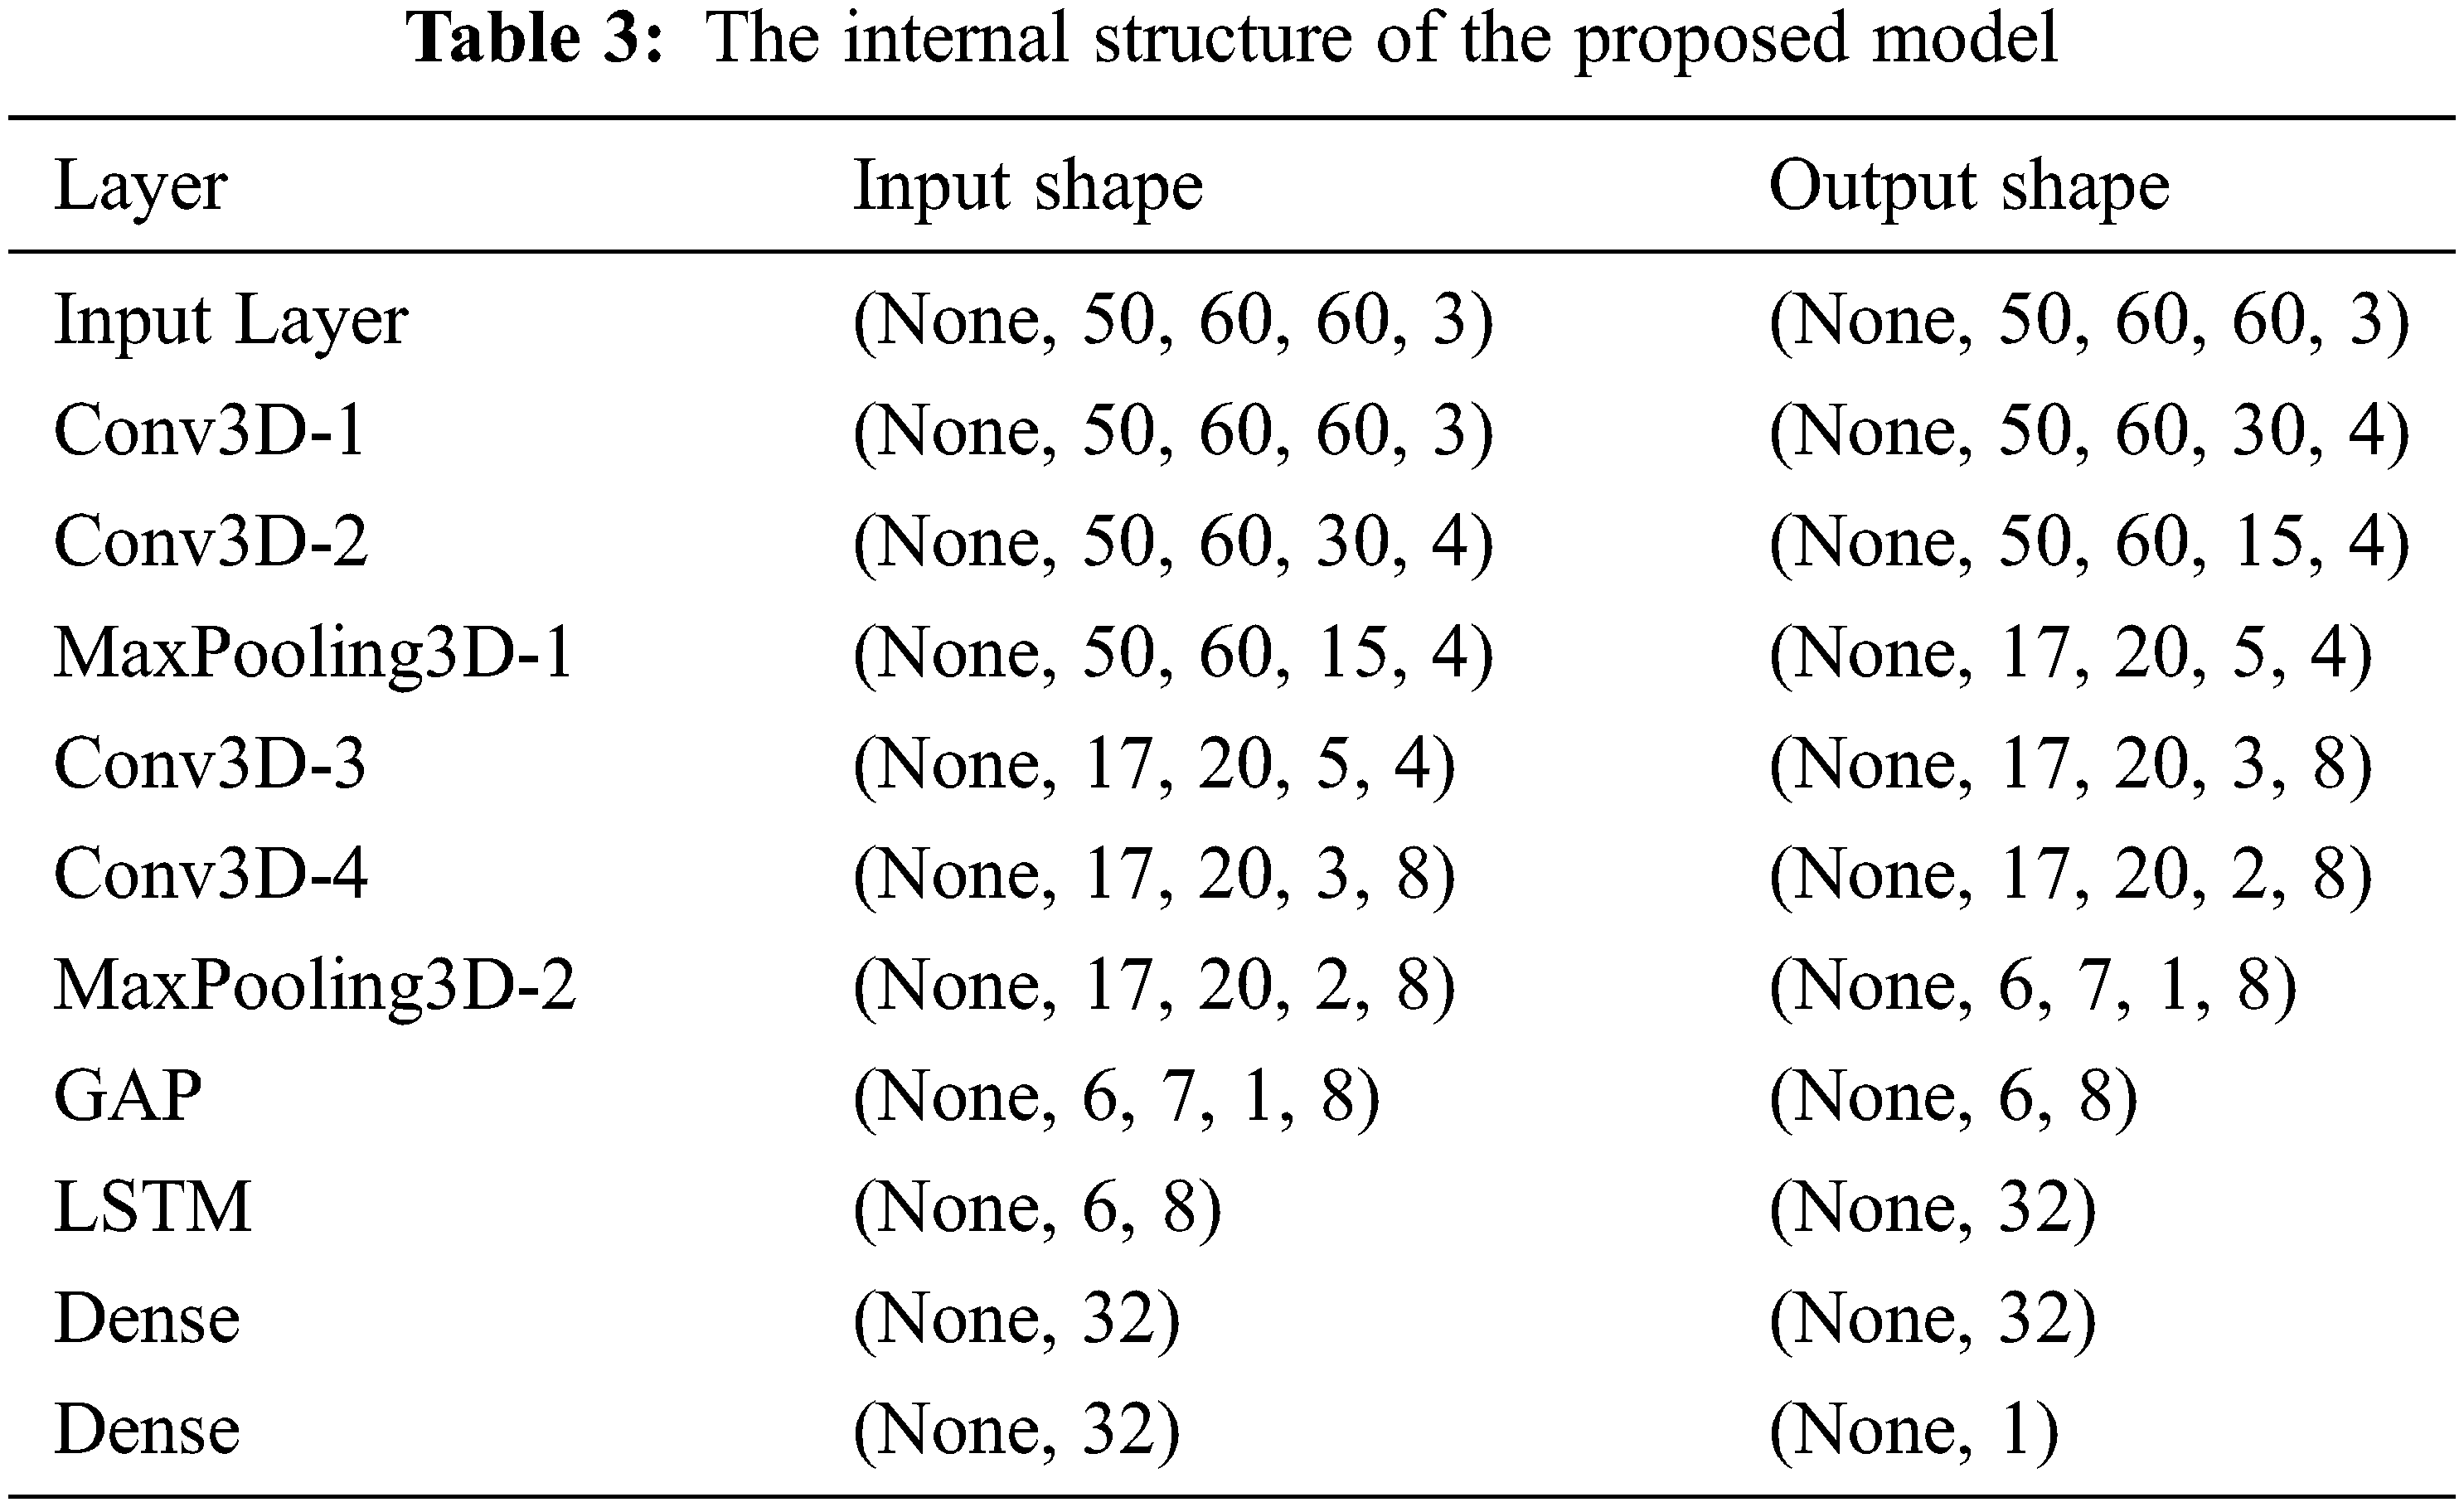
The total number of trainable parameters for the proposed 3DCNN-LSTM model is 9,757, and the details of the internal structure are provided in Tab. 3.
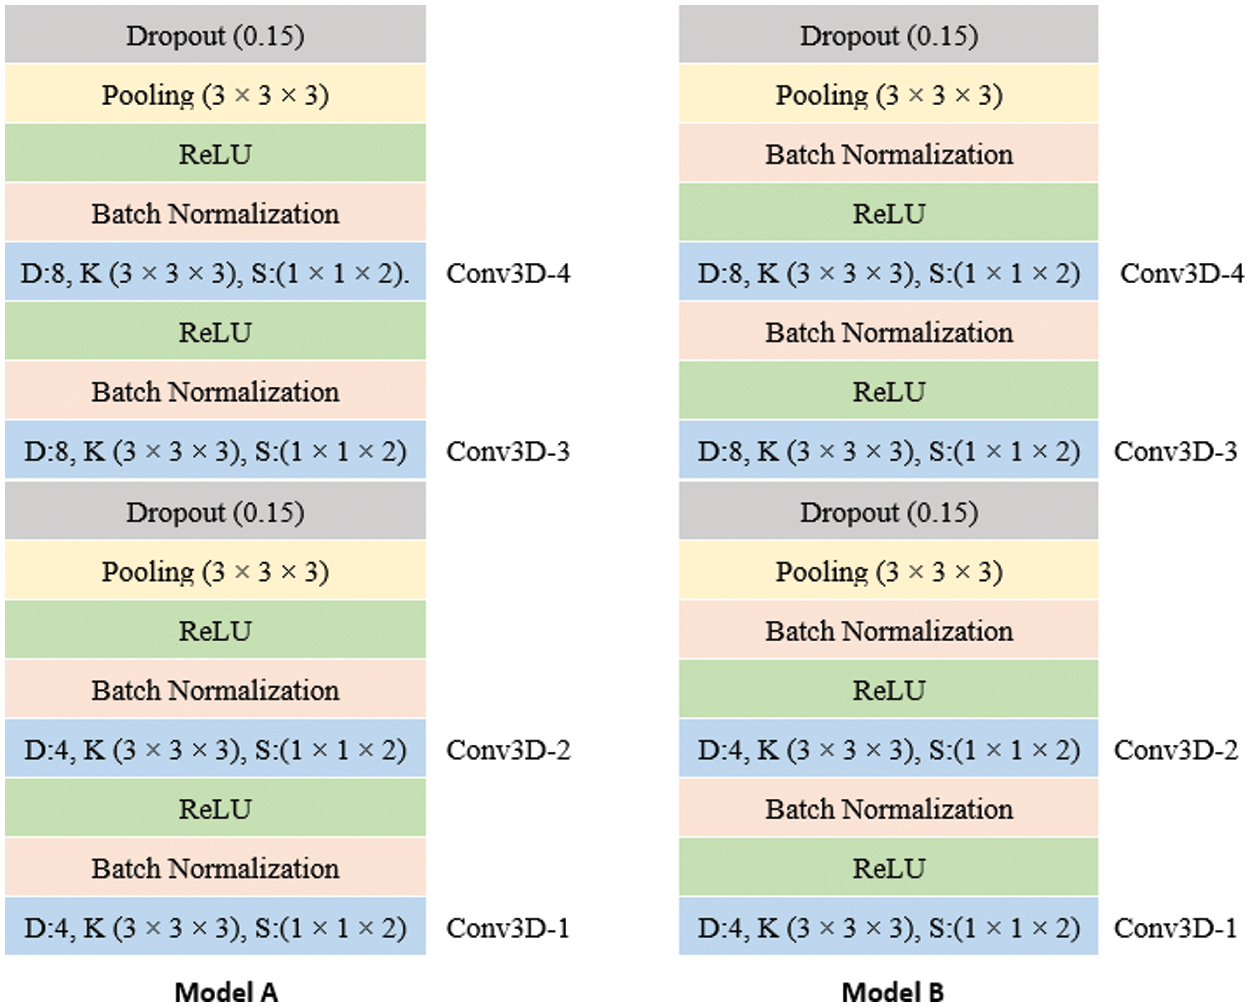
Figure 4: The 3D-CNN units architecture for model A and model B: the D, K, S means the number of the filters for the convolutional, kernel size, stride, respectively
The following subsections describe the used two publicly available datasets to train and test the proposed models.
The Yawning while Driving Dataset (YawDD) [36] was created by the University of Ottawa, Canada. This dataset is used to build and test yawn detection models. It contains videos recorded from in-car cameras of male and female drivers, with and without glasses or sunglasses, from different ethnicities. The in-car cameras are placed either on the dashboard or the front mirror with an FPS rate (frames per second) of 30 and a resolution of 480 × 640 in RGB color. For every participant, three or four videos between 15 and 40 s were taken, with the driver either driving as normal or yawning, with one action for each clip. Normal driving videos include talking, laughing, and singing. Fig. 5 shows an example of 5 consecutive frames of normal driving. Yawning videos have a yawning action segment that begins with a frame containing a closed mouth, then wide-open mouths, and ends with a frame of a re-closed mouth. Fig. 6 presents a sample of yawning action. All yawning videos are cropped into segments, called sequences, containing only the yawning action frames. Because the nearby frames in the sequence are similar, the frames are extracted at a step size of two to reduce redundancy and training time for the model. The number of sequences of normal driving is equal to the number of sequences of yawning driving to ensure balanced samples in classes with 50 frames per sequence. The data is split randomly into training and testing sets in an 80/20 ratio with mixed genders and face view angles.
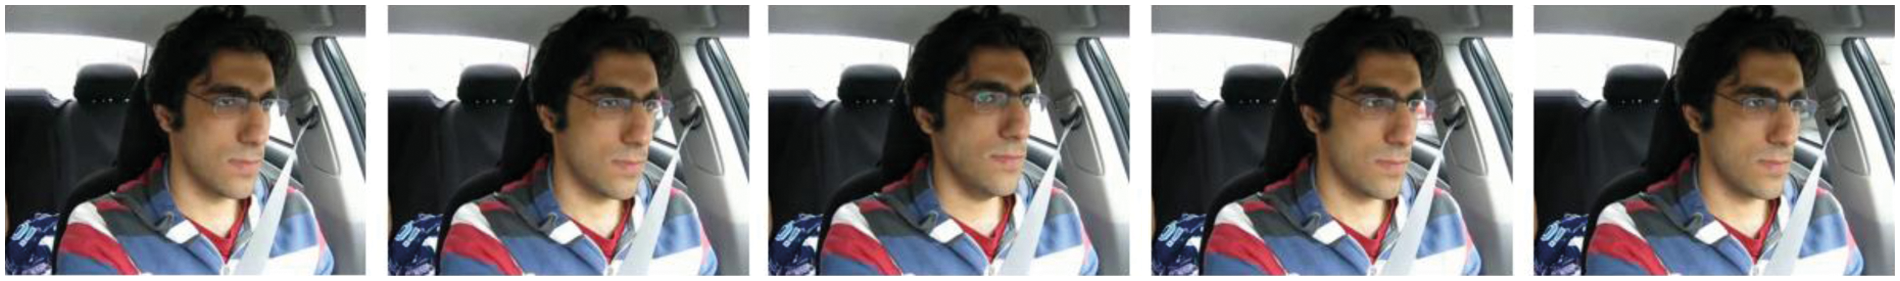
Figure 5: Normal driving from YawDD dataset
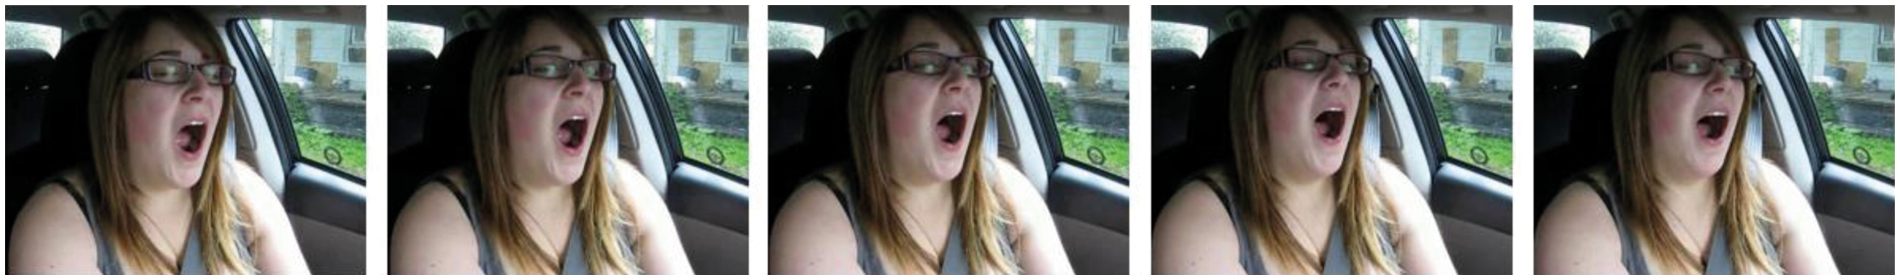
Figure 6: Yawning action from YawDD dataset
Multimodal Multiview and Multispectral Driver Action Dataset (3MDAD) is a new public, well-structured dataset created in 2020 [10,11]. 3MDAD includes two synchronized recorded videos from two views of the drivers, frontal and side. For each view, the RGB and depth synchronized data were recorded using two different Kinect cameras. We used the RGB color data from the front and side views, and we refer to them as Front-3MDAD and Side-3MDAD. The FPS rate was set to 30, and the resolution was 480 × 640. Fifty participants with diverse ages, gender, and body sizes were asked to execute 16 in-car actions in different weather conditions. For each activity, no instruction was given on how to execute the action in order to ensure different styles in performing the same action. In this study, we used only two actions: fatigue actions and normal driving actions. For fatigue action videos, participants usually yawn, rub their eyes, and nod their heads. Each video is split into two 50 frame sequences, with the sequences labeled fatigue or normal. The dataset was divided into 80% training and 20% testing. Videos from subjects 1 to 40 were used for training, and the videos from subjects 41 to 50 were used for testing. Figs. 7 and 8 show samples of drowsy driving. An example of normal driving is shown in Fig. 9.
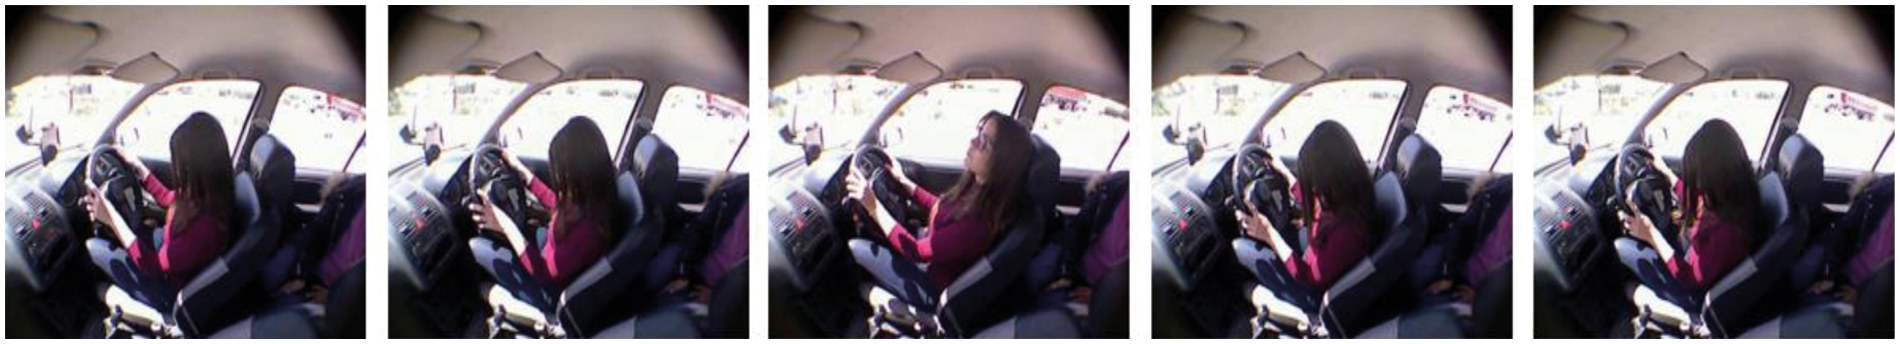
Figure 7: Drowsy driving (head nodding) from Side-3MDAD dataset
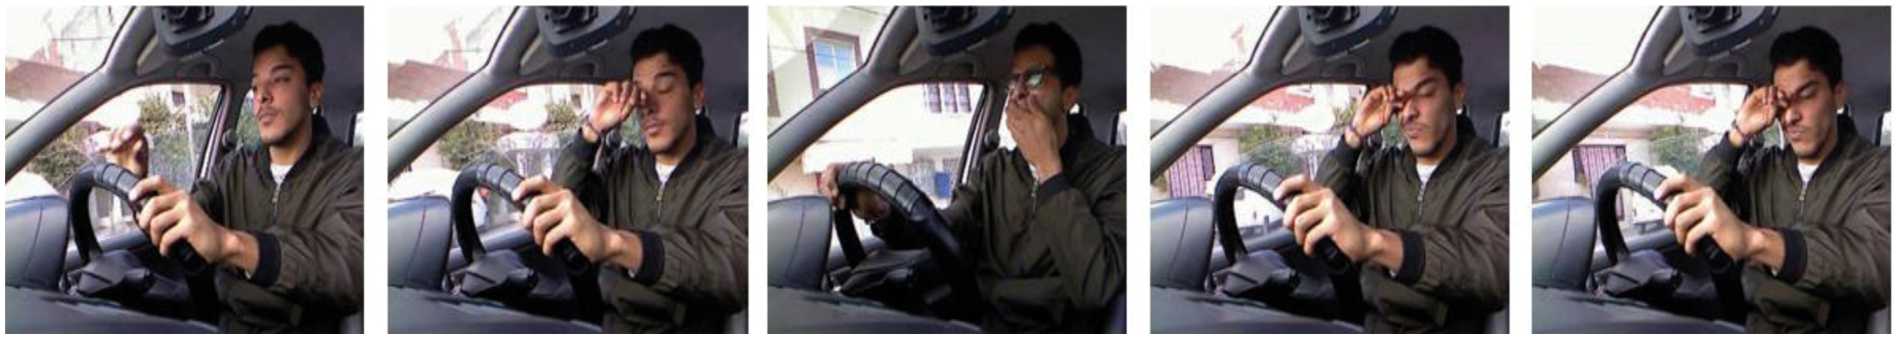
Figure 8: Drowsy driving (eye rubbing, yawning with hand aid) from Front-3MDAD dataset
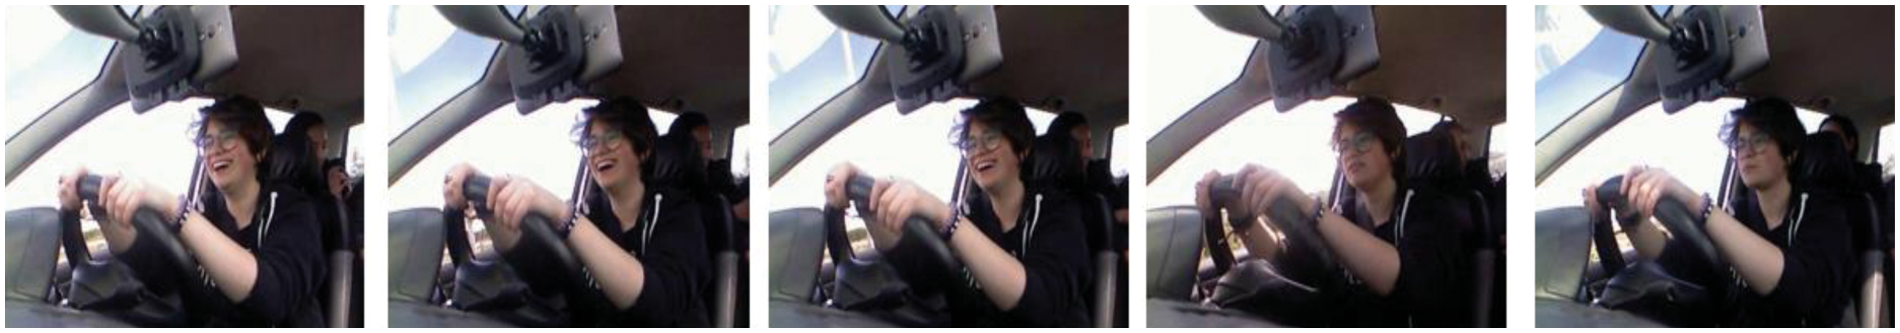
Figure 9: Normal driving from Front-3MDAD dataset
To achieve better generalization and prevent overfitting in the network, we used twenty-eight data augmentation techniques to enhance the size and quality of the training datasets. The objective of this task is to build a robust model that can detect drowsiness status reasonably well with a wide range of driver view angles. We applied each strategy to the entire sequence, generating twenty-eight sequences from each sequence in the training data using the following processes:
• Flip the frames up-down and left-right.
• Transpose and sharpen the frames.
• Rotate the frames for nine different angles (10°- 20°- 30° - 40°- 50° - 60° -70° - 80°- 90°).
• Adjust frames brightness by a 0.2 ratio.
• Rotate the frames to 90°, then flip it left-right.
• Adjust frames brightness by 0.2 ratios, then (flip it up-down, flip it left-right, transpose, sharpen).
• Flip the frames left-right, then rotate them for nine different angles (10°- 20°- 30° - 40°- 50° - 60° -70° - 80°- 90°).
The experimental platform for this study was a PC with an AMD Ryzen 5 3600 6-Core CPU, a frequency of 3.6 GHz, a memory of 32 GB, and a GTX 1660 Super GPU. The TensorFlow framework was chosen as the back end of the Keras platform to build the proposed models. The models were trained end-to-end from scratch for 40 epochs, and the dataset was shuffled before each epoch to ensure randomness. We used the RMSprop optimizer, binary cross-entropy loss function, and a batch size of 256. As the dimensions of the input frames increase, the number of features learned during the training also grows, potentially leading to overfitting. Therefore, this study investigates if we can get a high detection accuracy with small frame sizes by resizing the frames to 60 × 60 before training. Furthermore, to enhance the fitting ability, we normalized the sequence frames before training.
We conducted two experiments on each dataset (Model A and Model B), with the values of all the hyperparameters and the training process settings fixed in each experiment to obtain comparable results. The accuracy, precision, recall, and F1 score are the evaluation metrics used to evaluate the performance of the proposed models in both experiments. These metrics are calculated from the confusion matrix [37] using the given formulas in Tab. 4
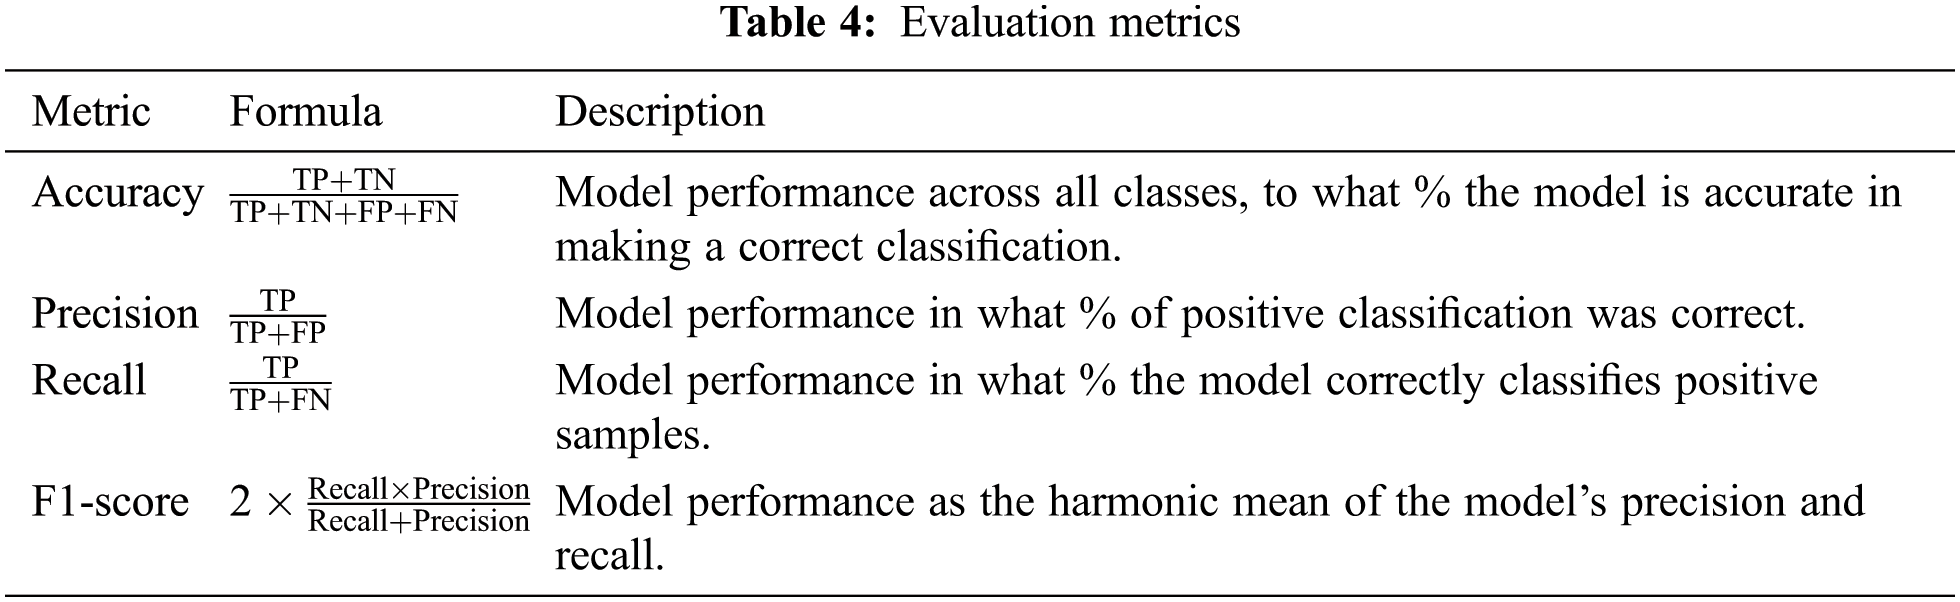
The variables in these evaluations are explained as follows: the true positive (TP) indicates that the model correctly predicted normal driving. True negative (TN) indicated that the model correctly predicted drowsy driving. Errors in the model are represented by the variables false positive (FP) and false-negative (FN). With FP, an incorrect prediction of normal driving was made. With FN, an incorrect prediction of drowsy driving was made.
As shown in Tabs. 5 and 6, both models A and B on YawDD achieved 96% accuracy on the training set in 40 epochs. However, Model B outperformed Model A in the testing data, with 96% detection accuracy. The same results were obtained for the Front-3MDAD dataset. Model B better detected the drowsiness actions in both the training and the testing sets. However, Model A outperformed Model B for the Side-3MDAD dataset, which used the same order of the BN layer as the original paper. Figs. 10–12 show the performance of the trained models on the training set in the form of loss curves and accuracy curves. The general trend of the accuracy curves was increasing and decreasing for the loss curves.
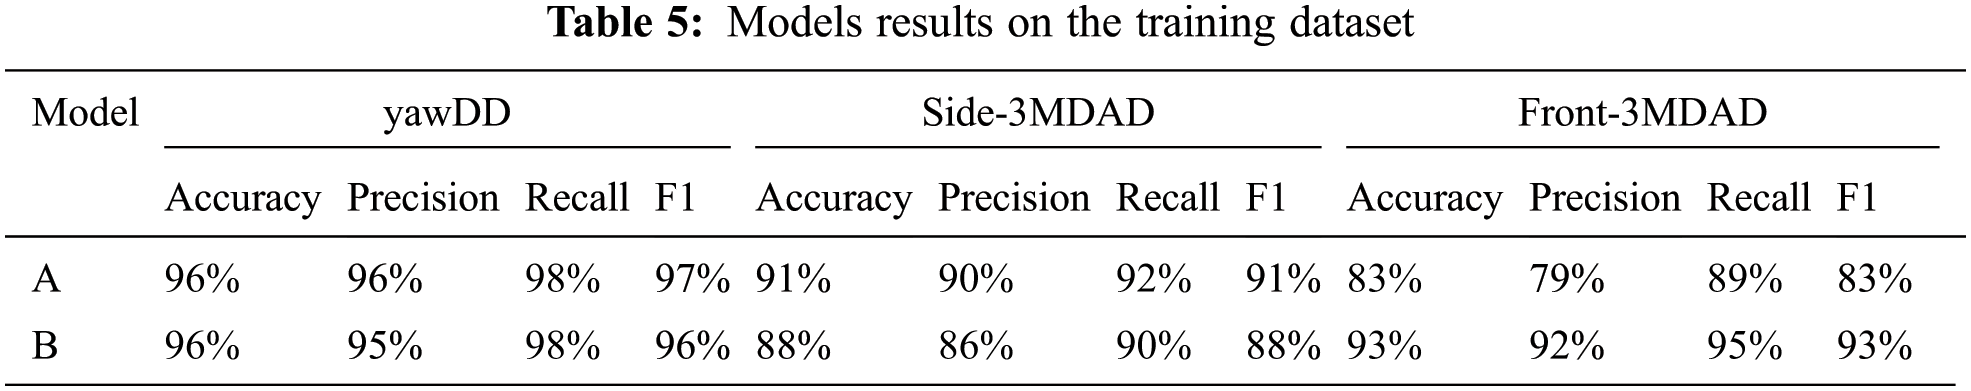
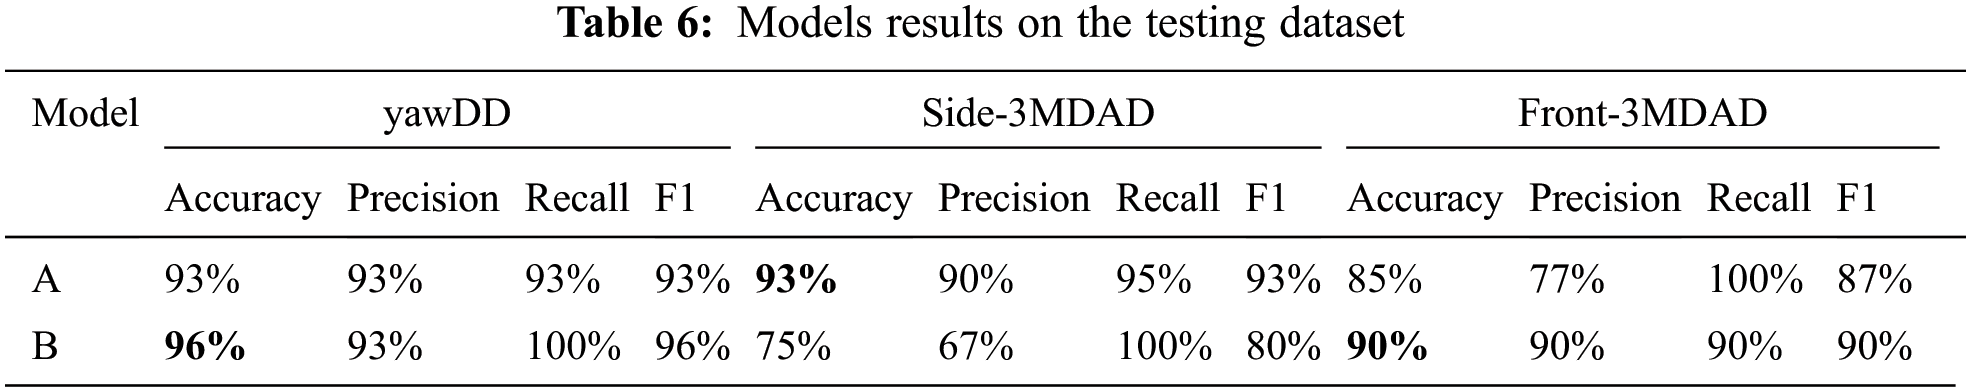
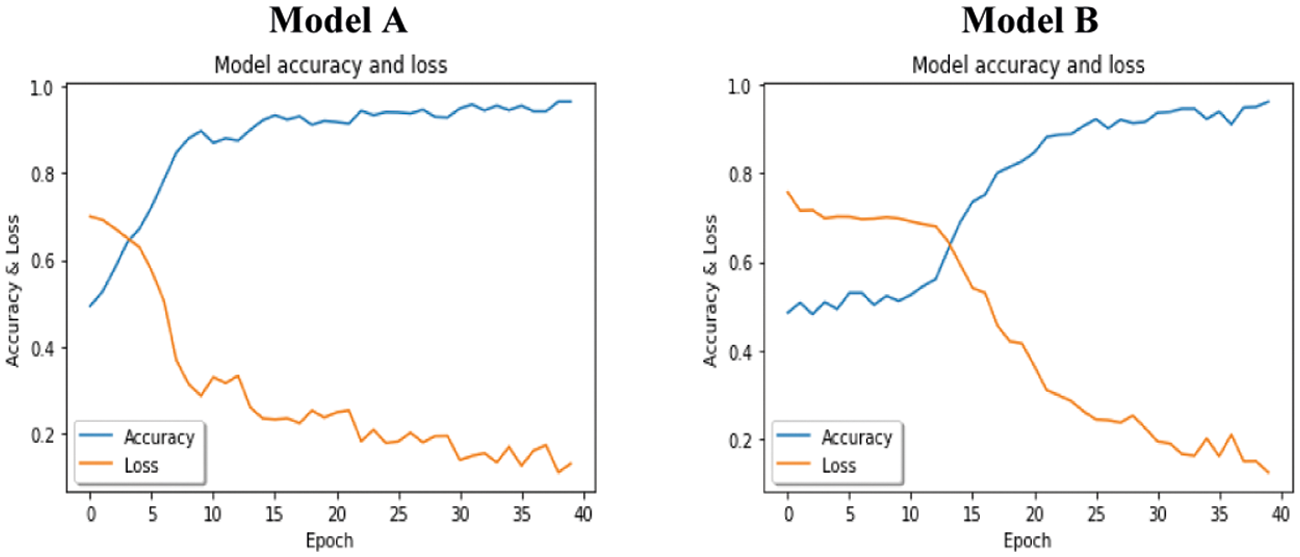
Figure 10: Models accuracy and loss curves on YawDD dataset
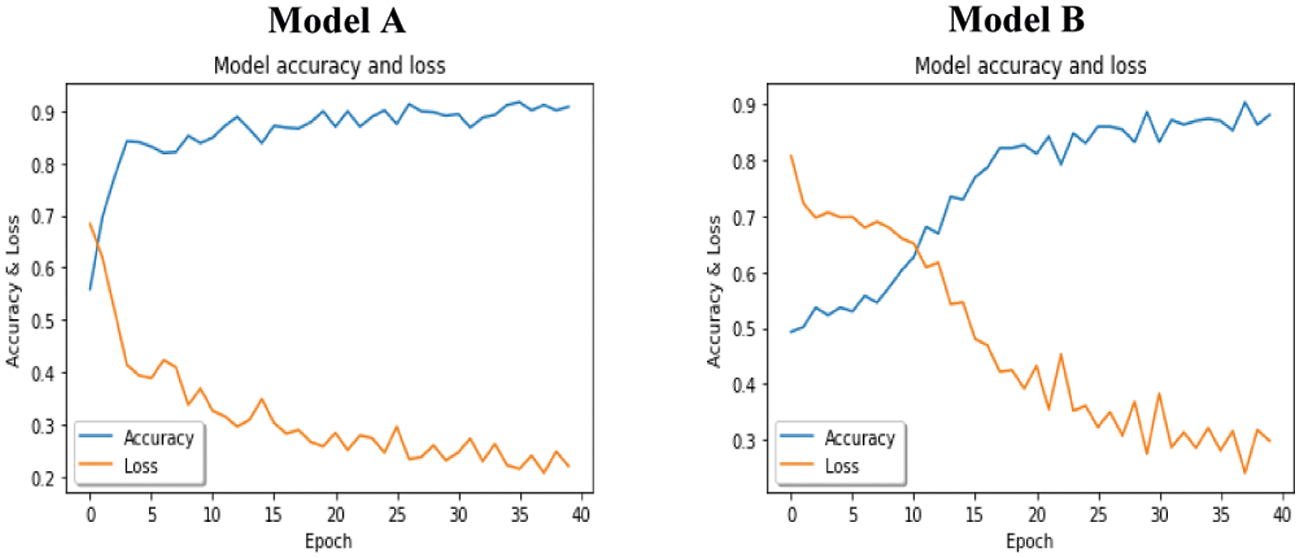
Figure 11: Models accuracy and loss curves on Side-3MDAD dataset
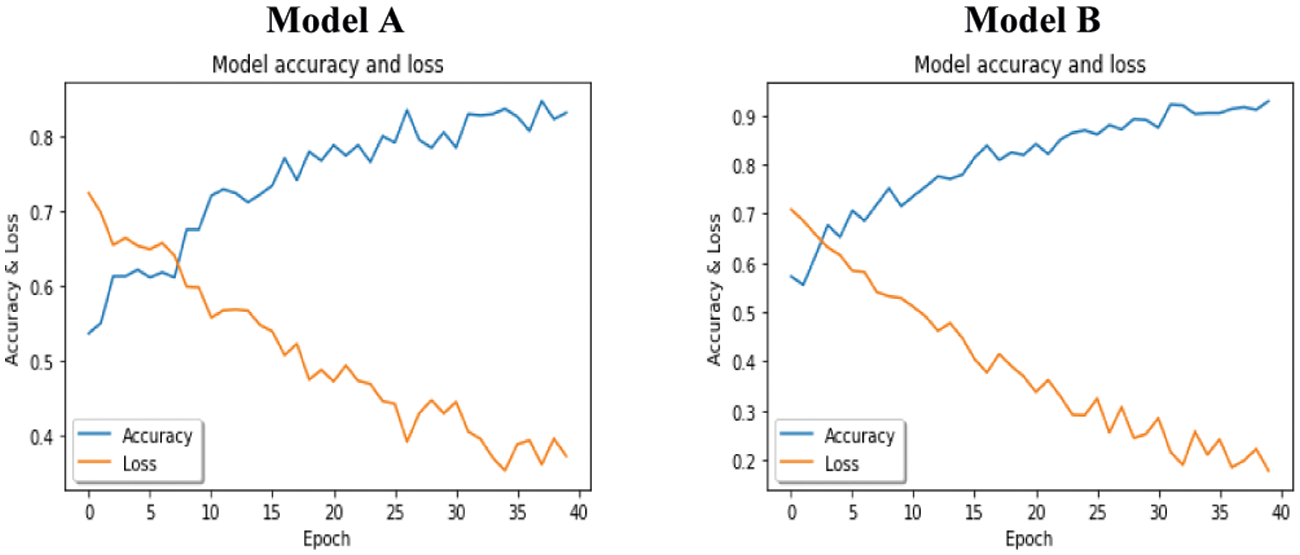
Figure 12: Models accuracy and loss curves on Front-3MDAD dataset
The proposed models perform better on the YawDD dataset than on the side-3MDAD and Front-3MDAD datasets, as they contain far more actions than YawDD with complex backgrounds data. Also, 3MDAD has fewer videos, and for each video, the participants perform multiple actions. For example, in a sleepy driving video, participants may yawn, yawn with their hands, rub their eyes, and nod their heads.
Fig. 13 shows the confusion matrices of the test set for the two models on the YawDD dataset. The diagonal axis number indicates the number of accurate classifications, and the others are the number of inaccurate classifications. As shown in these matrices, two normal driving sequences were incorrectly classified as fatigued driving by model A, and we found that the participants were taking. On the other hand, we got zero false negative alarms with model B.
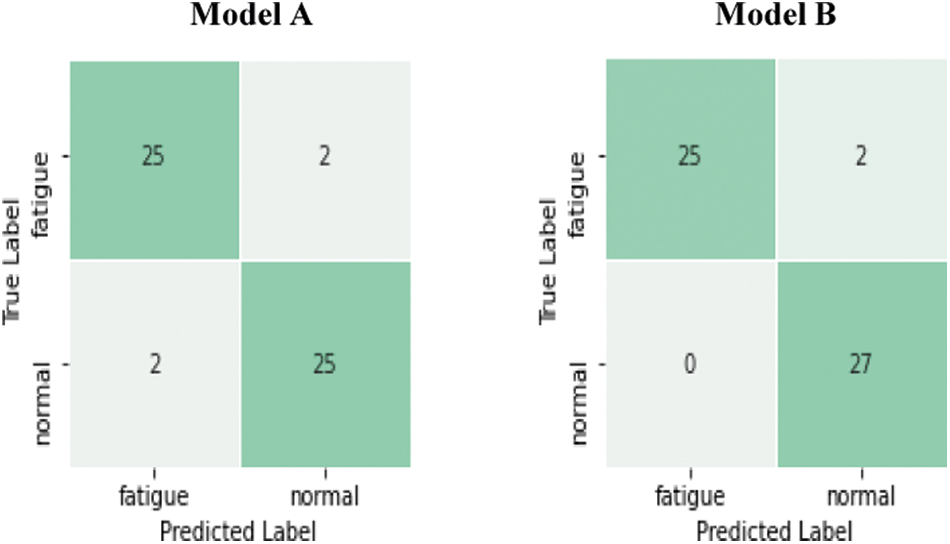
Figure 13: Confusion matrices for test set on YawDD dataset
Fig. 14 shows the confusion matrices of the test set for each model on the Side-3MDAD dataset how model A outperforms model B with only changing the position of the BN layer. The main common feature in the misclassified videos was the poor illumination as a clash of sunlight or shadow.
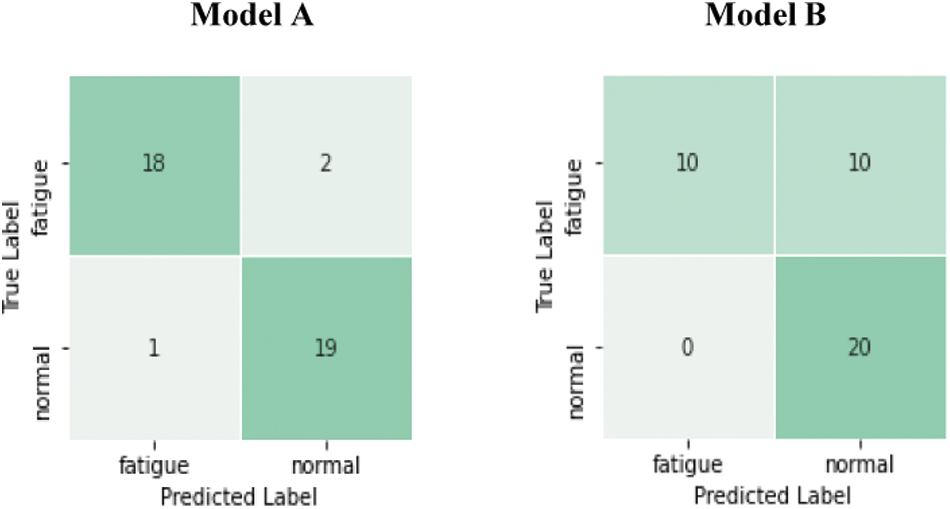
Figure 14: Confusion matrices for test set on Side-3MDAD dataset
Fig. 15 shows how model B outperforms model A based on the confusion matrices of the test set for each model on the Front-3MDAD dataset. After we analyzed the misclassified videos, we found that model A classified six fatigued driving videos as normal. Five of them include a clear passenger face behind the driver (video from participants number 44,48, and 49). Another video from participant number 43 starts with 13 frames acting as normal driving, then she rubbed her eyes and ended it with yawing with her hand. Also, model B could not classify the normal videos and fatigued videos for participant number 49.
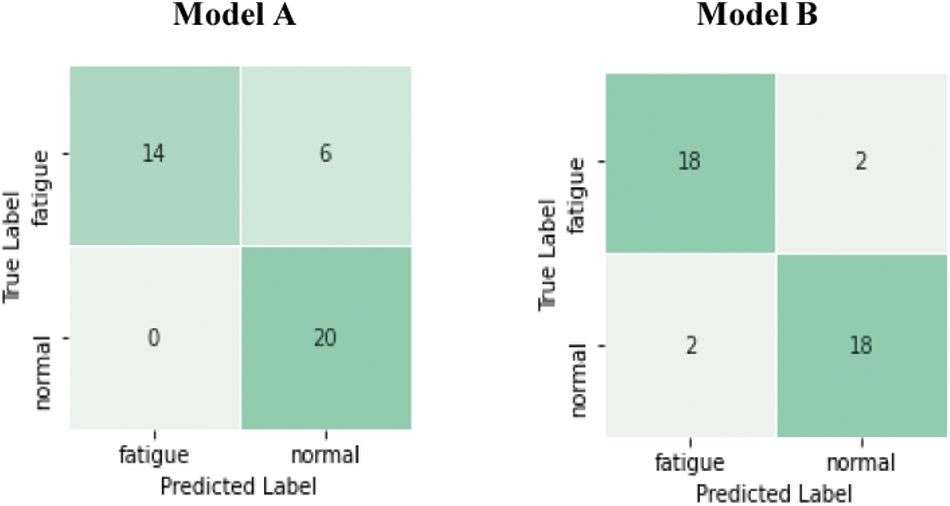
Figure 15: Confusion matrices for test set on Front-3MDAD dataset
Using model A, we got higher detection accuracy on the Side-3MDAD dataset than the Front-3MDAD dataset. One of the main reasons is that we found only the driver is shown in the frame in the Side-3MDAD dataset in the misclassified videos. In contrast, the same videos recorded from the front view camera in the Front-3MDAD dataset include a clear passenger face behind the driver, as shown in Fig. 16.
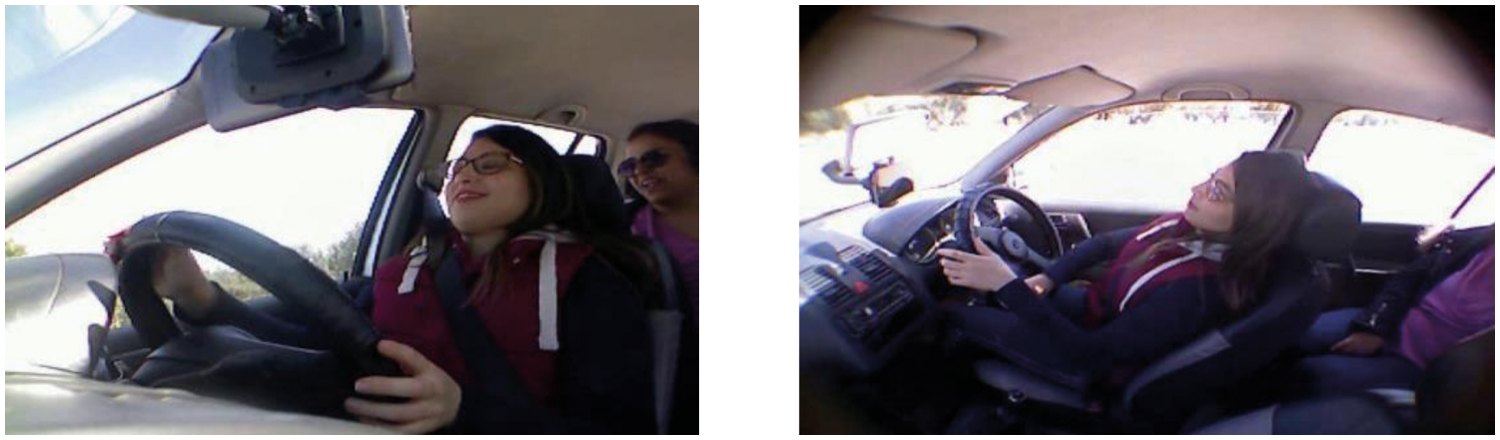
Figure 16: Left image from Front-3MDAD dataset and the right image from Side-3MDAD dataset
From the results provided in Fig. 17, we cannot conclude that one arrangement is absolutely more effective than another. Instead, these findings demonstrate that we should always search for a more efficient way of adopting the BN layers to solve a machine learning problem by doing different experiments.
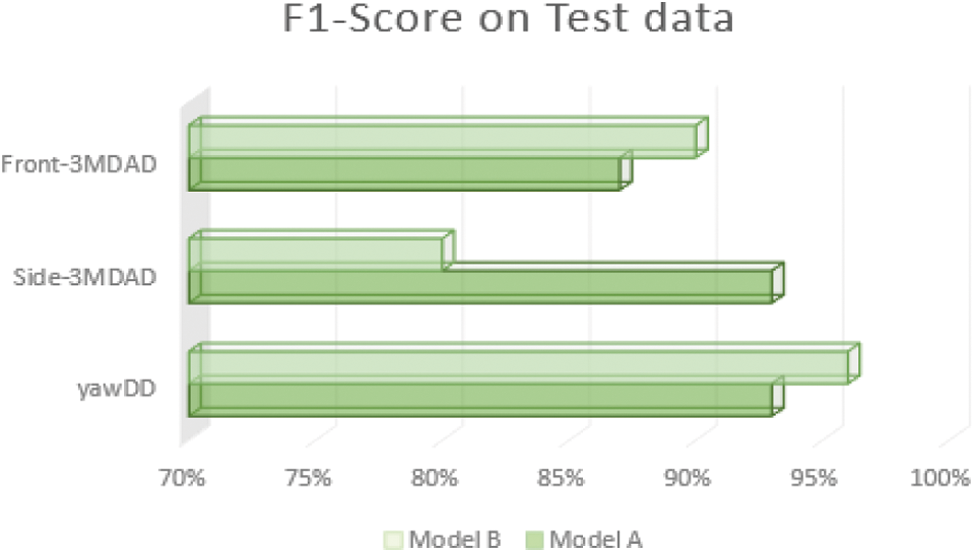
Figure 17: Performance of two models on three public datasets
Although results show a high F1-Score of the proposed system, it is subject to two significant limitations that we need to address in future research. First, the model uses the whole frame as input by that it will learn useless information, so a face detector is needed to analyze only the face regions of the drivers. The second is how we split the data into training and testing without a validation set following the same way used in the state-of-the-art works. Due to the time and computational constraints, we could not apply K-fold cross-validation techniques to get more reliable results.
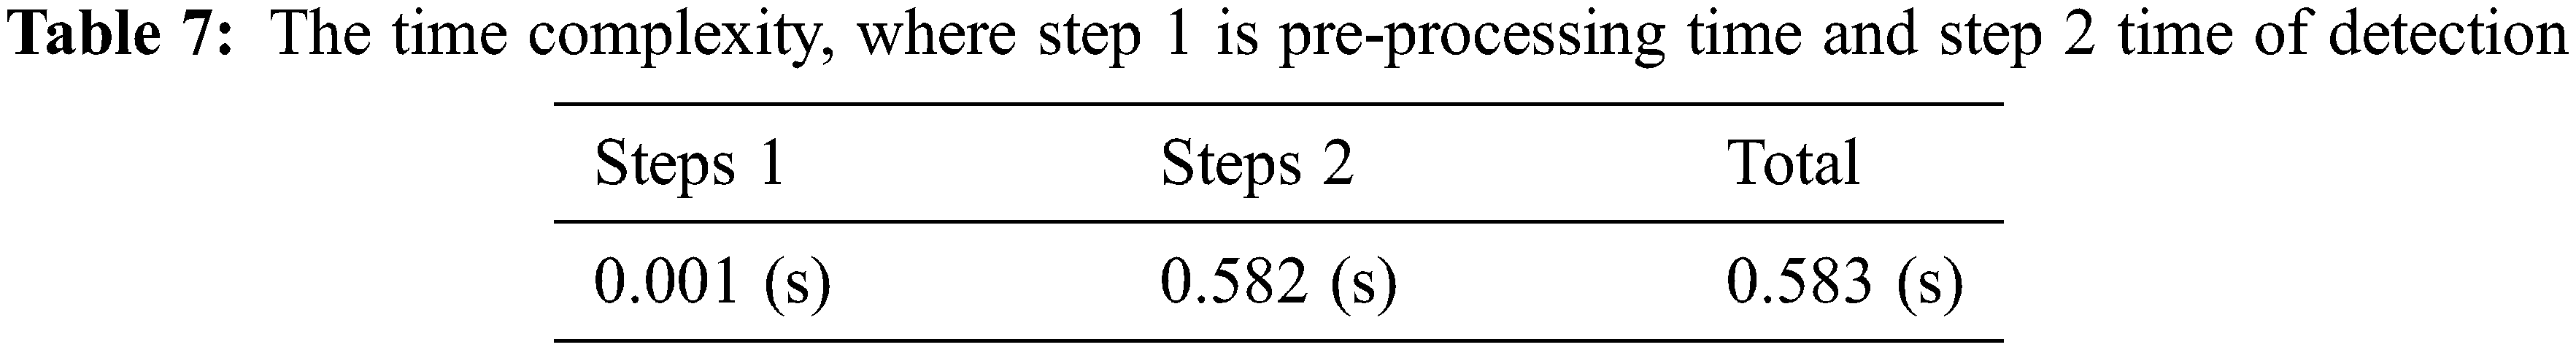
The significance of a drowsiness detection system is to warn when the driver enters into a sleepy state promptly to avoid accidents. As a result, in addition to model accuracy, the designer should consider the real-time performance of the system into account. Tab. 7 shows the time complexity of the proposed 3DCNN-LSTM in second (s). Given an approximately 1.6667-s video (50 frames), the pre-processing stage (step 1) takes about 0.001-s to resize and normalize the 50 frames from the video. In step 2, the model spent about 0.582-s classifying the video as drowsy or normal driving. Overall, the proposed 3DCNN-LSTM model is practical and feasible as a fast and lightweight driver drowsiness detection model.
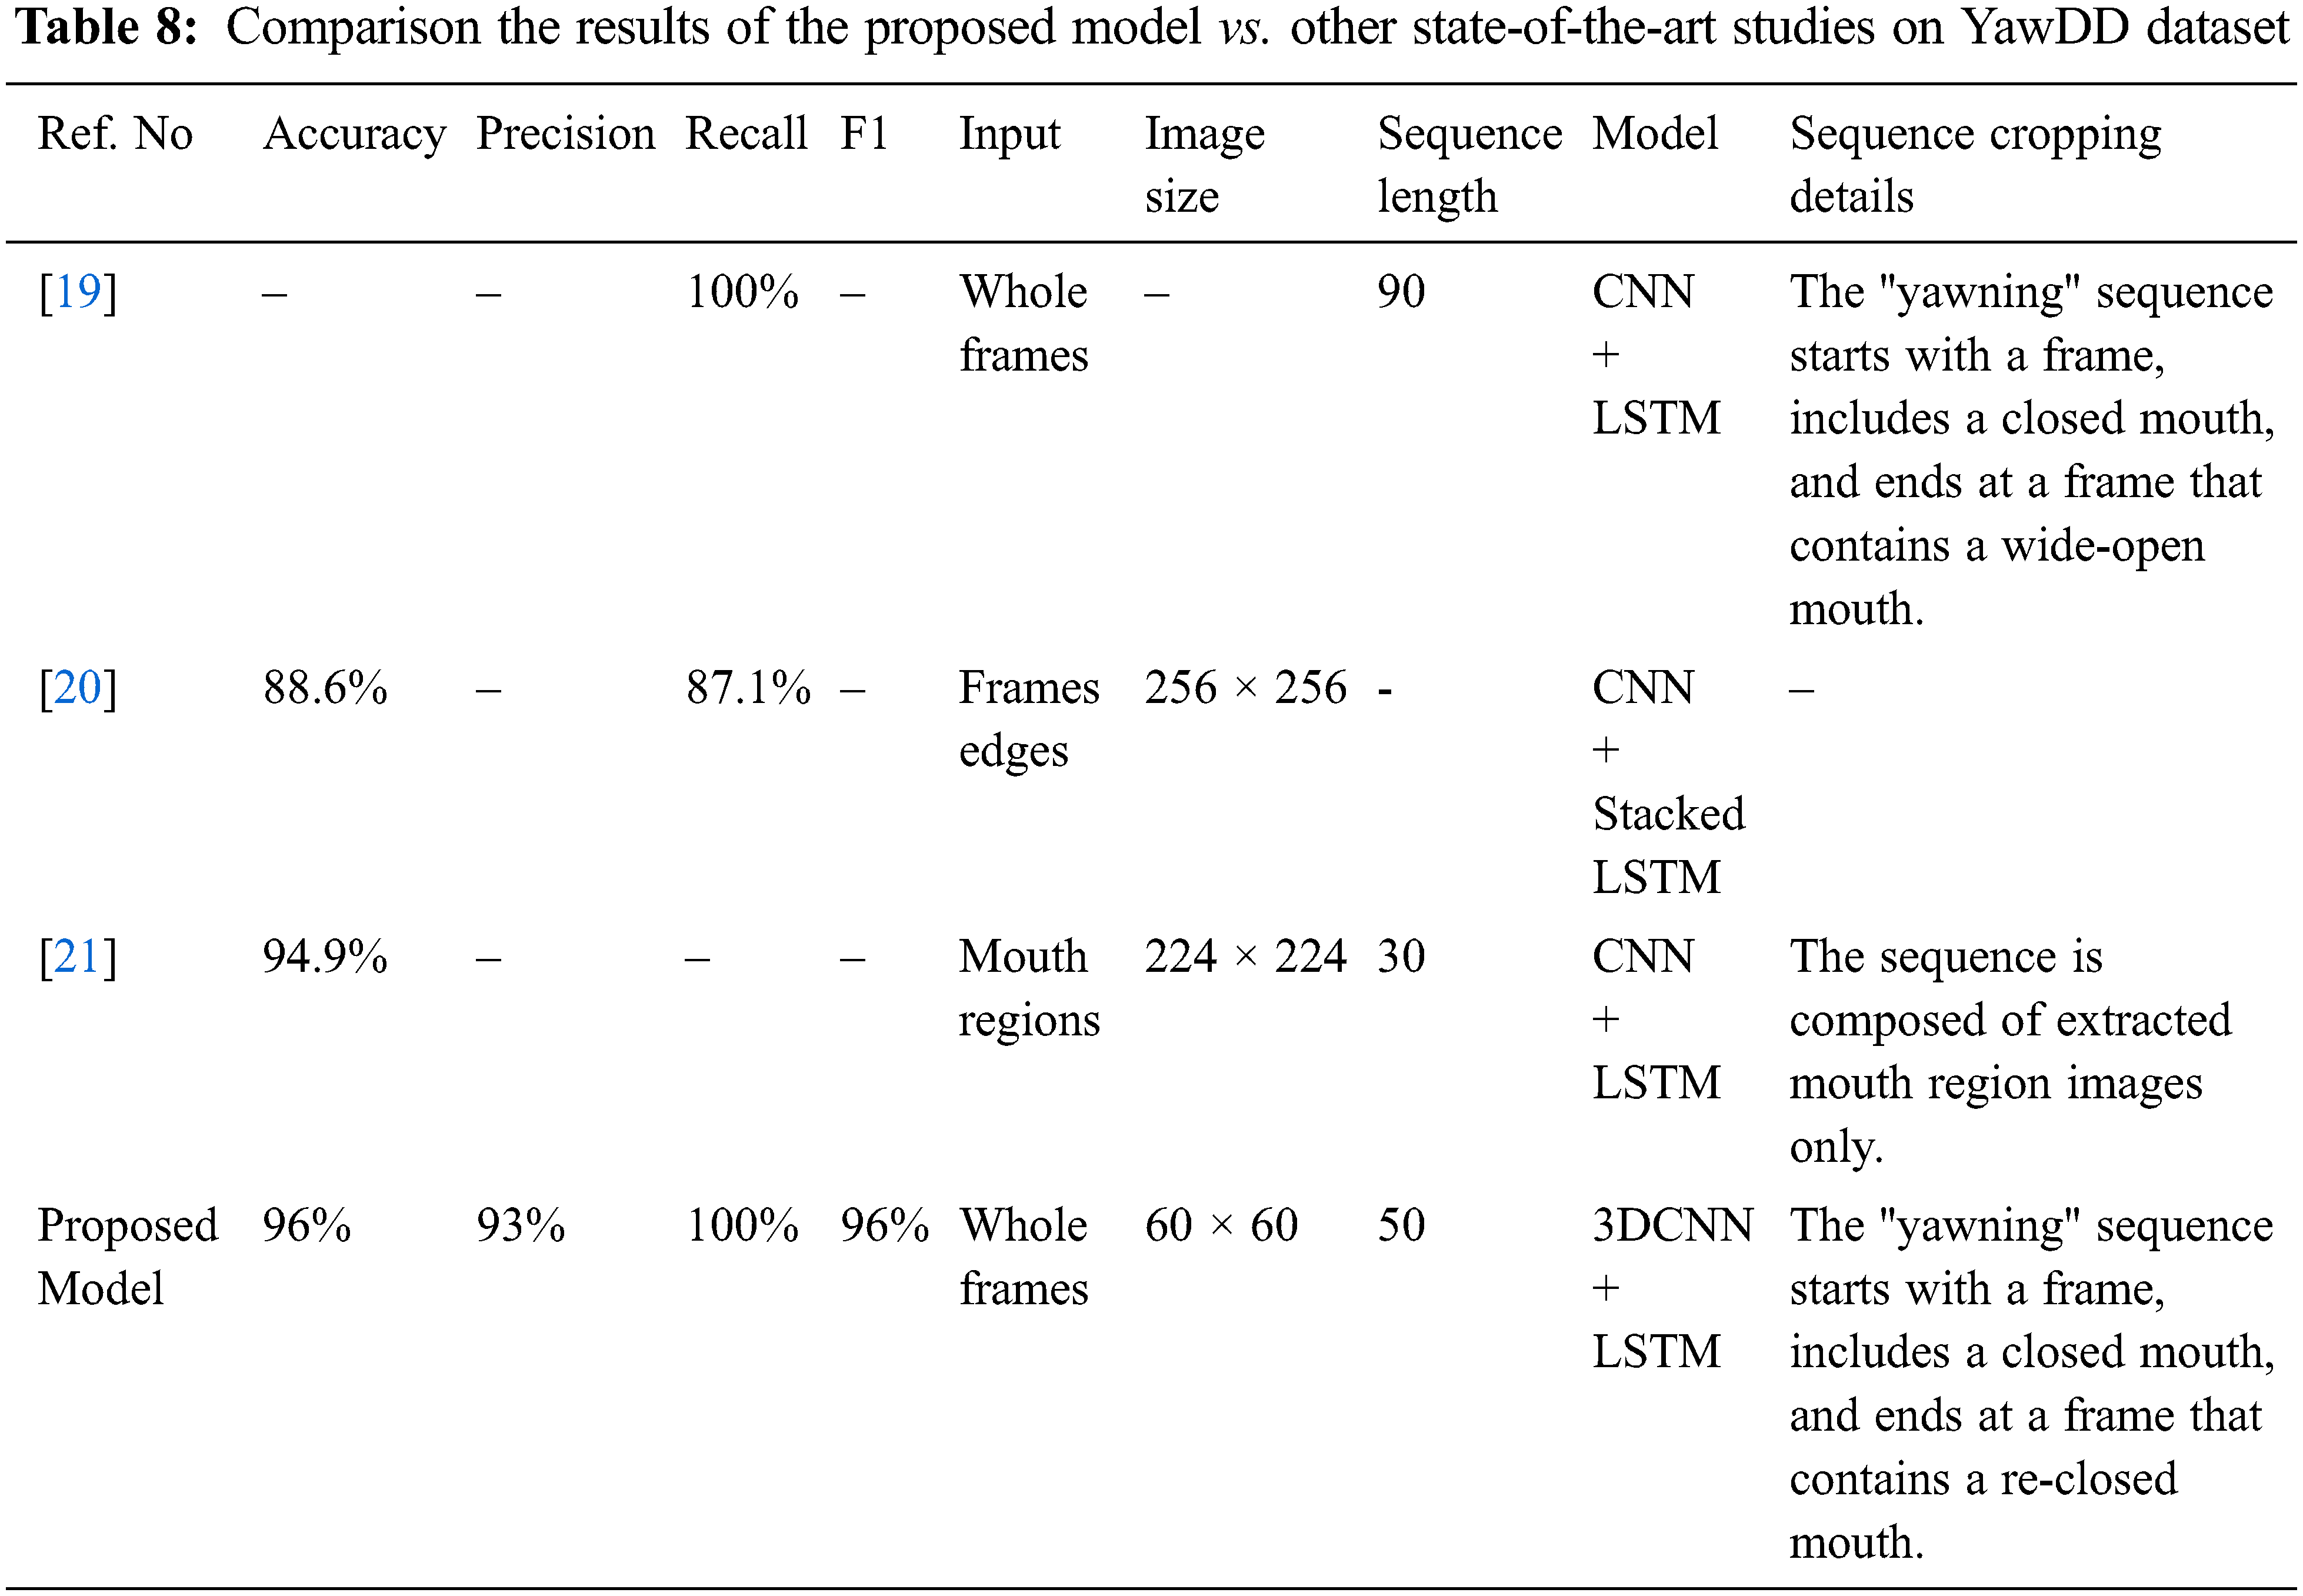
5.2 Comparison Results with State-of-the-art
Because this is the first study used for driver drowsiness detection on the 3MDAD dataset, we compared the proposed framework results with other state-of-the-art studies that used sequence learning on the YawDD dataset only. Tab. 8 shows the comparison results. Although the proposed model outperforms other studies with the highest detection accuracy and smallest image size, it could not be considered a fair comparison. As the YawDD dataset needs manual cropping and extraction for the yawning and normal sequences at the pre-processing stage, and not all the cropping details are available. In addition, different image sizes, sequence lengths, and models were used in each study.
This paper proposed an efficient framework for driver drowsiness detection by combining 3D-CNN and LSTM units to learn drowsiness-related spatiotemporal features of the drivers' faces. To the best of our knowledge, this is the first attempt to utilize this combination to detect driver drowsiness. The 3D-CNN was applied to extract spatiotemporal features within adjacent frames, and the LSTM layer was used to model high-level temporal variation of the drowsiness actions. In addition, we investigated the effect of adding the BN layer in two different places in 3D-CNN (before or after the activation function). The goal of this study was to prove that other positions of the BN layer than the suggested one can speed up the training of the model and avoid overfitting on one dataset but not the other. From the results, it can be concluded that the performance of the proposed model is highly affected by selected positions of the BN layer. In future research, other methods for enhancing the performance of the proposed model will be considered. Face detection approaches will be examined in future studies to focus on the driver face regions instead of using the whole frame as an input. We also aim to explore the possibility of training the model utilizing non-equal sequences length. Another direction for future works would be using hand gesture recognition inspired by [30,38] for drowsiness activity when the drivers rub their eyes or yawn with hand assistance.
Funding Statement: The authors received no specific funding for this study.
Conflicts of Interest: The authors declare that they have no conflicts of interest to report regarding the present study.
1. Global status report on road safety 2015.Geneva: World Health Organization.License: CC BY- NC-SA 3.0 IGO, 2015. [Google Scholar]
2. Global status report on road safety 2018.Geneva: World Health Organization.License: CC BY- NC-SA 3.0 IGO, 2018. [Google Scholar]
3. AAA Foundation for Traffic Safety. 2019 traffic safety culture index.AAA Foundation for Traffic Safety,Technical report, 2020. [Google Scholar]
4. SafetyNet, “Fatigue.European Commission, Directorate-General Transport and Energy,Technical report, 2009. [Google Scholar]
5. J. C. Stutts, J. W. Wilkins and B. V. Vaughn, “Why do people have drowsy driving crashes,” Input From Drivers Who Just Did, vol. 202, no. 638, pp. 5944, 1999. [Google Scholar]
6. S. Kaplan, M. A. Guvensan, A. G. Yavuz and Y. Karalurt, “Driver behavior analysis for safe driving: A survey,” IEEE Transactions on Intelligent Transportation Systems, vol. 16, no. 6, pp. 3017–3032, 2015. [Google Scholar]
7. T. B. Yeferson and T. C. Pablo, “Development of machine learning model for mobile advanced driver assistance (ADA),” in Proc. of Int. Conf. on Information Systems and Software Technologies (ICI2ST), Quito, Ecuador, pp. 162–167, 2019. [Google Scholar]
8. B. Fatima, A. Shahid, S. Ziauddin, A. Safi and H. Ramzan, “Driver fatigue detection using viola jones and principal component analysis,” Applied Artificial Intelligence, vol. 34, no. 6, pp. 456–483, 2020. [Google Scholar]
9. A. Colic, “Design and implementation of driver drowsiness detection system,” Ph.D. dissertation, University of Florida Atlantic, Boca Raton, 2014. [Google Scholar]
10. I. Jegham, A. Ben Khalifa, I. Alouani and M. Mahjoub, “A novel public dataset for multimodal multiview and multispectral driver distraction analysis: 3MDAD,” Signal Processing: Image Communication, vol. 88, pp. 115960, 2020. [Google Scholar]
11. I. Jegham, A. Ben Khalifa, I. Alouani and M. Mahjoub, “MDAD: A multimodal and multiview in-vehicle driver action dataset,” in Proc. of Computer Analysis of Images and Patterns, Salerno, Italy, pp. 518–529, 2019. [Google Scholar]
12. M. Koohzadi and N. M. Charkari, “Survey on deep learning methods in human action recognition,” IET Computer Vision, vol. 11, no. 8, pp. 623–632, 2017. [Google Scholar]
13. H. Kassem, M. Chowdhury, J. Abawajy and A. Al-Sudani, “Yawn based driver fatigue level prediction,” in Proc. of 35th Int. Conf. on Computers and Their Applications, San Francisco, CA, USA, pp. 372–382, 2020. [Google Scholar]
14. Z. Kepesiova, J. Ciganek and S. Kozak, “Driver drowsiness detection using convolutional neural networks,” in Proc. of Cybernetics & Informatics (K&I), Velke Karlovice, Czech Republic, pp. 1–6, 2020. [Google Scholar]
15. W. Kongcharoen, S. Nuchitprasitchai, Y. Nilsiam and J. M. Pearce, “Real-time eye state detection system for driver drowsiness using convolutional neural network,” in Proc. of 17th Int. Conf. on Electrical Engineering/Electronics, Computer, Telecommunications and Information Technology (ECTI-CON), Phuket, Thailand, pp. 551–554, 2020. [Google Scholar]
16. R. Pawar, S. Wamburkar, R. Deshmukh and N. Awalkar, “Driver drowsiness detection using deep learning,” in Proc. of 2nd Global Conf. for Advancement in Technology (GCAT), Bangalore, India, pp. 1–7, 2021. [Google Scholar]
17. A. Pinto, M. Bhasi, D. Bhalekar, P. Hegde and S. G. Koolagudi, “A deep learning approach to detect drowsy drivers in real time,” in Proc. of IEEE 16th India Council Int. Conf., Rajkot, India, pp. 1–4, 2019. [Google Scholar]
18. B. K. Savas and Y. Becerikli, “Real time driver fatigue detection system based on multi-task ConNN,” IEEE Access, vol. 8, pp. 12491–12498, 2020. [Google Scholar]
19. Y. Xie, K. Chen and Y. Murphey, “Real-time and robust driver yawning detection with deep neural networks,” in Proc. of IEEE Sym. Series on Computational Intelligence (SSCI), Bangalore, India, pp. 532–538, 2018. [Google Scholar]
20. W. Zhang and J. Su, “Driver yawning detection based on long short term memory networks,” in Proc. of IEEE Sym. Series on Computational Intelligence (SSCI), Honolulu, HI, USA, pp. 1–5, 2017. [Google Scholar]
21. Y. Fei, B. Li and H. Wang, “Long short-term memory network based fatigue detection with sequential mouth feature,” in Proc. of Int. Sym. on Autonomous Systems (ISAS), Guangzhou, China, pp. 17–22, 2020. [Google Scholar]
22. Z. Xiao, Z. Hu, L. Geng, F. Zhang, J. Wu et al., “Fatigue driving recognition network: Fatigue driving recognition via convolutional neural network and long short-term memory units,” IET Intelligent Transport Systems, vol. 13, no. 9, pp. 1410–1416, 2019. [Google Scholar]
23. X. Ma, L. Chau and K. Yap, “Depth video-based two-stream convolutional neural networks for driver fatigue detection,” in Proc. of Int. Conf. on Orange Technologies (ICOT), Singapore, pp. 155–158, 2017. [Google Scholar]
24. S. Jamshidi, R. Azmi, M. Sharghi and M. Soryani, “Hierarchical deep neural networks to detect driver drowsiness,” Multimedia Tools and Applications, vol. 88, no. 10, pp. 16045–16058, 2021. [Google Scholar]
25. Y. Ed-Doughmi, N. Idrissi and Y. Hbali, “Real-time system for driver fatigue detection based on a recurrent neuronal network,” Journal of Imaging, vol. 6, no. 3, pp. 8, 2020. [Google Scholar]
26. J. Yu, S. Park, S. Lee and M. Jeon, “Representation learning, scene understanding, and feature fusion for drowsiness detection,” in Proc. of Asian Conf. on Computer Vision, Taipei, Taiwan, pp. 165–177, 2017. [Google Scholar]
27. H. Yao, W. Zhang, R. Malhan, J. Gryak and K. Najarian, “Filter-pruned 3D convolutional neural network for drowsiness detection,” in Proc. of 40th Annual Int. Conf. of the IEEE Engineering in Medicine and Biology Society (EMBC), Honolulu, HI, USA, pp. 1258–1262, 2018. [Google Scholar]
28. D. Tran, L. Bourdev, R. Fergus, L. Torresani and M. Paluri, “Learning spatiotemporal features with 3D convolutional networks,” in Proc. of the IEEE Int. Conf. on Computer Vision (ICCV), Santiago, Chile, 2015. [Google Scholar]
29. M. Lin, S. Ruan and Y. Tu, “A 3DCNN-LSTM hybrid framework for semg-based noises recognition in exercise,” IEEE Access, vol. 8, pp. 162982–162988, 2020. [Google Scholar]
30. L. Zhang, G. Zhu, P. Shen, J. Song, S. A. Shah et al., “Learning spatiotemporal features using 3DCNN and convolutional LSTM for gesture recognition,” in Proc. of the IEEE Int. Conf. on Computer Vision (ICCV), Venice, Italy, pp. 3120–3128, 2017. [Google Scholar]
31. G. Zhu, L. Zhang, P. Shen, J. Song, S. A. A.Shah et al., “Continuous gesture segmentation and recognition using 3DCNN and convolutional LSTM,” IEEE Transactions on Multimedia, vol. 21, no. 4, pp. 1011–1021, 2018. [Google Scholar]
32. S. Chen, S. Zhang, H. Geng, Y. Chen, C. Zhang et al., “Strong spatiotemporal radar echo nowcasting combining 3DCNN and bi-directional convolutional LSTM,” Atmosphere, vol. 11, no. 6, pp. 569, 2020. [Google Scholar]
33. I. Fung and B. Mak, “End-to-end low-resource lip-reading with maxout CNN and LSTM,” in Proc. of IEEE Int. Conf. on Acoustics, Speech and Signal Processing (ICASSP), Calgary, AB, Canada, pp. 2511–2515, 2018. [Google Scholar]
34. X. Ouyang, S. Xu, C. Zhang, P. Zhou, Y. Yang et al., “A 3D-CNN and LSTM based multi-task learning architecture for action recognition,” IEEE Access, vol. 7, pp. 40757–40770, 2019. [Google Scholar]
35. S. Ioffe and C. Szegedy, “Batch normalization: Accelerating deep network training by reducing internal covariate shift,” in Proc. of 32nd Int. Conf. on Int. Conf. on Machine Learning (ICML'15), Lille, France, pp. 448–456, 2015. [Google Scholar]
36. S. S. Abtahi, M. Omidyeganeh, S. Shirmohammadi and B. Hariri, “YawDD: A yawning detection dataset,” in Proc. of 5th ACM Multimedia Systems Conf. (MMSys ‘14), Singapore, Singapore, pp. 24–28, 2014. [Google Scholar]
37. M. Swamynathan, “Step 3: Fundamentals of machine learning,” in Mastering Machine Learning with Python in Six Steps, 2nd ed., Bangalore, India: Apress, pp. 205–206, 2019. [Google Scholar]
38. T. R. Gadekallu, M. Alazab, R. Kaluri, P. K. R. Maddikunta, S. Bhattacharya et al., “Hand gesture classification using a novel CNN-crow search algorithm,” Complex & Intelligent Systems, vol. 7, no. 4, pp. 1–14, 2021. [Google Scholar]
 | This work is licensed under a Creative Commons Attribution 4.0 International License, which permits unrestricted use, distribution, and reproduction in any medium, provided the original work is properly cited. |