DOI:10.32604/csse.2023.024901
| Computer Systems Science & Engineering DOI:10.32604/csse.2023.024901 | |
| Article |
Metaheuristic Based Clustering with Deep Learning Model for Big Data Classification
1Department of Electronics and Communication Engineering, University College of Engineering Ariyalur, Ariyalur, 621704, India
2Department of Biomedical Engineering, Faculty of Engineering, Karpagam Academy of Higher Education, Coimbatore, 641021, India
3Department of Computer Science and Engineering, Sona College of Technology, Salem, 636 005, India
4Department of Electronics and Communication Engineering, Saveetha School of Engineering, Saveetha Institute of Medical and Technical Sciences, Chennai, 600077, India
5Deparmtent of Applied Data Science, Noroff University College, Kristiansand, Norway
6Department of Computer Science and Engineering, Soonchunhyang University, Asan, Korea
*Corresponding Author: Yunyoung Nam. Email: ynam@sch.ac.kr
Received: 03 November 2021; Accepted: 20 December 2021
Abstract: Recently, a massive quantity of data is being produced from a distinct number of sources and the size of the daily created on the Internet has crossed two Exabytes. At the same time, clustering is one of the efficient techniques for mining big data to extract the useful and hidden patterns that exist in it. Density-based clustering techniques have gained significant attention owing to the fact that it helps to effectively recognize complex patterns in spatial dataset. Big data clustering is a trivial process owing to the increasing quantity of data which can be solved by the use of Map Reduce tool. With this motivation, this paper presents an efficient Map Reduce based hybrid density based clustering and classification algorithm for big data analytics (MR-HDBCC). The proposed MR-HDBCC technique is executed on Map Reduce tool for handling the big data. In addition, the MR-HDBCC technique involves three distinct processes namely pre-processing, clustering, and classification. The proposed model utilizes the Density-Based Spatial Clustering of Applications with Noise (DBSCAN) technique which is capable of detecting random shapes and diverse clusters with noisy data. For improving the performance of the DBSCAN technique, a hybrid model using cockroach swarm optimization (CSO) algorithm is developed for the exploration of the search space and determine the optimal parameters for density based clustering. Finally, bidirectional gated recurrent neural network (BGRNN) is employed for the classification of big data. The experimental validation of the proposed MR-HDBCC technique takes place using the benchmark dataset and the simulation outcomes demonstrate the promising performance of the proposed model interms of different measures.
Keywords: Big data; data classification; clustering; mapreduce; dbscan algorithm
Big data is generally known as a set of data that exceed the range which could be extracted, processed, refined, and managed by the typical databases and management tools [1]. In another word, the word “big data” denotes the data i.e., complicated based on the variety and volume; but, it is impossible to handle conventional tools, and thus, they could not extract their knowledge at predefined time and hidden knowledge [2]. As mentioned earlier, researchers try to make methodologies, structures, and novel methods for processing, controlling, and managing this amount of data that has led to the utilize of data mining tools [3]. The most important method of data mining is clustering (cluster analyses), i.e., an unsupervised model to find clusters with maximal comparison within a cluster, and a minimum comparison among the clusters are similar to one another, without predictions in the comparison of thing. With the increase of databases, researcher’s efforts are concentrated on finding effective and efficient clustering methods to afford a consistent and quick decision making ground which can be employed in a realtime scenarios [4].
As an essential tool of data mining, clustering algorithm plays a significant part in big data analyses. Clustering method is mostly separated to partition based, model based, density based, and hierarchical based clustering. Each clustering method is proposed for tackling the similar problem of collecting single and different points in groups in this way, they are equal to one another or unequal to point of another cluster [5]. The works in this manner: (1) arbitrarily choose primary cluster and (2) iteratively enhance the cluster till optimum solutions are attained. Clustering has huge applications [6]. E.g., clustering is employed in intrusion detection systems (IDS) for detecting abnormal behaviors. Also, Clustering is widely employed in text analyses for classifying the document into distinct classes. But, the scale of data produced with advanced technology is dramatically increasing, this method becomes computationally costly and doesn’t scaleup to huge datasets [7]. Therefore, they aren’t able to encounter the present demands of modern data intensive applications.
In order to manage big data, clustering algorithm should be capable of extracting patterns from data which is heterogeneous, unstructured, and massive. Apache Spark is an opensource platform developed to faster distribute big data processing [8]. Initially, Spark represents a parallel computing framework offer many innovative services like realtime stream processing and machine learning algorithm. Hence, Spark is attaining a novel momentum, trends have seen the onset of wider adaption by enterprise due to its comparative benefits. Spark gained more interest from the researcher to process big data due to its supremacy on another model such as Hadoop MapReduce [9]. Also, Sparks could run-on Hadoop cluster and accessing any Hadoop data sources. Furthermore, Spark Parallelization of clustering algorithm is an active study problem, and researcher finds a way to enhance the performances of clustering algorithm. The execution of clustering algorithms with sparks has lately gained huge attention from the researchers.
This paper presents an efficient Map Reduce based hybrid density based clustering and classification algorithm for big data analytics (MR-HDBCC) on Map Reduce environment. The MR-HDBCC model utilizes the Density-Based Spatial Clustering of Applications with Noise (DBSCAN) technique which is capable of detecting random shapes and diverse clusters with noisy data. For improving the performance of the DBSCAN technique, a hybrid model using cockroach swarm optimization (CSO) algorithm is developed for the exploration of the search space and determine the optimal parameters for density based clustering. At last, bidirectional gated recurrent neural network (BGRNN) is employed for big data classification. The performance of the proposed MR-HDBCC technique is examined against the benchmark dataset.
In order to construct an effective IDS on big data, Wang et al. [10] proposed a classification method on the basis of data reduction and data clustering. In training phase, the training data is separated into clusters using same size through Mini Batch K-Means approach, in the meantime, center of all the clusters is employed as its index. Later, they elect demonstrative instances for all the clusters to execute the tasks of data reduction and employ the cluster which includes demonstrative instances to construct KNN detection models. In detecting phase, sort cluster depending on the distance among the cluster indexes and test samples, and attain KNN cluster in which they detect KNN model. Peng et al. [11] proposed a clustering technique for IDS that depends on Mini Batch K-means integrated to PCA method. Initially, a pre-processing technique is presented for digitizing the string, and later the dataset is normalized for improving the clustering efficacy. Next, the PCA methods are employed for reducing the dimensions of treated datasets aim to additionally enhance the clustering efficacy, and later mini batch K-means methods are employed for data clustering. Particularly, they employ K-means for initializing the center of clusters for avoiding the algorithms gets to the local optimal, furthermore, they select the Calsski Harabasz indicators thus the clustering results are defined.
In Bollaa [12], MLBDC-PP-LWO models are proposed. In this presented method, afterward the detection of sensitive data from data cluster, sensitive data is generalized/protected. The model presented is related to the present model and the finding shows that the presented method privacy preservation level is higher when compared to conventional models. Li et al. [13] proposed an automated fast double KNN classification method based on manually defining the hierarchical clustering and cluster center. They present manually defining the cluster center to the KNN in training method. Specifically, big data sample is separated into many portions based on the clustering method. After, the cluster nearer to testing sample is excavated as novel training sample in the testing procedure.
In Lakshmanaprabu et al. [14], the big data analytics on IoT based medical systems are proposed by the MapReduce and RFC method. The e-health information is gathered from the patient who suffers from distinct diseases is deliberated for analysis. The optimum attribute is selected through an IDA model from the databases for better classification. At last, RFC classifiers are employed for classifying the e-health information through an optimum feature. In Li et al. [15], a new method is presented for achieving a cost efficient big data clustering in the cloud. Through training the regression models using the sample data, they could create extensively employed k-means and EM algorithm stops manually at an earlier stage when the required accuracy is attained. Experiment has been performed on 4 common datasets and the result demonstrates that k-means and EM algorithm could attain higher cost efficiency in the cloud.
In Lu [16], an increment K-means clustering model on the basis of density is presented based on K-means method. Initially, the density of data point is evaluated, and all fundamental clusters are made up of the center point where density isn’t lesser compared with the proved thresholds and the point within the density range. Next, the fundamental clusters are fused based on the distances among the 2 cluster centers. Lastly, the point isn’t separated from any cluster is separated to the cluster closer to them. To enhance the efficacy of the model and reduces the time complexity, the distributed databases are employed for stimulating the distributed memory space and parallelizes the method on Hadoop platforms of CC. Venkatesh et al. [17] employed a BPA method for Predicting Diseases with NB Techniques. It provides probabilistic classifications depends on Bayes concept with independence assumption among the features. The NB method is appropriate for large datasets, particularly for big data. The NB approach trains the heart diseases data driven from UCI-ML repository. Next, it was made prediction on the test data for predicting the classifications.
Elkano et al. [18] proposed a novel FRBCS for Big Data classification problem (CHI-BD) i.e., capable of providing exactly the similar models like the one that will be attained using the original Chi et al. model when it can be performed by this amount of data. Hernández et al. [19], proposed a 2 hybrid neural architecture integrating morphological neurons and perception. The primary framework is known as MLNN includes hidden layer of morphological neurons and output layer of traditional perceptron that is ability to extract features. The next framework, named LMNN is made up of many perceptron layers as feature extractors, an output layer of morphological neurons for nonlinear classifications. Both frameworks were trained using stochastic gradient descent.
In this paper, an effective MR-HDBCC technique has been developed for big data classification in MapReduce environments. The proposed MR-HDBCC technique is executed on Map Reduce tool for handling the big data. In addition, the MR-HDBCC technique involves three distinct processes namely pre-processing, hybrid DBSCAN based clustering, and BiGRNN based classification. Fig. 1 illustrates the overall working process of proposed MR-HDBCC model. The detailed working of these modules is offered in the succeeding sections.

Figure 1: Overall process of MR-HDBCC model
3.1 MapReduce Programming Model
Hadoop, proposed by the Apache Software Basis, is an opensource platform developed by Doug Cutting and Mike Cafarella in 2005. The goal is to provide a platform for distributed processing and storage. The basic model which developed the Hadoop architecture is given below:
1) Hadoop Common: it has utilities and libraries.
2) Hadoop Distributed File System (HDFS): initially it was the Google File System. This model is a DFS employed as distributed storage for the information; further, it provides access to the information using higher throughputs.
3) Hadoop YARN (MRv2): it is accountable for managing cluster resources as well as scheduling tasks.
4) Hadoop MapReduce: initially Google MapReduce, depends on YARN, for processing data in parallel.
There are several projects associated with Hadoop, like Hive, Mahout, Spark, and Hbase. The basic aspect which characterizes Hadoop is that the HDFS contain a higher fault tolerance to the failure of hardware. In fact, it is capable of manually resolving and handling this event. Further, HDFS is capable, with the interactions amongst the node belongs to the cluster, handle the data, E.g., rebalancing them. The processing of data kept on the HDFS is implemented with the MapReduce architecture. Even though Hadoop is principally written in C and Java languages, it is available to any programming language. The MapReduce architecture permits partitioning on the node that belongs to the cluster the task which must be finished. The primary disadvantage of Hadoop is the absence of implementing effectively realtime tasks. But, this isn’t a key constraint due to this certain aspect another technique can be used.
MapReduce Programming Model.
MapReduce manually executes and parallelizes a program on a huge cluster of commodity machines. It operated by splitting processing into 2 phases, the map and reduce phases. All the stages have key value pairs as output and input, the type of which might be selected by the programmer. The map and reduce function of MapReduce are determined based on the data structured in (key, value) pair. The computational take a group of input key values pair also produce a group of output key values pair. The map and reduce function in Hadoop MapReduce have the subsequent common form:
Once a MapReduce works started, the map invocation is shared over multiple machines via the automated splitting of input data to a collection of partitions [20]. The map task takes input split as input and produces a series of key value pairs named intermediate data. A splitting function (with default, hash (key) mod R) is later employed for dividing the intermediate data into many splits and share them through reduce task. This transfer method is known as a shuffle. In the reduce stage, all reduce tasks process the input intermediate data through the reduce function and generate output data.
3.2 Design of Hybrid DBSCAN Technique
Consider the datasets to be treated be represented as D, the clustering algorithm radius, Eps, and the minimal numbers of objects in the neighborhoods, MinPts. Later, fundamental concepts of the algorithms are given in the following:
1. Eps neighbouring region: whereas p represents the center of sphere in the datasets D. For data within the radius Eps of the objects area, a set of points in the sphere is
2. Density: at the location of data points p in the datasets D, the numbers of point, Num, included in the neighborhoods Eps is their density
3. Core point: at the location of data points p in the datasets D, when the density (Num) in the neighbourhood Eps fulfills Num ≥ MinPts, it is known as a core point.
4. Border point: at the location of data points p in the datasets D, when the density in the neighbourhood Eps fulfills Num ≤ MinPts however it can be inside the sphere, it is known as a border point.
5. Noise point: every object except the core point and border point in D.
6. Direct density reachable: provided object, q ∈ D, when there is a core point and it is inside the Eps neighbourhood of q, it has been stated that from p to q is direct density reachable, viz., q ∈ NEps(p), |NEps(p)| ≥ MinPts.
7. Density reachable: provided object p1, p2, p3, p4, …, pn ∈ D, whereas p1 = q, pn = q, when pi+1 is direct density reachable from pj, then p is density reachable from q.
8. Density-connected: provided object, q ∈ D, when there is a point o ∈ D i.e., density reachable from p & q, then p & q are density connected.
According to above-mentioned definition, the concept of DBSCAN algorithms is given in the following. The search could begin from the neighbouring Eps areas of other interesting data points. Provided a sufficient data point in the neighbourhood (MinPts) the cluster would extend. Or else, data points are temporarily marked as noise [21]. Later, this point could be determined in another Eps neighbourhoods and mark as parts of a cluster. When a data objects from the cluster is mark as a core, their Eps neighborhoods are parts of the cluster. Therefore, each point determined in the neighborhoods, and the core neighborhoods, are included in the cluster. This procedure is continued till density connected cluster is fully determined. Lastly, novel and unprocessed points are processed and retrieved to discover deep noise/clusters. Finally, the object in datasets D is checked, then end the process.
According to the earlier descriptions of the fundamental ideas and concepts of DBSCAN method, its flow of process could be summarized as follows. Now, suppose the spatial datasets D, provided clustering radius Eps, the minimal numbers of neighboring object MinPts, and the present set of objects as N1.
1. Each data object in datasets D is marked as unchecked. Based on some unchecked data points p, marked as checked, later check Eps neighborhoods and estimate the numbers of objects in the neighborhoods m. When m fulfills m ≥ MinPts, generate a novel clusters C1, and include p to C1, in the meantime included each point in the neighborhoods to the set of objects N1.
2. For the set of objects, N1, when objects q there hasn’t been checked, later q marked as ‘checked’, next check Eps neighborhoods and estimate the numbers of object in the neighborhoods n. when n fulfills n ≥ MinPts, this object is included in the object sets. If q doesn’t belong to some clusters, next include q to C1.
3. Repeat step (2), also continues to check object sets N1 till it is empty
4. Repeat steps (1)–(3). While each data object is marked as ‘checked’ then end the process.
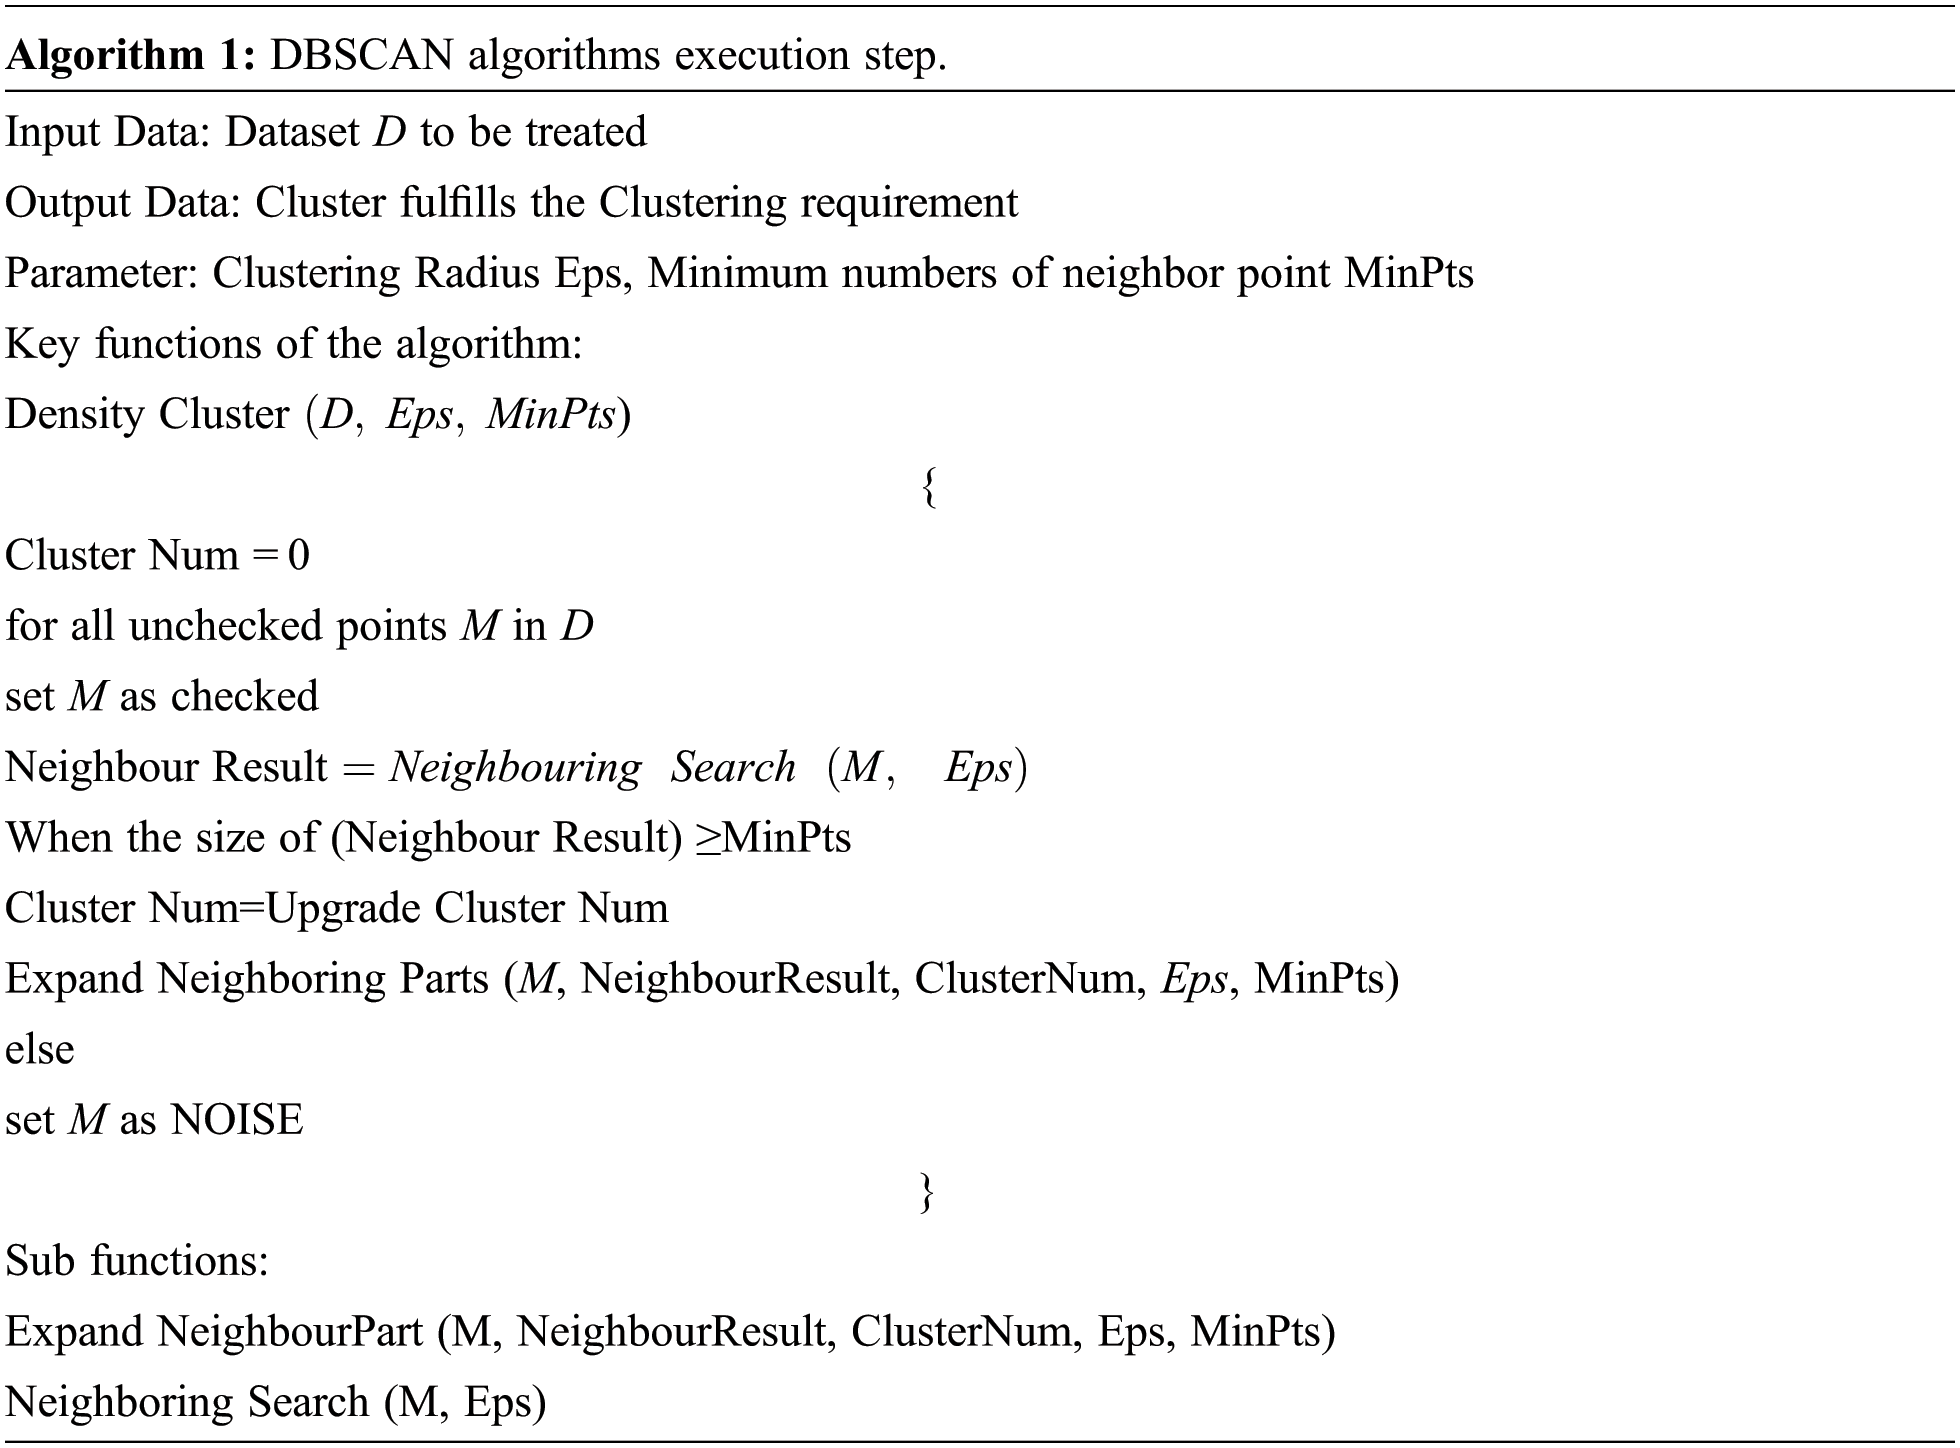
The complete execution steps could be summarized in Algorithm 1.
For improving the performance of the DBSCAN technique, a hybrid model using CSO algorithm is designed for the exploration of the search space and to determine the optimal parameters for density based clustering. CSO method is a population based global optimization method with the summary of inertial weight. CSO was employed to the problem. CSO model simulates cockroach behaviors that are dispersing, ruthless behaviors, and chase swarming. CSO model is shown below.
(1) Chase swarming behavior:
In which xi represents the cockroach location, step is a fixed value, rand denotes an arbitrary value in the range of zero and one, pi signifies the personal optimal location, and pg denotes the global optimal location [22].
Assume
Whereas visual perception distance is a constant. j = 1, 2, …, N & i = 1, 2, …, N
(2) Dispersion behavior
Let rand
(3) Ruthless behavior
Whereas k represents an arbitrary integer in the range of 1 and N as well pg represents the global optimum location.
3.3 Design of BiGRNN Based Big Data Classification
Once the clustering process is completed, the next stage is to classify the big data. LSTM constitutes a certain case of RNN which was initially developed to both long and short term dependency models. The main units in an LSTM network are the memory blocks in the recurrent hidden layer that has memory cells with self-connection memorize the adaptive gate and temporal state unit to control the data flow in the blocks. The memory cell ct the structure is made up of output, input, and forgets gates. In each time step t, the input gate it defines that data are included in the cell states St (memory), the forget gates ft defines that data is discarded from the cell state by the transforming function in forget gate; whereas the output gates ot defines that data in the cell state would be employed as output. By using gates in every cell, information could be added, filtered/discarded. In this method, the LSTM network is able to identify short as well as long term correlations feature within time series. Furthermore, it is noteworthy that a considerable benefit of the use of memory cell and adoptive gate that controls data flow is the gradient vanishing problems could be significantly tackled, i.e., essential for the generalization performances of the network.
A simple method for increasing the capacity and depth of LSTM network is to stacked LSTM layer together, where the output of (L − 1) th LSTM layers at time t is processed as input of Lth layer. Note that this input and output connection is the only link among the LSTM layer of the networks. According to the aforementioned equation, the framework of stack LSTM could be described in the following: where
Whereas σ represents a sigmoid function,
In which
Let
While
As the LSTM network, an effective and extensively used RNN framework is BRNN model. Unlike the LSTM model, this network is made up of 2 hidden layers, related to input and output. The main concept of BRNN is that all the training sequences are present backward and forward to 2 distinct recurrent networks [23]. Particularly, the initial hidden layer possesses recurrent connection from the previous time step, next, the recurrent connection is reversed, transfer activation backward with the sequence. Indeed, LSTM and BRNN depend on compatible technique where the previous one proposed the connecting of 2 hidden layers, that composes the network, whereas the last one proposes a basic component to compose the hidden layer. Fig. 2 depicts the architecture of GRU model.

Figure 2: GRU structure
With this line, BiLSTM network is presented in this study that integrates 2 LSTM networks from the BRNN model. Particularly, BiLSTM incorporates forward and backward LSTM layers for learning the data from following and preceding tokens. In this method, future and past contexts for a provided time t are accessed, therefore optimum predictions could be attained with further sentence level data.
In a BiLSTM network, the output of all feedforward LSTM layers are similar to the traditional stacked LSTM layers and this layer is iterated from t = 1 to T. On the other hand, the output of all backward LSTM layers is reversely iterated, viz., from t = T to 1. Therefore, at time t, the output of values
Lastly, the output of this BiLSTM framework is shown below
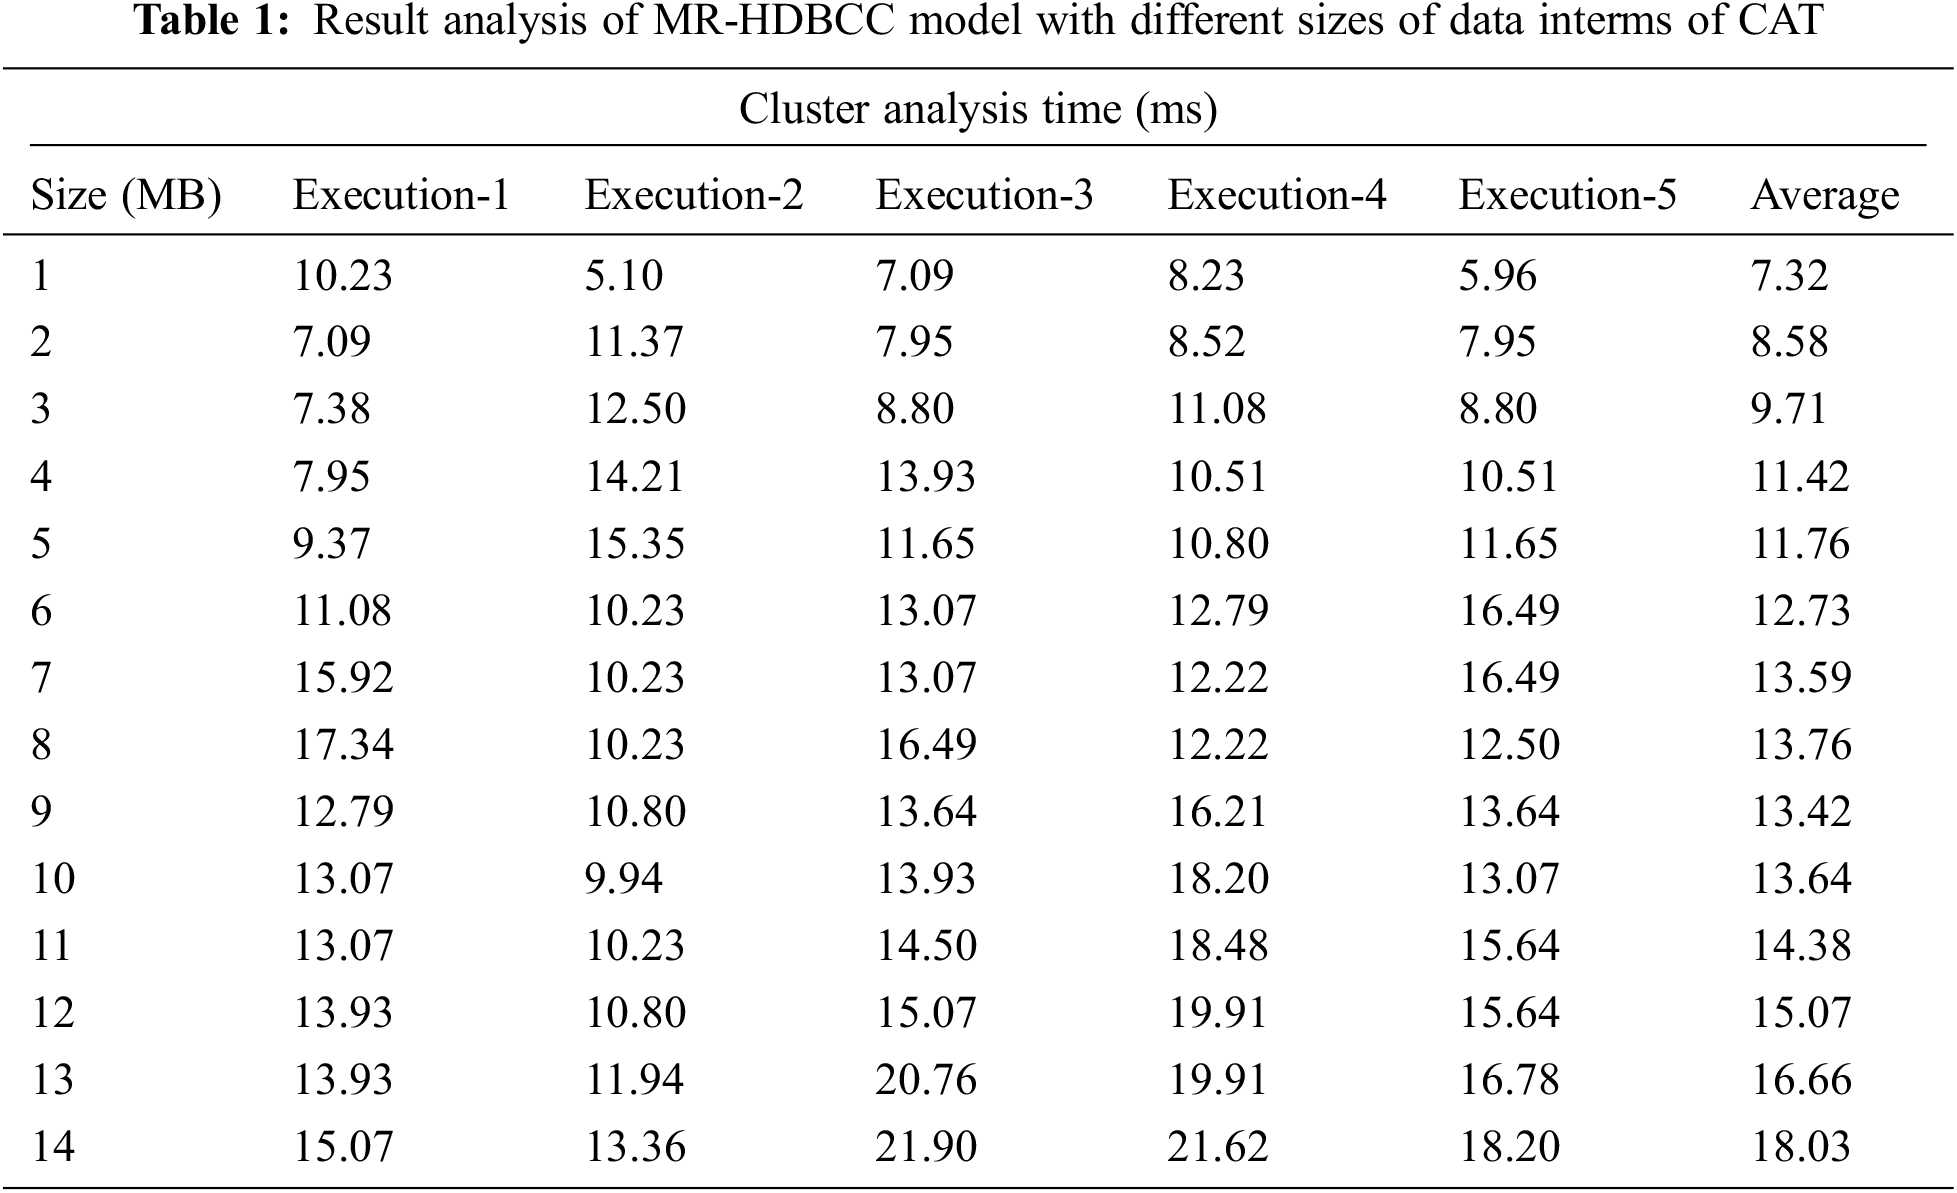
This section investigates the performance of the MR-HDBCC technique on the applied five datasets from UCI repository. The results are investigated under varying sizes of data and different executions. Tab. 1 and Fig. 3 demonstrates the cluster analysis time (CAT) analysis of the MR-HDBCC technique under varying size of data. The results indicated that the MR-HDBCC technique has accomplished minimal CAR under all sizes of data. For instance, with 1 MB data, the MR-HDBCC technique has attained a lower CAT of 10.23, 5.10, 7.09, 8.23, and 5.96 ms respectively. In addition, with 3 MB data, the MR-HDBCC approach has reached a minimal CAT of 7.38, 12.50, 8.80, 11.08, and 8.80 ms correspondingly. Also, with 7 MB data, the MR-HDBCC method has reached a lesser CAT of 15.92, 10.23, 13.07, 12.22, and 19.49 ms correspondingly. Along with that, with 10 MB data, the MR-HDBCC manner has obtained a decreased CAT of 13.07, 9.94, 13.93, 18.20, and 13.07 ms correspondingly. Simultaneously, with 14 MB data, the MR-HDBCC method has gained a reduced CAT of 15.07, 13.36, 21.90, 21.62, and 18.20 ms correspondingly.

Figure 3: CAT analysis of MR-HDBCC model with distinct data size
A detailed CAT analysis of the MR-HDBCC with existing techniques takes place in Tab. 2 and Fig. 4. The results depicted that the MR-HDBCC technique has resulted in a minimal CAT. For instance, with 1 MB of dataset, the MR-HDBCC technique has attained a lower CAT of 7.32 ms whereas the K-means and hybrid clustering techniques have obtained a higher CAT of 27.88 and 8.52 ms respectively.

Figure 4: CAT analysis of MR-HDBCC model with existing approaches
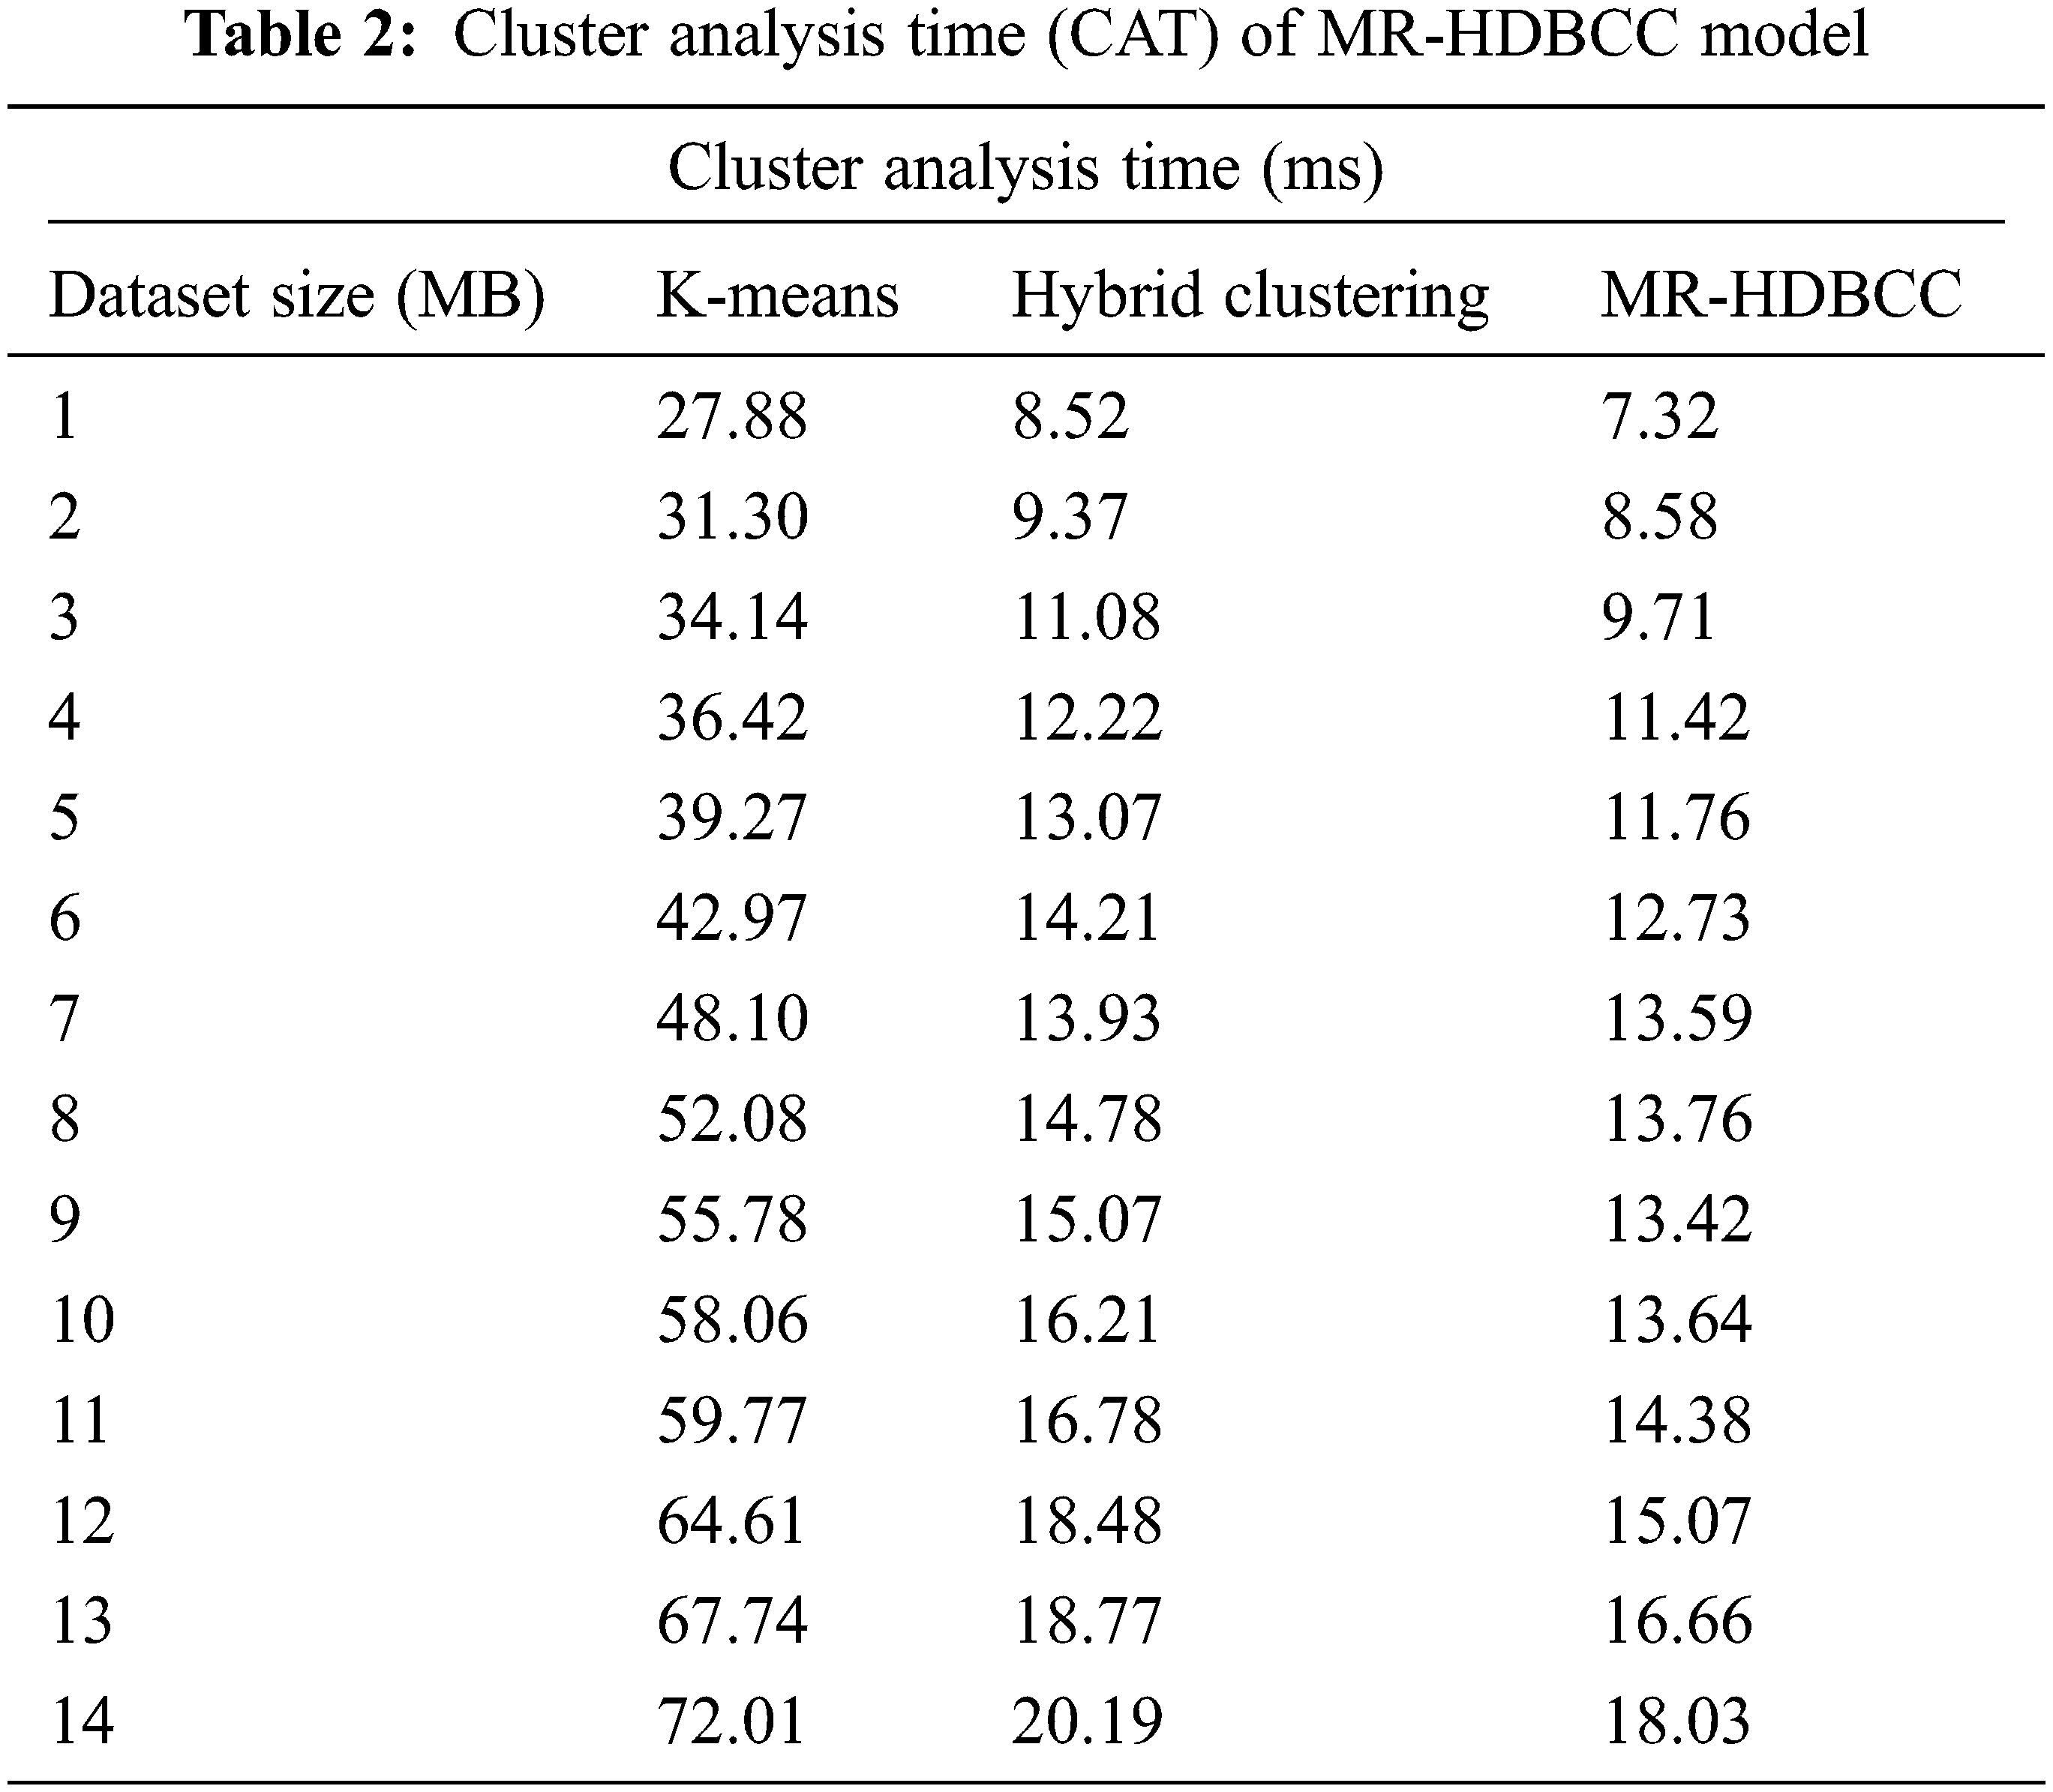
Additionally, with 3 MB of dataset, the MR-HDBCC algorithm has obtained a minimum CAT of 9.71 ms whereas the K-means and hybrid clustering approaches have obtained a maximum CAT of 34.14 and 11.08 ms correspondingly. Besides, with 7 MB of dataset, the MR-HDBCC technique has achieved a lower CAT of 13.59 ms whereas the K-means and hybrid clustering methodologies have gained an increased CAT of 48.10 and 13.93 ms correspondingly. Meanwhile, with 10 MB of dataset, the MR-HDBCC approach has attained a lower CAT of 13.64 ms whereas the K-means and hybrid clustering techniques have obtained an enhanced CAT of 58.06 and 16.21 ms correspondingly. Finally, with 14 MB of dataset, the MR-HDBCC manner has attained a lower CAT of 18.03 ms whereas the K-means and hybrid clustering methodologies have achieved an improved CAT of 72.01 and 20.19 ms correspondingly.
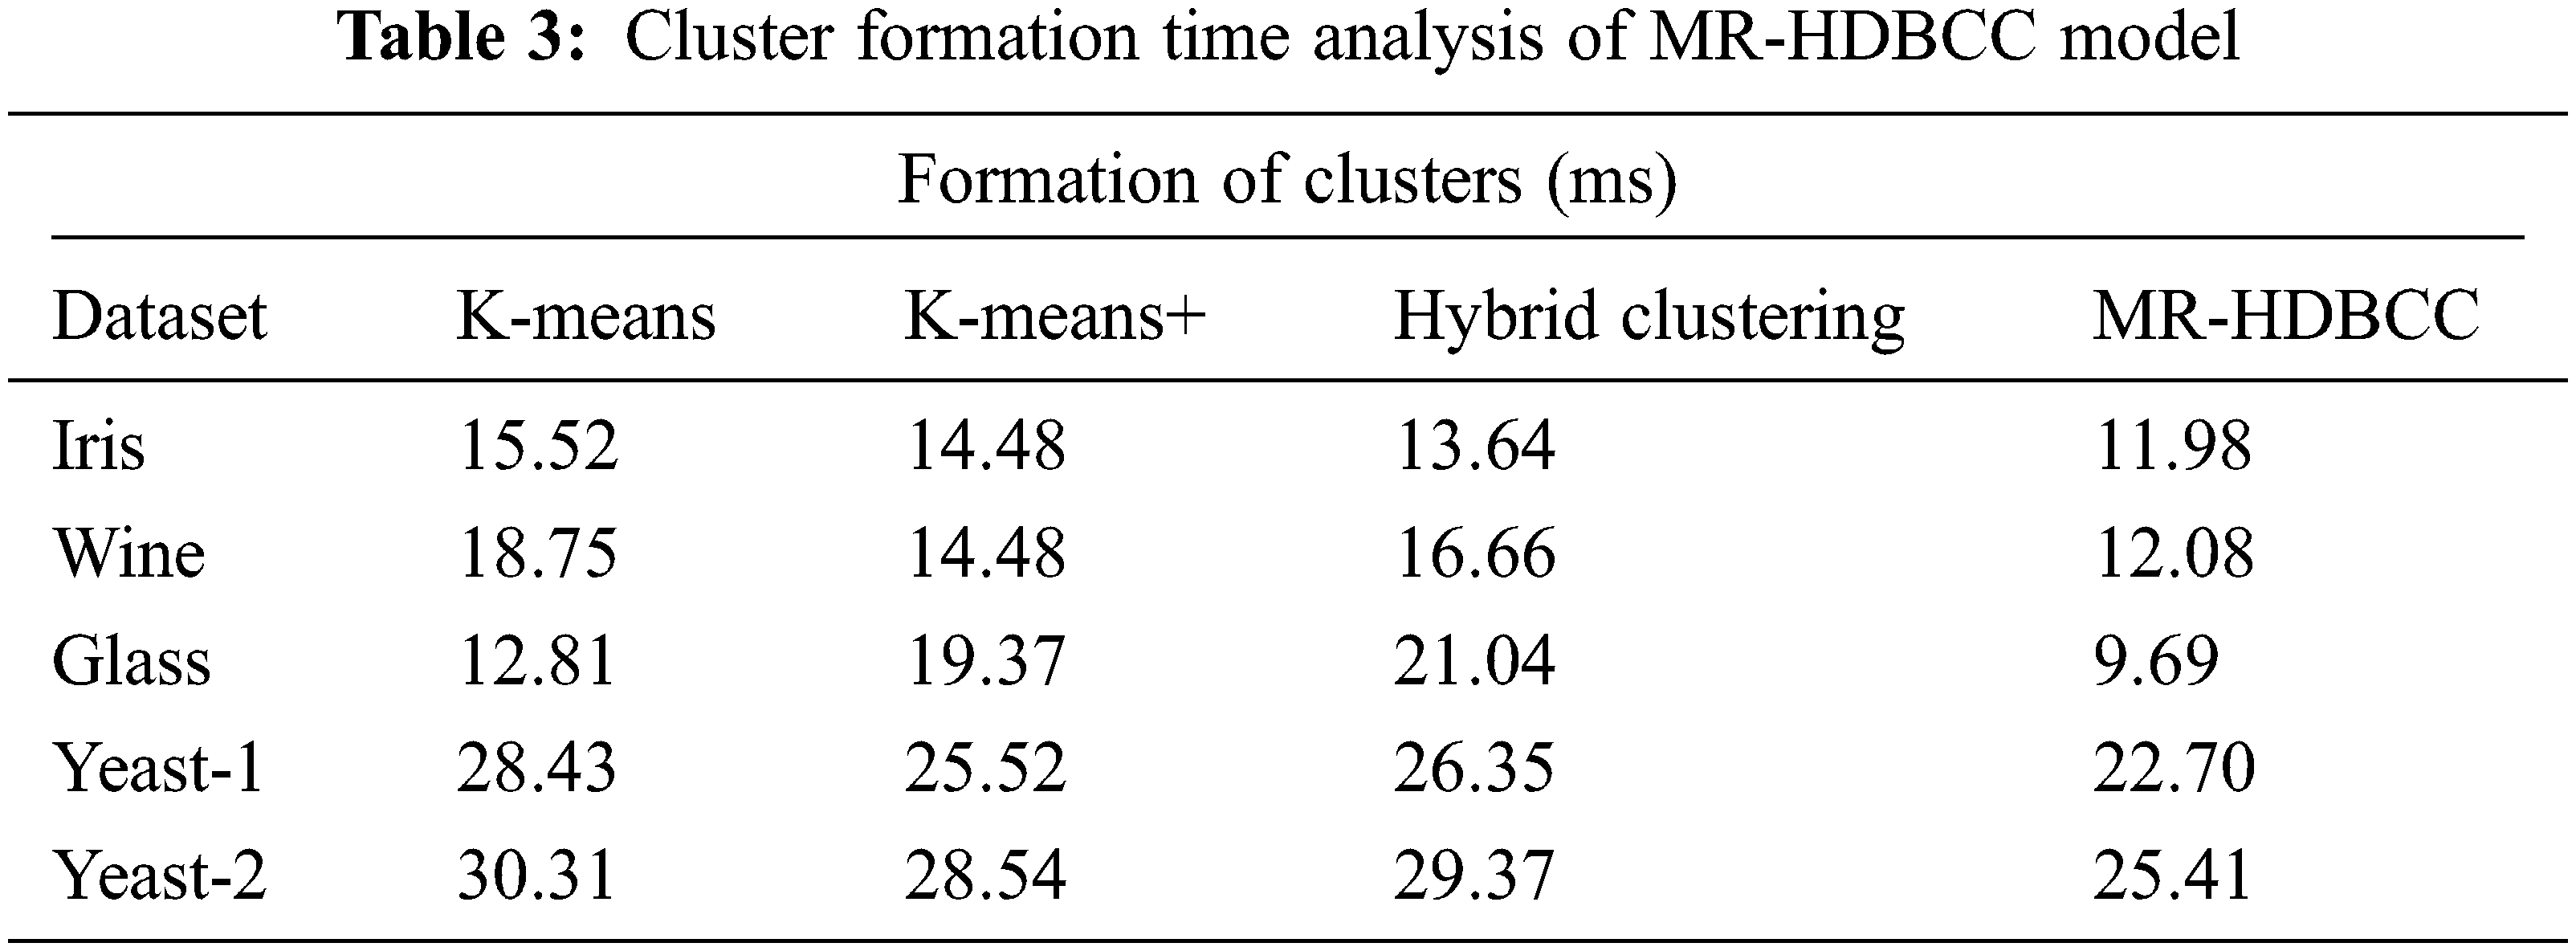
Tab. 3 and Fig. 5 define the cluster formation time of the MR-HDBCC technique with existing techniques. The MR-HDBCC technique has gained effectual outcomes with minimal cluster formation time under all datasets. For instance, with Iris dataset, the MR-HDBCC technique has obtained a reduced cluster formation time of 11.98 ms whereas the K-means, K-means+, and hybrid clustering techniques have obtained a higher cluster formation time of 15.52, 14.48, and 13.64 ms respectively. Moreover, with Wine dataset, the MR-HDBCC manner has gained a lower cluster formation time of 12.08 ms whereas the K-means, K-means+, and hybrid clustering systems have reached an increased cluster formation time of 18.75, 14.48, and 16.66 ms correspondingly. Furthermore, with Glass dataset, the MR-HDBCC algorithm has achieved a minimal cluster formation time of 9.69 ms whereas the K-means, K-means+, and hybrid clustering methods have reached a superior cluster formation time of 12.81, 19.37, and 21.04 ms correspondingly. In the meantime, with Yeast-1 dataset, the MR-HDBCC technique has obtained a reduced cluster formation time of 22.70 ms whereas the K-means, K-means+, and hybrid clustering manners have obtained a higher cluster formation time of 28.43, 25.52, and 26.35 ms correspondingly. At the same time, with Yeast-2 dataset, the MR-HDBCC technique has obtained a reduced cluster formation time of 25.41 ms whereas the K-means, K-means+, and hybrid clustering approaches have reached a maximum cluster formation time of 30.31, 28.54, and 29.37 ms correspondingly.

Figure 5: Cluster formation time analysis of MR-HDBCC model
Comparative accuracy analysis of the MR-HDBCC with existing techniques takes place in Tab. 4 and Fig. 6. The results demonstrated the betterment of the MR-HDBCC technique with the higher accuracy. For instance, with Iris dataset, increased accuracy of 92.49% whereas the K-means, K-means+, and hybrid clustering techniques have exhibited a decreased accuracy of 84.11%, 87.48%, and 91.11% respectively. Concurrently, with Glass dataset, enhanced accuracy of 94.74% whereas the K-means, K-means+, and hybrid clustering algorithms have demonstrated a lower accuracy of 89.56%, 91.28%, and 92.58% correspondingly. Eventually, with Yeast-2 dataset, a maximum accuracy of 95.43% whereas the K-means, K-means+, and hybrid clustering techniques have outperformed a minimum accuracy of 82.38%, 87.31%, and 94.14% correspondingly.
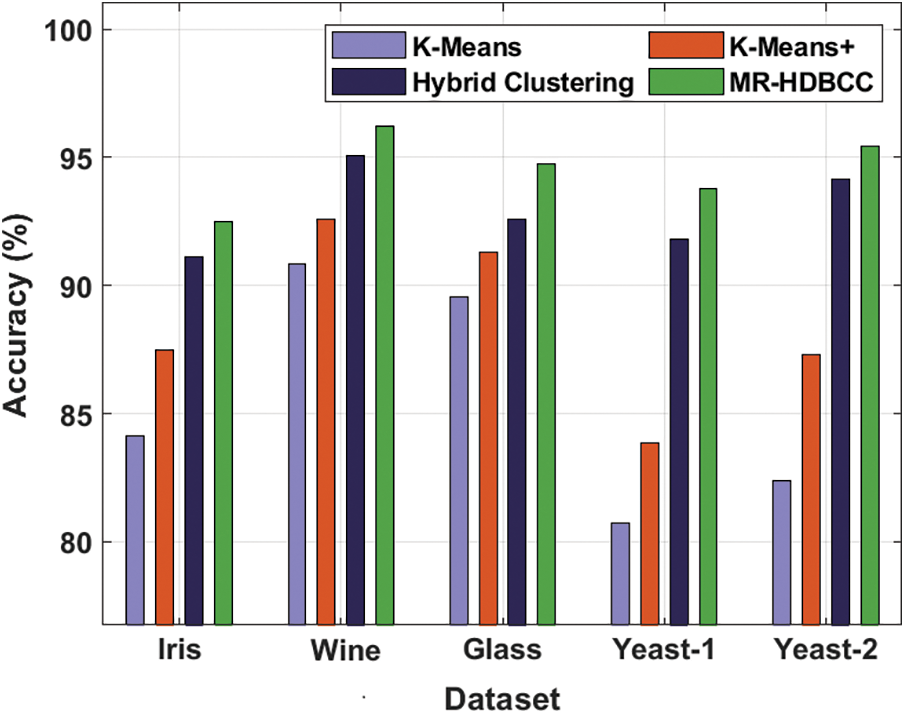
Figure 6: Accuracy analysis of MR-HDBCC model with different dataset

Tab. 5 and Fig. 7 explain the computation time for each centroid of the MR-HDBCC approach with recent manners [24]. The MR-HDBCC approach has attained effective results with minimal computation time under all datasets. For instance, with Iris dataset, the MR-HDBCC technique has obtained a lower computation time of 6.41 whereas the K-means, K-means+, and hybrid clustering manners have attained a superior computation time of 9.84, 7.77, and 8.73 correspondingly. Likewise, with Wine dataset, the MR-HDBCC approach has obtained a reduced computation time of 7.72 whereas the K-means, K-means+, and hybrid clustering techniques have gained a higher computation time of 10.34, 9.18, and 9.84 correspondingly.
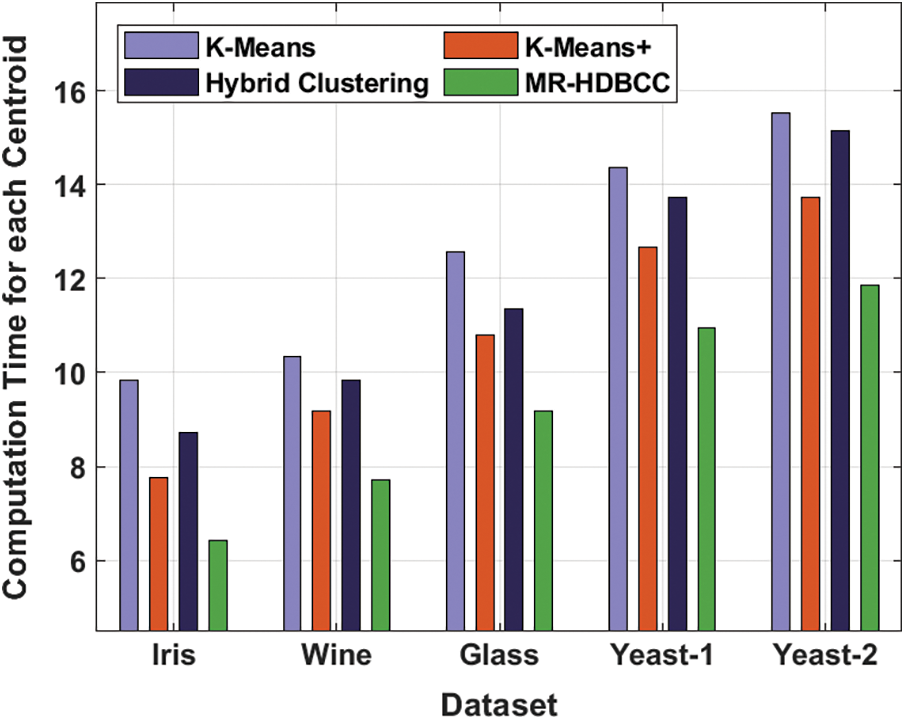
Figure 7: Computation time analysis of MR-HDBCC model

Similarly, with Glass dataset, the MR-HDBCC method has achieved a minimal computation time of 9.18 whereas the K-means, K-means+, and hybrid clustering techniques have obtained a higher computation time of 12.56, 10.79, and 11.35 respectively. Meanwhile, with Yeast-1 dataset, the MR-HDBCC algorithm has achieved a decreased computation time of 10.94 whereas the K-means, K-means+, and hybrid clustering methodologies have achieved a maximum computation time of 14.37, 12.66, and 13.72 correspondingly. At last, with Yeast-2 dataset, the MR-HDBCC technique has obtained a reduced computation time of 11.85 whereas the K-means, K-means+, and hybrid clustering approaches have gained a superior computation time of 15.53, 13.72, and 15.13 respectively. From the above mentioned results analysis, it is apparent that the MR-HDBCC technique can be employed for effective big data classification.
In this paper, an effective MR-HDBCC technique has been developed for big data classification in MapReduce environments. The proposed MR-HDBCC technique is executed on Map Reduce tool for handling the big data. In addition, the MR-HDBCC technique involves three distinct processes namely pre-processing, hybrid DBSCAN based clustering, and BiGRNN based classification. Moreover, a hybrid DBSCAN model is derived using CSO algorithm to explore the search space and determine the optimal parameters for density based clustering. The performance of the proposed MR-HDBCC technique is examined against the benchmark dataset and the results are inspected under several aspects. The simulation outcomes demonstrated the significant performance of the MR-HDBCC technique interms of different measures. As a part of future extension, the MR-HDBCC technique can be extended to the healthcare sector to classify medical big data.
Funding Statement: This research was supported by a grant of the Korea Health Technology R&D Project through the Korea Health Industry Development Institute (KHIDI), funded by the Ministry of Health & Welfare, Republic of Korea (Grant Number: HI21C1831) and the Soonchunhyang University Research Fund.
Conflicts of Interest: The authors declare that they have no conflicts of interest to report regarding the present study.
1. S. Heidari, M. Alborzi, R. Radfar, M. A. Afsharkazemi and A. R. Ghatari, “Big data clustering with varied density based on MapReduce,” Journal of Big Data, vol. 6, no. 1, pp. 77, 2019. [Google Scholar]
2. C. L. P. Chen and C. Y. Zhang, “Data-intensive applications, challenges, techniques and technologies: A survey on big data,” Information Sciences, vol. 275, pp. 314–347, 2014. [Google Scholar]
3. M. Chen, S. Mao and Y. Liu, “Big data: A survey,” Mobile Networks and Applications, vol. 19, no. 2, pp. 171–209, 2014. [Google Scholar]
4. P. S. Yaminee and M. B. Vaidya, “A technical survey on cluster analysis in data mining,” International Journal of Emerging Technology and Advanced Engineering, vol. 2, pp. 503–513, 2012. [Google Scholar]
5. M. M. Saeed, Z. Al Aghbari and M. Alsharidah, “Big data clustering techniques based on spark: A literature review,” PeerJ Computer Science, vol. 6, pp. e321, 2020. [Google Scholar]
6. M. Dave and H. Gianey, “Different clustering algorithms for big data analytics: A review,” in 2016 Int. Conf. System Modeling & Advancement in Research Trends (SMART), Moradabad, India, pp. 328–333, 2016. [Google Scholar]
7. F. Liu and L. Xiong, “Survey on text clustering algorithm-research present situation of text clustering algorithm,” in 2011 IEEE 2nd Int. Conf. on Software Engineering and Service Science, Beijing, China, pp. 196–199, 2011. [Google Scholar]
8. V. W. Ajin and L. D. Kumar, “Big data and clustering algorithms,” in 2016 Int. Conf. on Research Advances in Integrated Navigation Systems (RAINS), Bangalore, India, pp. 1–5, 2016. [Google Scholar]
9. S. M. Othman, F. M. B. Alwi, N. T. Alsohybe and A. Y. A. Hashida, “Intrusion detection model using machine learning algorithm on big data environment,” Journal of Big Data, vol. 5, no. 1, pp. 34, 2018. [Google Scholar]
10. Q. Wang, X. Ouyang and J. Zhan, “A classification algorithm based on data clustering and data reduction for intrusion detection system over big data,” KSII Transactions on Internet and Information Systems (TIIS), vol. 13, no. 7, pp. 3714–3732, 2019. [Google Scholar]
11. K. Peng, V. C. M. Leung and Q. Huang, “Clustering approach based on mini batch kmeans for intrusion detection system over big data,” IEEE Access, vol. 6, pp. 11897–11906, 2018. [Google Scholar]
12. S. Bollaa, “An efficient probabilistic multi labeled big data clustering model for privacy preservation using linked weight optimization model,” Turkish Journal of Computer and Mathematics Education (TURCOMAT), vol. 12, no. 11, pp. 5510–5517, 2021. [Google Scholar]
13. H. Li, H. Li and K. Wei, “Automatic fast double KNN classification algorithm based on ACC and hierarchical clustering for big data,” International Journal of Communication Systems, vol. 31, no. 16, pp. e3488, 2018. [Google Scholar]
14. S. K. Lakshmanaprabu, K. Shankar, M. Ilayaraja, A. W. Nasir, V. Vijayakumar et al., “Random forest for big data classification in the internet of things using optimal features,” International Journal of Machine Learning and Cybernetics, vol. 10, no. 10, pp. 2609–2618, 2019. [Google Scholar]
15. D. Li, S. Wang, N. Gao, Q. He and Y. Yang, “Cutting the unnecessary long tail: Cost-effective big data clustering in the cloud,” in IEEE Transactions on Cloud Computing, pp. 1–1, 2019. https://doi.org/10.1109/TCC.2019.2947678. [Google Scholar]
16. W. Lu, “Improved K-means clustering algorithm for big data mining under hadoop parallel framework,” Journal of Grid Computing, vol. 18, no. 2, pp. 239–250, 2020. [Google Scholar]
17. R. Venkatesh, C. Balasubramanian and M. Kaliappan, “Development of big data predictive analytics model for disease prediction using machine learning technique,” Journal of Medical Systems, vol. 43, no. 8, pp. 272, 2019. [Google Scholar]
18. M. Elkano, M. Galar, J. Sanz and H. Bustince, “CHI-BD: A fuzzy rule-based classification system for big data classification problems,” Fuzzy Sets and Systems, vol. 348, pp. 75–101, 2018. [Google Scholar]
19. G. Hernández, E. Zamora, H. Sossa, G. Téllez and F. Furlán, “Hybrid neural networks for big data classification,” Neurocomputing, vol. 390, pp. 327–340, 2020. [Google Scholar]
20. C. Uzunkaya, T. Ensari and Y. Kavurucu, “Hadoop ecosystem and its analysis on tweets,” Procedia-Social and Behavioral Sciences, vol. 195, pp. 1890–1897, 2015. [Google Scholar]
21. F. Huang, Q. Zhu, J. Zhou, J. Tao, X. Zhou et al., “Research on the parallelization of the dbscan clustering algorithm for spatial data mining based on the spark platform,” Remote Sensing, vol. 9, no. 12, pp. 1301, 2017. [Google Scholar]
22. I. C. Obagbuwa, A. O. Adewumi and A. A. Adebiyi, “Stochastic constriction cockroach swarm optimization for multidimensional space function problems,” Mathematical Problems in Engineering, vol. 2014, pp. 1–12, 2014. [Google Scholar]
23. I. E. Livieris, E. Pintelas, S. Stavroyiannis and P. Pintelas, “Ensemble deep learning models for forecasting cryptocurrency time-series,” Algorithms, vol. 13, no. 5, pp. 121, 2020. [Google Scholar]
24. G. HimaBindu, C. Raghu Kumar, C. Hemanand and N. Rama Krishna, “Hybrid clustering algorithm to process big data using firefly optimization mechanism,” in Materials Today: Proc., 2020. https://doi.org/10.1016/j.matpr.2020.10.273. [Google Scholar]
 | This work is licensed under a Creative Commons Attribution 4.0 International License, which permits unrestricted use, distribution, and reproduction in any medium, provided the original work is properly cited. |