DOI:10.32604/csse.2023.024994
| Computer Systems Science & Engineering DOI:10.32604/csse.2023.024994 | |
| Article |
Adaptive Window Based 3-D Feature Selection for Multispectral Image Classification Using Firefly Algorithm
1Full Time Research Scholar, Department of Electronics and Communication Engineering, University College of Engineering, Panruti, 607106, India
2Department of Electronics and Communication Engineering, University College of Engineering, Panruti, 607106, India
3Department of Computer Science and Engineering, University College of Engineering, Panruti, 607106, India
*Corresponding Author: M. Rajakani. Email: rajakanijes@gmail.com
Received: 07 November 2021; Accepted: 24 December 2021
Abstract: Feature extraction is the most critical step in classification of multispectral image. The classification accuracy is mainly influenced by the feature sets that are selected to classify the image. In the past, handcrafted feature sets are used which are not adaptive for different image domains. To overcome this, an evolutionary learning method is developed to automatically learn the spatial-spectral features for classification. A modified Firefly Algorithm (FA) which achieves maximum classification accuracy with reduced size of feature set is proposed to gain the interest of feature selection for this purpose. For extracting the most efficient features from the data set, we have used 3-D discrete wavelet transform which decompose the multispectral image in all three dimensions. For selecting spatial and spectral features we have studied three different approaches namely overlapping window (OW-3DFS), non-overlapping window (NW-3DFS) adaptive window cube (AW-3DFS) and Pixel based technique. Fivefold Multiclass Support Vector Machine (MSVM) is used for classification purpose. Experiments conducted on Madurai LISS IV multispectral image exploited that the adaptive window approach is used to increase the classification accuracy.
Keywords: Multispectral image; modified firefly algorithm; 3-D feature extraction; feature selection; multiclass support vector machine; classification
1 Introduction and Related Work
A multispectral image can be classified by considering only spectral information. This may lead to some misclassification because objects with different texture may reflect the same spectrum. Spatial information alone is not sufficient for good classification. Consequently, spatial feature extraction methods like pixel shape index, Markov random field and extended morphological profiles used only the spatial information for classification without considering the spectral information. Multi spectral image classification is one of the paramount tasks in remote sensing image analysis and the availability of satellite imagery with high spectral and spatial resolution, faces new challenges in the field of land-cover classification. Multispectral image analysis methods largely depend on the spatial properties in the few wavelength bands and it is difficult with such data to discriminate between the various classes [1].
To classify the different objects in the images texture features are more useful as it is expressed in terms of smoothness, coarseness, fitness, linearization, granularity and randomness. [2] Two dimensional discrete wavelet transform is used for classification, which are not efficient for spectral-spatial representation of the multispectral remotely sensed imagery [3]. In 3-D filters like 3-D Discrete Wavelet Transform, wavelet transform is performed in the spectral domain as well as in the spatial domain. The multispectral image is decomposed into spectral-spatial sub bands by applying low pass and high pass filters along rows, columns and slices. 3-D coefficients are obtained, which represents the amount of spectral and spatial variation. This result is helpful for effective feature extraction that will increase the classification accuracy. Some optimization methods are fixedly followed for feature extractions that are not domain adaptive, all are handcrafted features. To make it domain adaptive, an evolutionary learning technique that automatically learn to extract features such as genetic programming, firefly algorithm and BAT algorithm can be used [4].
In this context a 3-D feature extraction and classification framework is proposed for multispectral imagery. Three-dimensional feature extraction is capable of simultaneously extracting image information from the spectral and spatial directions, which provide more effective features for interpretation of multispectral imagery. Three feature extraction algorithms are proposed to extract the spectral and spatial information simultaneously via overlapping, non-overlapping and adaptive window selection. For this purpose, a highly detailed spectral characterization multi spectral remote sensing has evolved to address this need. In hyper/multi spectral image the dimensionality reduction is one of the preprocess step. The goal of dimensionality reduction is to reduce the curse of dimensionality to preserve the main features of the original data.
2-D wavelet transforms decompose the remote sensed images in spectral direction only, but the spatial bands have enormous amount of useful information about the characteristics of different classes. So omitting this band information will lead to loss of some effective features which create a great impact on the classification process. For this reason, 3-D wavelet transforms which decompose the remote sensed images in both spectral and spatial direction can be utilized to extract more efficient features for the better interpretation of multi/hyper spectral images [5].
All the existing work used non-overlapping window for feature extraction. These approaches will lose some spatial and spectral information which are very efficient. Overlapping window approach will cover redundant data which reduces the overall classification accuracy. To overcome this issue we proposed Adaptive Windowing technique which changes the window size based on the spectral and spatial information in the window. If the local variance of the window is low small window size is used, if the local variance is high larger window size is used to extract features. So it covers all useful data in the image and avoids redundant data to improve overall accuracy.
Recently, evolutionary methods, with global searching ability, provide alternative searching approaches for feature selection. Particle swarm optimization (PSO) and its variants have been successfully used for feature selection. The firefly algorithm (FA) is a new type of swarm intelligence optimization algorithm. It can adaptively adjust the radius of the induction and parallelly search multiple peaks, which has natural advantages in solving multimode optimization problem [6]. Gray level occurrence can be used for the feature extraction of multispectral image cubes. Features that are most helpful in separating different targets are effectively extracted from the multispectral image cubes using a newly developed high-order texture analysis method [7].
The computational cost of classification increases with the number of features used, therefore feature extraction technique such as meta-heuristic firefly algorithm has been proposed based upon the flashing characteristic of fireflies [8]. A firefly is a population-based algorithm inspired by the social behavior of fireflies. Fireflies communicate by flashing their light based on the light intensity. Thus, this intensity of light is the main factor thus the minimum brighter fireflies are attracted towards the maximum brighter firefly. FA is widely used to solve reliability and redundancy problems. This will iterate continue until a needed solution is obtained [9,10].
There are idealized rules incorporated in the Firefly algorithm. i) The intensity or brightness value of a firefly is determined by the objective function. ii) Attractiveness is propositional to the brightness, and they both decreases as their distance decreases. The main objective of this paper is to get optimal solution selected by means of firefly algorithm as a feature extraction technique. SVM classifier is used as fitness function to get a optimal features in feature extraction, Supervised classification method is performed to estimate the classification error rate of each individual [11]. The experimental results of the classification methods are evaluated and a conclusion is made lastly. In this paper, our contribution to this work includes,
1. Apply 3-D wavelet transform to decompose the multispectral image in spectral and spatial domain to retain all useful relevant information and extract features using 3-D filters for select features in both spectral and spatial direction
2. Apply modified firefly algorithm to pick an optimal feature extraction method or filter feature from the combination of filter feature sets for better classification purpose.
3. Evaluating the performance of windowing approaches namely non-Overlapping, Overlapping and Adaptive.
The multi temporal satellite sensor images used in this study is of Madurai city in Tamil Nadu, state of India and is shown in Fig. 1. Madurai is the second largest city in the state of Tamil Nadu. It is identified as one of the 12 heritage cities of India and is situated between longitude 78 04′47′′E to 78 11′23′′E and latitude 9 50′59′′N to 9 57′36′′N. The topography of Madurai is approximately 101 m above mean sea level. The land cover features of this study area include urban, vegetation, water body, waste land, soil and hilly region. This Multispectral image refers to an urban landscape with 400 × 400 pixels of 3 spectral bands. The scene details of the area are,

Figure 1: Madurai city multispectral image
Satellite/Sensor: LISS-IV
Number of classes: 5
Number of bands: 3
Satellite/Sensor: IRS P6/LISS IV
Resolution: 5.8 m
Band 2 (green): 0.52∼0.59 μm
Band 3 (red): 0.62∼0.68 μm
Band 4 (near-Infrared): 0.77∼0.86 μm
Spatial Coverage: 90 N, 90 S, 180 W, 180 E
We used this image for our experiment to prove that our proposed system for feature extraction and classification of multispectral image by adaptive window and 3-D wavelet techniques using modified firefly algorithm gives better result than the existing systems.
3 Three Dimensional Discrete Wavelet Transform Decomposition
DWT is a multi-resolution technique that converts the signals in time domain which is in raw format to a most useful frequency format. 2-D DWT convert the time format of the signals in to frequency format only in the spatial direction. In DWT signal is passed through low pass and high pass filters which yields approximation and details of the input image. For multi-level decomposition the same procedure is repeated for the approximation detail of the previous level. But for interpreting signal with multiple spectral components like multi spectral images frequency components in a single spectrum is not efficient. For overcoming this difficulty 3 Dimensional DWT is proposed.
For multispectral imagery, 3-D DWT is carried out by extending the 1-D wavelet to the spectral (z) and spatial (x, y) domains of the image. The low pass and high pass filters applied along the x, y and z directions of the multispectral image i.e., 3-D DWT is implemented in each local cube along the spectral and spatial directions.
Fig. 2 shows the decomposition procedure for 3-D DWT. Initially the image I(x, y, z) is filtered along the x-direction, which results two slices L(x, y, z) and H(x, y, z). Then both L and H are filtered along the y-direction resulting in four sub sampled images LL(x, y, z), LH(x, y, z), HL(x, y, z) and HH(x, y, z). Finally, all this four sub sampled images are filtered along the z-direction resulting 8-sub samples LLL, LLH, LHL, LHH, HLL, HLH, HHL, HHH. Further for multilevel decomposition the approximation sub sample LLL is decomposed using the same procedure.

Figure 2: The decomposition tree of 3-D DWT, 2 denotes down sampling along row, column and cubes
Eq. (1) shows the mathematical representation of 3-D DWT decomposition process, where
In this paper, three windowing techniques are used for feature extraction, as shown in Fig. 3. 3D feature set is constructed by using some 3D filters and feature extraction techniques such as 3D-DWT, Median filter, Mean filter, Gaussian filter, Laplacian filter, Energy filter [12], Gabor filter and Multivariate Local Binary Pattern (MLBP) [13]. To reduce the computational complexity, the feature extraction technique is adopted to select the optimal features from the feature extraction method using the firefly algorithm. The fitness value is calculated for each individual to estimate the classification error rate. Classification accuracy is calculated for the features obtained through the feature extraction method using the supervised learning algorithm [14]. The resultant outcome is the classification of multispectral datasets.

Figure 3: Proposed system design for multi spectral classification
3.1 Window Selection and 3-D Feature Extraction
The classification procedure using textural measures depends largely on the selected window size. Three dimensional feature extraction and classification is proposed for multispectral image by defining local window around the central pixel. The 3-D features mentioned in Tab. 1 are extracted in each local window along x, y and z axes. The x and y directions denote the spatial coordinates of an image, and z is the spectral axis. Three window selection algorithms are proposed for 3-D DWT feature extraction, they are non-overlapping, overlapping and adaptive window selection.
3.1.1 Non-Overlapping Window [NW-3DFS]
Using non overlapping window selection, an input multispectral image is equally divided into several non-overlapping blocks each of size B*B. If the window size is too small, the result is insufficient spatial information. If the window is too large, different regions may be covered by this window. These two cases may lead to texture misclassification. The optimal window size 7 × 7 is chosen for classification [9]. 3-D DWT is performed in each block and the feature value of the cube is assigned to all the pixels in the block.
3.1.2 Overlapping Window [OW-3DFS]
In overlapping window selection there are four adjacent local cubes, i.e., W1, W2, W3, and W4, overlapping at the central block. The overlapping area is a common region of the four cubes, 3-D features are computed at each cube, features are extracted from it. Calculated feature value is assigned to overlapped area. The 3-D features are calculated by measuring the energy functions of the 3-D feature coefficients can help to distinguish different classes.
Energy function, E(W) is defined as
W is a B × B × N local cube with B and N as the dimensions in the spatial and spectral domains respectively. P (i, j, k) is the feature coefficient in the cube.
wn-Weight, weight is defined as the Euclidean distance between specific cube and overlapping area.
3.1.3 Adaptive Window [AW-3DFS]
Small windows do not contain sufficient spatial information, whereas large windows may complicate the problem and blur the boundary when they cover multiple objects or classes. An effective strategy for addressing the issue of window size is to use adaptive windows. Adaptive window means window size is not fixed. Based on frequency changes, window size will vary. Small and large windows are adapted, if the band variation in the image is high and low respectively. Fig. 4 shows the different kinds of blocks produced by adaptive window selection approach.

Figure 4: Different type of blocks created using adaptive window selection
In adaptive window selection, the whole multispectral image is first divided vertically into many regions. Each region consists of 4 columns and whole row. In a region, 7 × 7 window is applied and variance is calculated for the elements in the window. In the same region at the same place, 3 × 3 window is applied and variance is calculated for the elements in the window. Variances of both windows are compared. If the variance of 3 × 3 window selection is greater than or equal to variance of 7 × 7 window selection. Then there is high band variation, so 3 × 3 window is adapted there. Otherwise there is low band variation 7 × 7 window is adapted there. Likewise, the window selection is done vertically in all regions. There is some region which is not covered by both window selections, that region is right to the 3 × 3 window selection. That uncovered region is treated separately. 3-D DWT is performed in each block and the feature value of the cube is assigned to all the pixels in the block. If the whole multispectral image is not divided vertically into many regions, this may lead to some improper overlapping. The following describes the adaptive window process:
Input: Multi spectral Image (3 dimensional matrixes)
Output: 3 Sets of blocks
Calculate the global variance of entire image and local variance of 7*7 block
If (local variance > global variance)
Apply 3*3 window on the region, it belongs to set1
End
If (local variance < global variance)
Apply 7*7 window on the region, it belongs to set2
End
Split all unprocessed regions into m4*4 window, it belongs to set3
After applying adaptive window strategy, the input image will contain three set of different blocks.
Block 1 Consists of image blocks (3*3) with high variance, block 2 contains image blocks (7*7) with low variance and block3 is used to avoid improper overlapping consists of 4*4 size.
To create feature set, the combinations of 3D filters are used such as 3-DWT, Median Filter, Mean Filter, Energy Filter, Gaussian Filter, Laplacian Filter, Gabor Filter and Multivariate Local Binary Pattern. These features are stored in the feature library and are further used for texture classification. Optimal Feature Subset Selection Using proposed firefly algorithm. The term optimal feature subset selection is applied to the task of selecting those features that are more useful to a particular classification problem. The main purpose of optimum feature subset selection is to reduce the number of features used in classification.
c-number of bands, n-number of rows and columns, x (i, j, k) is the pixel value of ith row jth column in kth band
P (i, j, k) is the wavelet co-efficient of the ith row jth column in kth band pixel
Multivariate Binary Pattern,
Here value of s(x) is either 0 or 1. If s(x) = 1, Neighborhood value < central pixel else If s(x) = 0, Neighborhood value >= central pixel.
In Eq. (7). ‘i’ ranges from 0 to 7 (i.e.,) total number of pixels in 3 × 3 neighborhood corresponds to the center pixel, p corresponds to the total number of neighbors and gi (i = 0,…, P − 1) corresponds to the values of the neighbors. (R–Red band, G-Green band & B-blue band).
Apart from this feature extraction methods, 3-D Laplacian, 3-D Gabor and 3-D Gaussian filters are also used for extracting textural features using different orientations and filter parameters. The maximum number of feature set used in this work is 17. From this, optimal feature sets are selected using modified firefly algorithm.
3.3 Feature Selection Using Modified Firefly Algorithm
In remote sensing images redundant and irrelevant features might reduce the classification accuracy because of the large search space. The main aim of feature selection is to choose a subset of relevant features from a huge number of available features to obtain comparable or even better classification accuracy from using all features.
The firefly optimization algorithm is proposed for feature selection to select the optimal filter based on the maximum objective function. For initializing the population, the features are randomly generated for each firefly, where the number of feature element in the firefly is allowed to lie between 1 to 7. Each features element of the firefly represents the various filter values.
Firefly Algorithm (FA), a population-based algorithm, iteratively improvises solutions by moving toward the optimal solution. Here, all the populations move one step toward the fittest or objective solution as well as toward their personal best solutions. The outcome of this specific module is the optimal filter obtained through the firefly algorithm and the optimal filter is given as an input for support vector machine to classify the region of remote sensing images.
Each firefly’s position in the search space encodes the subset of features that it represents. Feature set is represented as binary strings where a value of 1 represents the inclusion of the corresponding feature into the subset while a value of 0 could represent its absence. For example, If firefly feature values are (1 0 1 0 0 0 0) this firefly use only the first and third filter such as Mean Filter and Laplacian Filter and using those filter values accuracy is calculated.
This process is repeated for each firefly in the population and accuracy is calculated for each firefly based upon the filter values. The important parameter of firefly algorithm is Intensity. All other fireflies in the population will update its intensity value based on the other fireflies maximum intensity value obtained through the objective function.
But the main drawback of the firefly algorithm is, it considers the accuracy but not the size of feature set while selecting the best firefly. The size of feature set is very important because the time complexity of the optimization algorithms like firefly algorithms plays vital role in the classification process. The algorithms that takes less time for optimization will reduces the overall classification time. Selecting features which have less number of feature sets with equal or closer accuracy will help to achieve this. Fig. 5 shows the flow of the modified firefly algorithm. The objective function used is classification accuracy, if more than one firefly has the equal or closer accuracy then firefly with minimum feature set is selected for further process. Stopping criteria used is finishing maximum number of iteration (in our work it is set as 50) or achieving expected classification accuracy. The algorithm for modified firefly algorithm is shown below:

Figure 5: Modified firefly algorithm process flow
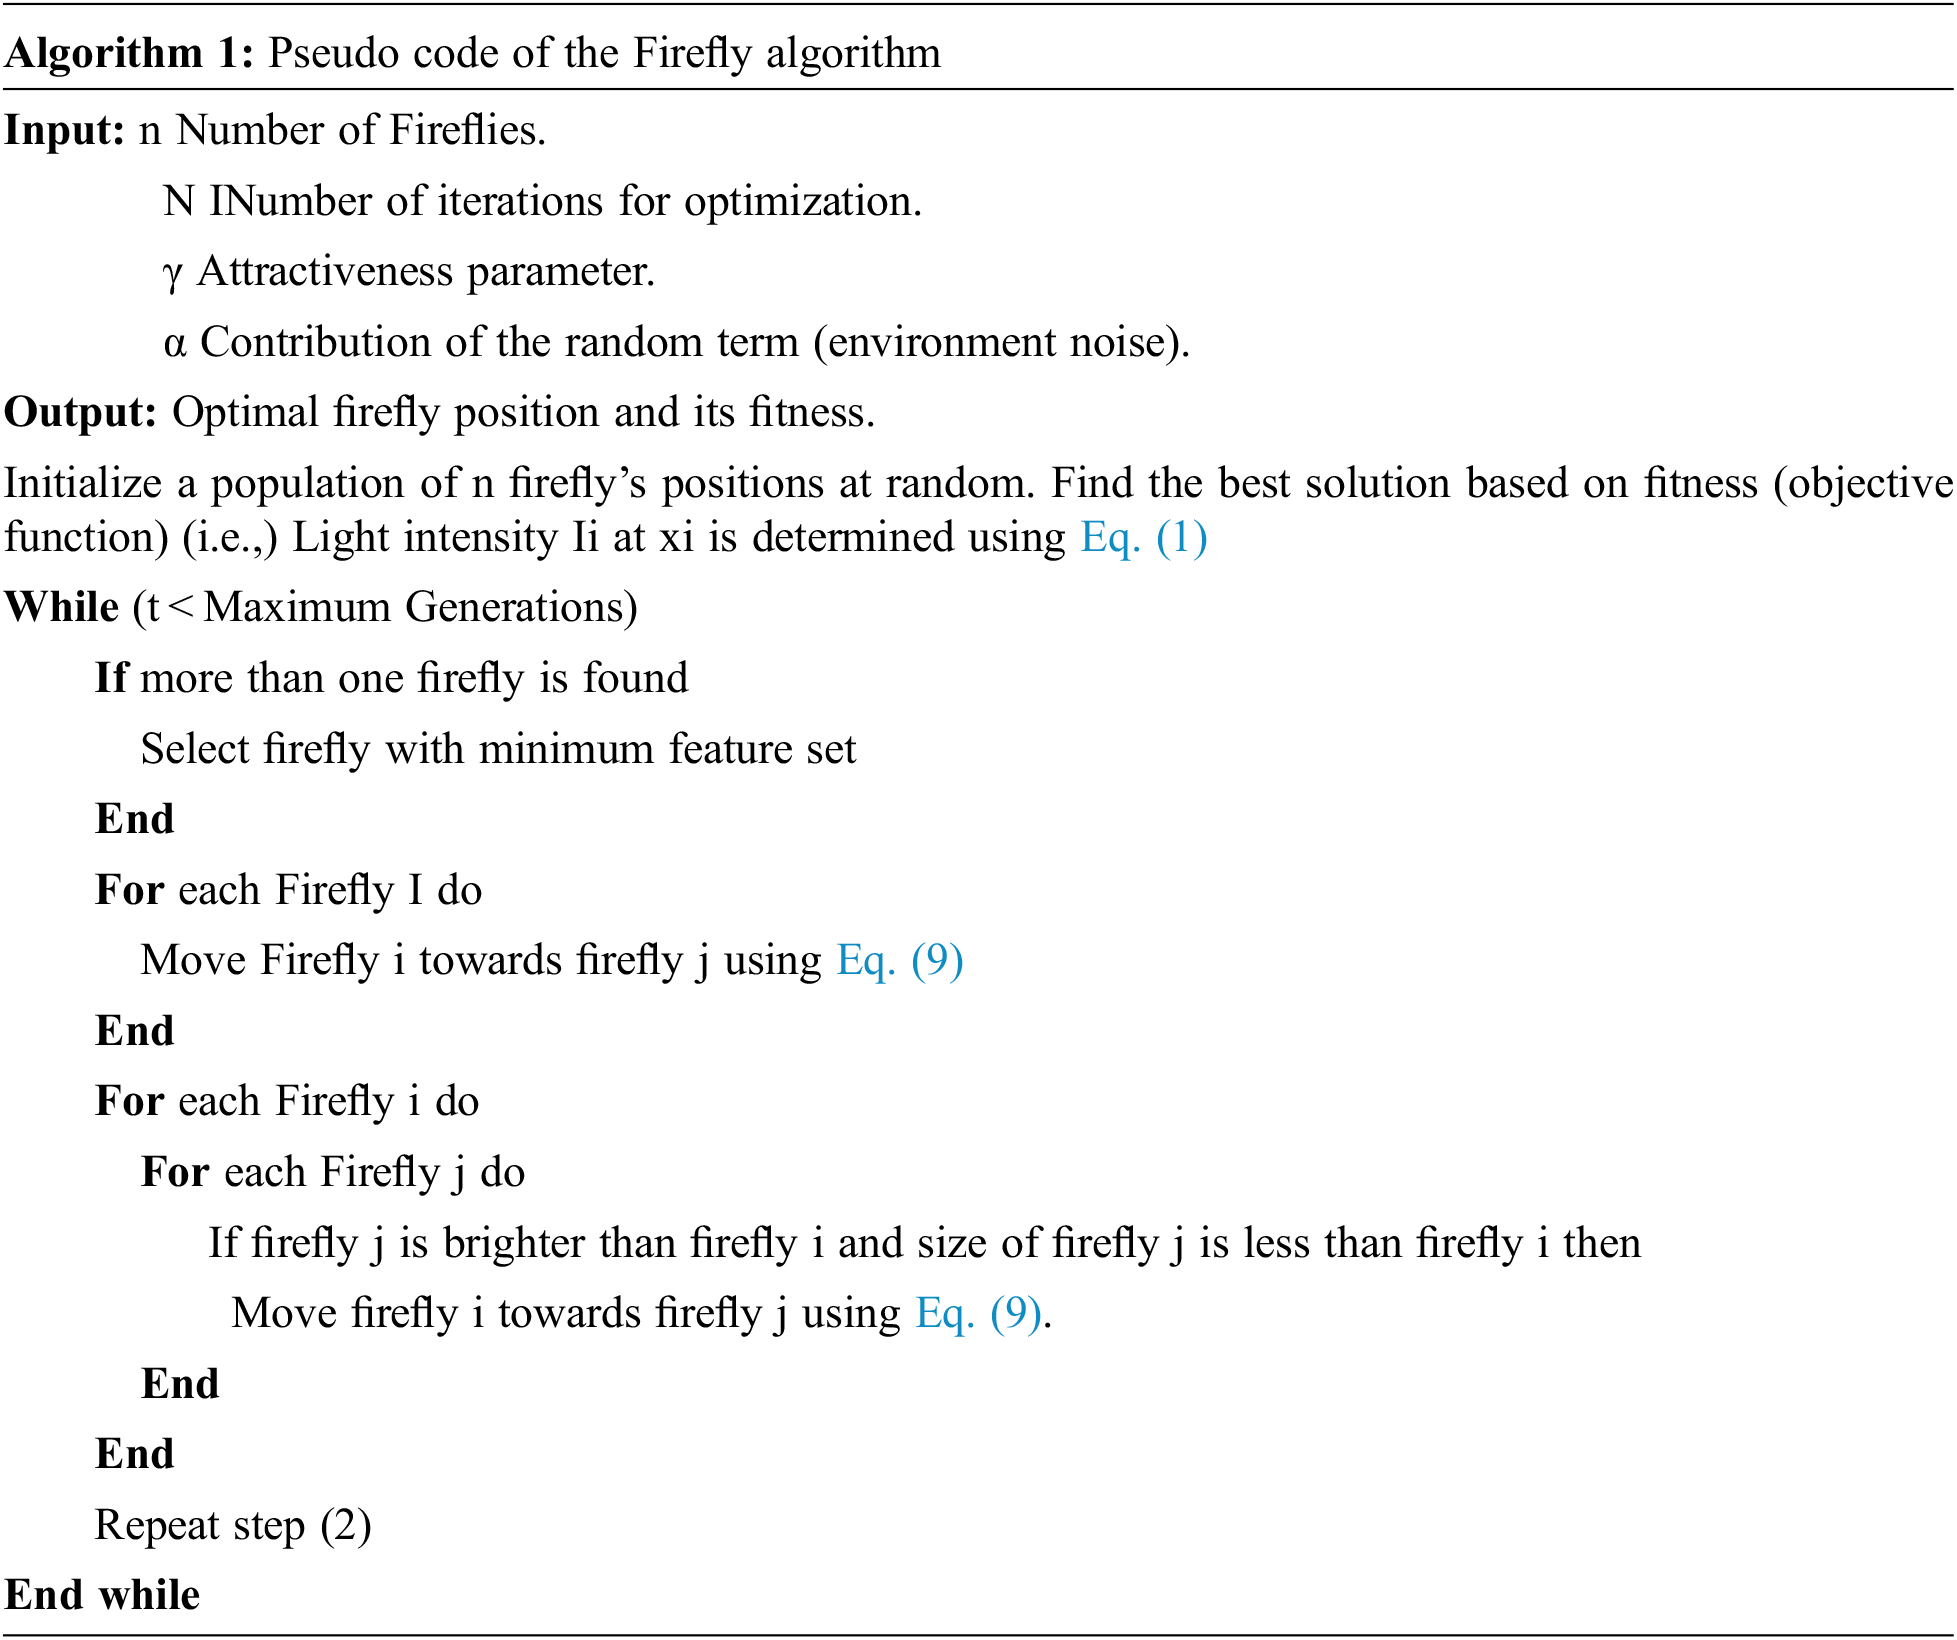
During the process of fly movement, I and β are updated repeatedly, and randomly distributed points are gradually moved toward the extreme points. After a certain number of iterations, the less desired points are eliminated, and the best positional points are finalized. The brightness or Intensity of a firefly varies with the value of an objective function, which can be defined as
where Io is the maximum Intensity, γ is light absorption coefficient, and r is the Euclidean distance between the ith and jth fireflies.
where xi and xj are the initial position of the ith and jth firefly, respectively, α is a constant within [0, 1], a rand is a random number within [0, 1] and rij is the distance between the ith and jth fireflies.
In our work we use SVM for classification purpose. There are many algorithms used for classification in machine learning but SVM is better than most of the other algorithms used as it have a better accuracy in results especially for image classification, Support Vector Machine Algorithm has a faster prediction along with better accuracy. It also shows clear margin between classes. It works better in high dimensional data spaces. That means it is effective in the cases where number of test samples is larger compared to training samples. Memory of SVM is also better compared to other machine learning classification algorithms like Naive Bayes, K-Nearest Neighbors etc.
The classifier used in the objective function is the well-known Support Vector Machine. The used fitness function incorporates both classification accuracy and feature selection size. SVM classifier is used which is provided by LIBSVM to perform classification. LIBSVM classification is used for multiclass classification. The Linear support vector kernel function is used. The classification method used here is fivefold cross validation. The whole feature set is divided into five equal parts. 1 part is used for testing. The remaining four parts are used for training. The testing and training set will change until the fold gets completed. In each set, predicted labels and accuracy is obtained as resultant output. The specific options which are used are mentioned in the table and all other options are set as default. Classification accuracy is calculated from average accuracy that is obtained through fivefold cross validation method using linear support vector machine.
The entire image pixels are first split into 5 equal groups. The first four pixel groups are used as training pixels. The feature values of these pixels and their respective class labels are given as input to the SVM training process to learn the classification model. Then the remaining testing pixel feature values are mapped to a class label using the model learned from the training process. The testing and training groups are changed until five folds are completed.
Experiments are conducted on LISS-IV multispectral image of Madurai. First the 3D-feature set is constructed by applying the 3D filters mentioned in Tab. 1. For comparison purpose all the three windowing techniques are implemented. For overlapping and non-overlapping the optimal window size 7*7 is used. Firefly algorithm parameters has been initialized as follows: number of iteration (t) is 50, step size (α) is 0.5, light absorbance is (γ) is 1 and number of fireflies (m) is 10. Each experiment is repeated for 10 times and the highest overall accuracy is recorded. Fig. 6 shows the classification maps obtained by different models.
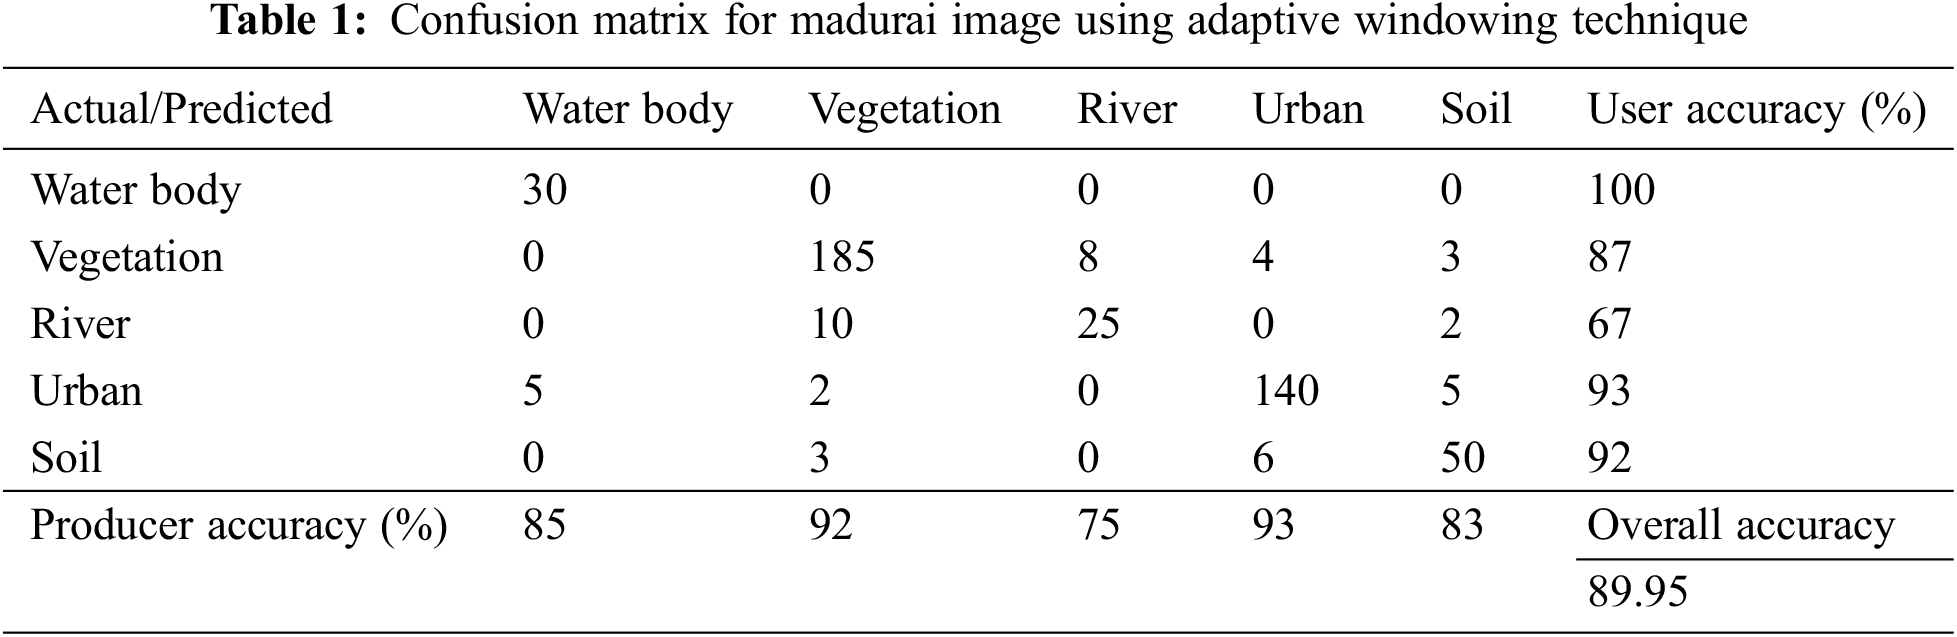

Figure 6: Classification maps: using 3-D DWT and 3-D Filters (a) Non-overlapping approach (b) Overlapping approach (c) Adaptive approach (d) Pixel wise approach
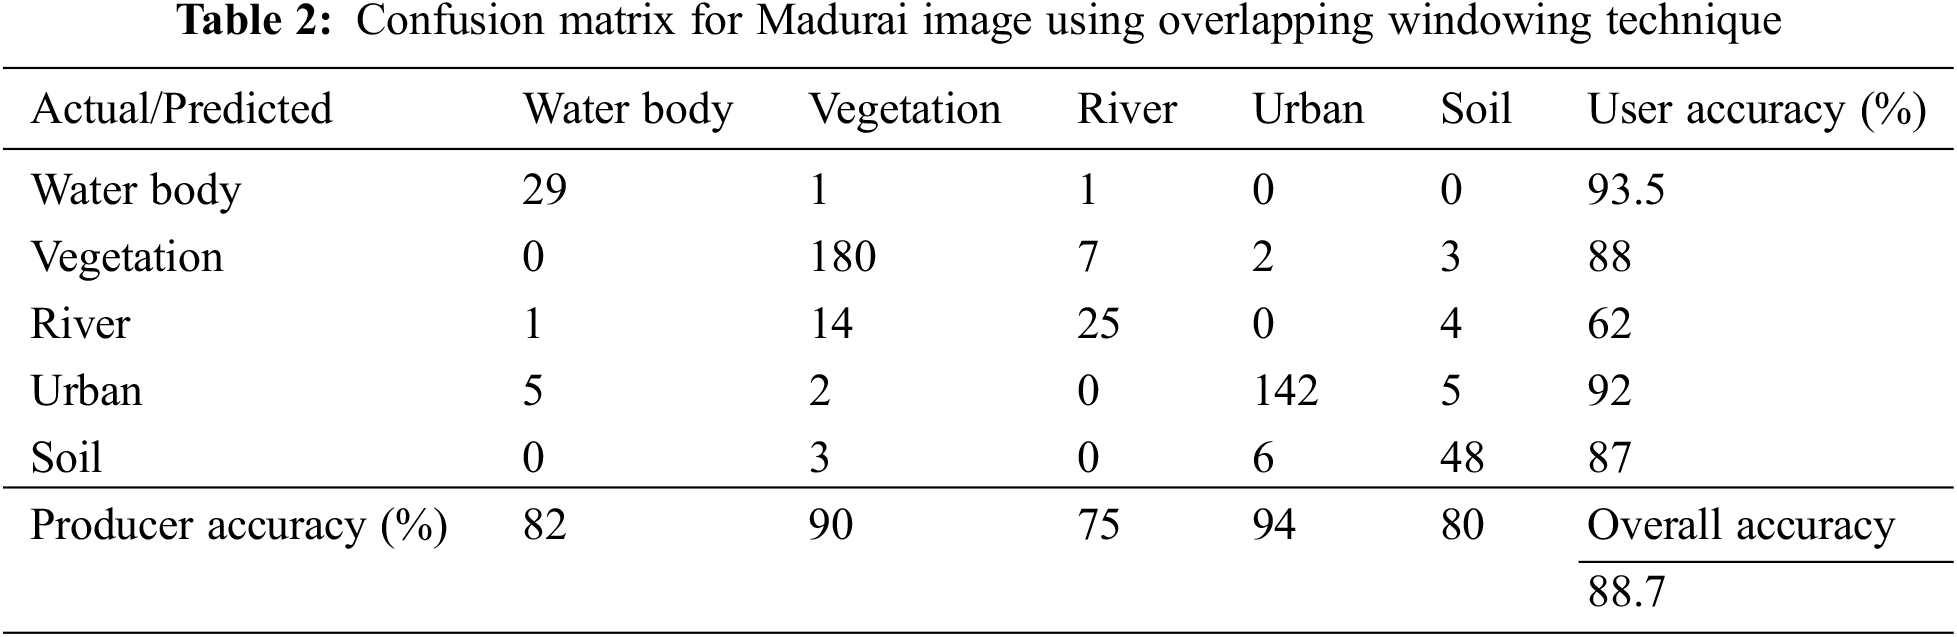
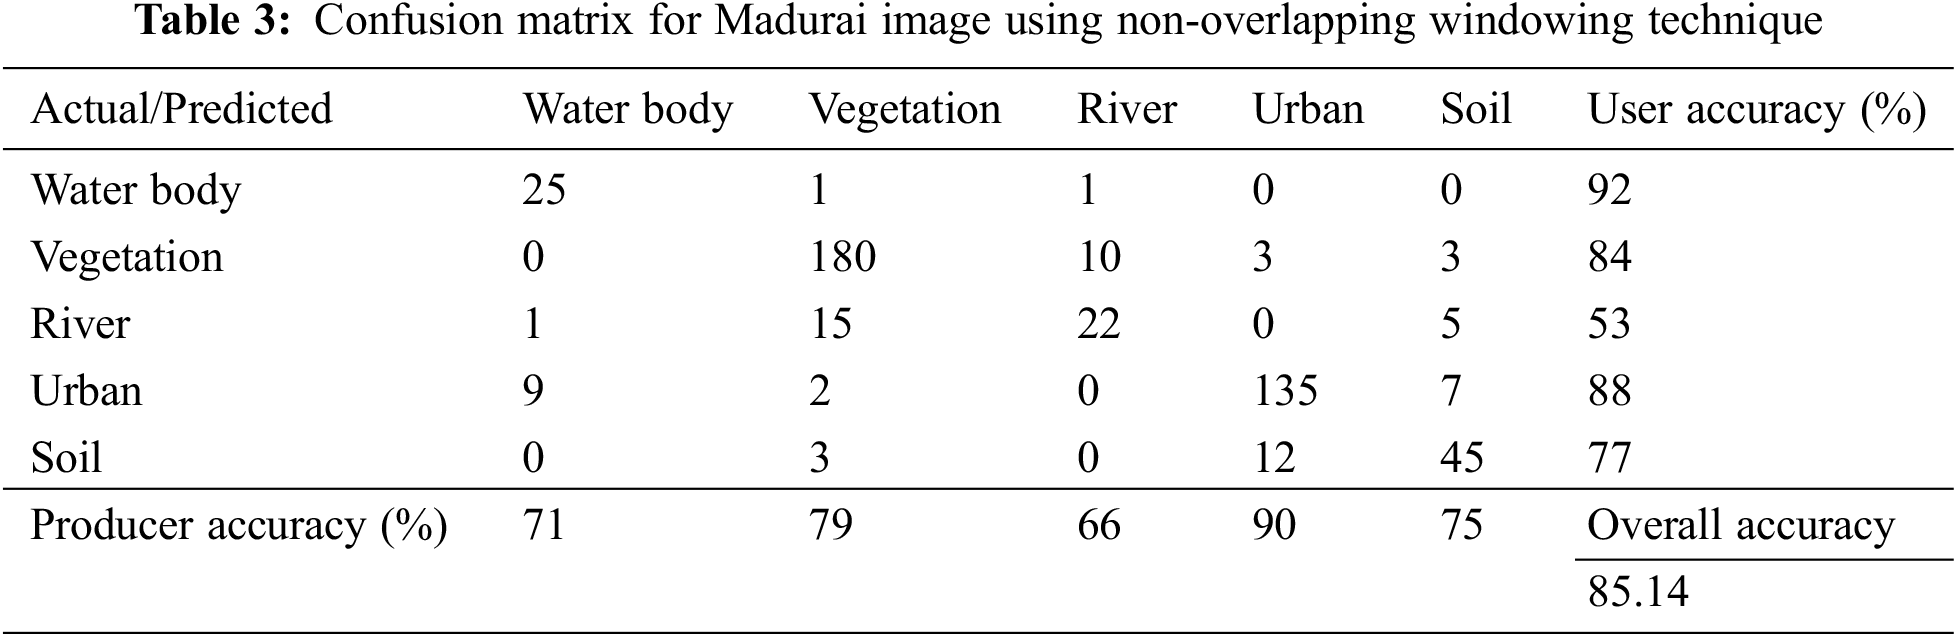
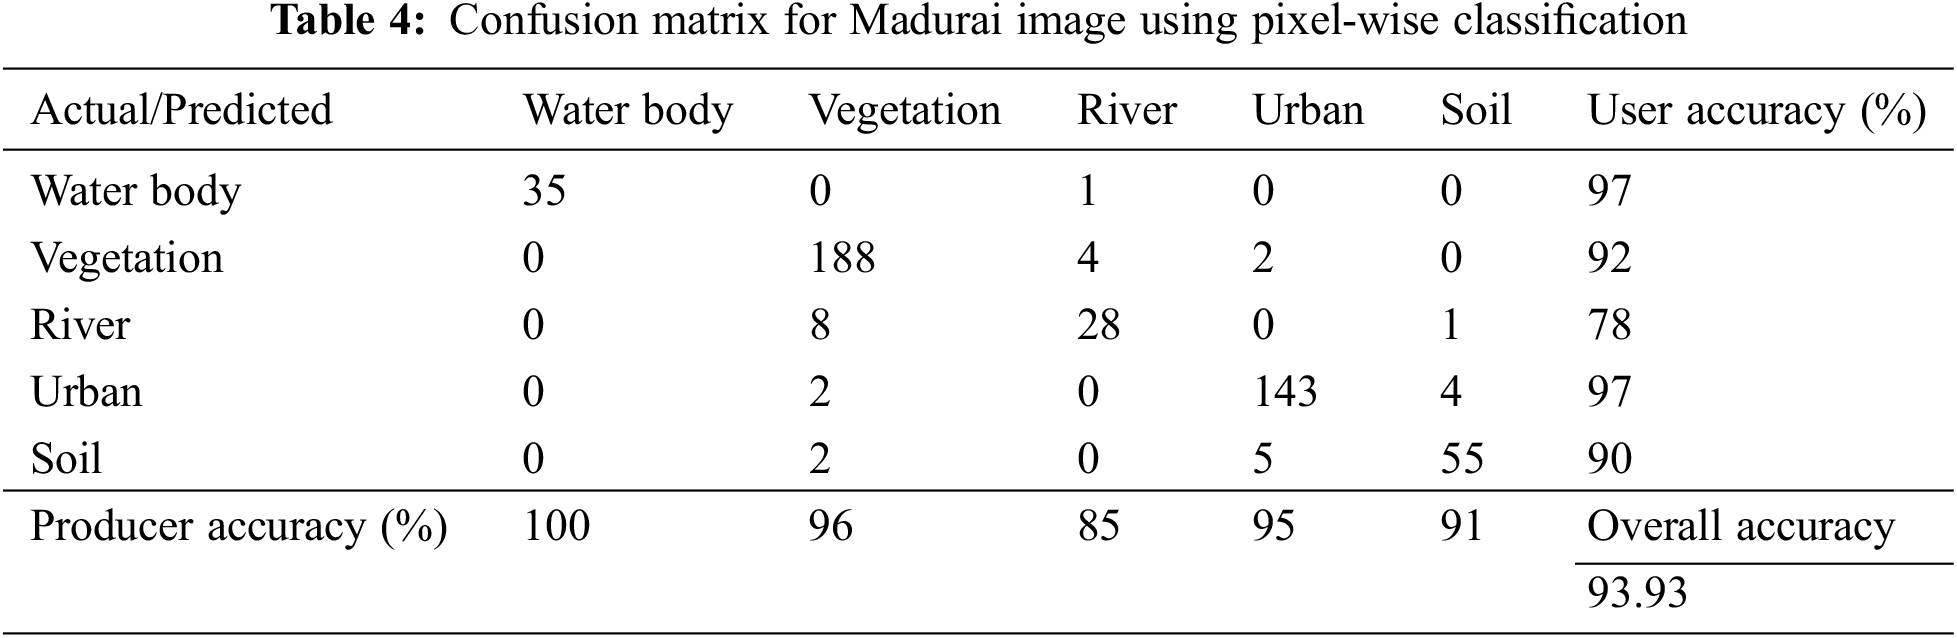
Analysis of confusion matrix is the one of the most important measure of classification performance. In this work, we have compared the known reference data (collected from field work) and the result from the automated classification algorithm for different windowing approaches to construct the confusion matrix. Various accuracy measures like precision and overall accuracy have been calculated for measuring the performance of various approaches. Accuracy of the algorithm is the ratio between the correctly classified pixel and the total number of known pixels belongs to the particular class.
The main objective of this work is minimize the initial data size of 17*400*400 (17-number of feature sets used, 400*400 is the size of the image) without compromise the classification accuracy. 2000 samples from image data set is used for training purpose and for training 450 samples are chosen comprising 35, 200, 35, 150 and 60 pixels for water body, vegetation, river, urban and soil class respectively. Table to Table shows the confusion matrix with the performance measures for various windowing approaches.
In our proposed system we used NW-3DFS, OW-3DFS and AW-3DFS. But pixel-Based classification is commonly used technique which gives better result but more time consuming one. To show our proposed approach gives results very closer to Pixel-Based approach with reduced time we compare our proposed technique with this method. In Fig. 7 we proved it with set of various Feature set. Producer accuracy is fraction of correctly classified pixels with regards to all pixels belongs to the class. User accuracy is fraction of correctly classified pixels with regards to all pixels classified as this class. Overall accuracy is calculated as overall correctly classified pixels (diagonal elements) divided by total number of test pixels.

Figure 7: Time taken by adaptive window and pixel based classification
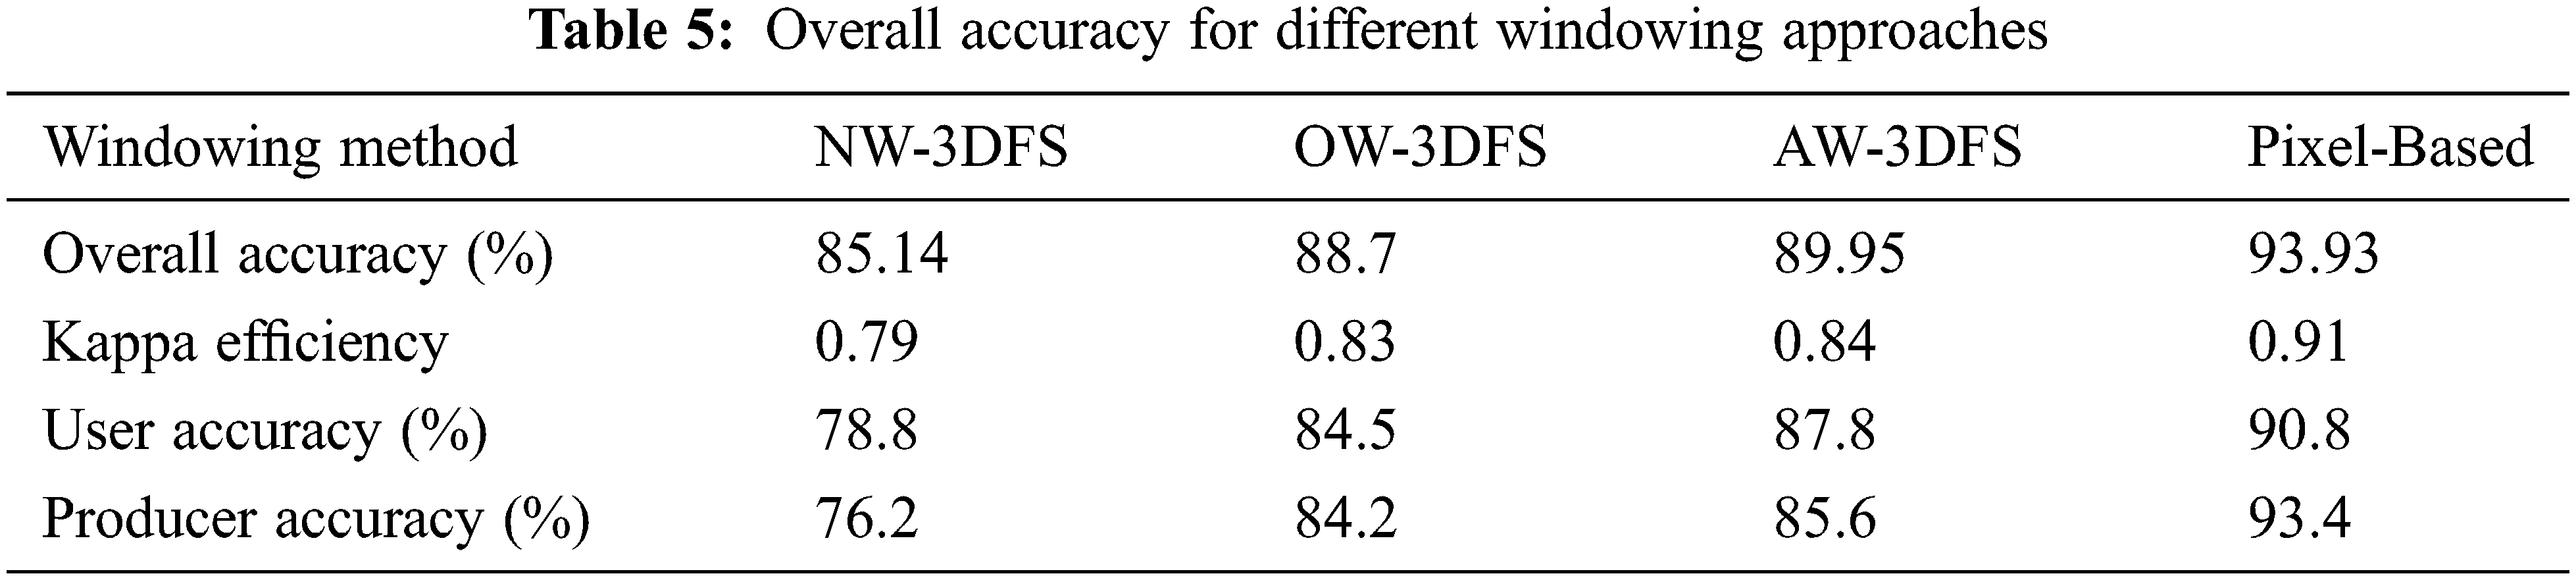
From the Tabs. 2–5 it is evident that pixel based and adaptive window approach yields better classification accuracy for all the five classes. Non-overlapping approach yield better performance for urban class (94%) than adaptive window approach. The Fig. 7 shows the comparison of pixel based, adaptive window approach with respect to the computational cost (overall time for classification) with the different size of feature set.
From the Fig. 7, it is evident that adaptive window approach gives classification accuracy closer to pixel based classification with less computational cost. In average it reduces the computational cost by half. Since the data set which we use contains non-uniform textures, pixel wise classification may give high classification accuracy, but the time complexity is also high. From our result it is evident that the same accuracy can be obtained with less time complexity using adaptive windowing technique.
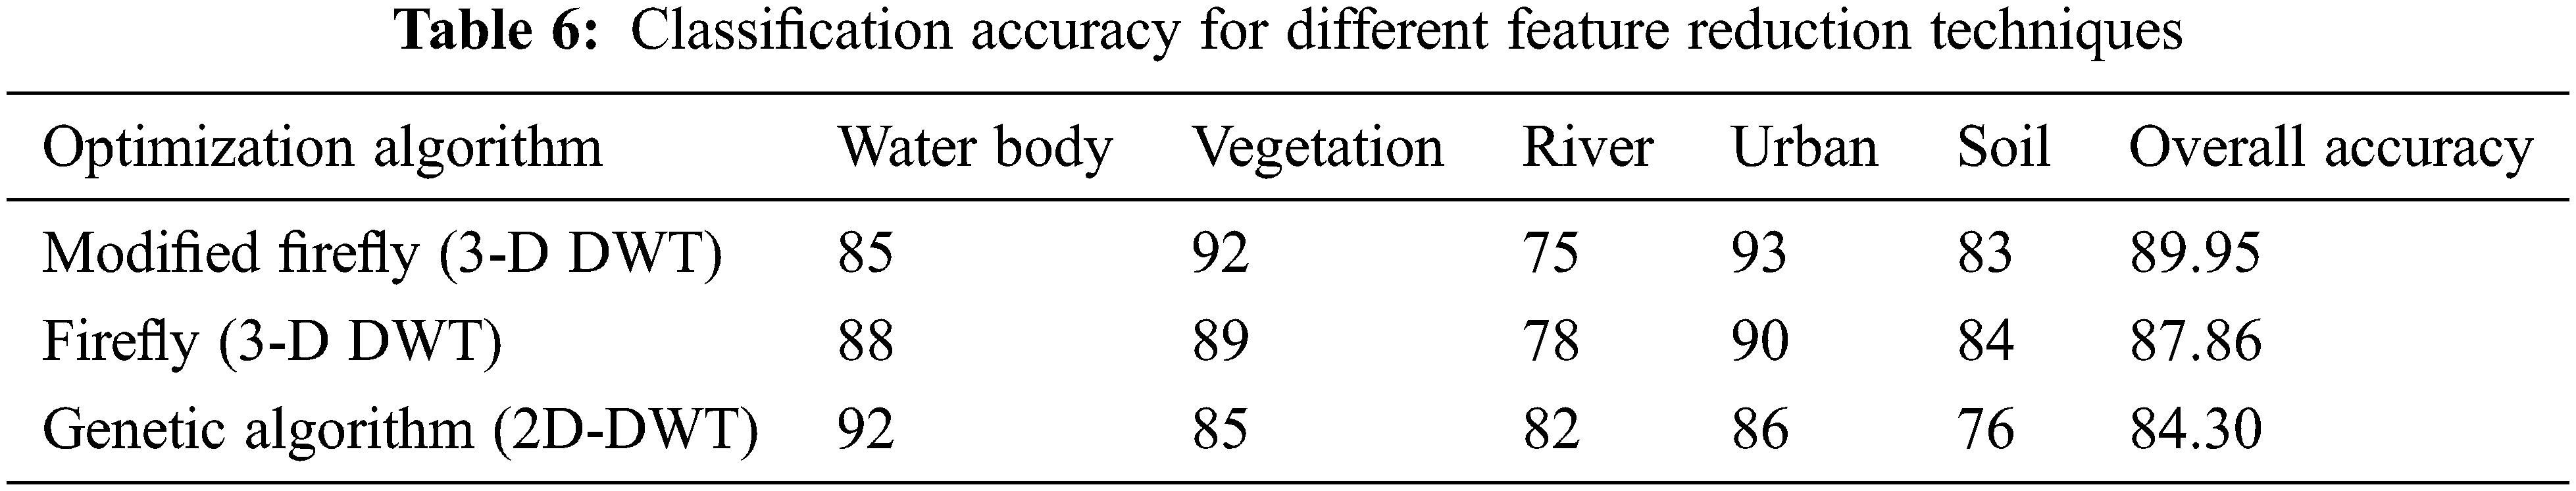
In this experiment, we also compare the performance of the firefly algorithm with other optimization algorithm used for feature reduction. We have conducted experiments for Genetic algorithm and general firefly algorithm (without considering size of feature set for objective function) using adaptive windowing technique.
Tab. 6 shows the accuracy obtained from various feature reduction algorithms. Our proposed modified algorithm achieves 89.95% using 3 feature sets, firefly algorithm achieves 87.86 using 7 feature sets, and genetic algorithm achieves 84.3% using 17 feature sets without 3-D DWT [15]. Results from Tab. 6 and Fig. 7, we can conclude that the 3-D DWT which decompose the time domain information into frequency domain information in all three dimensions, and modified firefly algorithm which consider the size of feature set for selecting best firefly can outperform conventional classification methods which uses 2-D DWT for decomposition and population based feature reduction techniques which doesn’t give importance to the size of feature set for creating next generation population in terms of classification accuracy and computational cost.
In existing systems the brightness of the firefly alone is used as objective function for selecting the feature set. But in our proposed system we improved the firefly algorithm by including the size of the feature set of firefly along with its brightness.
In this paper, the modified Firefly algorithm is proposed for solving region type classification problems based on multispectral satellite imagery. We used various parameters such as Overall accuracy, Kappa Efficiency, User Efficiency and Producer Efficiency for comparing our results with existing systems. We also used time complexity as one of the parameter to show how our proposed system gives better results compared to existing systems with lesser time complexity. From Tabs. 1–6, it is evident that our proposed method yields better results than existing systems with respect to all parameters used for comparison. As feature extraction can be seen as an optimization Problem, we have proposed a modified firefly-inspired algorithm for this task. The performance of the proposed approach is compared with two other techniques, namely GA, and conventional firefly. By using Firefly algorithm approach it has been proved that classification accuracy is improved and it is domain adaptive for feature extraction. From the result shows in Tabs. 1–5, it is demonstrated that the proposed system is more concise than other methods and provides better optimization results for classification. The hired fitness function targets classification accuracy as a main parameter and provides good results. The classification efficiency illustrated the performance of the classifiers for each class individually. Hence, from the results obtained, we conclude that modified firefly algorithm can be successfully applied for multi spectral feature selection. Moreover, we have also presented a novel 3 dimensional framework using 3-D discrete wavelet transform and 3-D feature sets and filters for the classification of multispectral images. With this, three feature extraction techniques are investigated and from the result obtained it is concluded that AW-3DFS method produces optimal results in terms of both visual inspection and quantitative measurement.
6 Limitations and Feature Enhancement
In our experiment, we used multispectral image captured by LISS-IV satellite in Madurai city. In general, multispectral images have only three bands (RED, GREE and BLUE) with very limited information for all classes. Though our experiment gives better results still it can be improved if we use hyper-spectral images. Hyper-spectral images have very large number of bands with high information for all classes compared to multispectral images [16–18]. In future, our methodology can be applied for hyper-spectral image band selection and classification.
Funding Statement: The authors received no specific funding for this study.
Conflicts of Interest: The authors declare that they have no conflicts of interest to report regarding the present study.
1. X. Guo, X. Huang and L. Zhang, “Three-dimensional wavelet texture feature extraction and classification for multi/hyperspectral imagery,” IEEE Geoscience and Remote Sensing Letters, vol. 11, no. 12, pp. 2183–2187, 2014. [Google Scholar]
2. S. Rajesh, S. Arivazhagan, K. P. Moses and R. Abisekaraj, “Land cover/land use mapping using different wavelet packet transforms for liss iv madurai imagery,” Journal of the Indian Society of the Remote Sensing, vol. 40, no. 2, pp. 313–324, Jun. 2012. [Google Scholar]
3. X. Guo, X. Huang and L. Zhang, “Three-dimensional wavelet texture feature extraction and classification for multi/hyperspectral imagery,” IEEE Geoscience and Remote Sensing Letters, vol. 11, no. 12, pp. 2183–2187, 2014. [Google Scholar]
4. K. Murugavallli, M. Rajakani and S. Rajesh, “Domain adaptive feature learning for action recognition using genetic programming,” Middle East Journal of Scientific Research, vol. S2, pp. 103–108, 2016. [Google Scholar]
5. S. G. Mallat, “A theory for multi resolution signal decomposition: The wavelet representation,” IEEE Transaction on Pattern Analysis and Machine Intelligence, vol. 11, no. 7, pp. 674–693, 1989. [Google Scholar]
6. H. Su, Y. Cai and Q. Du, “Firefly-algorithm-inspired framework with band selection and extreme learning machine for hyperspectral image classification,” IEEE Journal of Selected Topics in Applied Earth Observations and Remote Sensing, vol. 10, no. 1, pp. 309–320, Jan. 2017. [Google Scholar]
7. F. Tsai and J. S. Lai, “Feature extraction of hyper spectral image cubes using three dimensional gray level co-occurrence,” IEEE Transaction on Geoscience Remote Sensing, vol. 51, no. 6, pp. 3504–3513, Jun. 2013. [Google Scholar]
8. J. A. Benediktsson, J. A. Palmason and J. R. Sveinsson, “Classification of hyperspectral data from urban areas based on extended morphological profiles,” IEEE Geoscience and Remote Sensing Letters, vol. 43, no. 3, pp. 480–491, 2005. [Google Scholar]
9. H. Yang, Q. Du and G. Chen, “Particle swarm optimization-based hyperspectral dimensionality reduction for urban land cover classification,” IEEE Journal of Selected Topics in Applied Earth Observations and Remote Sensing, vol. 5, no. 2, pp. 544–554, Apr. 2012. [Google Scholar]
10. S. Arora and S. Singh, “The firefly optimization algorithm: Convergence analysis and parameter selection,” International Journal of Computer Applications, vol. 69, no. 3, pp. 48–52, May 2013. [Google Scholar]
11. B. Bhushan and S. S. Pillai, “Particle swarm optimization and firefly algorithm: Performance analysis,” in 2013 3rd IEEE Int. Advance Computing Conf. (IACC), Ghaziabad, pp. 746–751, 2013. [Google Scholar]
12. S. Padma and S. Sanjeevi, “Jeffries matusita-spectral angle mapper (JM-SAM) spectral matching for species level mapping at bhitarkanika, muthupet and pichavaram mangroves,” The International Archives of the Photogrammetry, Remote Sensing and Spatial Information Sciences, vol. XL–8, pp. 1403–1411, 2014. [Google Scholar]
13. S. Ding and L. Chen, “Classification of hyperspectral remote sensing images with support vector machines and particle swarm optimization,” in 2009 Int. Conf. on Information Engineering and Computer Science, Wuhan, China, pp. 1–5, 2009. [Google Scholar]
14. A. Suruliandi and S. Jenicka, “Texture-based classification of remotely sensed images,” International Journal of Signal and Imaging Systems Engineering, vol. 8, no. 4, pp. 260–272, 2015. [Google Scholar]
15. S. Rajesh, S. Arivazhagan, K. P. Moses and R. Abisekaraj, “Genetic algorithm based feature subset selection for land cover/land use mapping using wavelet packet transform,” Journal of the Indian Society of the Remote Sensing, vol. 41, no. 2, pp. 238–247, 2013. [Google Scholar]
16. H. Su, B. Yong and Q. Du, “Hyperspectral band selection using improved firefly algorithm,” IEEE Geoscience and Remote Sensing Letters, vol. 13, no. 1, pp. 68–72, 2016. [Google Scholar]
17. R. Y. M. Nakamura, L. M. G. Fonseca, J. A. dos Santos, R. da S. Torres, X. S. Yang et al., “Nature-inspired framework for hyperspectral band selection,” IEEE Transactions on Geoscience and Remote Sensing, vol. 52, no. 4, pp. 2126–2137, Apr. 2014. [Google Scholar]
18. H. Yang, Q. Du, H. Su and Y. Sheng, “An efficient method for supervised hyperspectral band selection,” IEEE Geoscience and Remote Sensing Letters, vol. 8, no. 1, pp. 138–142, 2011. [Google Scholar]
 | This work is licensed under a Creative Commons Attribution 4.0 International License, which permits unrestricted use, distribution, and reproduction in any medium, provided the original work is properly cited. |